Article

Effects of Cu, Zn Doping on the Structural, Electronic, and Optical Properties of α-Ga2O3: First-Principles Calculations

1
College of Science, Hunan University of Science and Engineering, Yongzhou 425199, China
2
Fujian Provincial Key Laboratory of Semiconductors and Applications, Collaborative Innovation Center for Optoelectronic Semiconductors and Efficient Devices, Department of Physics, Xiamen University, Xiamen 361005, China
3
College of Science, Jimei University, Xiamen 361021, China
*
Authors to whom correspondence should be addressed.
Materials 2023, 16(15), 5317; https://doi.org/10.3390/ma16155317
Submission received: 6 July 2023 / Revised: 18 July 2023 / Accepted: 21 July 2023 / Published: 28 July 2023

Abstract

:
The intrinsic n-type conduction in Gallium oxides (Ga2O3) seriously hinders its potential optoelectronic applications. Pursuing p-type conductivity is of longstanding research interest for Ga2O3, where the Cu- and Zn-dopants serve as promising candidates in monoclinic β-Ga2O3. However, the theoretical band structure calculations of Cu- and Zn-doped in the allotrope α-Ga2O3 phase are rare, which is of focus in the present study based on first-principles density functional theory calculations with the Perdew–Burke–Ernzerhof functional under the generalized gradient approximation. Our results unfold the predominant Cu1+ and Zn2+ oxidation states as well as the type and locations of impurity bands that promote the p-type conductivity therein. Furthermore, the optical calculations of absorption coefficients demonstrate that foreign Cu and Zn dopants induce the migration of ultraviolet light to the visible–infrared region, which can be associated with the induced impurity 3d orbitals of Cu- and Zn-doped α-Ga2O3 near the Fermi level observed from electronic structure. Our work may provide theoretical guidance for designing p-type conductivity and innovative α-Ga2O3-based optoelectronic devices.

1. Introduction

Gallium oxides (Ga2O3) have attracted much attention for use in various applications such as solar-blind ultraviolet photodetectors [1,2], high-power transistors [3,4], Schottky diodes [5,6], as well as photocatalysts [7] due to its outstanding physical and chemical properties. Ga2O3 typically exhibits five different crystal phases, and the β phase is the most stable and intensively explored one [8,9]. However, other crystalline phases have been relatively sparsely studied; among them, α-Ga2O3 is the second stable phase. The metastable α-Ga2O3 phase is endowed with a corundum structure and belongs to the rhombohedral phase (R-3ch). Compared with β-Ga2O3, α-Ga2O3 possesses a wider bandgap (5.3 eV) [10], larger Baliga figure of merit (~3844) [11], and higher breakdown electrical field (8–10 MVcm−1) [12]. In recent years, α-Ga2O3 films and various heterojunctions have been successfully synthesized via different experimental devices, such as laser molecular beam epitaxy [13,14], chemical vapor deposition [15,16], halide vapor phase epitaxy [17], as well as various heterojunctions, such as on Al2O3 [18,19], ZnO [20], etc.
Likewise β-Ga2O3, perfect α-Ga2O3 shows n-type conductivity characteristics due to the inevitable introduction of native defects and impurities in the experiment, which seriously hinders its applications [21,22]. In order to construct p-n junctions for further applications of α-Ga2O3, it is imperative to develop and explore p-type conductivity. In general, doping technology can be an effective method to improve the conductivity, especially for a wide bandgap semiconductor [23,24,25,26,27,28,29,30]. Among different doping candidates, Cu and Zn are widely studied in β-Ga2O3 due to the p-type conductivity therein. Cu-doped β-Ga2O3 was found to be a promising p-type semiconductor due to the introduction of two acceptor impurity levels towards the top of the valence band researched via first-principles calculated methods [31]. Further electron paramagnetic resonance spectroscopy analyses denoted that Cu2+ preferentially sited on the octahedral coordination Ga site in the Ga2O3 lattice [32]. Li et al. illustrated that Zn-doped β-Ga2O3 generated a shallow energy state near the valence band maximum, which made a typical p-type Zn-doped β-Ga2O3 material [33]. The p-type conductivity was observed in β-Ga2O3 nanowires containing various amounts of Zn doping contents using the CVD method [34] and in Zn-doped β-Ga2O3 film fabricated using the pulsed laser deposition method [35]. In addition, about 1.0 μB magnetic moment was gained in the Zn-doped β-Ga2O3 supercell, which mainly originated from the O 2p orbitals near the doped Zn atom [36].
However, no further theoretical reports are available for Cu-/Zn-doped α-Ga2O3, to the best of our knowledge. Thus, systematic research studies on the electronic properties of Cu-/Zn-doped α-Ga2O3 are highly demanded. Research interests in the doping-dependent optical properties of α-Ga2O3 have been addressed recently. The systematic studies of 3d–5d transition metal doped α-Ga2O3 suggested that the induction of IB and IIB transition metal dopants can be endowed with low formation energies and could result in the optical absorption migration from deep ultraviolet to infrared [12]. Pan et al. denoted that added Cu, Ag, and Au elements in α-Ga2O3 led to the transformation from the ultraviolet to the visible light region [37].
Inspired by the doping-induced p-type conductivity in β-Ga2O3, two promising p-type dopants of Cu and Zn elements are studied. We performed first-principles calculations to investigate the structural, electronic, and optical properties of Cu- and Zn-doped α-Ga2O3. The detailed distributions of electron density, the defect formation energies and charge transitional levels under different crystal growth conditions, the electronic structure, as well as the optical properties are researched. This study is useful for understanding the utilization of Cu- and Zn-doped α-Ga2O3. We hope our work can provide theoretical guidance for designing α-Ga2O3-based functional materials as well as the promising applications of α-Ga2O3 for innovative optoelectronic devices.

2. Calculation Methods

2.1. Computational Details

In this work, our first-principles calculations adopt the Vienna ab initio Simulation Package (VASP) [38,39] using DFT [40] containing projected augmented wave (PAW) potentials. The generalized gradient approximation (GGA) parameterized by Perdew–Burke–Ernzerhof (PBE) [41] is employed to describe the interactions of exchange-correlation. The kinetic energy cutoff is set as 450 eV, the energy convergence criterion for the calculations is set to 1 × 10⁻⁵ eV/atom, and all the atomic locations have been fully tuned. When all residual forces are less than 0.01 eV/Å, the relaxation will be terminated. The valence electronic configurations of Ga, O, Cu, and Zn atoms are [Ar] 3d104s24p1, [He] 2s22p4, [Ar] 3d104s1, and [Ar] 3d104s2, respectively.
In this study, a 2 × 2 × 1 α-Ga2O3 supercell is modeled containing 48 Ga atoms and 72 O atoms, in which one Cu or Zn impurity replaces the Ga position with an equivalent doping concentration of 2.08 %, as shown in Figure 1. A 4 × 4× 2 Monkhost-Pack grid is used for the structural relaxation, while a 9 × 9 × 4 Monkhost-Pack grid is employed for the calculations of the density of states (DOS) and optical properties. The tetrahedron method is adopted to give a good account of the DOS calculations.

2.2. Formation Energy, Transitional Level, and Optical Calculations

For defect D doping in α-Ga2O3, the formation energy in the charge state q is determined as [21,42]
H D , q ( E f , μ ) = [ E D , q E p ] + i n i μ i + q ( E V B M + E f ) + E c o r r
where E D , q and E p represent the total energy of the defect and perfect supercell, respectively. n i denotes the number of i atoms added ( n i < 0 ) or removed ( n i > 0 ) from the perfect supercell, and μ i is the corresponding chemical potential of the impurity or host atom. E V B M is the energy of valence band maximum (VBM). E f is the Fermi level, which is referenced to the VBM in the bulk. The value of E f is set to zero at VBM and can range from 0 to the energy value of conduction band minimum (CBM). E c o r r is associated with finite-size corrections, is determined by the potential alignment, and is given as [42]
E c o r r = q ( V D , q r V p r )
Here, the potential difference between the charged defect Ga2O3 supercell ( V D , q r ) and perfect Ga2O3 supercell ( V p r ) are calculated from the atomic sphere-averaged electrostatic potentials at the atomic sites farther away from the defect, which is calculated via the software of VASPKIT Standard Edition 1.3.5 [43].
Note that the chemical potential satisfies the boundary conditions as follows:
2 μ G a + 3 μ O = μ G a 2 O 3 , μ G a μ G a M e t a l , μ O 1 2 μ O 2
In terms of the different synthesis conditions for gallium oxide, it can be divided into two categories, Ga-rich and O-rich, for the calculations of chemical potential. Under O-rich growth condition,
μ O = 1 2 μ O 2 , μ Ga = 1 2 ( μ G a 2 O 3 3 2 μ O 2 )
Under Ga-rich growth condition,
μ G a = μ G a M e t a l , μ O = 1 3 ( μ G a 2 O 3 2 μ G a )
where μ G a 2 O 3 is the chemical potential of bulk β-Ga2O3. The chemical potential of μ G a M e t a l , μ Cu and μ Zn are calculated from the energies of the most stable bulk crystal of the Ga, Cu, and Zn atoms, respectively, while μ O is gained from the energy of O2. The chemical potentials of μ O , μ G a M e t a l , μ Cu , and μ Zn are −4.92 eV, −7.48 eV, −3.72 eV, and −1.11 eV, respectively, under O-rich condition, while the values are −7.96 eV, −2.90 eV, −3.72 eV, and −1.11 eV, respectively, for Ga-rich (oxygen-deficient) environment.
The transition energy ε ( q 1 / q 2 ) between charge state q1 and q2 for defect D doping configuration is calculated as [44]
ε ( q 1 / q 2 ) = E D q 1 | E f = 0 E D q 2 | E f = 0 q 2 q 1
where E D q | E f = 0 represents the formation energy of the defect D in charge state q evaluated at E f = 0 . The ε ( q 1 / q 2 ) denotes the Ef position where the charge state q1 and q2 have equal formation energy.
The absorption coefficients in optical properties are described as follows [45,46]:
α ( ω ) = 2 ω ε 1 2 ( ω ) + ε 2 2 ( ω ) ε 1 ( ω ) 1 / 2
where ε 1 ( ω ) and ε 2 ( ω ) indicate the real and imaginary part of the dielectric function, respectively. The ε 2 ( ω ) can be obtained using the following equation:
ε 2 ( ω ) = 4 π 2 e 2 m ω 2 i , j i M j 2 f i ( 1 f i ) × δ ( E j k E i k ω ) d 3 k
Here, m , M , e , and ω denote the mass of free electrons, the dipole matrix, the electron charge, and the frequency of incident photons, respectively. i , j , f i , and k represent the initial state, final state, Fermi distribution function, and wave function vector, respectively, while the ε 1 ( ω ) is calculated by the equation
ε 1 ( ω ) = 1 + 2 π P 0 ω ε 2 ( ω ) d ω ω 2 ω 2
where P represents the principle value of the integral. In addition, the ε 2 ( ω ) is related to the absorption of light and dielectric loss of energy, while ε 1 ( ω ) is associated with the stored energy.

3. Results and Discussions

3.1. Structural Stability

The calculated lattice parameters of perfect α-Ga2O3 are a = b = 5.055 Å and c = 13.586 Å, which are in good agreement with the literature values for bulk α-Ga2O3 [37,47,48], as shown in Table 1. The lattice constants remain almost unchanged for the Cu- and Zn-doped α-Ga2O3 supercell, which can be attributed to the fact that the Cu and Ga atoms have identical ionic radii and local structure, as is likewise for Zn and Ga atoms. The variation in the radii between Cu1+ (Cu2+) and Ga3+ ions is 24.2% (17.7%), while it is 19.4% for Zn2+ and Ga3+ ions.
The distribution of electron density is employed to evaluate the crystal bonding characteristic. Figure 2a shows the electron density of perfect α-Ga2O3; the electrons around Ga and O atoms illustrate a strong covalent bonding between Ga and the nearest neighbor O atoms. For the case of Cu doping, as shown in Figure 2b, the arrangement of the atoms has a minor alteration, which is consistent with the variation of lattice constants as discussed above. The dispersed electrons of the Cu atom in the backdrop can be attributed to the minimal covalent bonding effect. Meanwhile, the decreased electron density of the O atom adjacent to the doped Cu atom indicates that a small number of electrons migrate from O atoms to the nearby Cu atoms, as revealed by the electron density analysis of the O atoms; thus, Cu-doped α-Ga2O3 can be a possible p-type doping. The electron density distribution in the Zn-doped case is shown in Figure 2c, which has similar features as those of Cu doping.
To further study the structural stability of the Cu- and Zn-doped α-Ga2O3 supercell, the defect formation energies under different conditions are calculated, as shown in Figure 3. Meanwhile, in order to assess the ionization energies and effectiveness of doping in α-Ga2O3 systems, we employ the transition levels. The formation energies of Cu- and Zn-doped α-Ga2O3 under an O-rich atmosphere are shown in Figure 3a, and the dashed line represents the calculated band gap of α-Ga2O3. Our calculated value of band gap for perfect α-Ga2O3 is 2.50 eV. We note that the characteristics of band orbital states are consistent with those obtained from previous studies, but the band gap value is smaller than the experimental value, as shown in Figure 1b and Figure 4a [45,49]. The underestimated band gap for DFT calculation is common, but it has no effect on our conclusions qualitatively [50,51].
The formation energies for the Cu and Zn doping cases under O-rich conditions are shown in Figure 3a, which possess negative values throughout the band gap, indicating that both elements can easily be doped in α-Ga2O3. This can be attributed to the fact that the three elements (Cu, Zn, and Ga) are next to each other in the periodic table of elements, and thus the ionic radii between dopants (Cu, Zn) and host Ga are comparable, as discussed above.
The defect concentration can be stated as follows [49,52]:
c = N s i t e exp ( H / K B T )
where c , N s i t e , H , K B , and T denote the effective doping concentration, the number of doping, the formation energy and the Boltzmann constant and temperature, respectively. According to the equation, the lower formation energy in the Zn-doped α-Ga2O3 system corresponds to a higher effective doping concentration compared with that of Cu-doped α-Ga2O3.
Under O-rich conditions, Figure 3a illustrates that the positively charged and negatively charged Cu are energetically favorable when the Fermi level approaches the VBM and CBM, respectively, whereas the negatively charged Zn are dominant across the entire band gap. The transition level ε(+1/0) of Cu-doped α-Ga2O3 is situated at 0.61 eV, which is far above the VBM and acts as a deep acceptor energy level. In addition, the transition levels ε(+2/+1), ε(0/−1), and ε(−1/−2) are 0.26, 1.01, and 2.03 eV, respectively measured from the VBM. For the Zn-doped case, the +2 charge state is observed in a limited region around the VBM, as shown in the inserted figure in Figure 3a. The transition level (+2/0) occurs at 0.02 eV above the VBM; thus, a shallow acceptor level is expected for Zn-doped α-Ga2O3. The transition level ε(0/−1) is 0.06 eV and ε(−1/−2) is 2.52 eV, which is beyond the CBM. It is worth mentioning that during the growth of α-Ga2O3, some native defects such as Gai and VO are unintentionally introduced and give rise to the n-type conduction characteristic [21]. As a result, the Fermi level always tends to be positioned in the region of high α-Ga2O3 bandgap. Therefore, the −2 and −1 charge states, i.e., Cu1+ and Zn2+ oxidation states, are the predominant states for the Cu- and Zn-doped α-Ga2O3 supercell, respectively. In the meantime, the −1 charge states (Cu2+) are an alternative option because the location is near the CBM. Accompanying the valence state variations, two-hole and one-hole introductions for Cu- and Zn-doped α-Ga2O3 are expected, respectively, corresponding to double deep acceptor levels for Cu and one shallow acceptor level for Zn. As a result, the Zn atom can significantly improve the carrier concentration and is likely to be the effective hole dopant in α-Ga2O3, while the Cu atom can effectively compensate electrons in native donor-type defects and can significantly change the non-equilibrium carrier lifetime, considering the shallow doping for the Zn atom and deep doping for the Cu atom. For the Ga-rich condition, i.e., O-poor environment, as shown in Figure 3b, the tendency is the same as in an O-rich atmosphere with the exception of higher formation energies. Therefore, Cu and Zn impurities are more easily substituted to Ga sites under O-rich conditions.

3.2. Electronic Structure

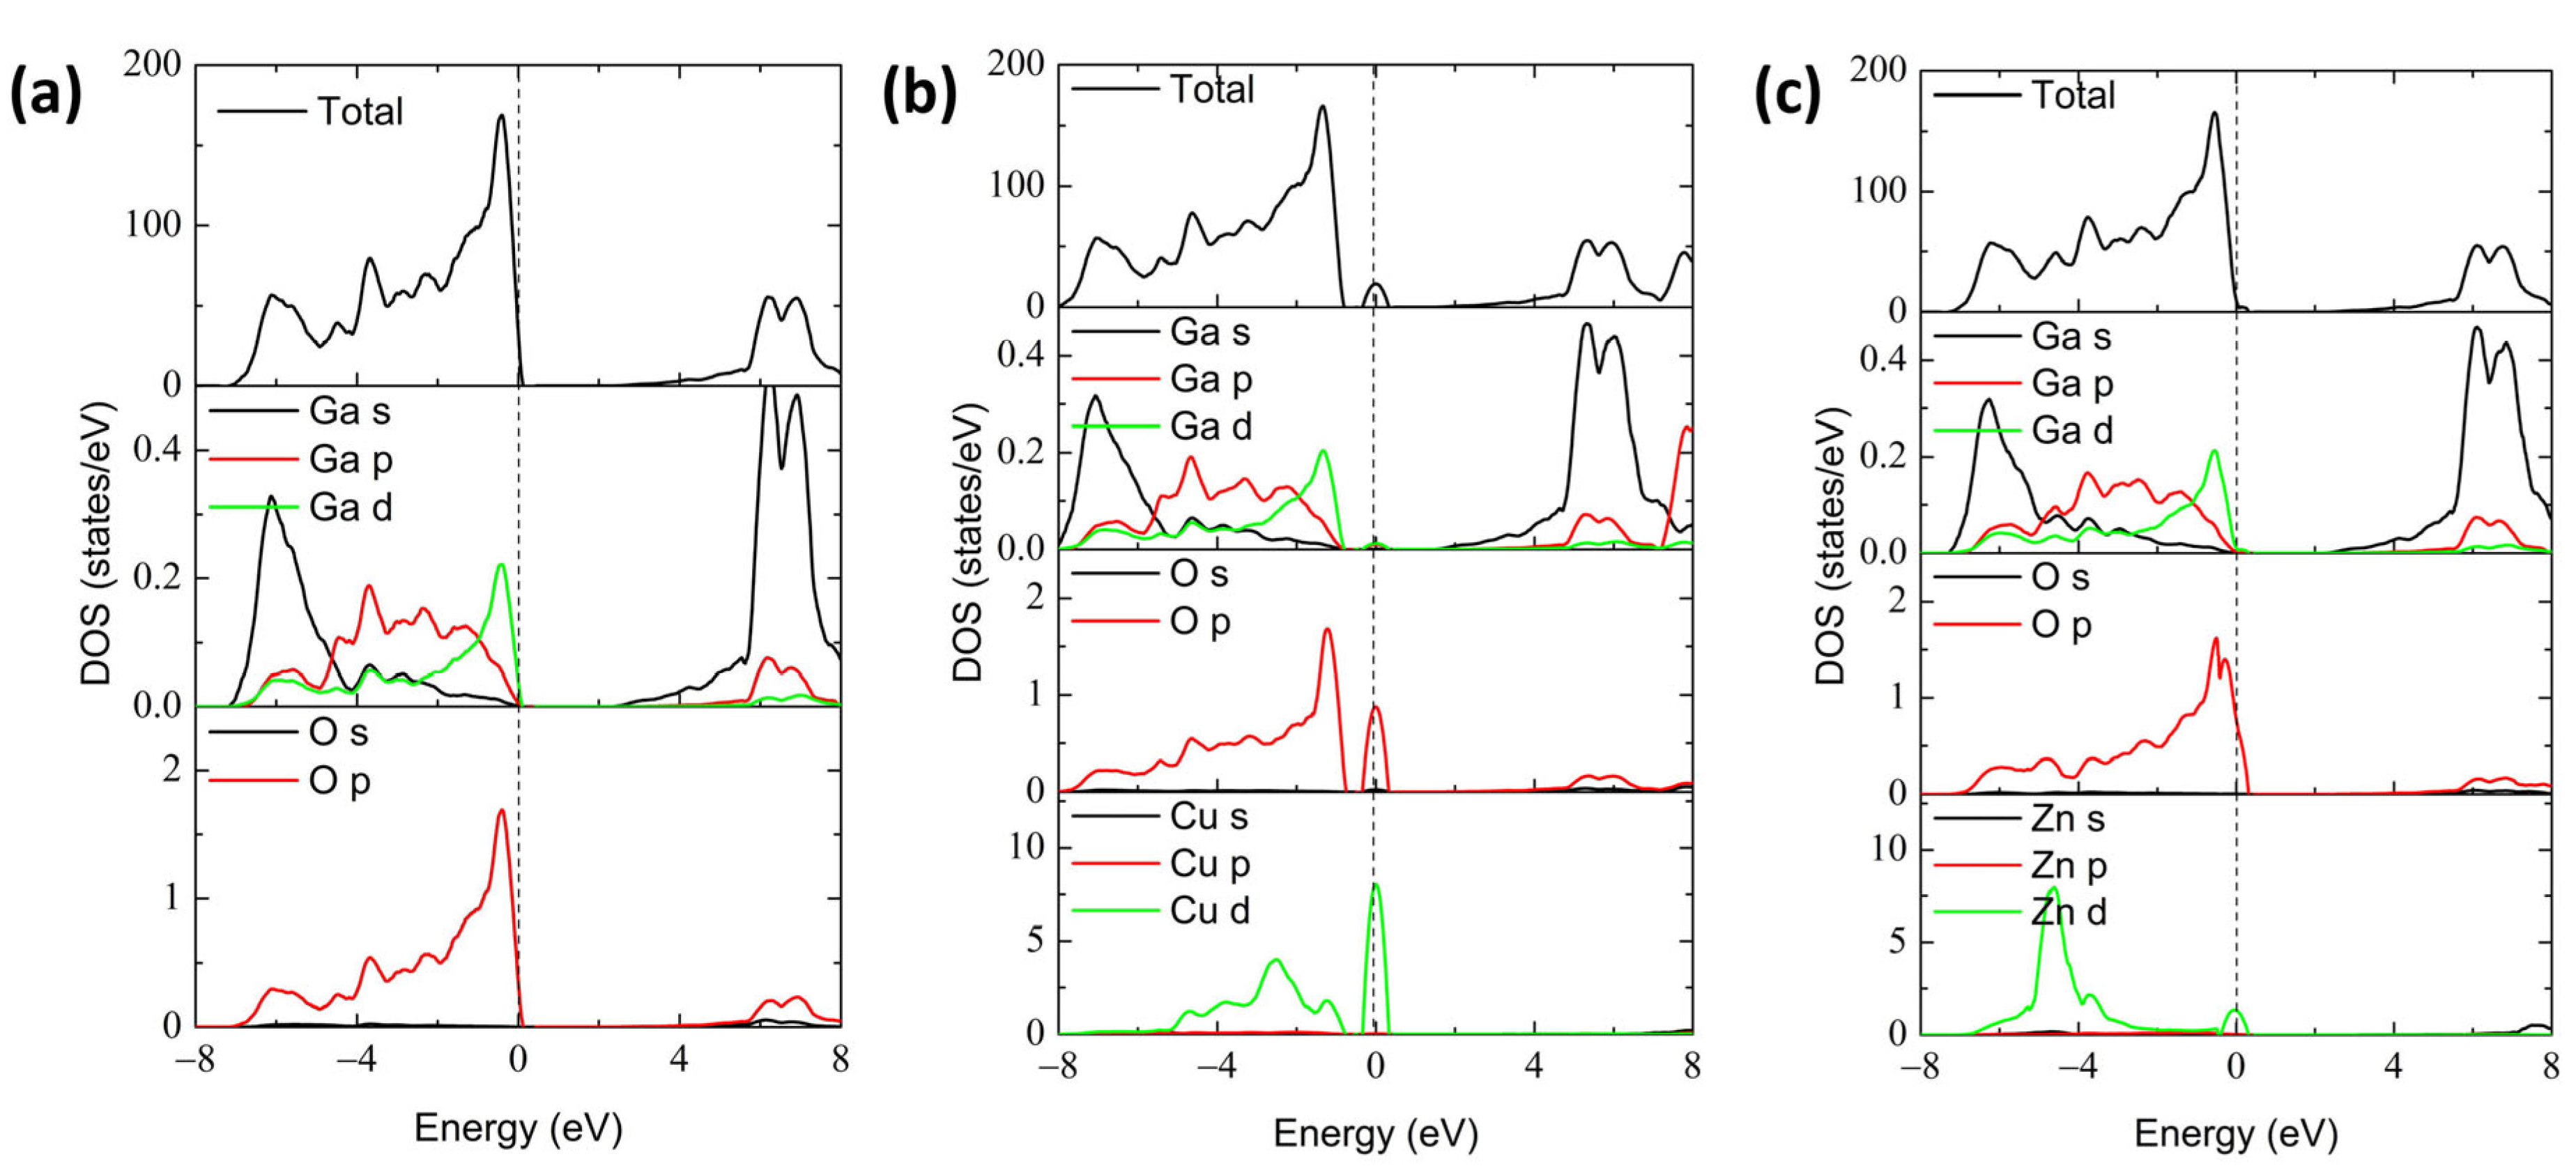
In order to explore the orbital contribution of impurity atoms, the calculated total density of states (TDOS) and partial density of states (PDOS) for perfect, Cu-, and Zn-doped α-Ga2O3 are shown in Figure 4. Figure 4a illustrates that the VBM of perfect α-Ga2O3 is predominantly composed of O 2p orbital-derived states with minor hybridization with Ga 3d and 4p orbitals, while the CBM is composed mainly of Ga 4s orbitals [49]. Additionally, the strong coupling of atomic orbital interaction between Ga and O atoms implies that Ga-O bonds have a covalent bond feature, which is in accordance with the results of electron density distribution.
For the Cu dopant, as shown in Figure 4b, the induced impurity levels are mainly composed of the Cu 3d orbitals near the Fermi level, and it is not fully occupied. The 3d states of the Cu dopant are hybridized obviously with the newly generated occupied O 2p orbitals and tiny Ga 3d orbitals near the Fermi level, implying a strong exchange interaction among them and the formation of a covalent Cu-O bond. In addition, the hole doping can decrease the Fermi level, as shown in Figure 4b. For the Zn doping case in Figure 4c, the results are very similar to that of Cu-doped α-Ga2O3 except for a relatively shallow acceptor level (approximately 0), which matches with the data of formation energy.

3.3. Optical Property

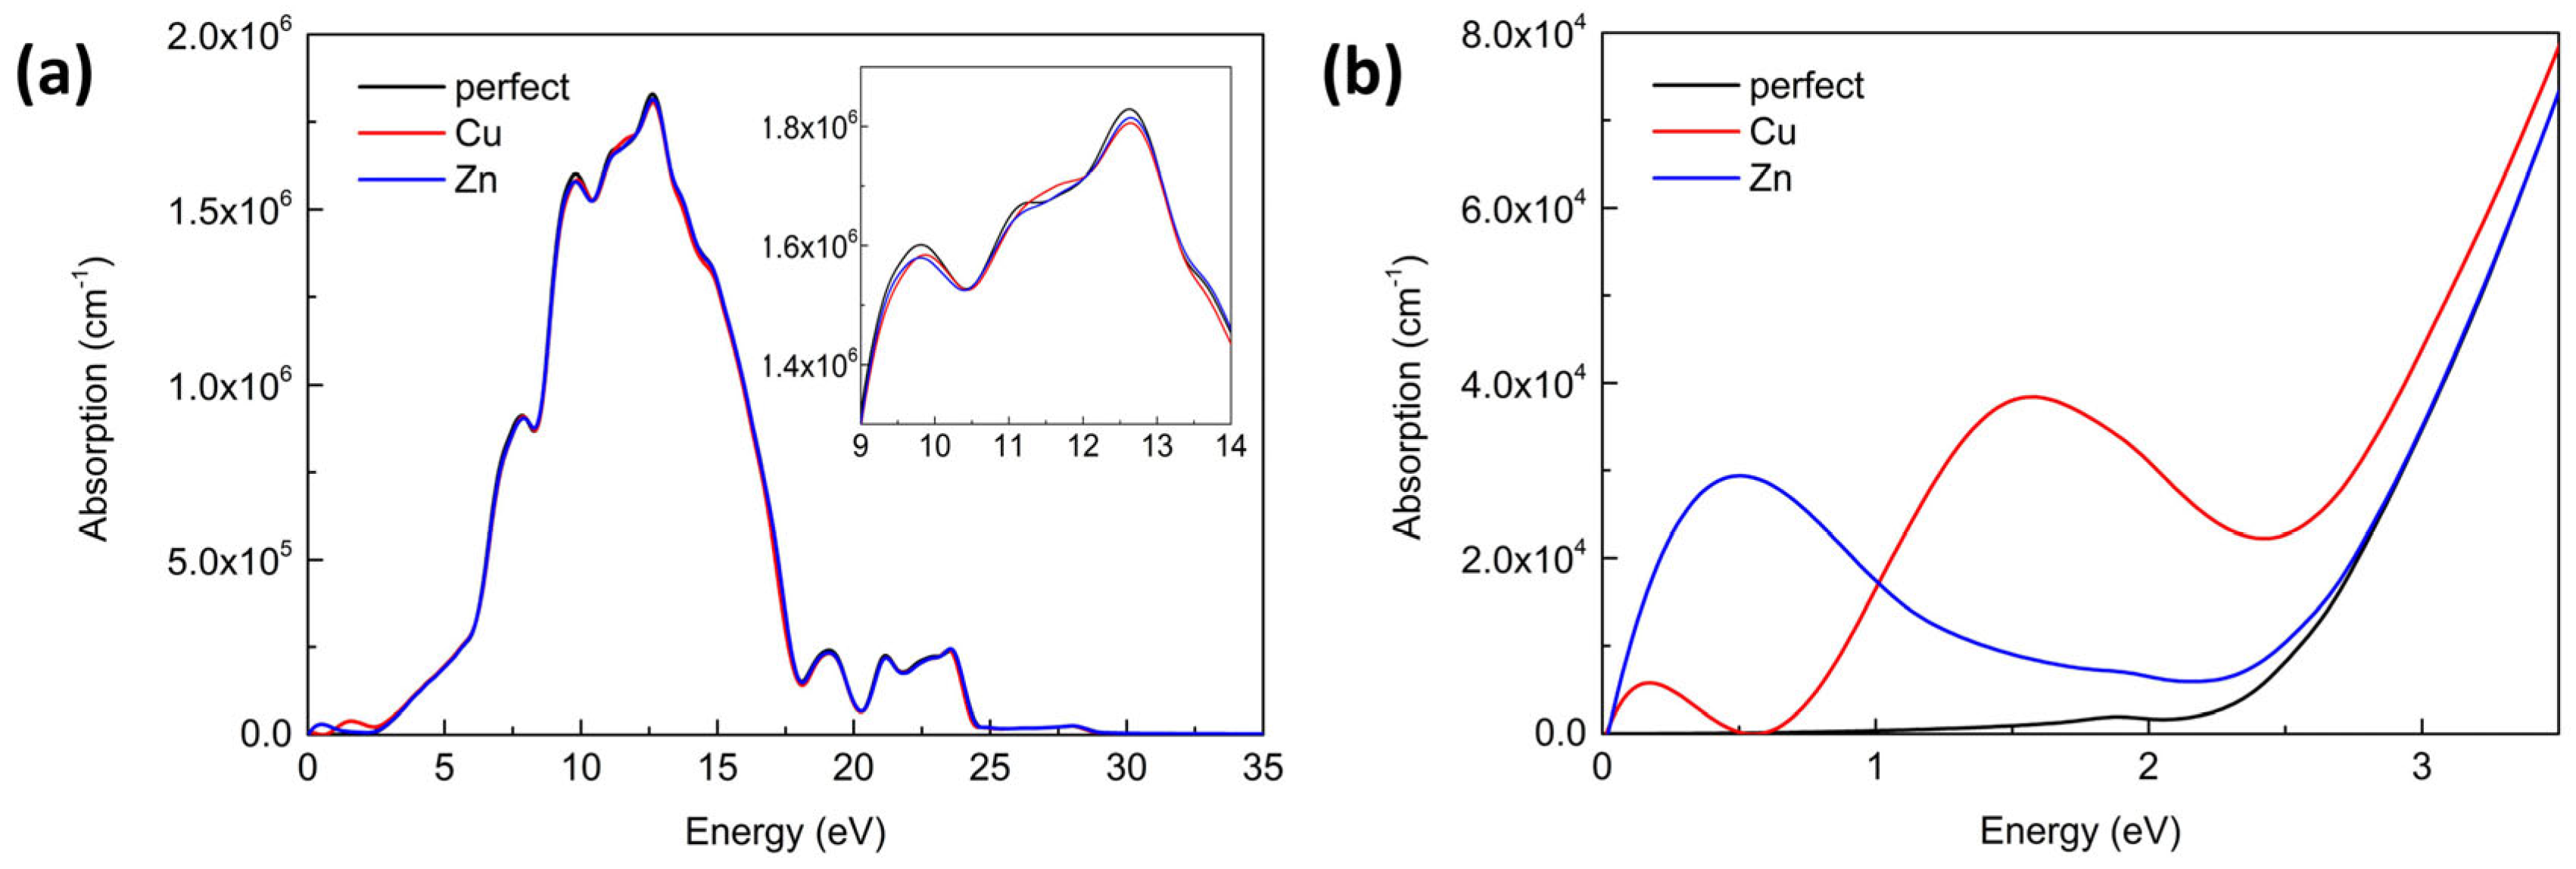
Impurity levels induced by a dopant can affect the characteristic of electronic properties, which can further influence the optical absorption of the material [53]. Figure 5a shows the optical absorption coefficients of perfect, Cu-doped, and Zn-doped α-Ga2O3 vary in energy from 0 to 30 eV, respectively. The strong absorption peak at 12.5 eV for perfect α-Ga2O3 suggests the ultraviolet properties, which can be associated with the band migration from the O 2p occupied orbitals to the Ga 4s unoccupied orbitals. One can notice that perfect α-Ga2O3 is endowed with strong and weak optical absorption in the ultraviolet and visible–infrared region, respectively, because of its wide band gap. The profiles of Cu- and Zn-doped α-Ga2O3 in the high energy ultraviolet region observed from the insert of Figure 5a are similar to that of perfect α-Ga2O3, except for slightly lower absorption peaks at 9.7 eV and 12.5 eV. It indicates that the two foreign dopants slightly weaken the optical absorption coefficients for α-Ga2O3 in the ultraviolet region. Importantly, new small peaks are created in the lower region. Figure 5b shows the detailed diagram of energy change from 0 to 5 eV. The perfect α-Ga2O3 possesses an optical band gap of about 2.5 eV, which is in good agreement with the results of the electronic structure. When introducing the Cu and Zn dopants into α-Ga2O3, the absorption coefficients of new peaks are relatively low but result in the transformation from the ultraviolet light region to the visible–infrared region (considering the underestimated band gap). For Cu- and Zn-doped α-Ga2O3, the 3d orbitals dominate these impurity levels near the Fermi level, which can usually enhance the absorption coefficients in the infrared or visible region. As analyzed above, double deep acceptor levels for Cu and one shallow acceptor level for Zn are expected; therefore, two absorption peaks and one absorption peak are present for Cu and Zn, respectively, as shown in Figure 5b. The main peak at 1.53 eV and 0.16 eV for Cu-doped α-Ga2O3 can be associated with the transition from O 2p orbitals to Cu 3d orbitals and inter-band transition between the two induced holes, respectively. The main peak at 0.48 eV for Zn-doped α-Ga2O3 can be related to the transition from O 2p orbitals to Zn 3d orbitals.

3.4. Conclusions

The detailed distributions of electron density, defect formation energies, and charge transitional levels under different crystal growth conditions, as well as the electronic and optical properties for Cu- and Zn-doped α-Ga2O3, are discussed based on first-principles DFT calculations with the GGA method. The distribution of electron density illustrates that a small number of electrons transfer to the doping atom. However, double deep acceptor levels for Cu and one shallow acceptor level for Zn are expected. Thus, the Zn atom can significantly improve carrier concentration and is believed to be the effective hole dopant in α-Ga2O3, while the Cu atom can compensate electrons in native defects and significantly change the non-equilibrium carrier lifetime. The 3d states of the Cu and Zn dopants are obviously hybridized with the newly generated occupied O 2p orbitals and tiny Ga 3d orbitals near the Fermi level, which forms the covalent Cu-O and Zn-O bonds. When introducing the Cu and Zn dopants into α-Ga2O3, the absorption coefficients of new peaks are relatively low but result in the optical absorption migration from deep ultraviolet light to visible–infrared light. The main peak of optical absorption at 1.53 and 0.16 eV for Cu-doped α-Ga2O3 can be associated with the transition from O 2p orbitals to Cu 3d orbitals and inter-band transition between the two induced holes, respectively. The main peak of optical absorption at 0.48 eV for Zn-doped α-Ga2O3 can be related to the transition from O 2p orbitals to Zn 3d orbitals.

Author Contributions

Conceptualization, H.Z.; Software, Q.L.; Investigation, M.C.; Data curation, H.Z.; Writing—original draft, H.Z.; Writing—review & editing, M.W.; Supervision, M.W.; Funding acquisition, H.Z. and M.W. All authors have read and agreed to the published version of the manuscript.

Funding

This project was supported by the talent research project for Hunan University of Science and Engineering (Grant No. 11102515006), Fundamental Research Funds for Central Universities (Grant No. 20720210018), and the National Natural Science Foundation of China (Grant No. 11704317).

Informed Consent Statement

Not applicable.

Data Availability Statement

No new data were created or analyzed in this study. Data sharing is not applicable to this article.

Conflicts of Interest

The authors declare no conflict of interest.

References

  1. Jiang, Z.X.; Wu, Z.Y.; Ma, C.C.; Deng, J.N.; Zhang, H.; Xu, Y.; Ye, J.D.; Fang, Z.L.; Zhang, G.Q.; Kang, J.Y.; et al. P-type β-Ga2O3 metal-semiconductor-metal solar-blind photodetectors with extremely high responsivity and gain-bandwidth product Mater. Today Phys. 2020, 14, 100226. [Google Scholar]
  2. Tang, R.; Li, G.; Li, C.; Li, J.; Zhang, Y.; Huang, K.; Ye, J.; Li, C.; Kang, J.Y.; Zhang, R.; et al. Localized surface plasmon enhanced Ga2O3 solar blind photodetectors. Opt. Express 2020, 28, 5731–5740. [Google Scholar] [CrossRef] [PubMed]
  3. Tadjer, M.J. Toward gallium oxide power electronics. Science 2022, 378, 724–725. [Google Scholar] [CrossRef] [PubMed]
  4. Zhang, J.; Dong, P.; Dang, K.; Zhang, Y.; Yan, Q.; Xiang, H.; Su, J.; Liu, Z.; Si, M.; Gao, J.; et al. Ultra-wide bandgap semiconductor Ga2O3 power diodes. Nat. Commun. 2022, 13, 3900. [Google Scholar] [CrossRef]
  5. Harada, T.; Tsukazaki, A. Dynamic characteristics of PdCoO2/β-Ga2O3 Schottky junctions. Appl. Phys. Lett. 2020, 116, 232104. [Google Scholar] [CrossRef]
  6. Harada, T.; Ito, S.; Tsukazaki, A. Electric dipole effect in PdCoO2/β-Ga2O3 Schottky diodes for high-temperature operation. Sci. Adv. 2019, 5, eaax5733. [Google Scholar] [CrossRef] [Green Version]
  7. Pang, R.; Teramura, K.; Morishita, M.; Asakura, H.; Hosokawa, S.; Tanaka, T. Enhanced CO evolution for photocatalytic conversion of CO2 by H2O over Ca modified Ga2O3. Commun. Chem. 2020, 3, 137. [Google Scholar] [CrossRef]
  8. Zhang, J.; Shi, J.; Qi, D.-C.; Chen, L.; Zhang, K.H.L. Recent progress on the electronic structure, defect, and doping properties of Ga2O3. APL Mater. 2020, 8, 020906. [Google Scholar] [CrossRef] [Green Version]
  9. Pearton, S.J.; Yang, J.; Cary IV, P.H.; Ren, F.; Kim, J.; Tadjer, M.J.; Mastro, M.A. A review of Ga2O3 materials, processing, and devices. Appl. Phys. Rev. 2018, 5, 011301. [Google Scholar] [CrossRef]
  10. Ping, L.K.; Berhanuddin, D.D.; Mondal, A.K.; Menon, P.S.; Mohamed, M.A. Properties and perspectives of ultrawide bandgap Ga2O3 in optoelectronic applications. Chin. J. Phys. 2021, 73, 195–212. [Google Scholar] [CrossRef]
  11. Ahmadi, E.; Oshima, Y. Materials issues and devices of α- and β-Ga2O3. J. Appl. Phys. 2019, 126, 160901. [Google Scholar] [CrossRef]
  12. Wang, Y.; Su, J.; Yuan, H.; Lin, Z.; Zhang, J.; Hao, Y.; Chang, J. Impurity level properties in transition metal doped α-Ga2O3 for optoelectronic applications. Semicond. Sci. Technol. 2021, 36, 095026. [Google Scholar] [CrossRef]
  13. Guo, D.Y.; Zhao, X.L.; Zhi, Y.S.; Cui, W.; Huang, Y.Q.; An, Y.H.; Li, P.G.; Wu, Z.P.; Tang, W.H. Epitaxial growth and solar-blind photoelectric properties of corundum-structured α-Ga2O3 thin films. Mater. Lett. 2016, 164, 364–367. [Google Scholar] [CrossRef]
  14. Chen, X.; Xu, Y.; Zhou, D.; Yang, S.; Ren, F.-F.; Lu, H.; Tang, K.; Gu, S.; Zhang, R.; Zheng, Y.; et al. Solar-Blind Photodetector with High Avalanche Gains and Bias-Tunable Detecting Functionality Based on Metastable Phase α-Ga2O3/ZnO Isotype Heterostructures. ACS Appl. Mater. Interfaces 2017, 9, 36997–37005. [Google Scholar] [CrossRef]
  15. Kim, K.-H.; Ha, M.-T.; Kwon, Y.-J.; Lee, H.; Jeong, S.-M.; Bae, S.-Y. Growth of 2-Inch α-Ga2O3 Epilayers via Rear-Flow-Controlled Mist Chemical Vapor Deposition. ECS J. Solid State Sci. Technol. 2019, 8, Q3165. [Google Scholar] [CrossRef]
  16. Bhuiyan, A.F.M.A.U.; Feng, Z.; Huang, H.-L.; Meng, L.; Hwang, J.; Zhao, H. Metalorganic chemical vapor deposition of α-Ga2O3 and α-(AlxGa1−x)2O3 thin films on m-plane sapphire substrates. APL Mater. 2021, 9, 101109. [Google Scholar] [CrossRef]
  17. Oshima, Y.; Víllora, E.G.; Shimamura, K. Halide vapor phase epitaxy of twin-free α-Ga2O3 on sapphire (0001) substrates. Appl. Phys. Express 2015, 8, 055501. [Google Scholar] [CrossRef]
  18. Smirnov, A.M.; Kremleva, A.V.; Sharofidinov, S.S.; Bougrov, V.E.; Romanov, A.E. Stress–strain state in α-Ga2O3 epitaxial films on α-Al2O3 substrates. Appl. Phys. Express 2020, 13, 075502. [Google Scholar] [CrossRef]
  19. Kaneko, K.; Kawanowa, H.; Ito, H.; Fujita, S. Evaluation of Misfit Relaxation in α-Ga2O3 Epitaxial Growth on α-Al2O3 Substrate. Jpn J. Appl. Phys. 2012, 51, 020201. [Google Scholar] [CrossRef]
  20. Chen, X.H.; Chen, Y.T.; Ren, F.-F.; Gu, S.L.; Tan, H.H.; Jagadish, C.; Ye, J.D. Band alignment and band bending at α-Ga2O3/ZnO n-n isotype hetero-interface. Appl. Phys. Lett. 2019, 115, 202101. [Google Scholar] [CrossRef]
  21. Kobayashi, T.; Gake, T.; Kumagai, Y.; Oba, F.; Matsushita, Y.-i. Energetics and electronic structure of native point defects in α-Ga2O3. Appl. Phys. Express 2019, 12, 091001. [Google Scholar] [CrossRef] [Green Version]
  22. Pan, Y. First-principles investigation of the influence of point defect on the electronic and optical properties of α-Ga2O3. Int. J. Energy Res. 2022, 46, 13070–13078. [Google Scholar] [CrossRef]
  23. Simon, J.; Protasenko, V.; Lian, C.; Xing, H.; Jena, D. Polarization-Induced Hole Doping in Wide-Band-Gap Uniaxial Semiconductor Heterostructures. Science 2010, 327, 60–64. [Google Scholar] [CrossRef] [PubMed] [Green Version]
  24. Werner, P.; Casula, M.; Miyake, T.; Aryasetiawan, F.; Millis, A.J.; Biermann, S. Satellites and large doping and temperature dependence of electronic properties in hole-doped BaFe2As2. Nat. Phys. 2012, 8, 331–337. [Google Scholar] [CrossRef]
  25. Euvrard, J.; Yan, Y.; Mitzi, D.B. Electrical doping in halide perovskites. Nat. Rev. Mater. 2021, 6, 531–549. [Google Scholar] [CrossRef]
  26. Zeng, H.; Wu, M.; Wang, H.-Q.; Zheng, J.-C.; Kang, J.Y. Tuning the magnetic and electronic properties of strontium titanate by carbon doping. Front. Phys. 2021, 16, 43501. [Google Scholar] [CrossRef]
  27. Zeng, H.; Wu, M.; Wang, H.-Q.; Zheng, J.-C.; Kang, J.Y. Tuning the Magnetism in Boron-Doped Strontium Titanate. Materials 2020, 12, 5686. [Google Scholar] [CrossRef]
  28. Gueorguiev, G.K.; Pacheco, J.M. Shapes of cagelike metal carbide clusters: First-principles calculations. Phys. Rev. B 2003, 68, 241401. [Google Scholar] [CrossRef]
  29. dos Santos, R.B.; Rivelino, R.; Gueorguiev, G.K.; Kakanakova-Georgieva, A. Exploring 2D structures of indium oxide of different stoichiometry. CrystEngComm 2021, 23, 6661–6667. [Google Scholar] [CrossRef]
  30. Alves Machado Filho, M.; Hsiao, C.-L.; dos Santos, R.B.; Hultman, L.; Birch, J.; Gueorguiev, G.K. Self-Induced Core–Shell InAlN Nanorods: Formation and Stability Unraveled by Ab Initio Simulations. ACS Nanosci. Au 2023, 3, 84–93. [Google Scholar] [CrossRef]
  31. Yan, H.; Guo, Y.; Song, Q.; Chen, Y. First-principles study on electronic structure and optical properties of Cu-doped β-Ga2O3. Phys. B 2014, 434, 181–184. [Google Scholar] [CrossRef]
  32. Stehr, J.E.; Hofmann, D.M.; Schörmann, J.; Becker, M.; Chen, W.M.; Buyanova, I.A. Electron paramagnetic resonance signatures of Co2+ and Cu2+ in β-Ga2O3. Appl. Phys. Lett. 2019, 115, 242101. [Google Scholar] [CrossRef] [Green Version]
  33. Li, C.; Yan, J.-L.; Zhang, L.-Y.; Zhao, G. Electronic structures and optical properties of Zn-doped β-Ga2O3 with different doping sites. Chin. Phys. B 2012, 21, 127104. [Google Scholar] [CrossRef]
  34. Feng, Q.; Liu, J.; Yang, Y.; Pan, D.; Xing, Y.; Shi, X.; Xia, X.; Liang, H. Catalytic growth and characterization of single crystalline Zn doped p-type β-Ga2O3 nanowires. J. Alloys Compd. 2016, 687, 964–968. [Google Scholar] [CrossRef]
  35. Wang, X.H.; Zhang, F.B.; Saito, K.; Tanaka, T.; Nishio, M.; Guo, Q.X. Electrical properties and emission mechanisms of Zn-doped β-Ga2O3 films. J. Phys. Chem. Solids 2014, 75, 1201–1204. [Google Scholar] [CrossRef]
  36. Guo, Y.; Yan, H.; Song, Q.; Chen, Y.; Guo, S. Electronic structure and magnetic interactions in Zn-doped β-Ga2O3 from first-principles calculations. Comput. Mater. Sci. 2014, 87, 198–201. [Google Scholar] [CrossRef]
  37. Pan, Y. Effects of Cu, Ag and Au on electronic and optical properties of α-Ga2O3 oxide according to first-principles calculations. J. Phys. Chem. Solids 2023, 174, 111152. [Google Scholar] [CrossRef]
  38. Kresse, G.; Furthmuller, J. Efficiency of ab-initio total energy calculations for metals and semiconductors using a plane-wave basis set. Comp. Mater. Sci. 1996, 6, 15–50. [Google Scholar] [CrossRef]
  39. Kresse, G.; Furthmuller, J. Efficient iterative schemes for ab initio total-energy calculations using a plane-wave basis set. Phys. Rev. B 1996, 54, 169–186. [Google Scholar] [CrossRef] [PubMed]
  40. Kohn, W.; Sham, L.J. Self-Consistent Equations Including Exchange and Correlation Effects. Phys. Rev. 1965, 140, A1133–A1138. [Google Scholar] [CrossRef] [Green Version]
  41. Perdew, J.P.; Burke, K.; Ernzerhof, M. Generalized Gradient Approximation Made Simple. Phys. Rev. Lett. 1996, 77, 3865–3868. [Google Scholar] [CrossRef] [PubMed] [Green Version]
  42. Goyal, A.; Gorai, P.; Peng, H.; Lany, S.; Stevanović, V. A computational framework for automation of point defect calculations. Comput. Mater. Sci. 2017, 130, 1–9. [Google Scholar] [CrossRef] [Green Version]
  43. Wang, V.; Xu, N.; Liu, J.-C.; Tang, G.; Geng, W.-T. VASPKIT: A user-friendly interface facilitating high-throughput computing and analysis using VASP code. Comput. Phys. Commun. 2021, 267, 108033. [Google Scholar] [CrossRef]
  44. Sun, D.; Gao, Y.; Xue, J.; Zhao, J. Defect stability and electronic structure of doped β-Ga2O3: A comprehensive ab initio study. J. Alloys Compd. 2019, 794, 374–384. [Google Scholar] [CrossRef]
  45. Mondal, A.K.; Mohamed, M.A.; Ping, L.K.; Mohamad Taib, M.F.; Samat, M.H.; Mohammad Haniff, M.A.S.; Bahru, R. First-principles studies for electronic structure and optical properties of p-type calcium doped α-Ga2O3. Materials 2021, 14, 604. [Google Scholar] [CrossRef]
  46. Dong, L.; Jia, R.; Li, C.; Xin, B.; Zhang, Y. Ab initio study of N-doped β-Ga2O3 with intrinsic defects: The structural, electronic and optical properties. J. Alloys Compd. 2017, 712, 379–385. [Google Scholar] [CrossRef]
  47. Choi, M.; Son, J. Doping-induced bandgap tuning of α-Ga2O3 for ultraviolet lighting. Curr. Appl. Phys. 2017, 17, 713–716. [Google Scholar] [CrossRef]
  48. Marezio, M.; Remeika, J.P. Bond Lengths in the α-Ga2O3 Structure and the High-Pressure Phase of Ga2−xFexO3. J. Chem. Phys. 1967, 46, 1862–1865. [Google Scholar] [CrossRef]
  49. Dong, L.; Yu, J.; Zhang, Y.; Jia, R. Elements (Si, Sn, and Mg) doped α-Ga2O3: First-principles investigations and predictions. Comp. Mater. Sci. 2019, 156, 273–279. [Google Scholar] [CrossRef]
  50. Goyal, A.; Gorai, P.; Toberer, E.S.; Stevanović, V. First-principles calculation of intrinsic defect chemistry and self-doping in PbTe. Npj Comput. Mater. 2017, 3, 42. [Google Scholar] [CrossRef] [Green Version]
  51. Ao, L.; Pham, A.; Xiang, X.; Li, S.; Zu, X. Defect induced charge trapping in C-doped α-Al2O3. J. Appl. Phys. 2017, 122, 025702. [Google Scholar] [CrossRef]
  52. Yan, C.; Su, J.; Wang, Y.; Lin, Z.; Zhang, J.; Chang, J.; Hao, Y. Reducing the acceptor levels of p-type β-Ga2O3 by (metal, N) co-doping approach. J. Alloys Compd. 2021, 854, 157247. [Google Scholar] [CrossRef]
  53. Gric, T. Tunable terahertz structure based on graphene hyperbolic metamaterials. Opt. Quantum Electron. 2019, 51, 202. [Google Scholar] [CrossRef]
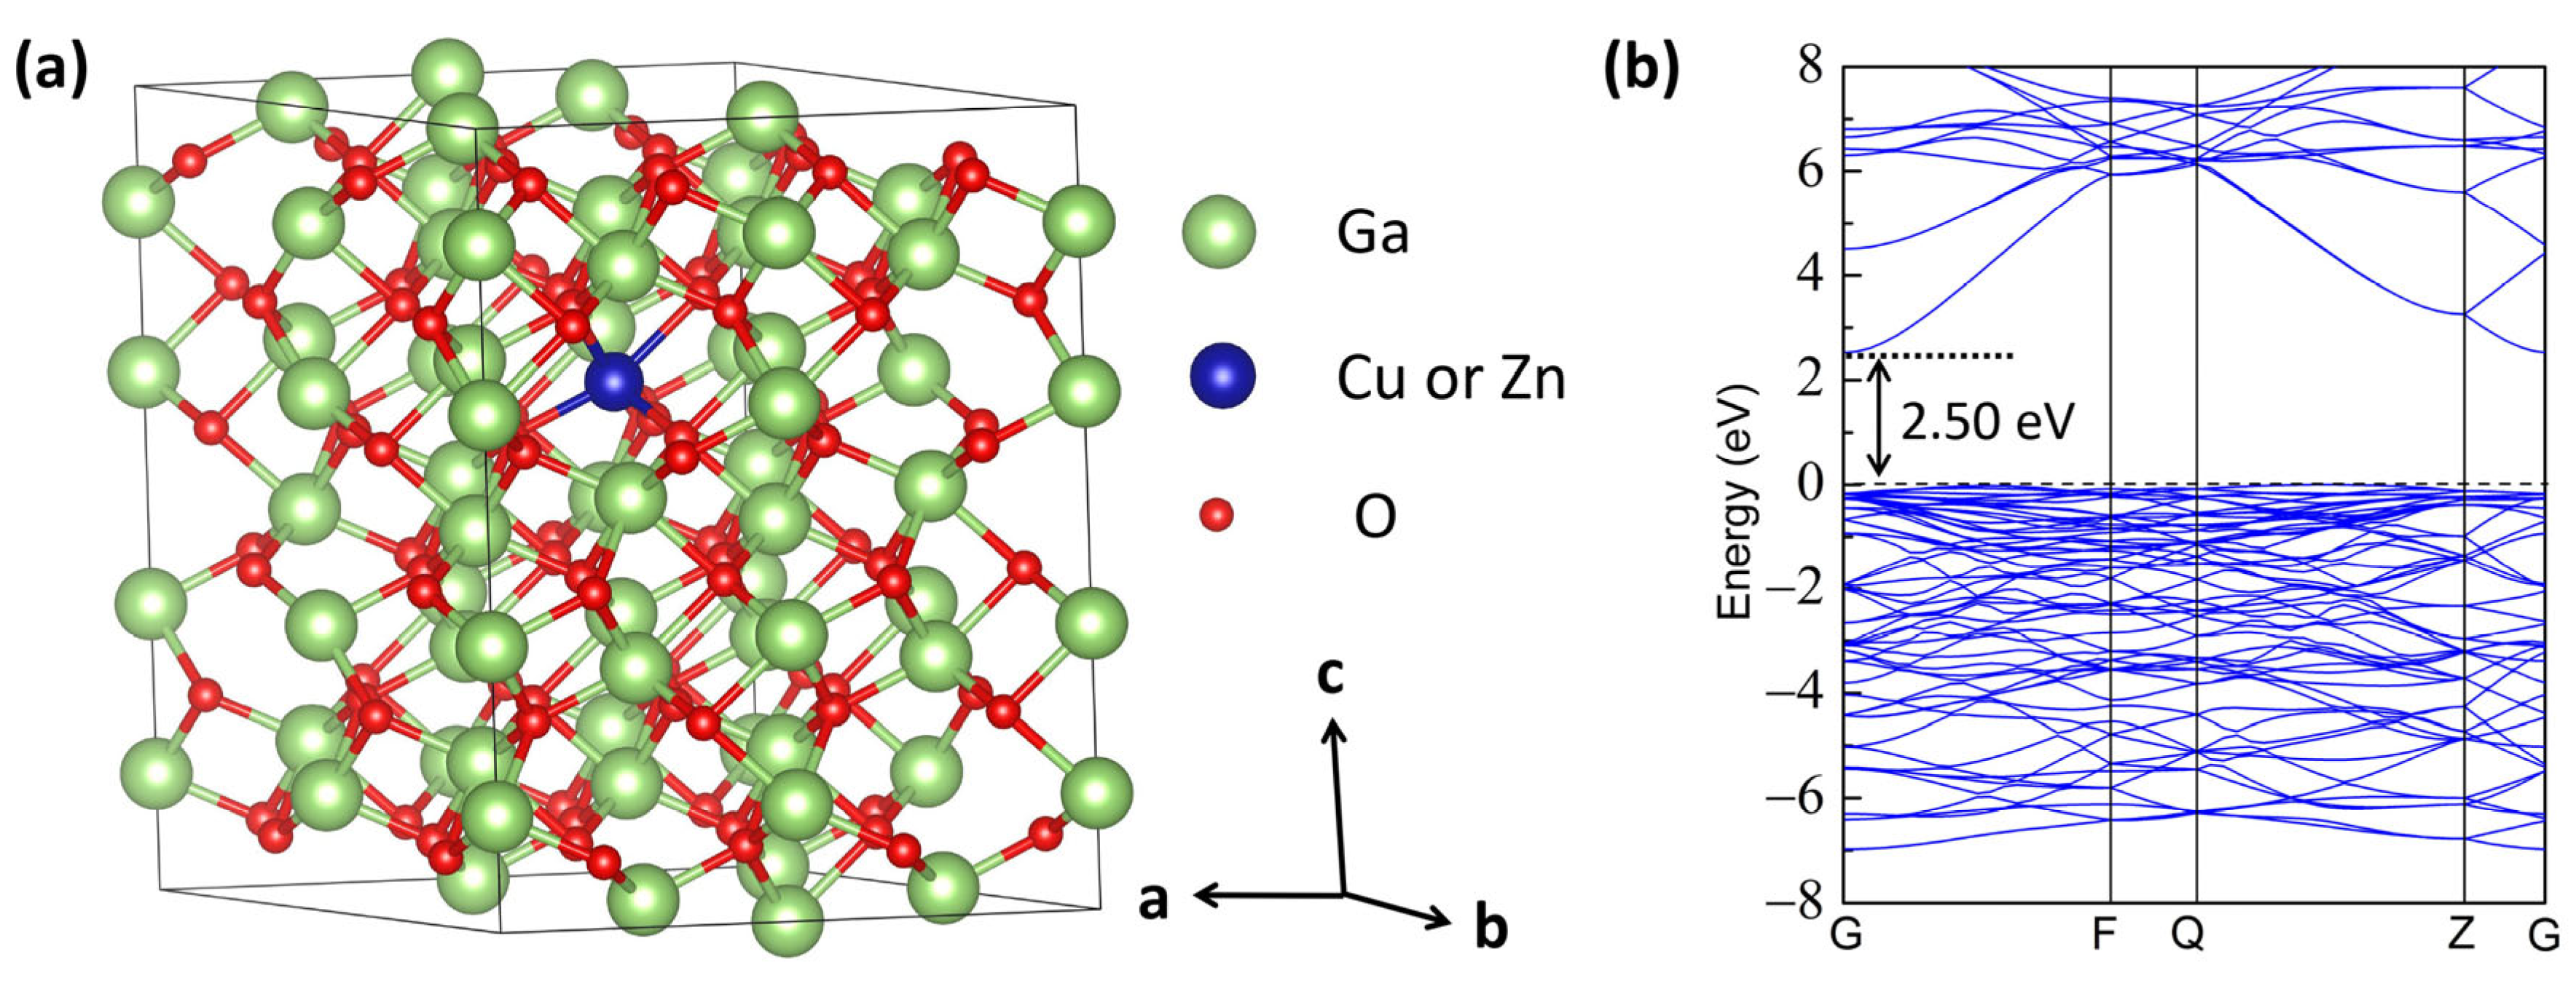
Figure 1. (a) The model of Cu and Zn-doped α-Ga2O3 supercell obtained from VESTA. The larger green spheres and the smaller red spheres represent Ga and O atoms, respectively, while the blue sphere denotes the substituted Ga doping site with one Cu or Zn dopant. The a, b, and c axes denote the crystallographic a, b, and c directions, respectively. (The reader is suggested to see the web version of this article for interpretation of the color references in this figure legend.) (b) The band structure for perfect α-Ga2O3 supercell.
Materials 16 05317 g001
Figure 2. The electron density distribution for (a) perfect α-Ga2O3, (b) Cu-dope α-Ga2O3, and (c) Zn-doped α-Ga2O3. The red and blue colors represent higher and lower electron density, respectively.
Materials 16 05317 g002
Figure 3. The defect formation energies of Cu- and Zn-doped α-Ga2O3 under (a) the O-rich and (b) Ga-rich conditions. The dashed line represents the band gap of perfect α-Ga2O3.
Materials 16 05317 g003
Figure 4. Calculated total density of states (TDOS) and partial density of states (PDOS) of (a) perfect α-Ga2O3, (b) Cu-doped α-Ga2O3, and (c) Zn-doped α-Ga2O3. Dashed line denotes the Fermi level.
Materials 16 05317 g004
Figure 5. The optical absorption of perfect, Cu-doped, and Zn-doped α-Ga2O3 in energy change from (a) 0 to 30 eV and (b) 0 to 5 eV.
Materials 16 05317 g005
Table 1. The calculated lattice constants for perfect, Cu-doped, and Zn-doped α-Ga2O3.
Lattice ConstantsPerfect (This Work)Perfect (Literature)Cu-DopedZn-Doped
a (Å)5.0555.06 [47]/5.076 [37]/4.983 [48]5.0565.059
c (Å)13.58613.63 [47]/13.703 [37]/13.433 [48]13.57413.583
V (Å3)1202.6361222.8 [37]1202.0291204.146
Disclaimer/Publisher’s Note: The statements, opinions and data contained in all publications are solely those of the individual author(s) and contributor(s) and not of MDPI and/or the editor(s). MDPI and/or the editor(s) disclaim responsibility for any injury to people or property resulting from any ideas, methods, instructions or products referred to in the content.