
Innovative Methodology for Physical Modelling of Multi-Pass Wire Rod Rolling with the Use of a Variable Strain Scheme


Abstract
:
1. Introduction
2. Materials and Methods
2.1. Materials
2.2. Methods
- -
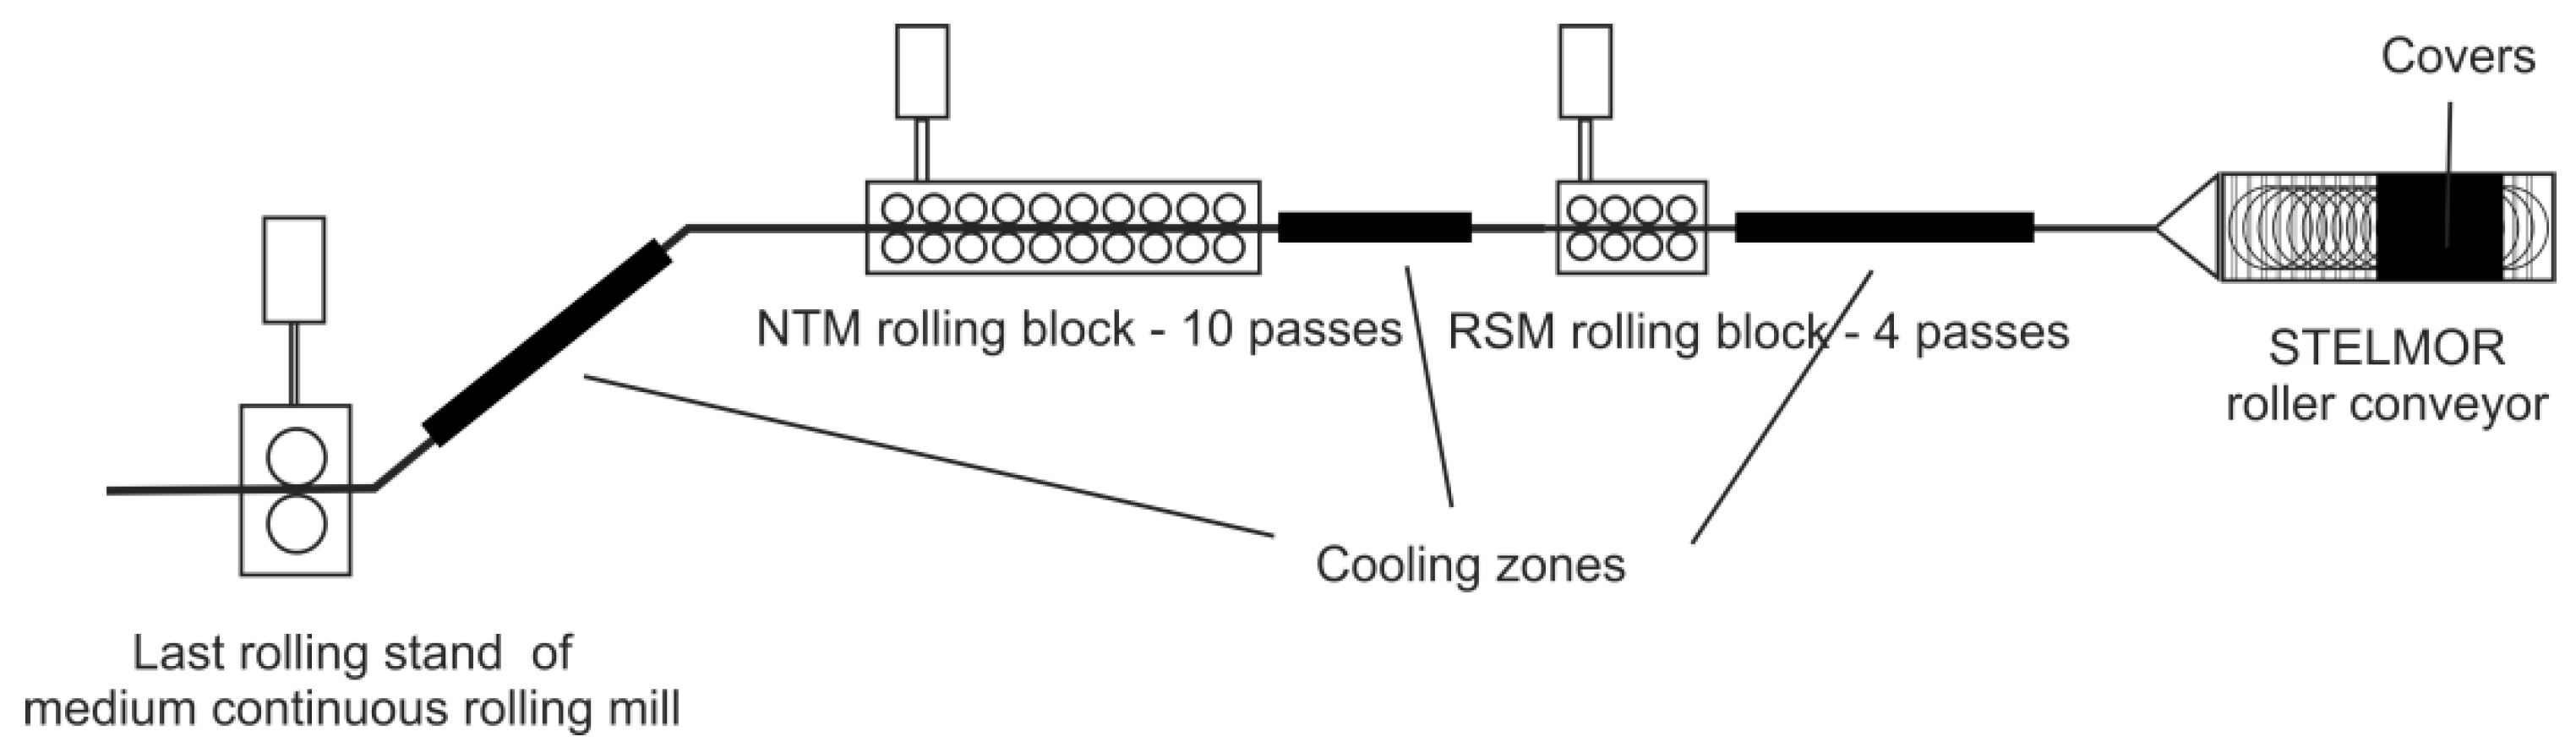
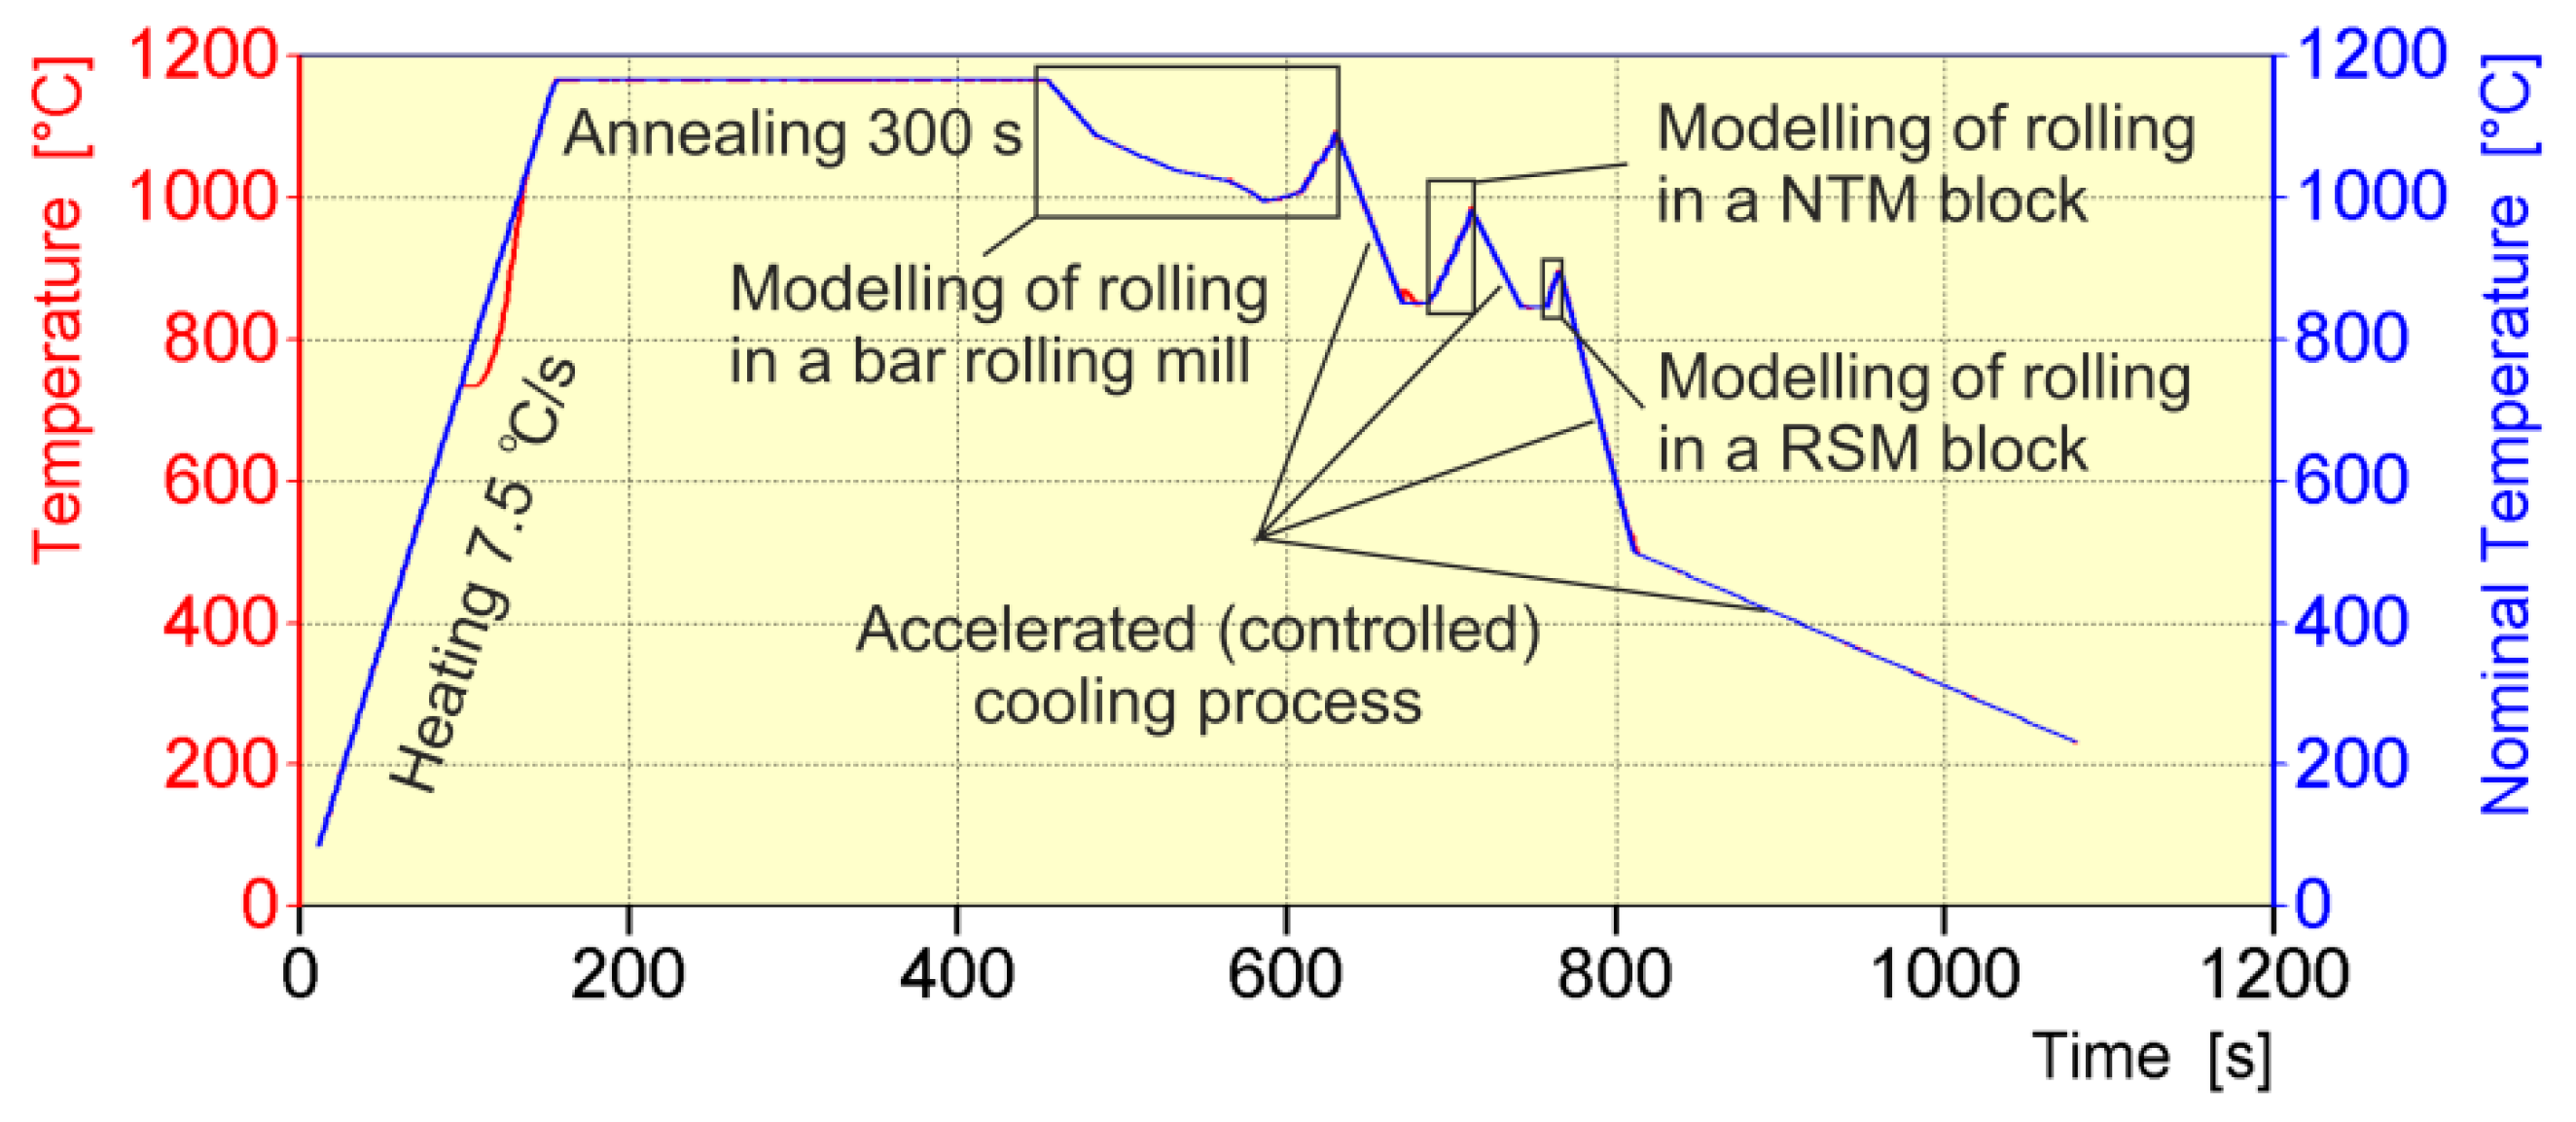
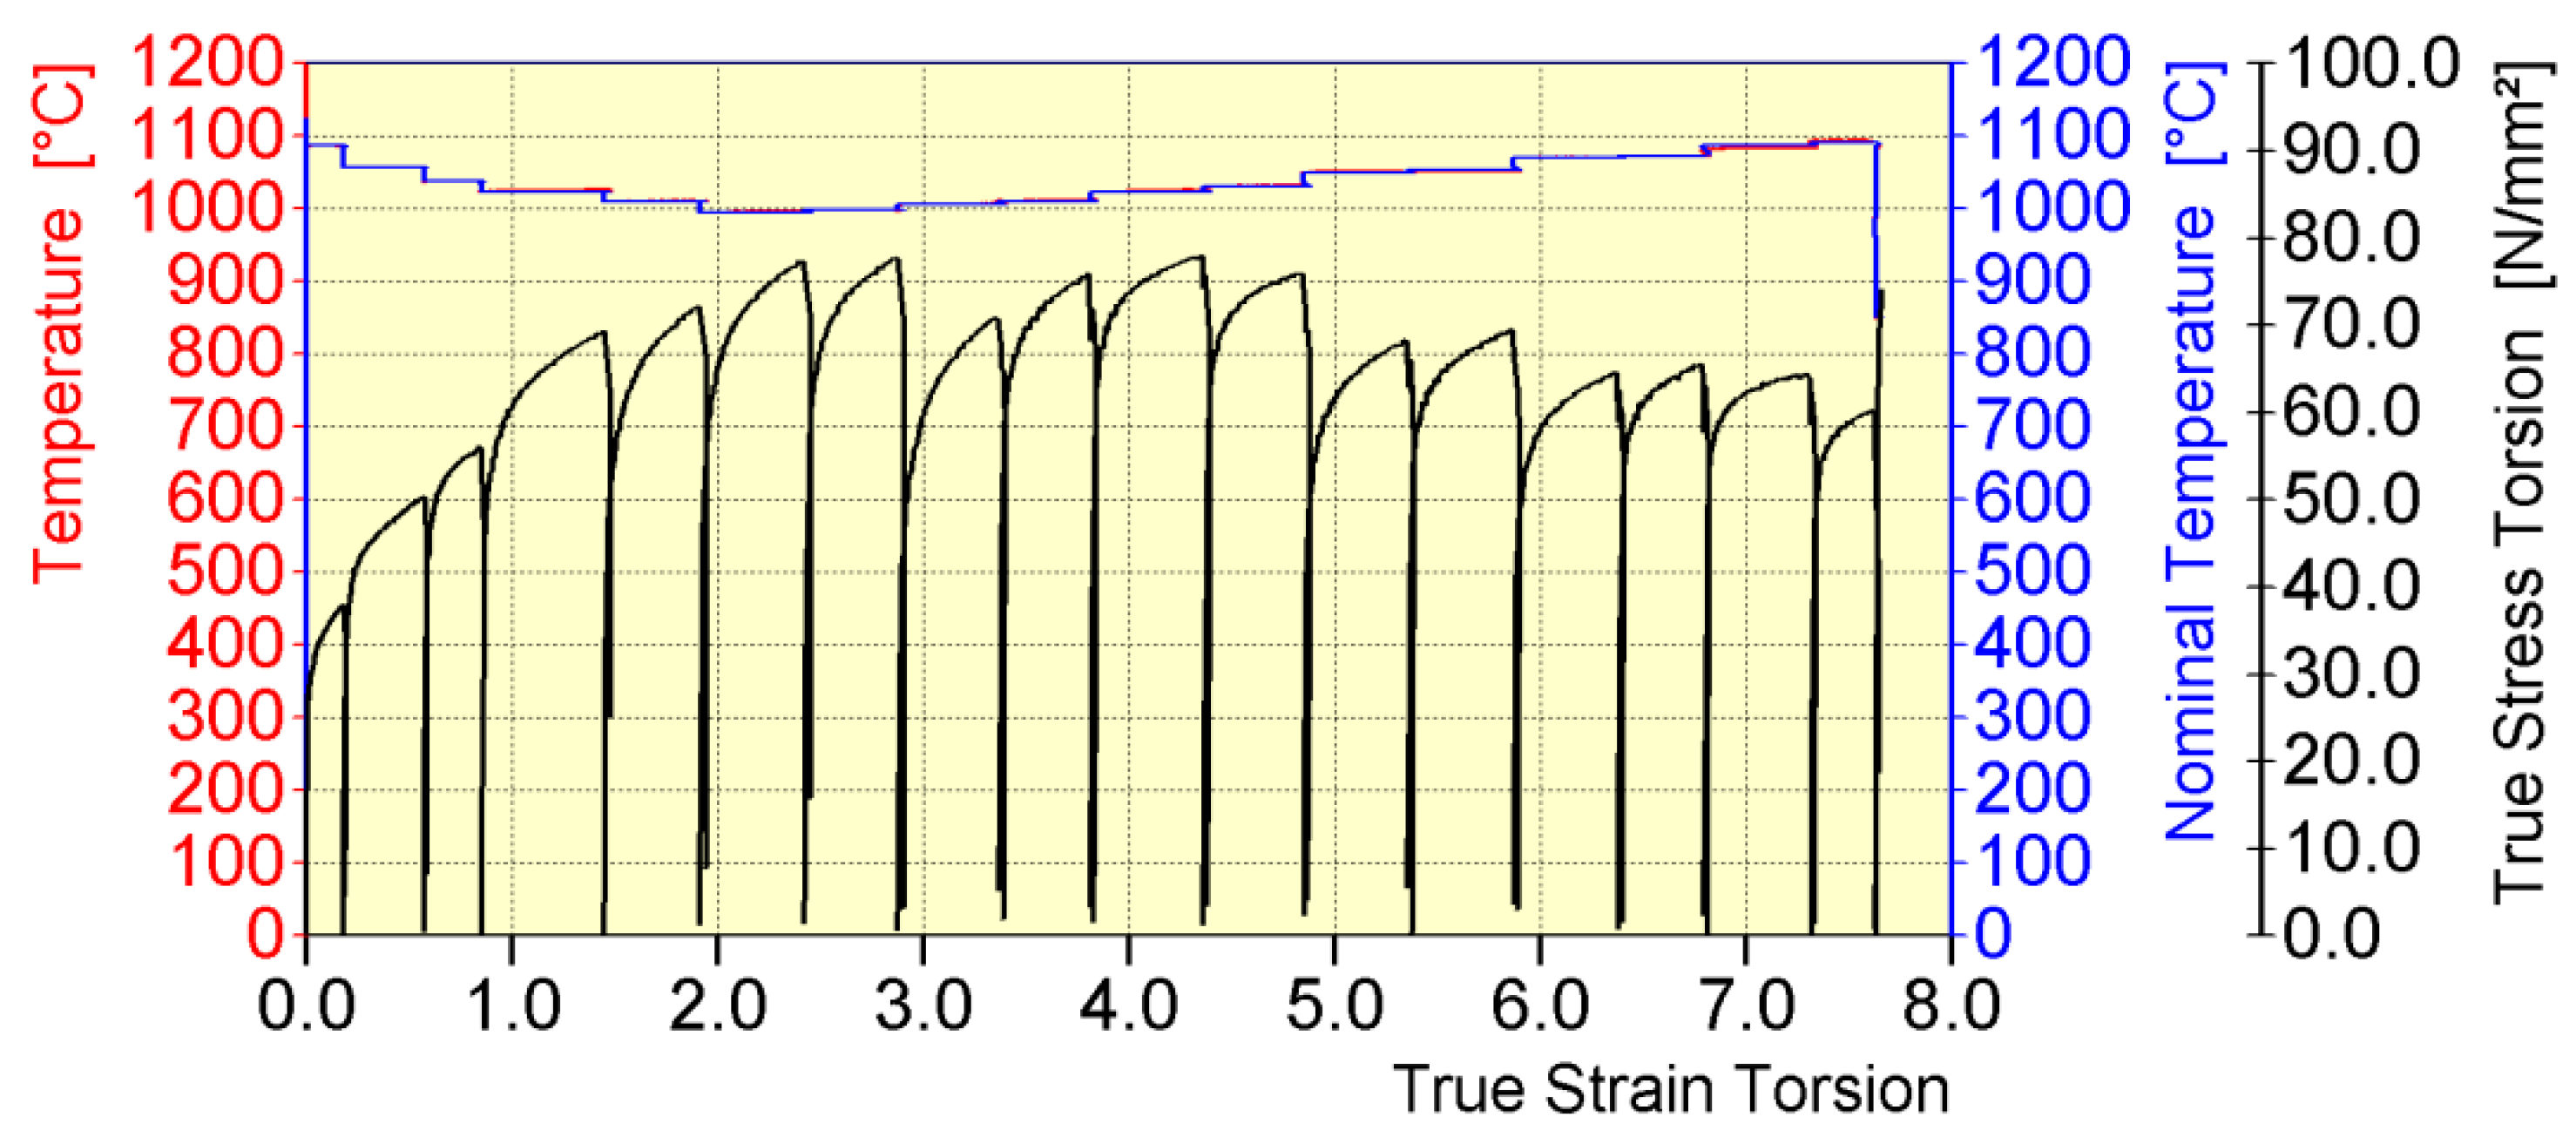
- 17 individual deformations as non-free torsion, representing the rolling process in a continuous bar rolling mill;
- -
- 10 individual deformations as non-free torsion, representing the rolling process in an NTM block of a wire rod rolling mill;
- -
- 4 individual deformations as non-free torsion, representing the rolling process in an RSM block of a wire rod rolling mill.
- -
- 17 individual deformations as non-free torsion, representing the rolling process in a continuous bar rolling mill;
- -
- 1 deformation reproducing the rolling process at an NTM block of a wire rod rolling mill, as non-free torsion, with a total strain value equal to the actual strain value occurring at this stage of the technological process;
- -
- 1 deformation reproducing the rolling process at an RSM block of a wire rod rolling mill, as non-free torsion, with a total strain value equal to the actual strain value occurring in this block.
- -
- 17 individual deformations as non-free torsion, representing the rolling process in a continuous bar rolling mill,
- -
- 1 deformation reproducing the rolling process in an NTM block of a wire rod rolling mill, as non-free torsion, with a total strain value equal to the actual strain value occurring at this stage of the technological process and,
- -
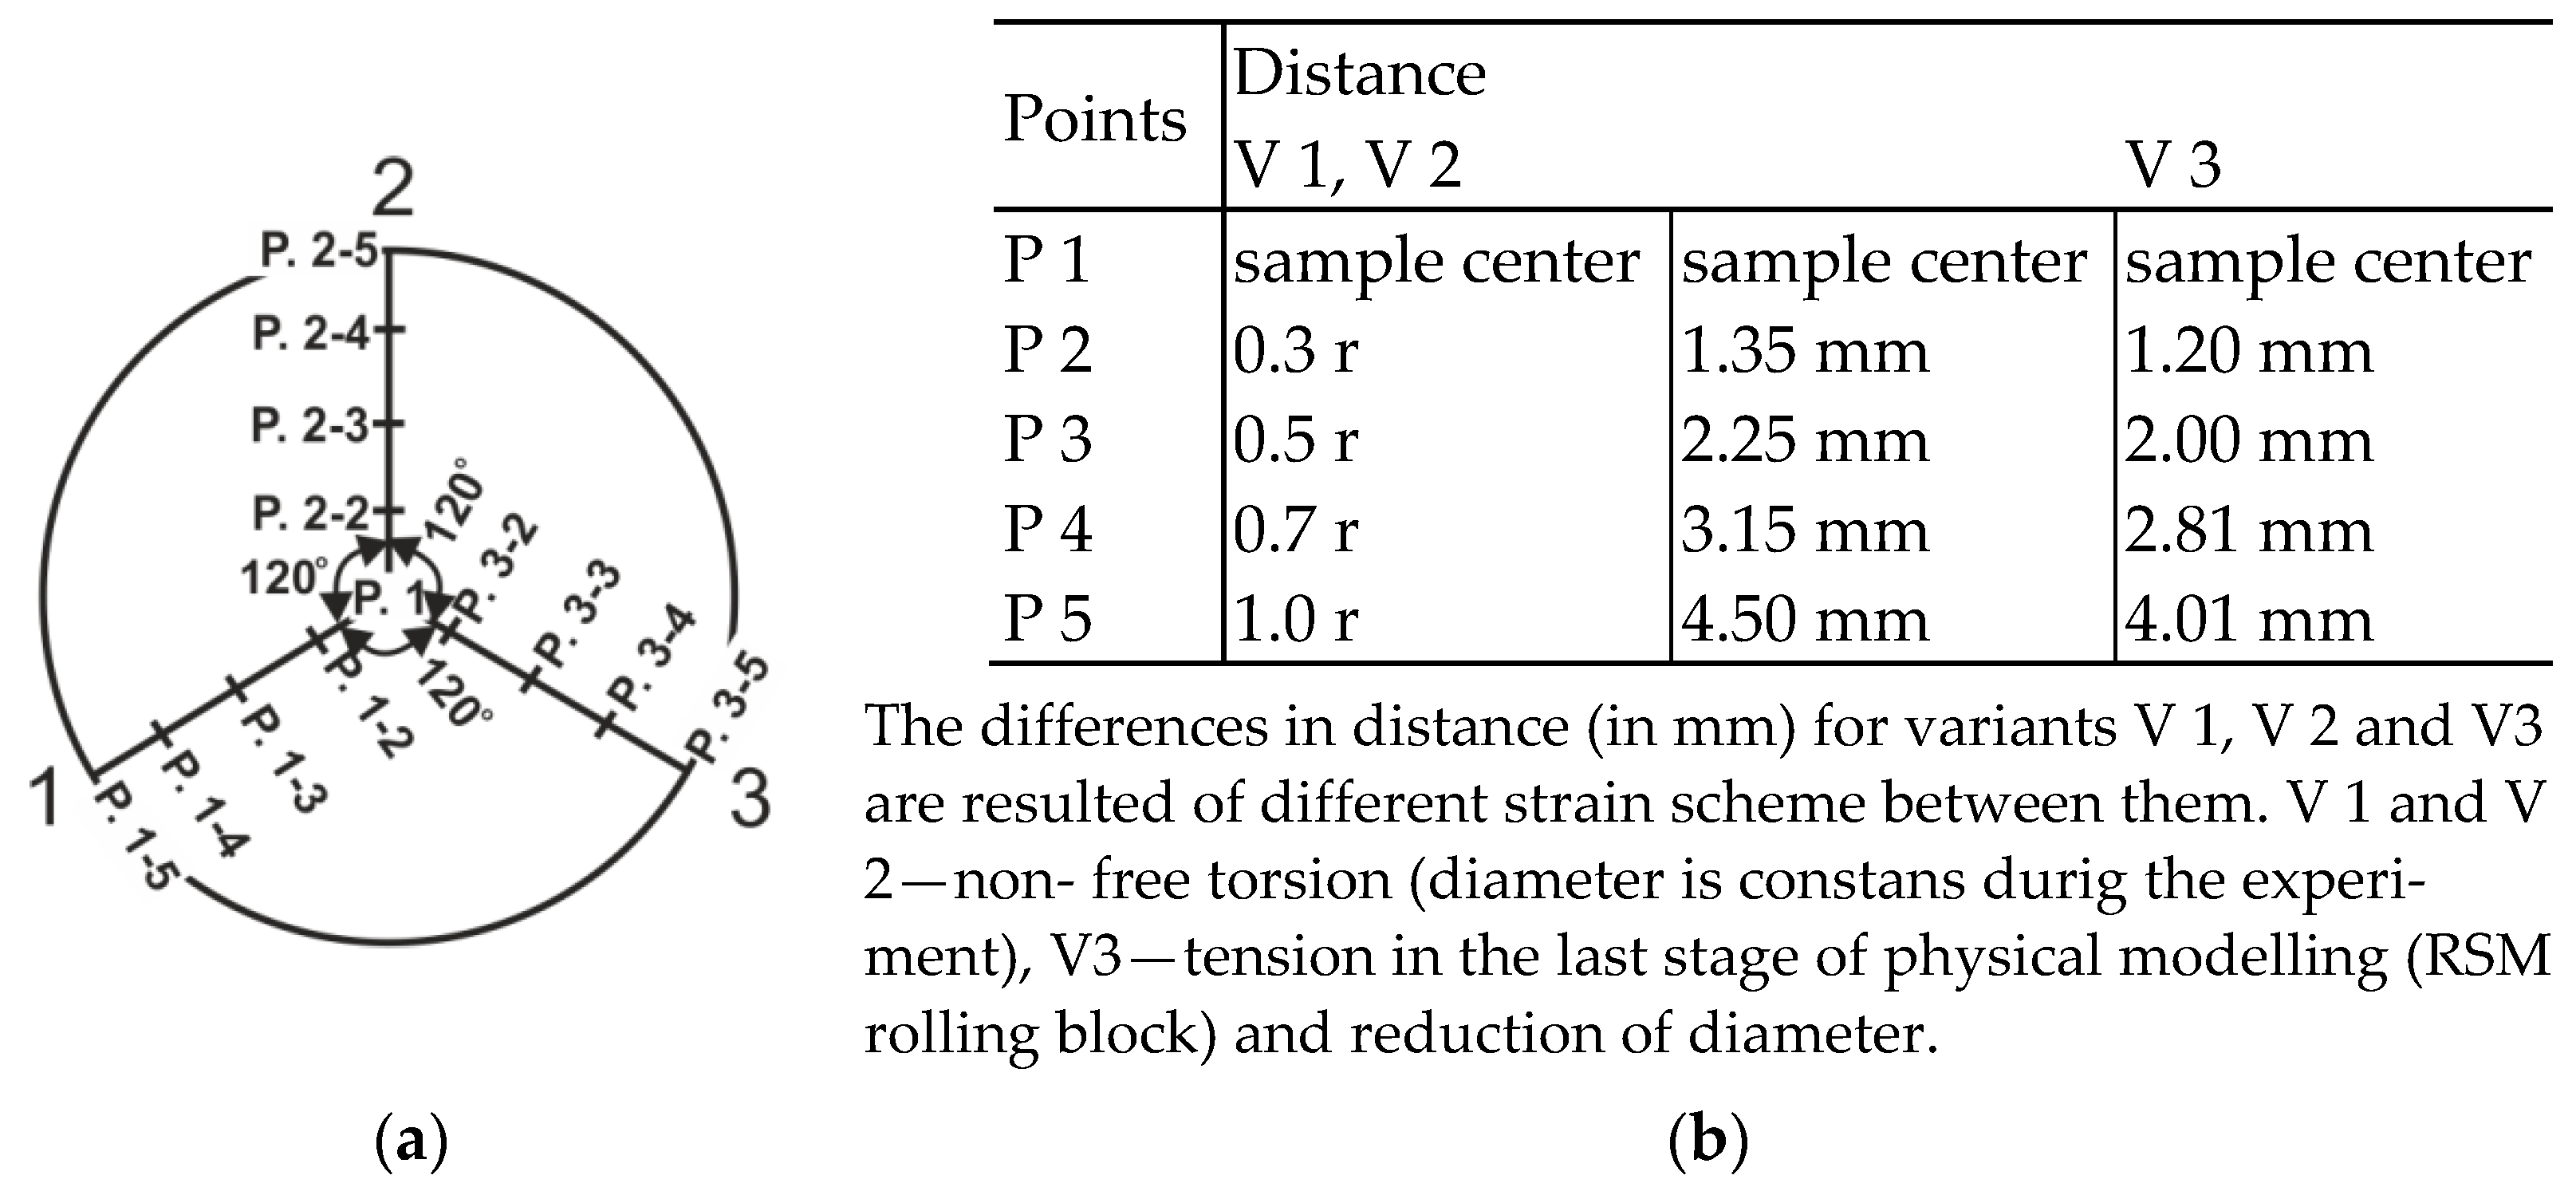
- 1 deformation reproducing the rolling process in an RSM block of a wire rod rolling mill, as tension, while maintaining the total strain value in this block.
3. Results and Discussion
3.1. Analysis of the Main Parameters of the Deformation Process
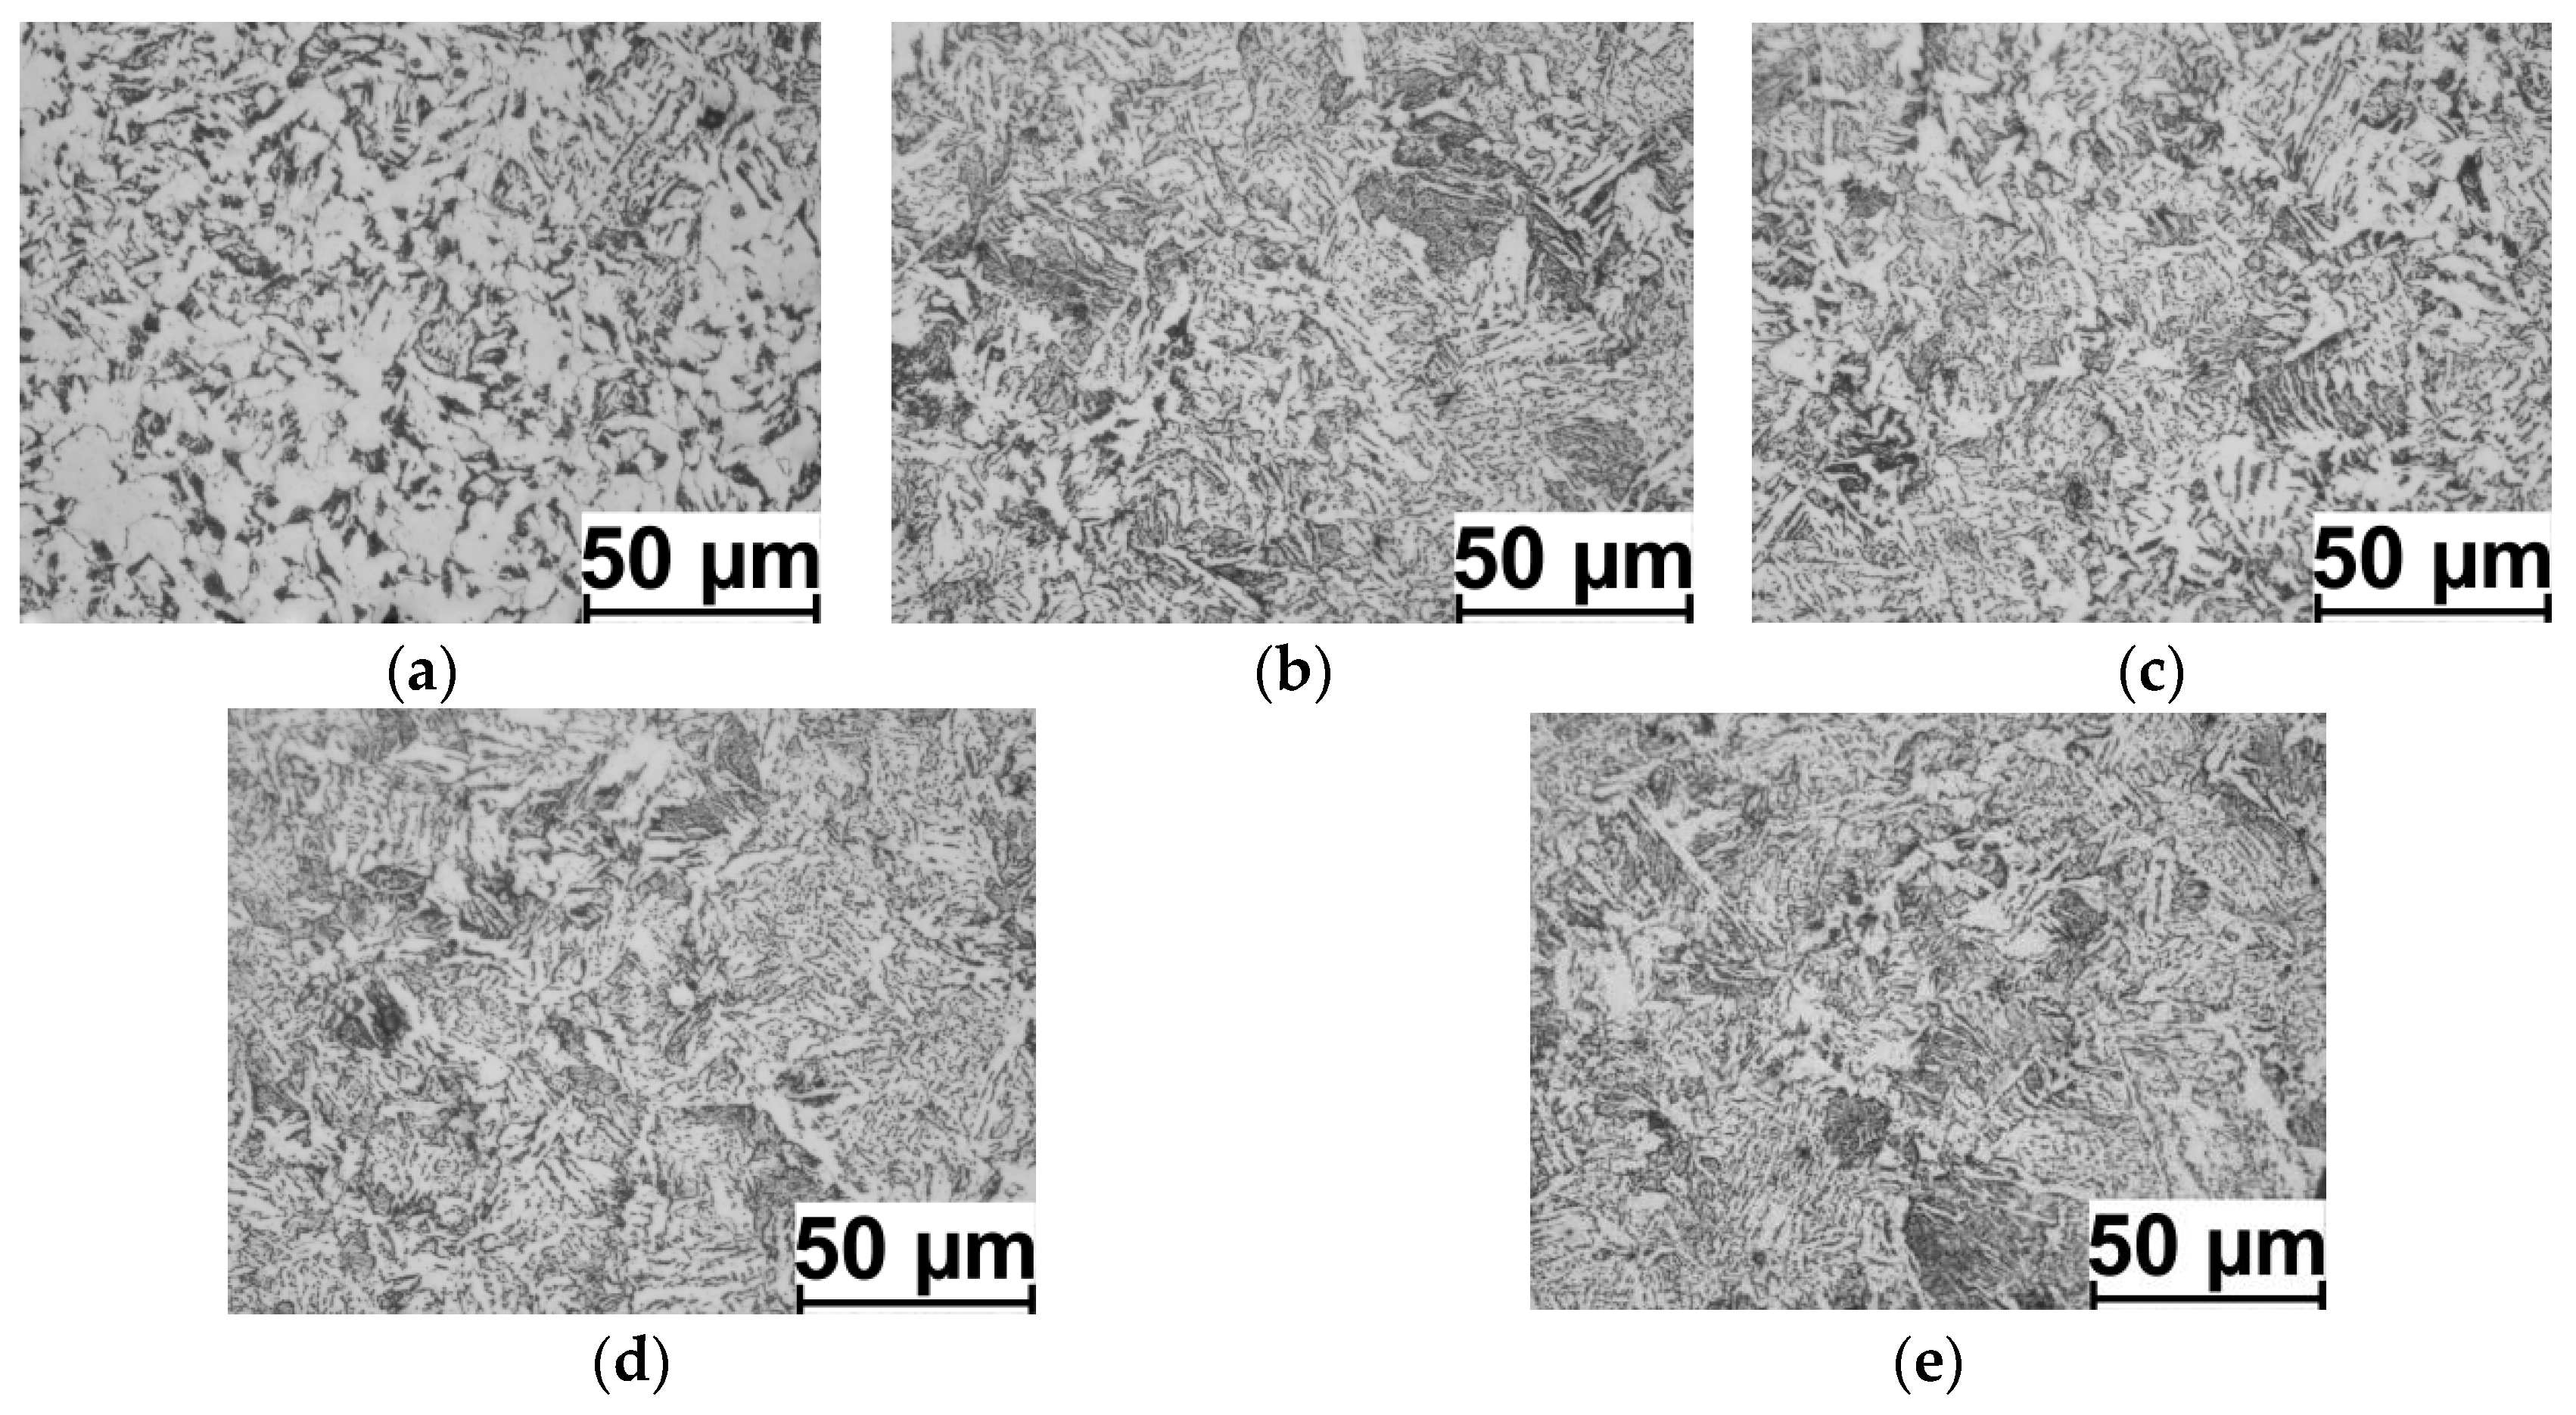
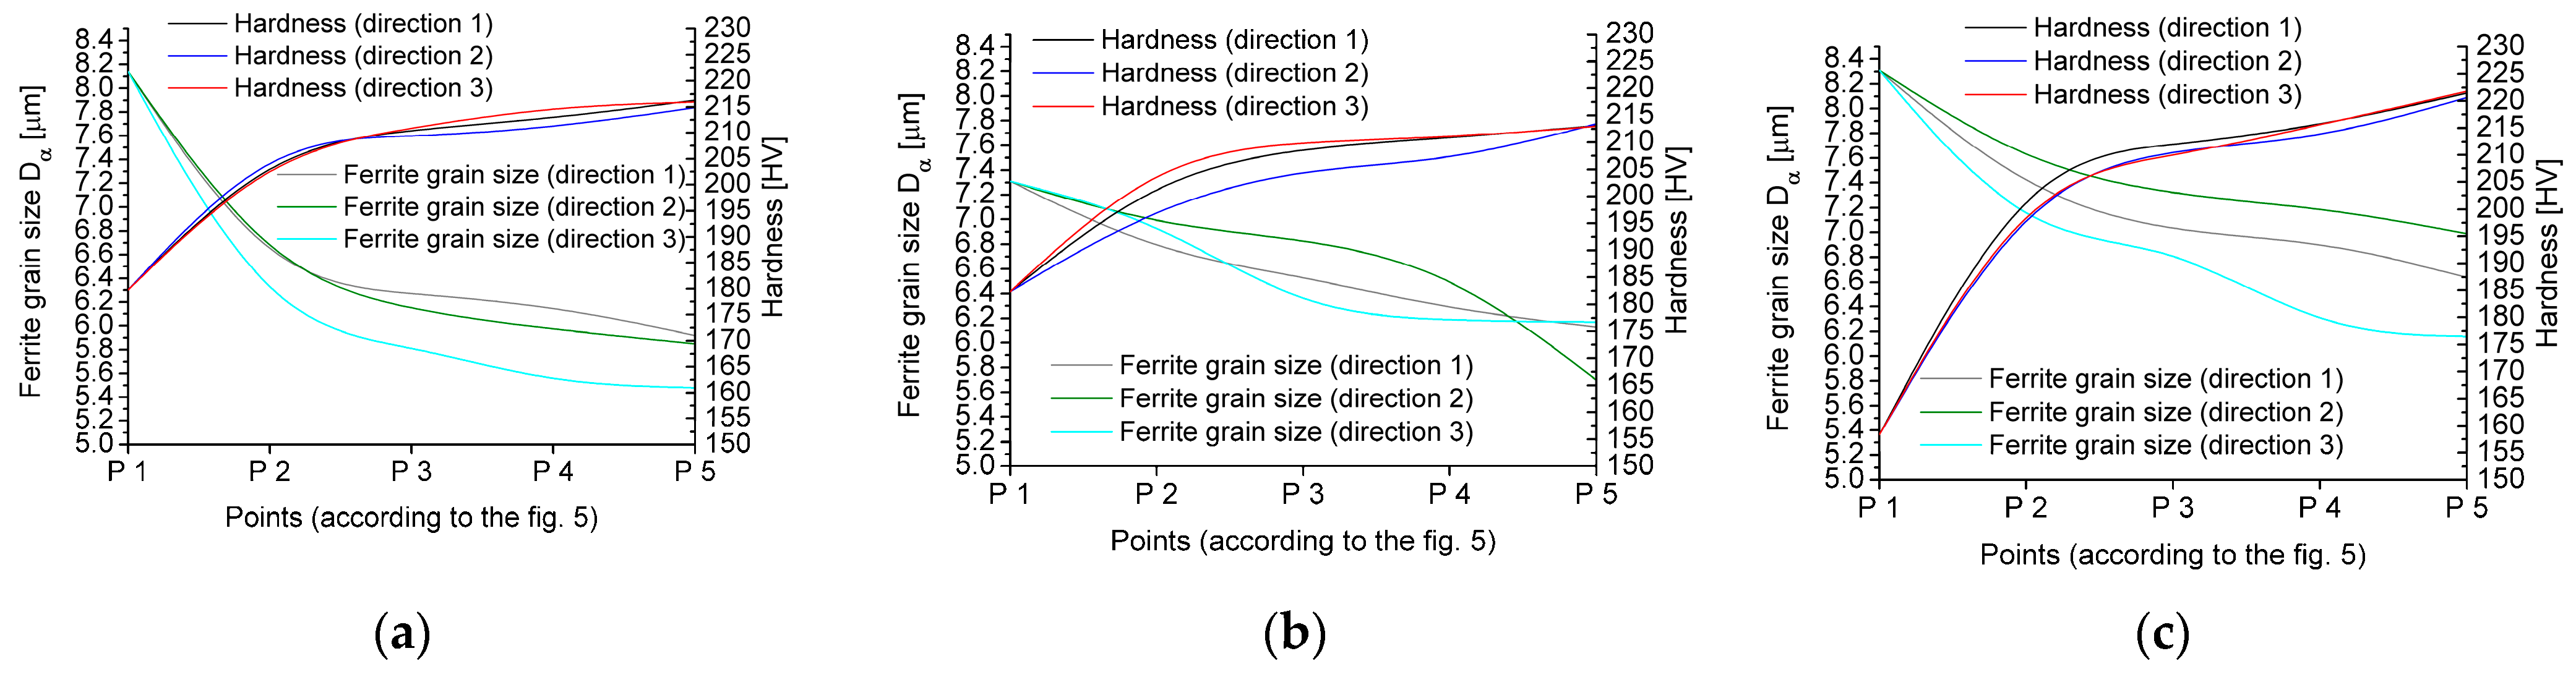
3.2. Impact of the Used Deformation Process Conditions on the Microstructure of the Tested Material
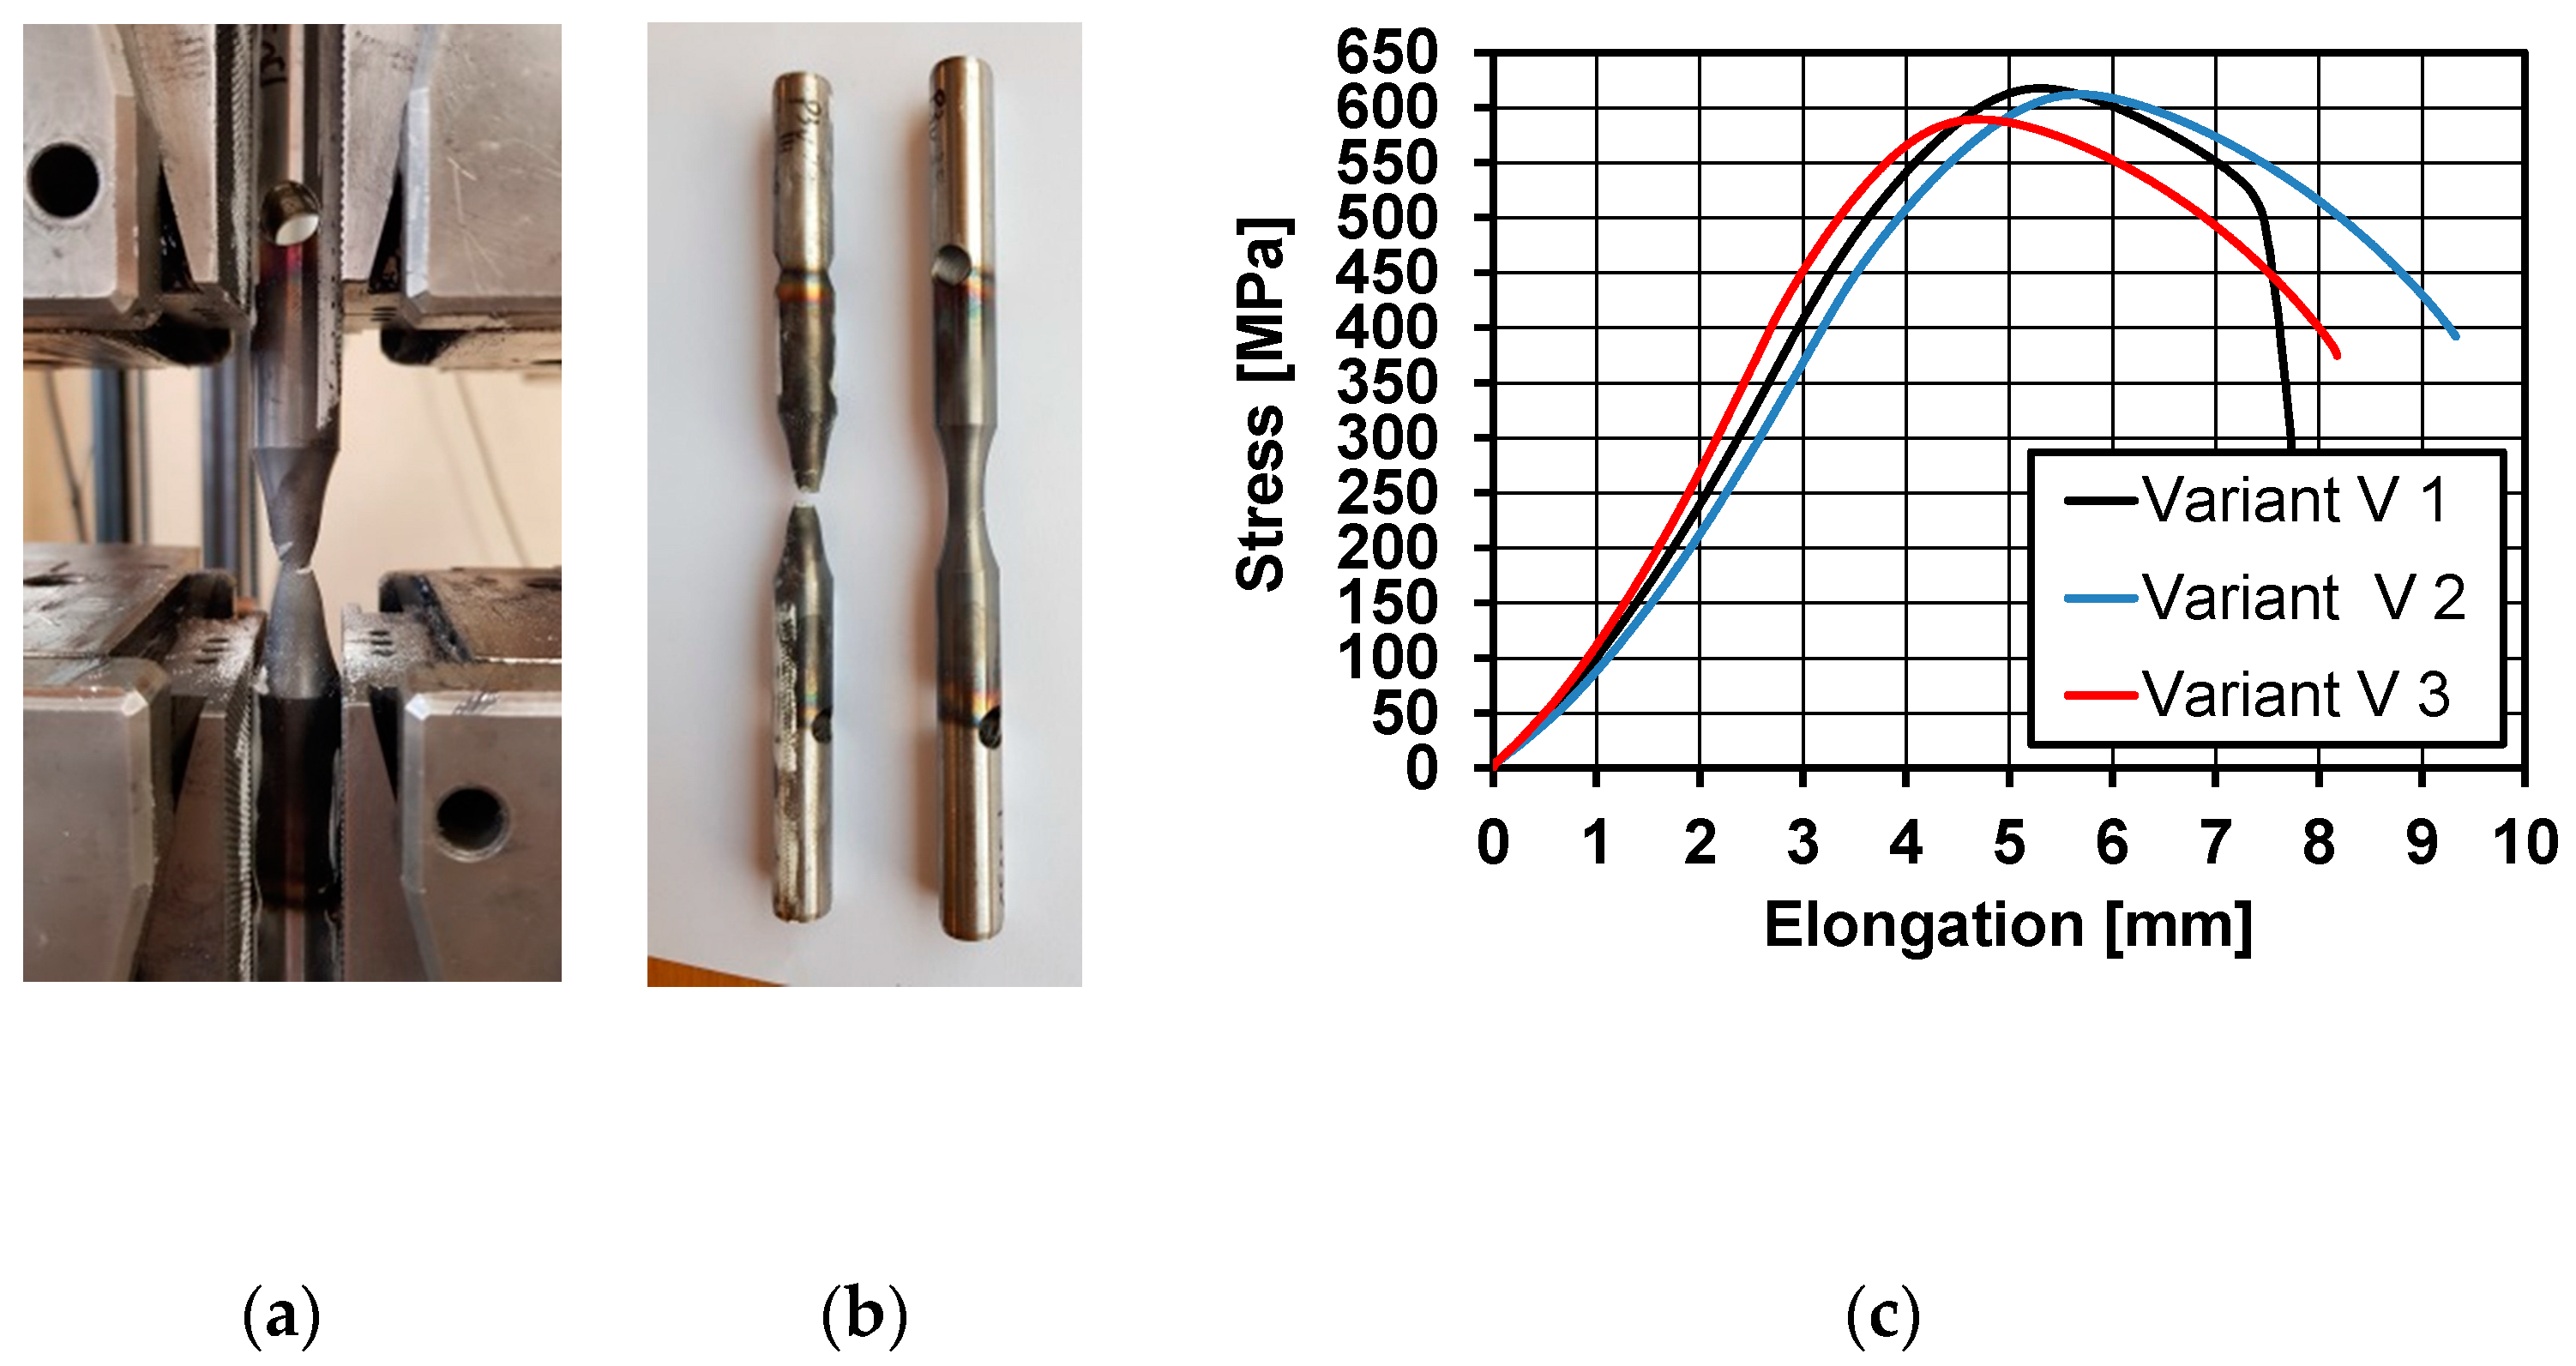
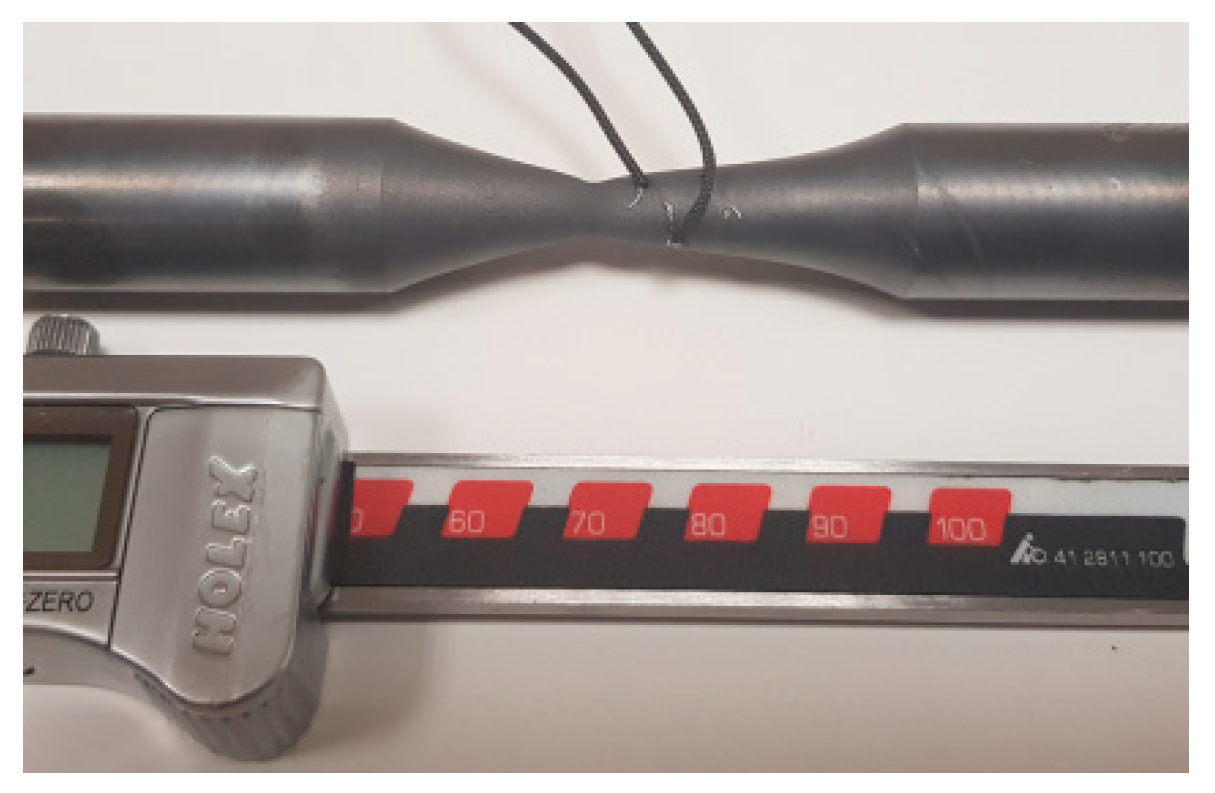
3.3. The Impact of the Applied Conditions of the Deformation Process on the Selected Mechanical Properties of the Tested Steel
4. Directions of Further Research
5. Summary and Conclusions
- The best variant is the V3 variant, which consists of physically replicating the rolling process in a bar rolling mill as multi-sequence non-free torsion; the rolling process in an NTM block (No-Twist Mill) as non-free continuous torsion, with the total deformation equal to the actual deformation occurring during this stage of the technological process; and the rolling process in an RSM block (reducing and sizing mill) as a tension, while maintaining the total deformation value in this block;
- The difference between the ferrite grain size measured in the cross-section of a wire rod and obtained as a result of physical modelling according to the V3 technological variant was 4.3%, whereas the error between the ferrite grain sizes measured in the longitudinal cross-section of a wire rod and obtained as a result of physical modelling for this technological variant was 11.2%. On this basis, it can be concluded that the average ferrite grain size in a wire rod obtained under industrial conditions is similar to the grain size obtained in samples after physical modelling of the rolling process according to variant V3;
- The differences between the most important mechanical parameters determined during a static tensile test of a wire rod under industrial conditions and material after physical modelling were 1.5% for the yield strength, approximately 6.1% for the tensile strength, and approximately 4.1% for the constriction and plasticity reserve;
- The developed research methodology (variant V3) allows for replicating the entire deformation cycle while precisely preserving the temperature value of the deformed material during individual stages of the analyzed technological process and allows for quickly and accurately determining the most important mechanical properties during a static tensile test;
- Using a variable deformation scheme increases the research possibilities of modern torsion plastometers in terms of physical modelling of dynamic thermal and plastic treatment processes.
Funding
Institutional Review Board Statement
Informed Consent Statement
Data Availability Statement
Conflicts of Interest
References
- Grosman, F.; Woźniak, D. Nowoczesne walcownie walcówki (Modern wire rod mills). Hut.-Wiadomości Hut. (Met.-Lurgist-Metall. News) 2001, 3, 97–104. [Google Scholar]
- Laber, K. Problemy fizycznego modelowania procesów walcowania walcówki z dużymi prędkościami (Problems of physical modelling of wire rod rolling processes at high speeds). Obróbka Plast. Met. (Met. Form.) 2016, XXVII, 119–132. [Google Scholar]
- Kuziak, R. Modelowanie zmian struktury i przemian fazowych zachodzących w procesach obróbki cieplno-plastycznej stali. In Modeling of Structure Changes and Phase Transformations Occurring in the Processes of Thermo-Plastic Treatment of Steel; Instytut Metalurgii Żelaza (Institute for Ferrous Metallurgy): Gliwice, Poland, 2005. [Google Scholar]
- Kajzer, S.; Kozik, R.; Wusatowski, R. Wybrane zagadnienia z procesów obróbki plastycznej metali. In Projektowanie Technologii (Selected Problems from Metal Forming Processes. Technology Design). Wyd. Politechniki Śląskiej; Publishing House of the Silesian University of Technology: Gliwice, Poland, 1997. [Google Scholar]
- Zhauyt, A.; Bukayeva, A.; Tursymbekova, Z.; Bulekbayeva, G.; Begendikova, Z.; Mambetaliyeva, G.; Chazhabayeva, M. Development of hot rolling technology using the method of physical modeling. Metalurgija 2021, 60, 387–390. [Google Scholar]
- Erisov, Y.A.; Grechnikov, F.V. Physical modelling of hot rolling for low-density alloy of the Al-Mg-Li-Zr-Zn-Sc System. Metallurgist 2018, 61, 822. [Google Scholar] [CrossRef]
- Liu, C.; Mapelli, C.; Peng, Y.; Barella, S.; Liang, S.; Gruttadauria, A.; Belfi, M. Dynamic recrystallization behavior of low-carbon steel during the flexible rolling process: Modeling and characterization. Steel Res. Int. 2021, 93, 1–15. [Google Scholar] [CrossRef]
- Kuziak, R. Physical simulation of thermomechanical treatment employing gleeble 3800 simulator. In Proceedings of the 15th International Met-Allurgical & Material Conference—METAL 2006, Červený Zámek, Hradec nad Moravicí, Czech Republic, 23–25 June 2006. [Google Scholar]
- Dziedzic, M.; Turczyn, S.; Kuźmiski, Z. Multistage compression modelling during hot rolling of steel products. In Proceedings of the 25th Anniversary International Conference on Metallurgy and Materials—METAL 2016, Brno, Czech Republic, 25–27 May 2016; pp. 279–284. [Google Scholar]
- Siciliano, F.; Allen, B.J.; Rodrigues, S.F.; Jonas, J.J. Physical simulation methods applied to hot rolling of linepipe steels. Mater. Sci. Forum 2018, 941, 438–442. [Google Scholar] [CrossRef]
- Siciliano, F.; Allen, B.J.; Ferguson, D. Hot torsion tests—A reliable rolling simulation method for C-Mn steels. Mater. Sci. Forum 2016, 879, 1783–1787. [Google Scholar] [CrossRef]
- Ferreira, J.C.; Machado, F.R.d.S.; Aranas, C.; Siciliano, F.; Pasco, J.; Reis, G.S.; De Miranda, E.J.P.; Paiva, A.E.M.; Rodrigues, S.F. Physical simulation based on dynamic transformation under hot plate rolling of a Nb-microalloyed steel. Front. Mater. 2021, 8, 716967. [Google Scholar] [CrossRef]
- Berdjane, D.; Fares, M.; Baccouche, M.; Lemmoui, A.; Fares, L. Deformation behavior of a Nb-Ti-V microalloyed steel to achieve the HSLA X80 grade by simulation with a torsion test and pilot hot rolling mill. Metall. Res. Technol. 2012, 109, 465–475. [Google Scholar] [CrossRef]
- Felker, C.A.; Speer, J.G.; De Moor, E.; Findley, K.O. Hot strip mill processing simulations on a Ti-Mo microalloyed steel using hot torsion testing. Metals 2020, 10, 334. [Google Scholar] [CrossRef] [Green Version]
- Kuziak, R.; Pietrzyk, M. Zastosowanie nowoczesnych metod modelowania matematycznego do optymalizacji procesu walcowania blach na gorąco (Application of modern methods of mathematical modeling to optimize the process of hot rolling of sheets). Materiały 2 konferencji Walcowanie i przetwórstwo blach i taśm. In Proceedings of the 2nd Conference Rolling and Processing of Sheets and Strips, Poraj, Poland, 18–20 October 1995; Wydawnictwo Politechniki Częstochowskiej (Publishing House of Czestochowa University of Technology: Czestochowa, Poland, 1995; p. 40. [Google Scholar]
- Laber, K.; Milenin, A.; Markowski, J. Metodyka fizycznego modelowania zjawisk zachodzących w materiale podczas procesu regulowanego walcowania prętów okrągłych (Methodology of physical modelling of phenomena occurring in the material during the process of controlled rolling of round bars). In Polska Metalurgia w Latach 2002–2006 (Polish Metallurgy in 2002–2006); Świątkowski, K.R., Ed.; Wydawnictwo Naukowe AKAPIT (AKAPIT Scientific Publishing House): Kraków, Poland, 2006; pp. 519–526. ISBN 83-910159-4-7. [Google Scholar]
- Laber, K. Nowe Aspekty Wytwarzania Walcówki Ze Stali Do Spęczania Na Zimno (New Aspects of Wire Rod Production from Steel for Cold Heading); Seria: Monografie nr 79 (Series: Monograph No. 79); Czestochowa University of Technology, Faculty of Production Engineering and Materials Technology Publishing House: Częstochowa, Poland, 2018; ISBN 978-83-63989-64-4. ISSN 2391-632X. [Google Scholar]
- Knapiński, M.; Markowski, J. The physical modelling of a normalizing rolling of plates of S460NL1 steel grade. Arch. Mater. Sci. Eng. 2007, 28, 373–376. [Google Scholar]
- Knapiński, M.; Dyja, H.; Kwapisz, M.; Frączek, T. Analysis of the finish rolling temperature influence on super fine-grained constructional steel plate microstructure. Hut. Wiadomości Hut. 2009, 76, 330–335. [Google Scholar]
- Laber, K. Modelowanie i optymalizacja procesów regulowanego walcowania i kontrolowanego chłodzenia wyrobów walcowni bruzdowych (Modelling and optimization of the processes of controlled rolling and controlled cooling of products of groove rolling mills). Metalurgia. In Nowe Technologie i Osiągnięcia (Metallurgy. New Technologies and Achievements); Dyja, H., Ed.; Wydawnictwo Wydziału Inżynierii Procesowej, Materiałowej i Fizyki Stosowanej Politechniki Często-chowskiej (Publishing house of the Faculty of Process Engineering, Materials Engineering and Applied Physics of the Czestochowa University of Technology): Czestochowa, Poland, 2009; pp. 99–122. ISSN 2080-2072. ISBN 978-83-87745-13-4. [Google Scholar]
- Laber, K.; Knapiński, M. Determining conditions for thermoplastic processing guaranteeing receipt of high-quality wire rod for cold upsetting using numerical and physical modelling methods. Materials 2020, 13, 711. [Google Scholar] [CrossRef] [PubMed] [Green Version]
- Laber, K.; Kułakowska, A.; Dyja, H. Physical modelling of the process of rolling AlZn5.5MgCu aluminum alloy bars on the RSP14/40 three-high reeling mill. In Proceedings of the 27th International Conference on Metallurgy and Materials—METAL 2018, Brno, Czech Republic, 23–25 May 2018; pp. 1599–1604, ISBN 978-80-87294-84-0. [Google Scholar]
- Gryc, A.; Bajor, T.; Dyja, H.; Sawicki, S.; Laber, K. Physical modelling of plastic deformation conditions for the rolling proces of AZ31 bars in a three high skew rolling mill. Metalurgija 2014, 53, 489–492. [Google Scholar]
- Wong, S.; Hodgson, P.; Thomson, P. Comparison of torsion and plane-strain compression for predicting mean yield strength in single-and multiple-pass flat rolling using lead to model hot steel. J. Mater. Process. Technol. 1995, 53, 601–616. [Google Scholar] [CrossRef]
- Laber, K. Wpływ historii odkształcenia, stanu odkształcenia oraz prędkości odkształcenia na naprężenie uplastyczniające, mikrostrukturę i własności mechaniczne stali 30MnB4 podczas fizycznego modelowania procesu walcowania prętów. Influence of the strain history, strain state and strain rate on the flow stress, microstructure and mechanical properties of the 30MnB4 steel grade during physical modeling of the bar rolling process. Hut.-Wiadomości Hut. (Metall.-Metall. News) 2016, 83, 232–237. [Google Scholar] [CrossRef]
- Danno, A.; Tanaka, T. Hot forming of stepped steel shafts by wedge rolling with three rolls. J. Mech. Work. Technol. 1984, 9, 21–35. [Google Scholar] [CrossRef]
- Laber, K.; Leszczyńska-Madej, B. Theoretical and experimental analysis of the hot torsion process of the hardly deformable 5XXX series aluminium alloy. Materials 2021, 14, 3508. [Google Scholar] [CrossRef] [PubMed]
- Hodgson, P.D.; Gibbs, R.K. A Mathematical model to predict the mechanical properties of hot rolled C-Mn and microalloyed steels. ISIJ Int. 1992, 32, 1329–1338. [Google Scholar] [CrossRef]
- Sawada, Y.; Foley, R.P.; Thompson, S.W.; Krauss, G. 35th MWSP Conference Proceedings; ISS-AIME: Pitsburgh, PA, USA, 1994; p. 263. [Google Scholar]
- PN-EN 10263-4:2004; Stal-Walcówka, pręty i drut do spęczania i wyciskania na zimno. Część 4: Warunki techniczne dostawy stali do ulepszania cieplnego (Wire rod, rods and wire for upsetting and cold extrusion. Part 4: Technical delivery conditions for steel for heat treatment); Polska Norma (Polish Standard). Polski Komitet Normalizacyjny (Polish Committee for Standardi-zation): Warszawa, Poland, 2004.
- Dobrzański, L.A. Metaloznawstwo Z Podstawami Nauki O Materiałach (Metal Science with the Basics of Materials Science); Wydawnictwa Naukowo-Techniczne (Scientific and Technical Publishers): Warszawa, Poland, 1996. [Google Scholar]
- Gorbanev, A.A.; Zhuchkov, S.M.; Filippov, V.V.; Timoshpolskij, V.I.; Steblov, A.B.; Junakov, A.M.; Tishhenko, V.A. Teoreticheskie I Tekhnologicheskie Osnovy Vysokoskorostnoj Prokatki Katanki (Theoretical and Technological Basis of High Speed Wire Rod Production); Izdatelstvo Vyshehjshaja Shkola (College Publishing House): Minsk, Ukraine, 2003. [Google Scholar]
- Kajzer, S.; Kozik, R.; Wusatowski, R. Walcowanie Wyrobów Długich. Technologie Walcownicze (Rolling of Long Products. Rolling Technologies); Wyd. Politechniki Śląskiej (Publishing house of the Silesian University of Technology): Gliwice, Poland, 2004. [Google Scholar]
- PN-EN 10025; Wyroby Walcowane Na Gorąco Z Niestopowych Stali Konstrukcyjnych. Warunki Techniczne Dostawy (Hot Rrolled Products of Non-Alloy Constructional Steels. Technical Conditions of Delivery); Polska Norma (Polish Standard). Polski Komitet Normalizacyjny (Polish Committee for Standardization): Warszawa, Poland, 2002.
- Paduch, J.; Szulc, W. (Eds.) Kształtowanie nowych jakości oraz racjonalizacja kosztów wytwarzania wyrobów stalowych dostosowanych do wymagań konkurencyjnych rynku. In CZ. 3: Dostosowanie Technologii Hutniczych do Aplikacyjnych i Jakościowych Potrzeb Rynku (Shaping New Qualities and Rationalizing of the Steel Products Production Costs Adapted to the Market’s Competitive Requirements. Part 3: Adaptation of Metallurgical Technologies to the Application and Quality Needs of the Market); Works of the Iron Metallurgy Institute: Gliwice, Poland, 2000; Volume 52, pp. 17, 19, 24–25. [Google Scholar]
- Grosman, F.; Hadasik, E. Technologiczna Plastyczność Metali, Badania Plastometryczne (The Technological Plasticity of Metals, Plastometric Testing); Publishing house of the Silesian University of Technology: Gliwice, Poland, 2005; pp. 11–12. ISBN 83-7335-204-X. [Google Scholar]
- Horsinka, J.; Drozd, K.; Kliber, J.; Ostroushko, D.; Černý, M.; Mamuzic, I. Strain and strain rate in torsion test. In Proceedings of the 20th International Conference on Metallurgy and Materials—METAL 2011, Brno, Czech Republic, 18–20 May 2011; Publisher TANGER Ltd.: Ostrava, Czech Republic, 2011; pp. 383–389, ISBN 978-80-87294-24-6. ISSN 2694-9296. [Google Scholar]
- Dyja, H.; Krakowiak, M. Kronika 60-Lecia—Od Wydziału Metalurgicznego do Wydziału Inżynierii Procesowej, Materiałowej i Fizyki Stosowanej (The 60th Anniversary Chronicle—From the Faculty of Metallurgy to the Faculty of Process, Materials Engineering and Applied Physics); Wydawnictwo Wydziału Inżynierii Procesowej, Materiałowej i Fizyki Stosowanej Politechniki Częstochowskiej (Czestochowa University of Technology, Faculty of Process, Materials Engineering and Applied Physics Publishing House): Częstochowa, Poland, 2010. [Google Scholar]
- PN-84/H-04507/01; Metale—Metalograficzne badania wielkości ziarna. Mikroskopowe metody określenia wielkości ziarna (Metals—Metallographic tests of grain size. Microscopic methods of determining grain size); Polski Komitet Normalizacji, Miar i Jakości (Polish Committee for Standardization, Measurement and Quality). Polska Norma (Polish Standard), Wydawnictwa Normalizacyjne Alfa (Alfa Standardization Publishing House): Warszawa, Poland, 1985.
- Laber, K.; Dyja, H.; Koczurkiewicz, B.; Sawicki, S. Fizyczne modelowanie procesu walcowania walcówki ze stali 20MnB4 (Physical modeling of the wire rod rolling process of 20MnB4 steel). In Proceedings of the VI Konferencja Naukowa WALCOWNICTWO 2014. Procesy-Narzędzia-Materiały (VI Scientific Conference Rolling Mill Practice 2014. Process-es-Tools-Materials), Ustroń, Poland, 20–22 October 2014; pp. 37–42. [Google Scholar]
- Dyja, H.; Gałkin, A.; Knapiński, M. Reologia Metali Odkształcanych Plastycznie (Rheology of Plastically Deformed Metals); Seria: Monografie nr 190 (series: Monograph No. 190); Publishing house of the Czestochowa University of Technology: Częstochowa, Poland, 2010; pp. 160–165, 203, 217–222. ISBN 978-83-7193-471-1. ISSN 0860-5017. [Google Scholar]


| Steel Grade | Steel Number | Melt Analysis, Mass% | ||||||
|---|---|---|---|---|---|---|---|---|
| 20MnB4 | 1.5525 | C | Si | Mn | Pmax, Smax | Cr | Cumax | B |
| 0.18–0.23 | ≤0.30 | 0.90–1.20 | 0.025 | ≤0.30 | 0.25 | 0.0008–0.005 | ||
| Pass Number | Temperature, T (°C) | Break Time After Deformation, t (s) | |||
|---|---|---|---|---|---|
| 1 | 1086/1084 | 0.18 | 0.16 | 29.3 | 26.47 |
| 2 | 1057/1056 | 0.39 | 0.35 | 42.9 | 19.89 |
| 3 | 1037/1035 | 0.28 | 0.39 | 60.5 | 29.98 |
| 4 | 1023/1022 | 0.59 | 0.96 | 69.9 | 11.33 |
| 5 | 1010/1008 | 0.46 | 1.15 | 74.9 | 8.91 |
| 6 | 995/993 | 0.50 | 2.02/1.15 | 79.8 | 6.13 |
| 7 | 997/996 | 0.45 | 2.45/1.15 | 84.9 | 11.65 |
| 8 | 1005/1004 | 0.48 | 4.71/1.15 | 72.2 | 3.35 |
| 9 | 1009/1009 | 0.44 | 5.57/1.15 | 90.0 | 2.63 |
| 10 | 1022/1022 | 0.54 | 10.39/1.15 | 90.7 | 1.85 |
| 11 | 1030/1029 | 0.48 | 12.07/1.15 | 93.6 | 3.09 |
| 12 | 1049/1048 | 0.50 | 20.53/1.15 | 73.5 | 2.28 |
| 13 | 1052/1049 | 0.51 | 24.74/1.15 | 84.8 | 3.18 |
| 14 | 1069/1068 | 0.50 | 46.34/1.15 | 69.9 | 1.35 |
| 15 | 1072/1070 | 0.41 | 47.13/1.15 | 83.0 | 1.11 |
| 16 | 1087/1080 | 0.51 | 79.93/1.15 | 80.1 | 0.90 |
| 17 | 1091/1092 | 0.31 | 70.63/1.15 | 78.9 | 8.52/55.0 |
| Pass Number | Temperature, T (°C) | Break Time after Deformation, t (s) | |||
|---|---|---|---|---|---|
| NTM | |||||
| 18 | 851/849 | 0.49 | 156.02/1.15 | 106.4 | 0.091/2.0 |
| 19 | 860/860 | 0.51 | 171.25/1.15 | 141.8 | 0.074/2.0 |
| 20 | 867/866 | 0.56 | 276.33/1.15 | 147.7 | 0.058/2.0 |
| 21 | 883/883 | 0.54 | 303.93/1.15 | 143.3 | 0.048/2.0 |
| 22 | 892/890 | 0.56 | 477.46/1.15 | 145.3 | 0.037/2.0 |
| 23 | 908/908 | 0.53 | 584.28/1.15 | 139.1 | 0.032/2.0 |
| 24 | 918/918 | 0.62 | 991.51/1.15 | 131.4 | 0.024/3.0 |
| 25 | 941/942 | 0.57 | 1042.10/1.15 | 106.3 | 0.020/3.0 |
| 26 | 956/955 | 0.62 | 1753.46/1.15 | 97.40 | 0.015/3.0 |
| 27 | 982/983 | 0.56 | 1809.67/1.15 | 86.5 | 0.82/45.0 |
| RSM | |||||
| 28 | 845/842 | 0.53 | 2368.05/1.15 | 96.0 | 0.012/3.0 |
| 29 | 873/874 | 0.48 | 2275.43/1.15 | 126.9 | 0.007/3.0 |
| 30 | 894/893 | 0.13 | 1853.11/1.15 | 111.9 | 0.004/0.9 |
| 31 | 895/894 | 0.10 | 1680.68/1.15 | 42.0 | |
| Pass Number | Temperature, T (°C) | Break Time after Deformation, t (s) | |||
|---|---|---|---|---|---|
| NTM | |||||
| 18 | 851–982/851–883 | 5.56 | 156.02–1809.67/40 | 222.8 | 0.82/6.0 |
| RSM | |||||
| 19 | 845–895/853–895 | 1.24 | 2368.05–1680.68/10 | 145.4 | |
| Pass Number | Temperature, T (°C) | Break Time after Deformation, t (s) | |||
|---|---|---|---|---|---|
| NTM (torsion) | |||||
| 18 | 851–982/856–909 | 5.56 | 156.02–1809.67/40 | 191.0 | 0.82/6.0 |
| RSM (tension) | |||||
| 19 | 845–895/858–878 | 1.24 | 2368.05–1680.68/10 | 503.0 | |
| Points (According to Figure 6) | Variant V1 | Variant V2 | Variant V3 | |||
|---|---|---|---|---|---|---|
| Ferrite Grain Size, Dα (μm) | Hardness (HV) | Ferrite Grain Size, Dα (μm) | Hardness (HV) | Ferrite Grain Size, Dα (μm) | Hardness (HV) | |
| P.1 | 8.14 | 179.75 | 7.31 | 182.37 | 8.31 | 158.30 |
| P. 1-2 | 6.38 | 206.83 | 6.73 | 203.90 | 7.31 | 209.20 |
| P. 1-3 | 6.27 | 210.70 | 6.54 | 209.17 | 6.99 | 211.90 |
| P. 1-4 | 6.17 | 212.78 | 6.27 | 210.77 | 6.94 | 215.30 |
| P. 1-5 | 5.92 | 216.33 | 6.13 | 213.13 | 6.64 | 221.48 |
| P.1 | 8.14 | 179.75 | 7.31 | 182.37 | 8.31 | 158.30 |
| P. 2-2 | 6.46 | 208.83 | 6.95 | 198.43 | 7.55 | 204.20 |
| P. 2-3 | 6.12 | 209.17 | 6.85 | 205.33 | 7.29 | 211.40 |
| P. 2-4 | 5.97 | 210.97 | 6.60 | 206.40 | 7.21 | 212.83 |
| P. 2-5 | 5.85 | 214.90 | 5.70 | 213.43 | 6.99 | 220,65 |
| P.1 | 8.14 | 179.75 | 7.31 | 182.37 | 8.31 | 158.30 |
| P. 3-2 | 6.00 | 206.03 | 7.00 | 207.23 | 6.93 | 205.50 |
| P. 3-3 | 5.84 | 211.03 | 6.25 | 210.20 | 6.93 | 209.77 |
| P. 3-4 | 5.51 | 215.13 | 6.18 | 210.87 | 6.19 | 215.50 |
| P. 3-5 | 5.48 | 215.97 | 6.17 | 213.00 | 6.16 | 221.80 |
| Average value | 6.43 | 205.19 | 6.62 | 203.26 | 7.20 | 202.30 |
| Research Variant of Physical Modelling | Mechanical Properties | |||||||||
|---|---|---|---|---|---|---|---|---|---|---|
| Calculated Using Formulas: | Static Tensile Test | |||||||||
| (4) | (5) | (4), (5) | (6) | (7) | (6), (7) | |||||
| Yield Strength, YS (MPa) | Ultimate Tensile Strength, UTS (MPa) | YS/UTS | Yield Strength, YS (MPa) | Ultimate Tensile Strength, UTS (MPa) | YS/UTS | Yield Strength, YS (MPa) | Ultimate Tensile Strength, UTS (MPa) | YS/UTS | Relative Reduction of Area at Fracture, Z (%) | |
| Variant V1 | 420 | 653 | 0.64 | 426 | 566 | 0.75 | 429 | 605 | 0.71 | 62.03 |
| Variant V2 | 415 | 648 | 0.64 | 422 | 564 | 0.75 | 422 | 598 | 0.71 | 57.49 |
| Variant V3 | 412 | 645 | 0.64 | 412 | 558 | 0.74 | 418 | 591 | 0.71 | 66.93 |
| Physical modelling in compression test [17,21] | 401 | 632 | 0.63 | 397 | 550 | 0.72 | ||||
| Industrial research results |  | 412 | 557 | 0.74 | 69.80 | |||||
Disclaimer/Publisher’s Note: The statements, opinions and data contained in all publications are solely those of the individual author(s) and contributor(s) and not of MDPI and/or the editor(s). MDPI and/or the editor(s) disclaim responsibility for any injury to people or property resulting from any ideas, methods, instructions or products referred to in the content. |
© 2023 by the author. Licensee MDPI, Basel, Switzerland. This article is an open access article distributed under the terms and conditions of the Creative Commons Attribution (CC BY) license (https://creativecommons.org/licenses/by/4.0/).
Share and Cite
Laber, K.B. Innovative Methodology for Physical Modelling of Multi-Pass Wire Rod Rolling with the Use of a Variable Strain Scheme. Materials 2023, 16, 578. https://doi.org/10.3390/ma16020578
Laber KB. Innovative Methodology for Physical Modelling of Multi-Pass Wire Rod Rolling with the Use of a Variable Strain Scheme. Materials. 2023; 16(2):578. https://doi.org/10.3390/ma16020578
Chicago/Turabian StyleLaber, Konrad Błażej. 2023. "Innovative Methodology for Physical Modelling of Multi-Pass Wire Rod Rolling with the Use of a Variable Strain Scheme" Materials 16, no. 2: 578. https://doi.org/10.3390/ma16020578
APA StyleLaber, K. B. (2023). Innovative Methodology for Physical Modelling of Multi-Pass Wire Rod Rolling with the Use of a Variable Strain Scheme. Materials, 16(2), 578. https://doi.org/10.3390/ma16020578