

Microstructure, Mechanical Properties and Corrosion Performance of Laser-Welded NiTi Shape Memory Alloy in Simulated Body Fluid

 ,
,  ,
,  ,
,  , and
, and
Abstract
1. Introduction
2. Materials and Methods
3. Results and Discussion
4. Conclusions
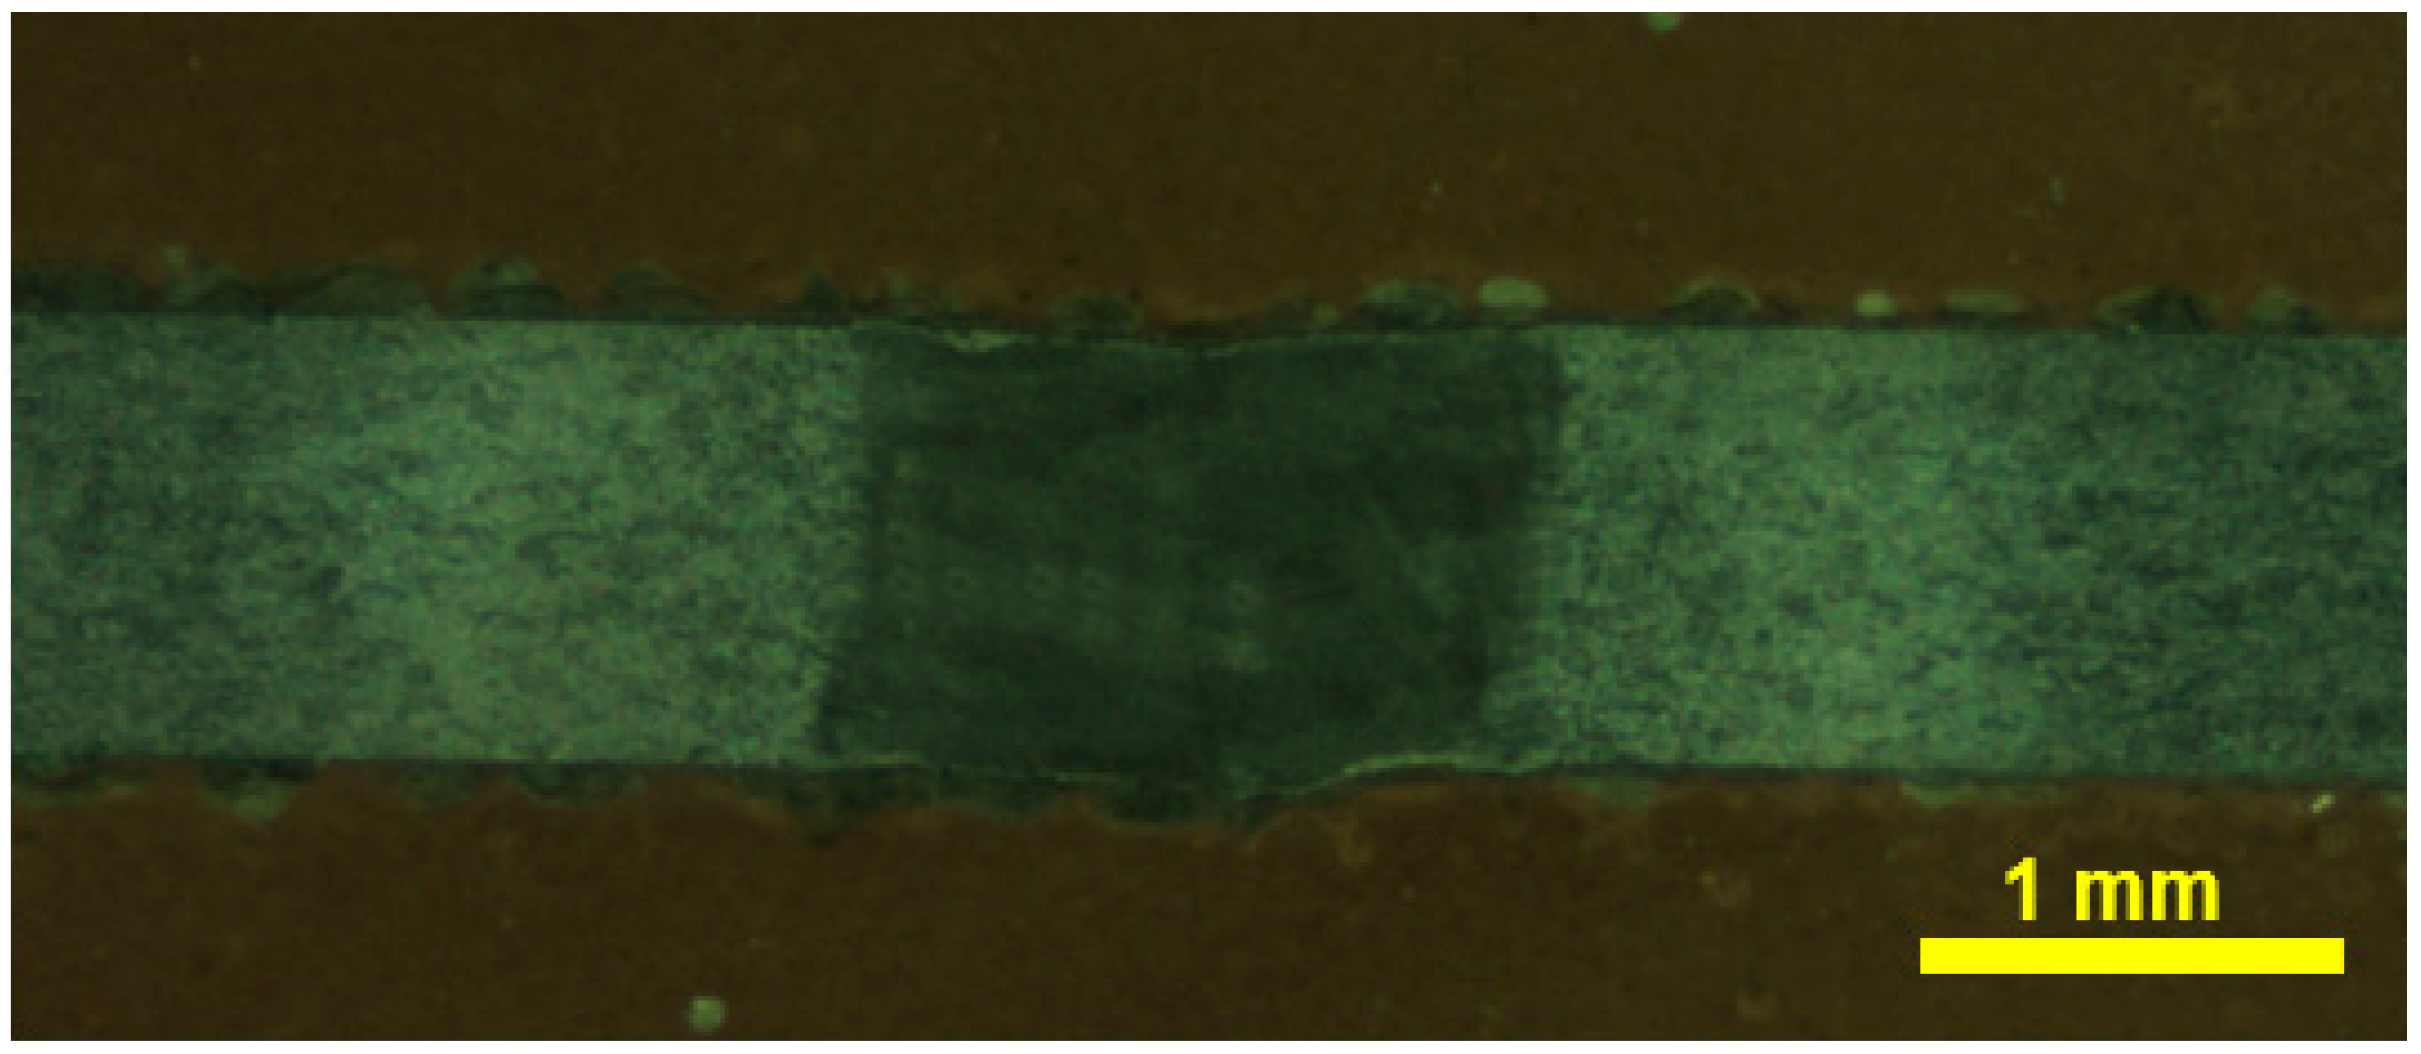
- The NiTi shape memory alloy sheets were successfully welded using laser-welding. A quality weld bead was obtained with a full penetration depth using the following process variables: laser power = 950 W; focal position = +0.50 mm; welding speed = 200 mm/min; shielding gas flow rate = 15 L/min.
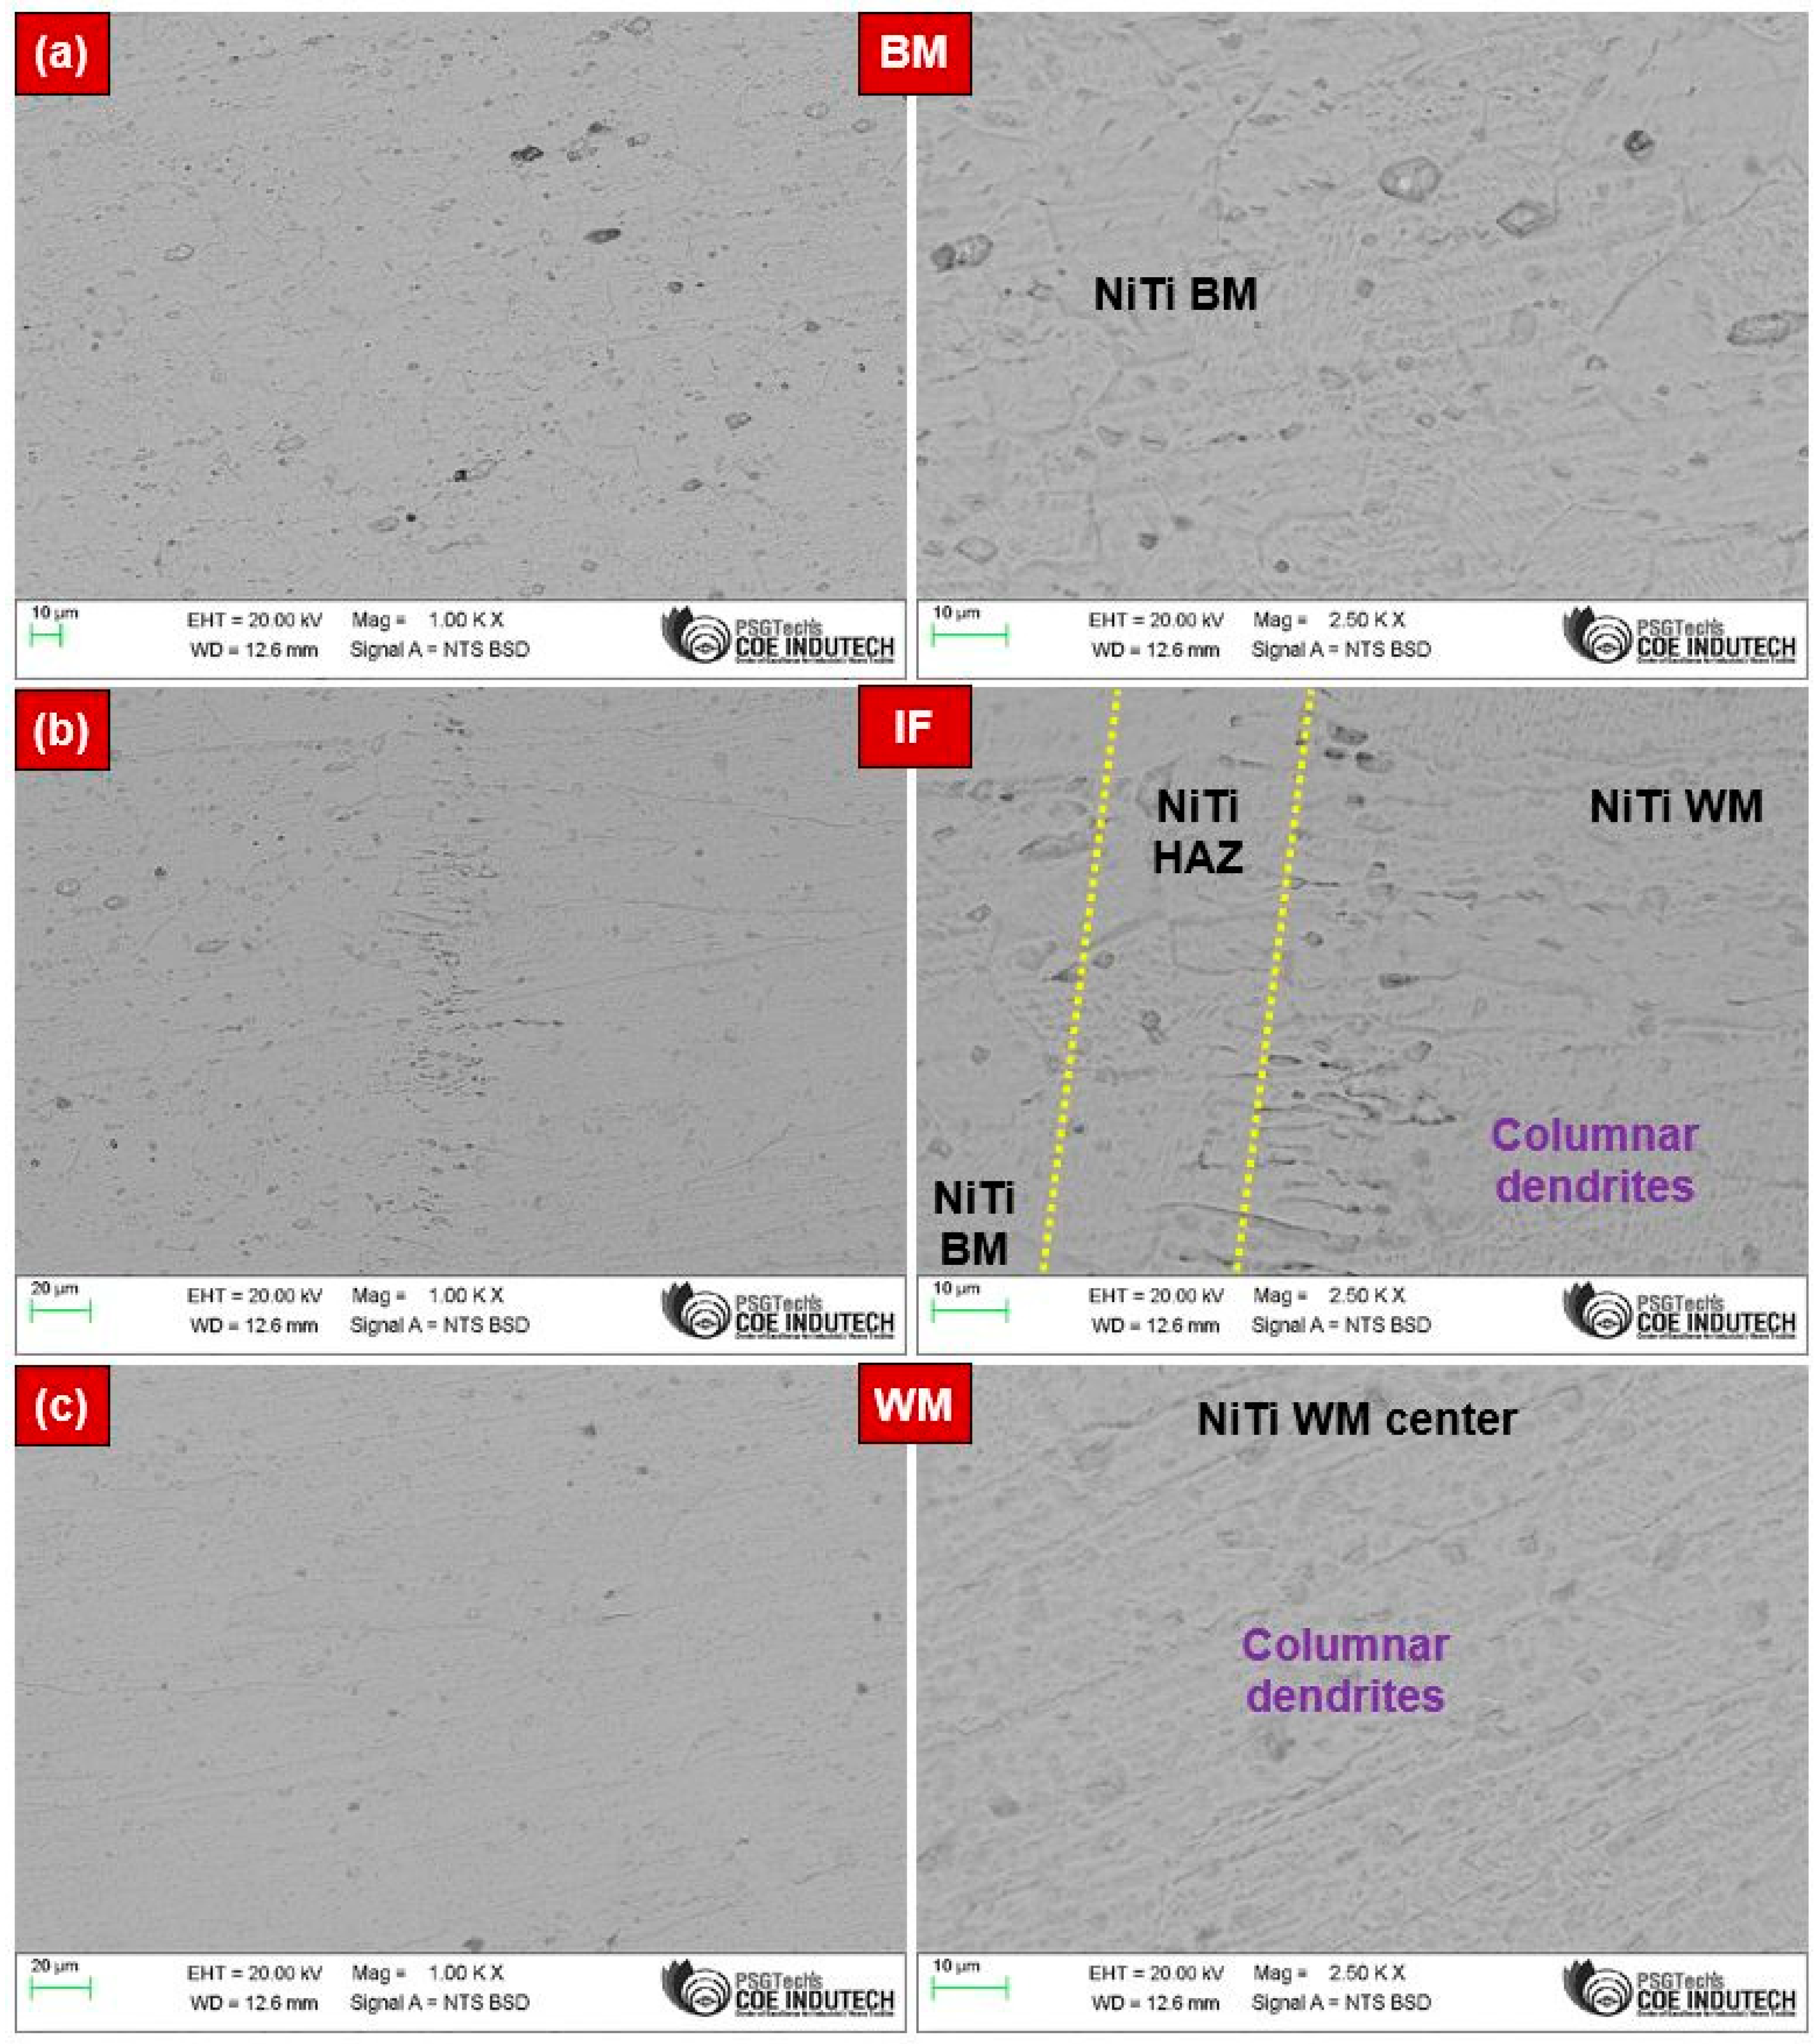
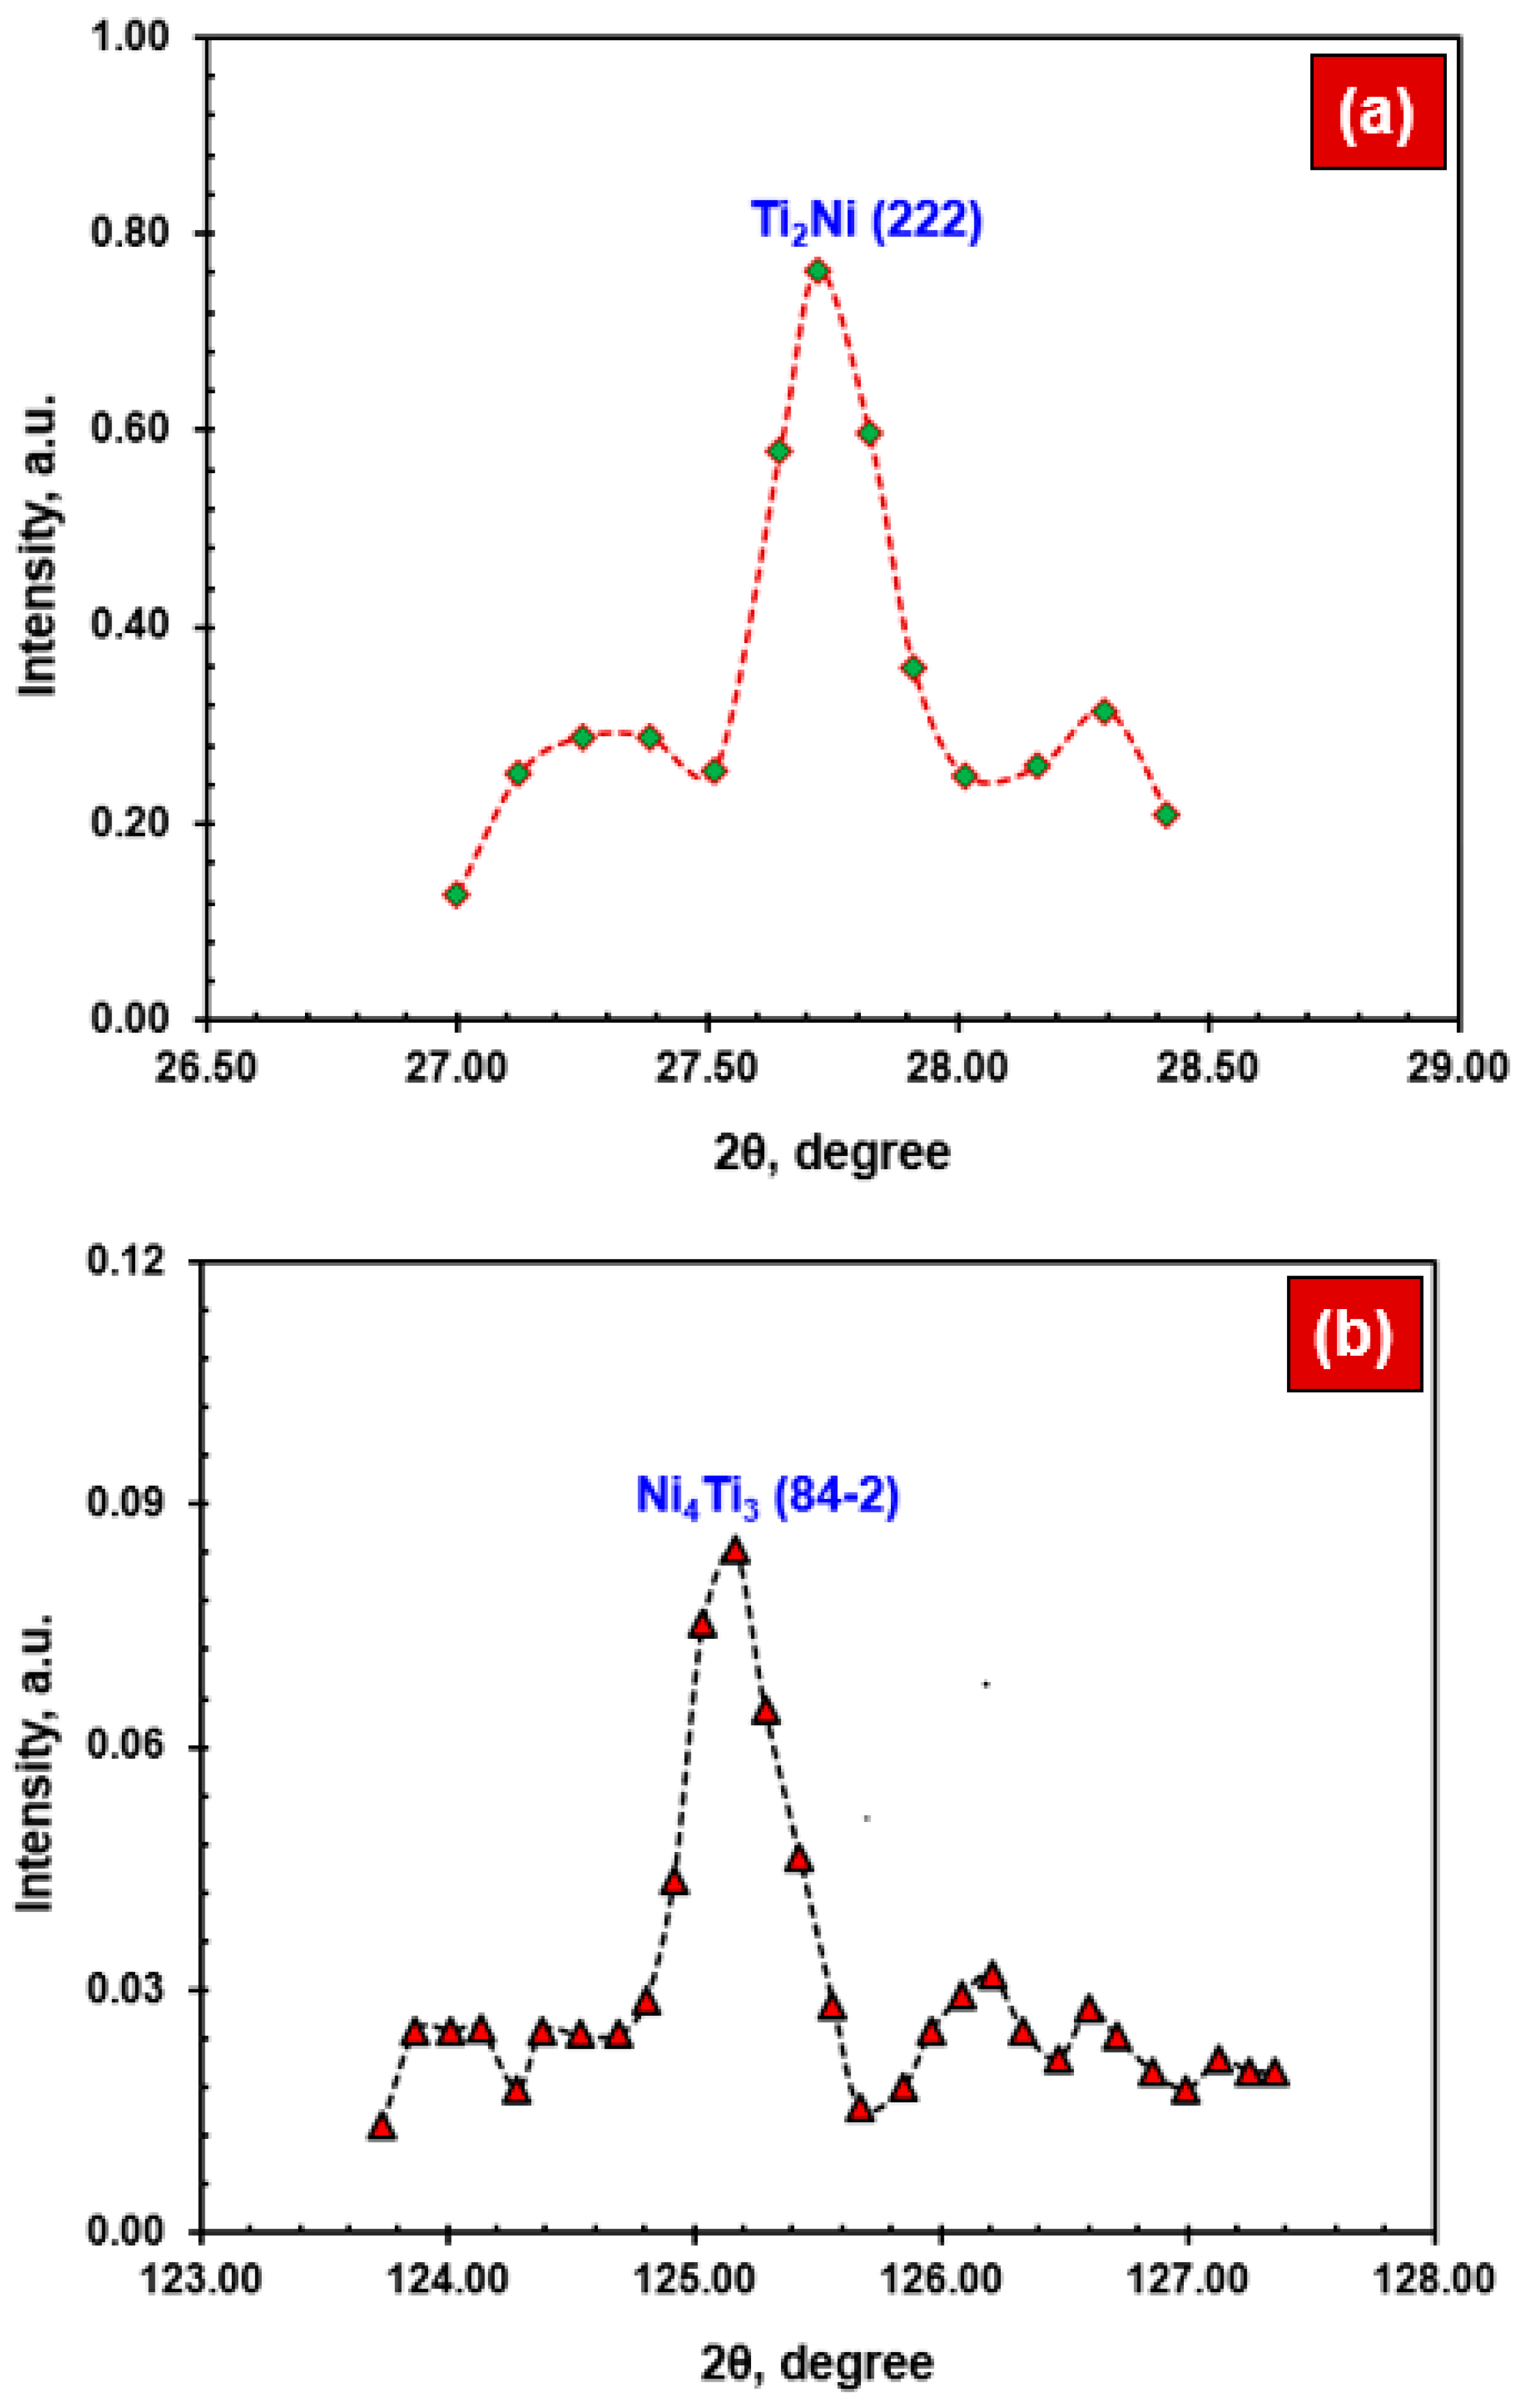
- The NiTi BM mainly comprised B2 austenite phases within the austenitic matrix, while the NiTi WM showed the existence of B2 austenite phases along with coarse dendrites and precipitates such as Ti2Ni and Ni4Ti3. A narrow HAZ was noticed, i.e., <50 µm.
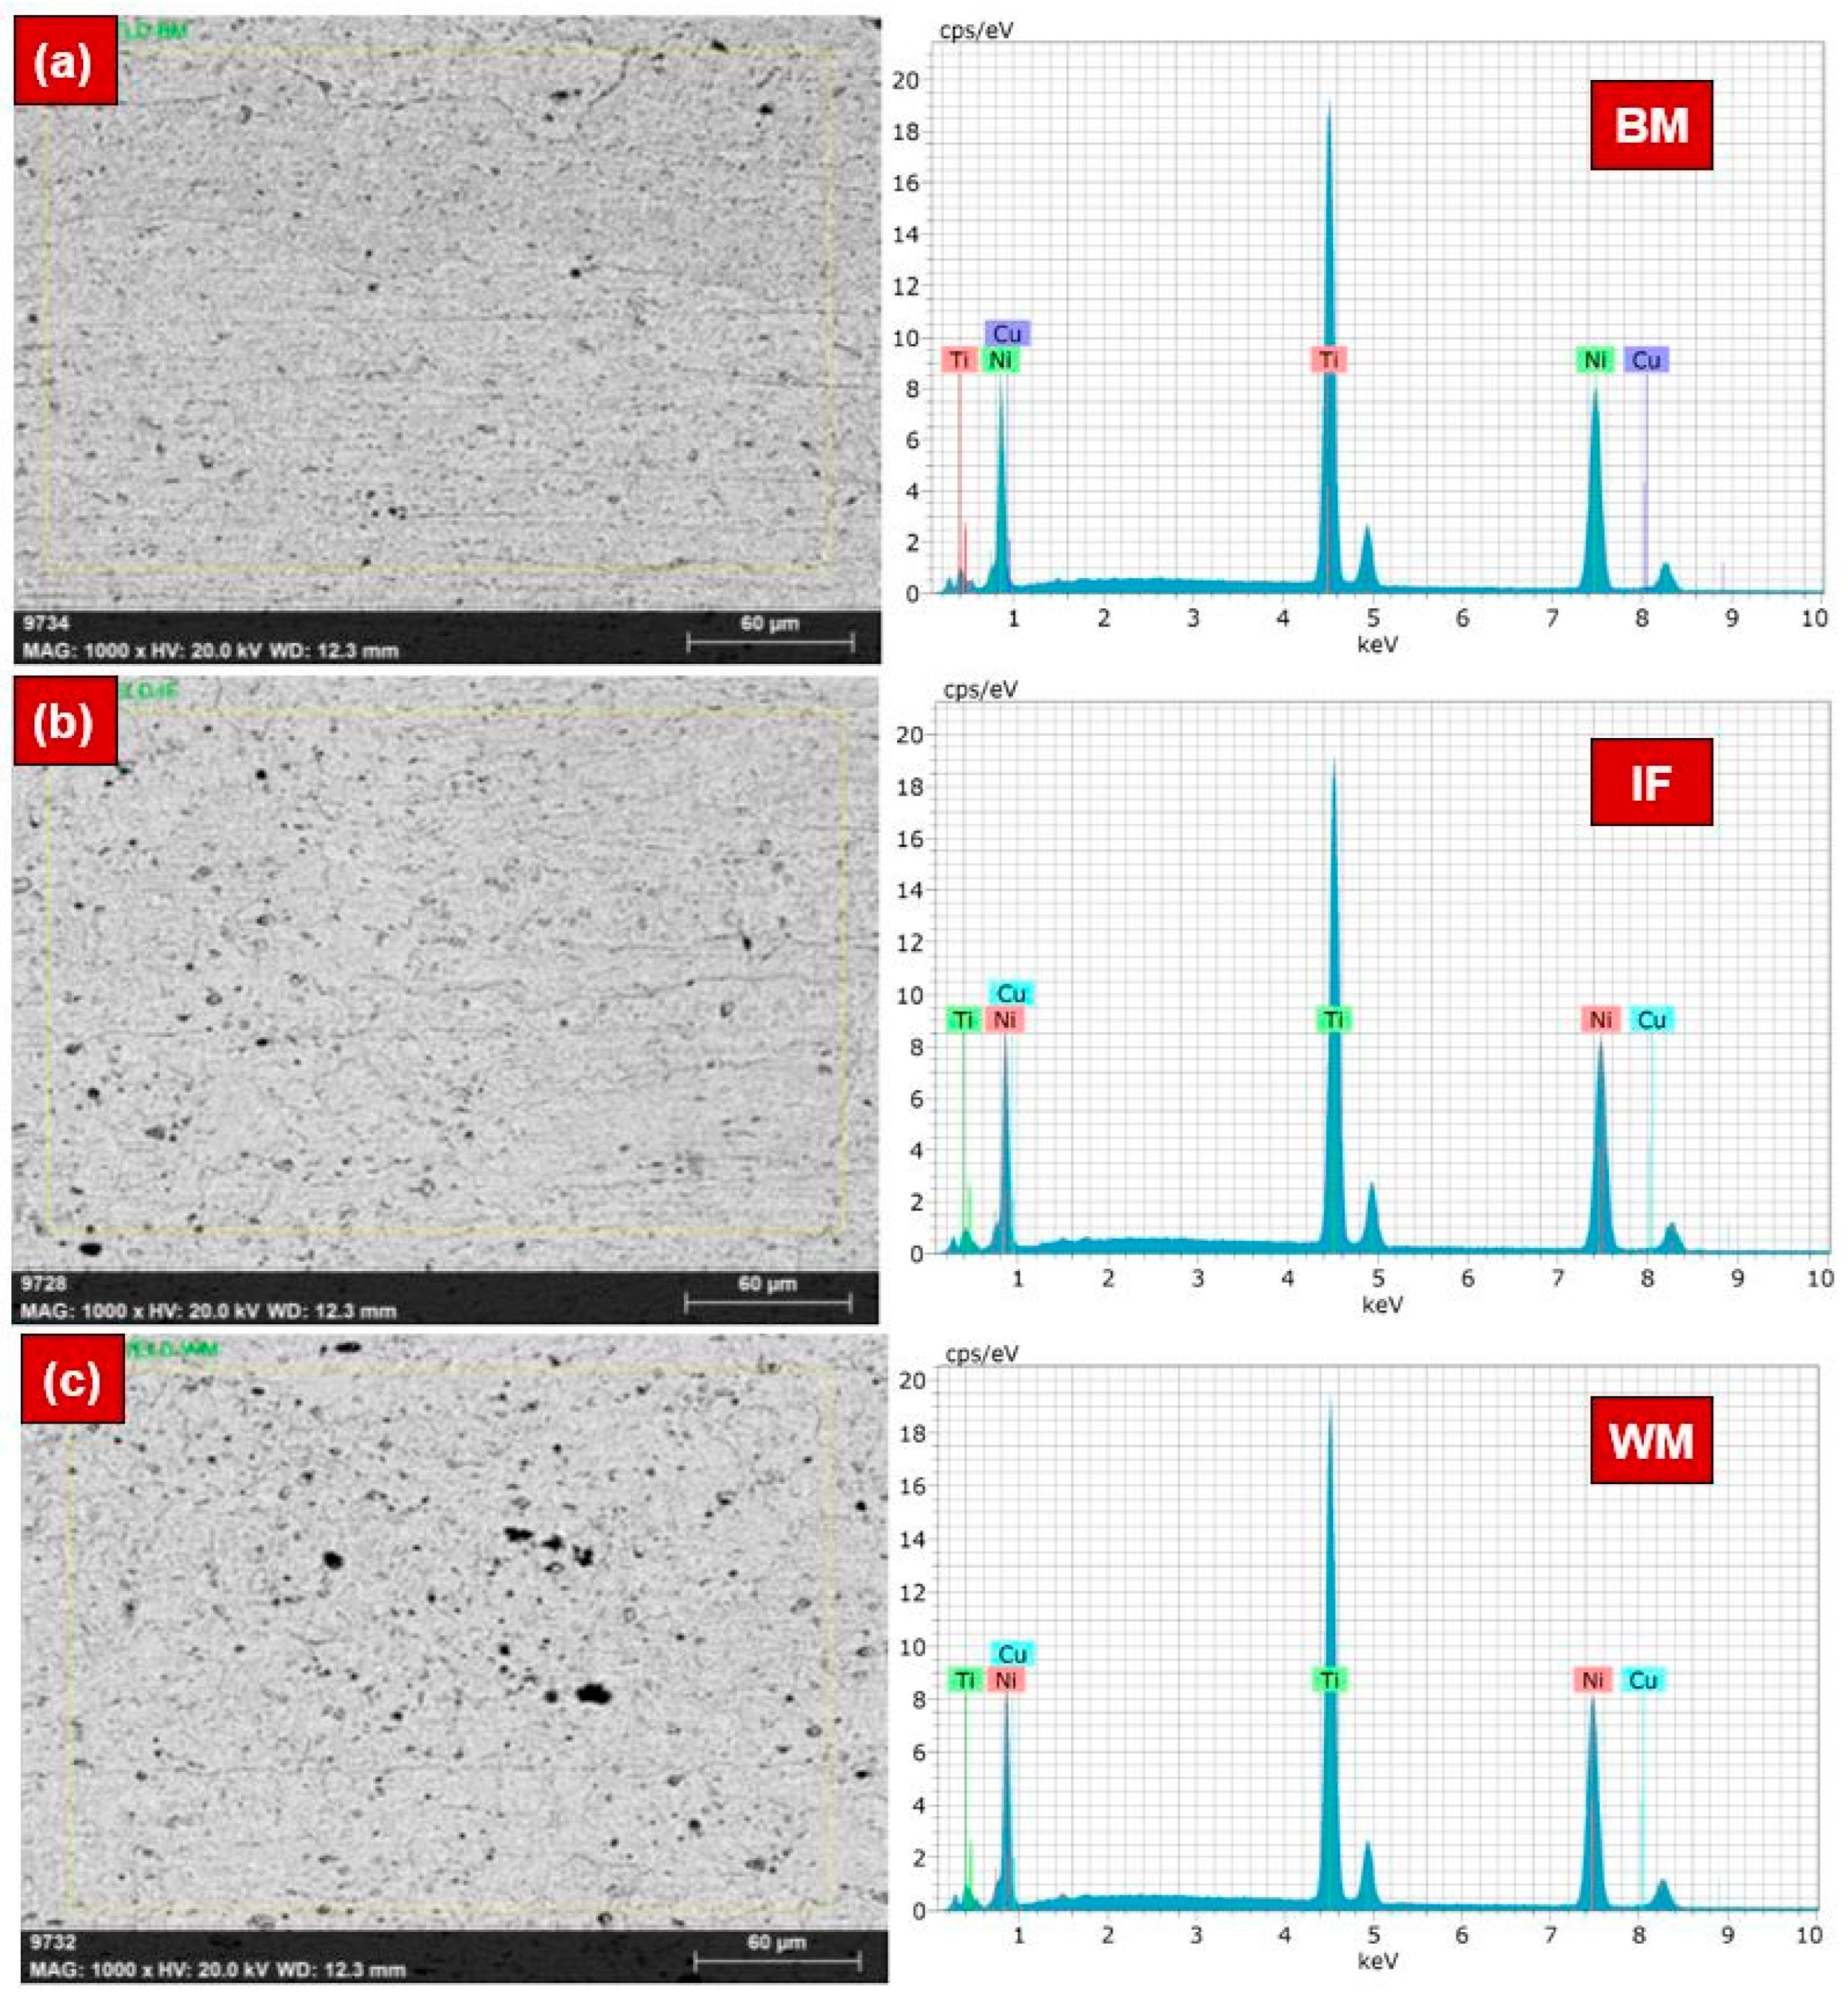
- EDS area mapping confirmed the minor difference in the wt% of Ni and Ti in the WM, while the fraction of Ni and Ti in the BM and HAZ was almost identical. EDS line-mapping highlighted the existence of intermetallic precipitates within the WM region.
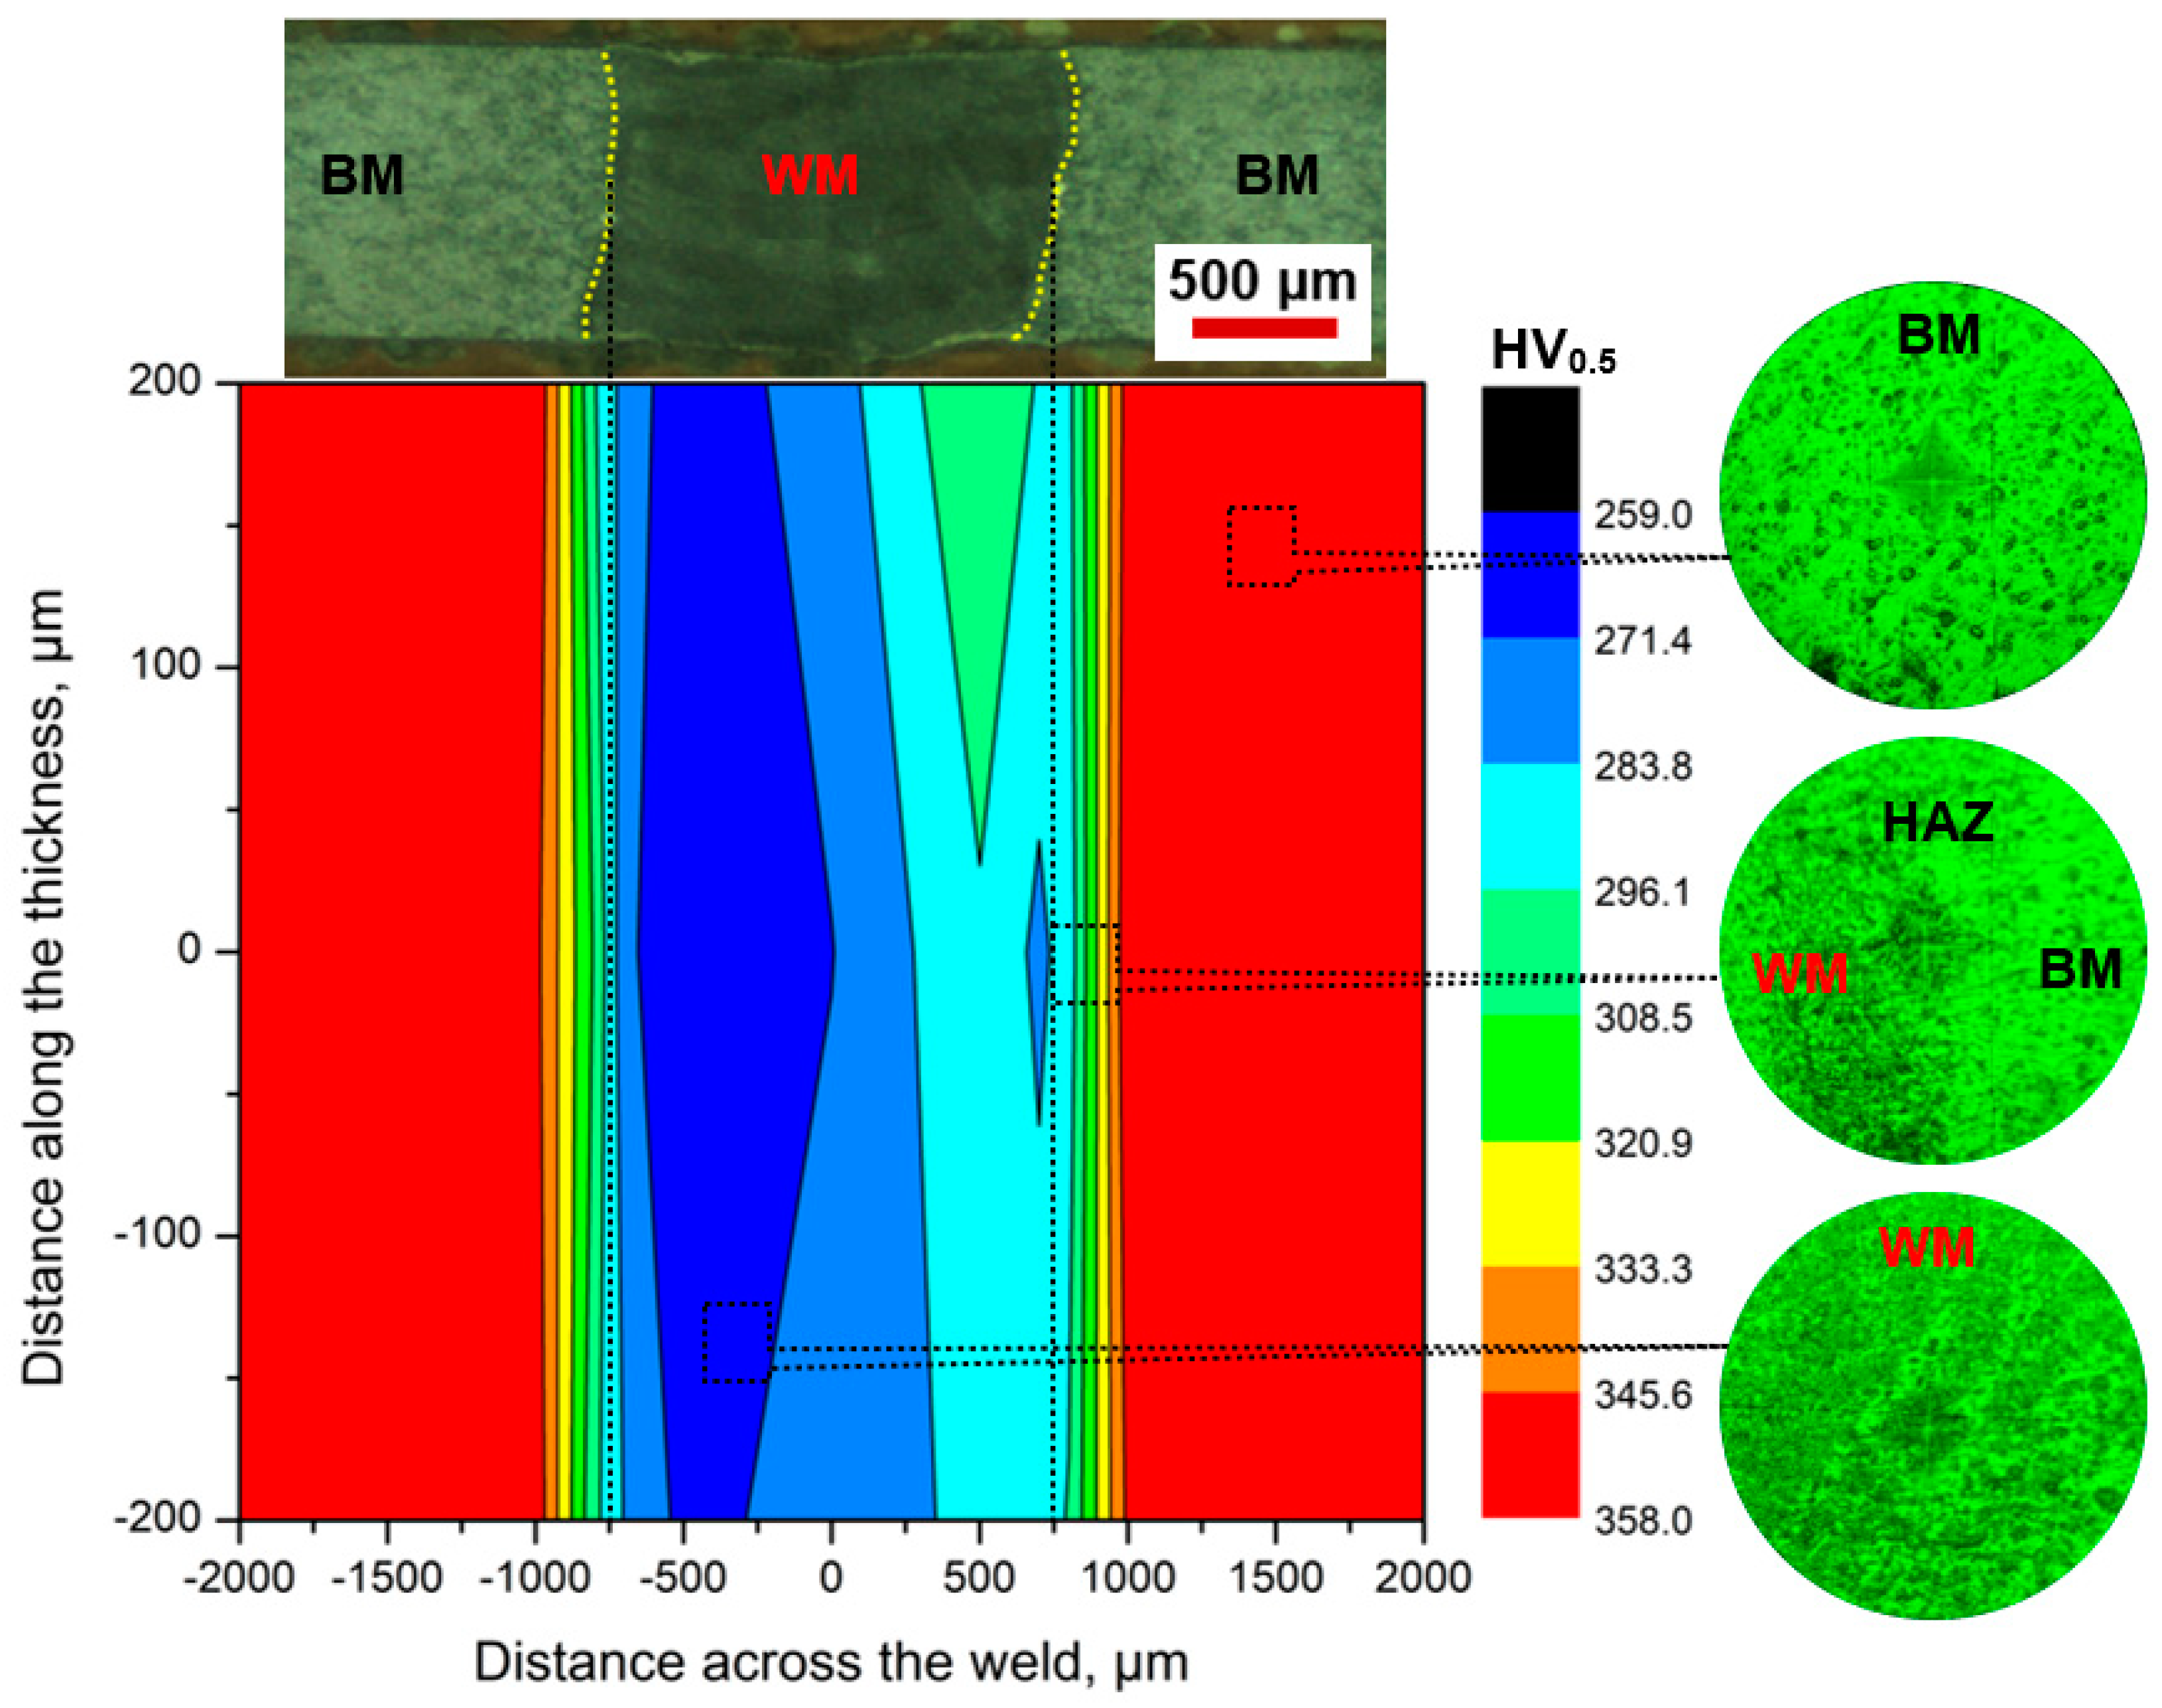
- The microhardness measurements showed an increasing trend from the WM center to the BM. The average hardness in the BM was 352 ± 5 HV, while the hardness in the HAZ and WM ranged between 275 and 307 HV and 265 and 287 HV, respectively.
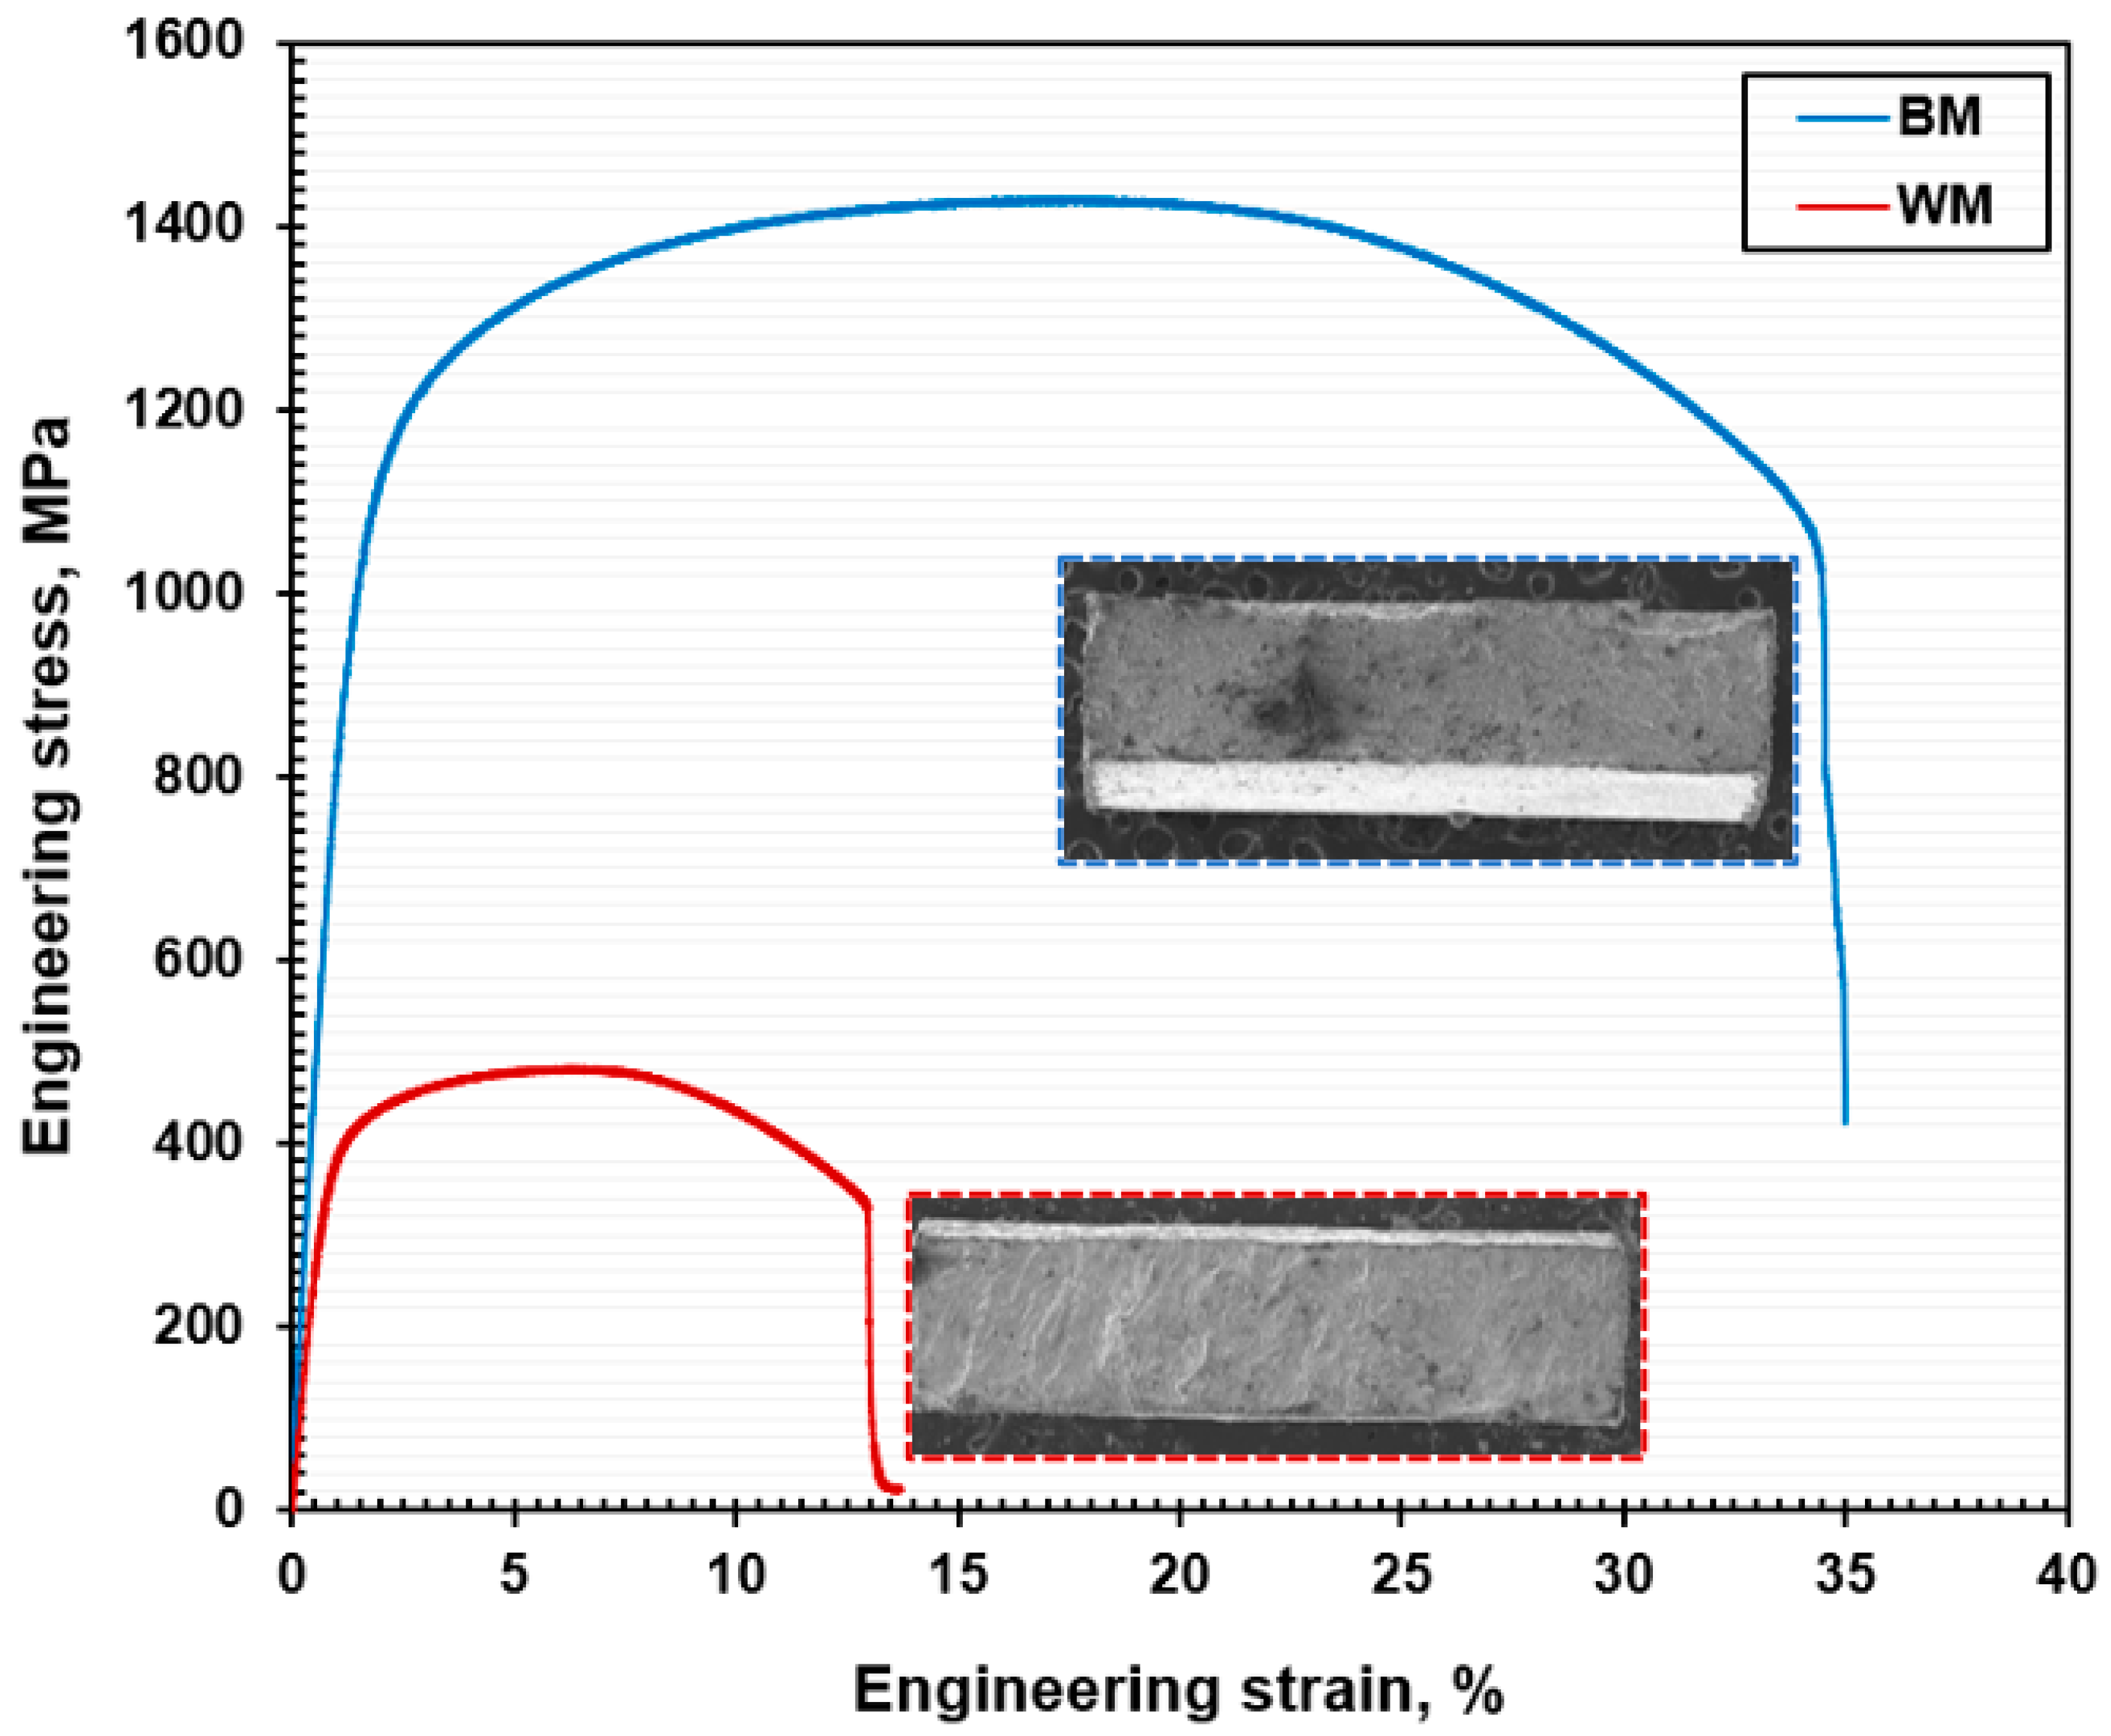
- Uni-axial tensile tests revealed the reduction in tensile properties of the NiTi WM sample compared to the NiTi BM. The joint efficiency was approximately 34%, and this reduction in tensile strength is corroborated by the coarse dendrites in the FZ and the precipitation of intermetallic phases.
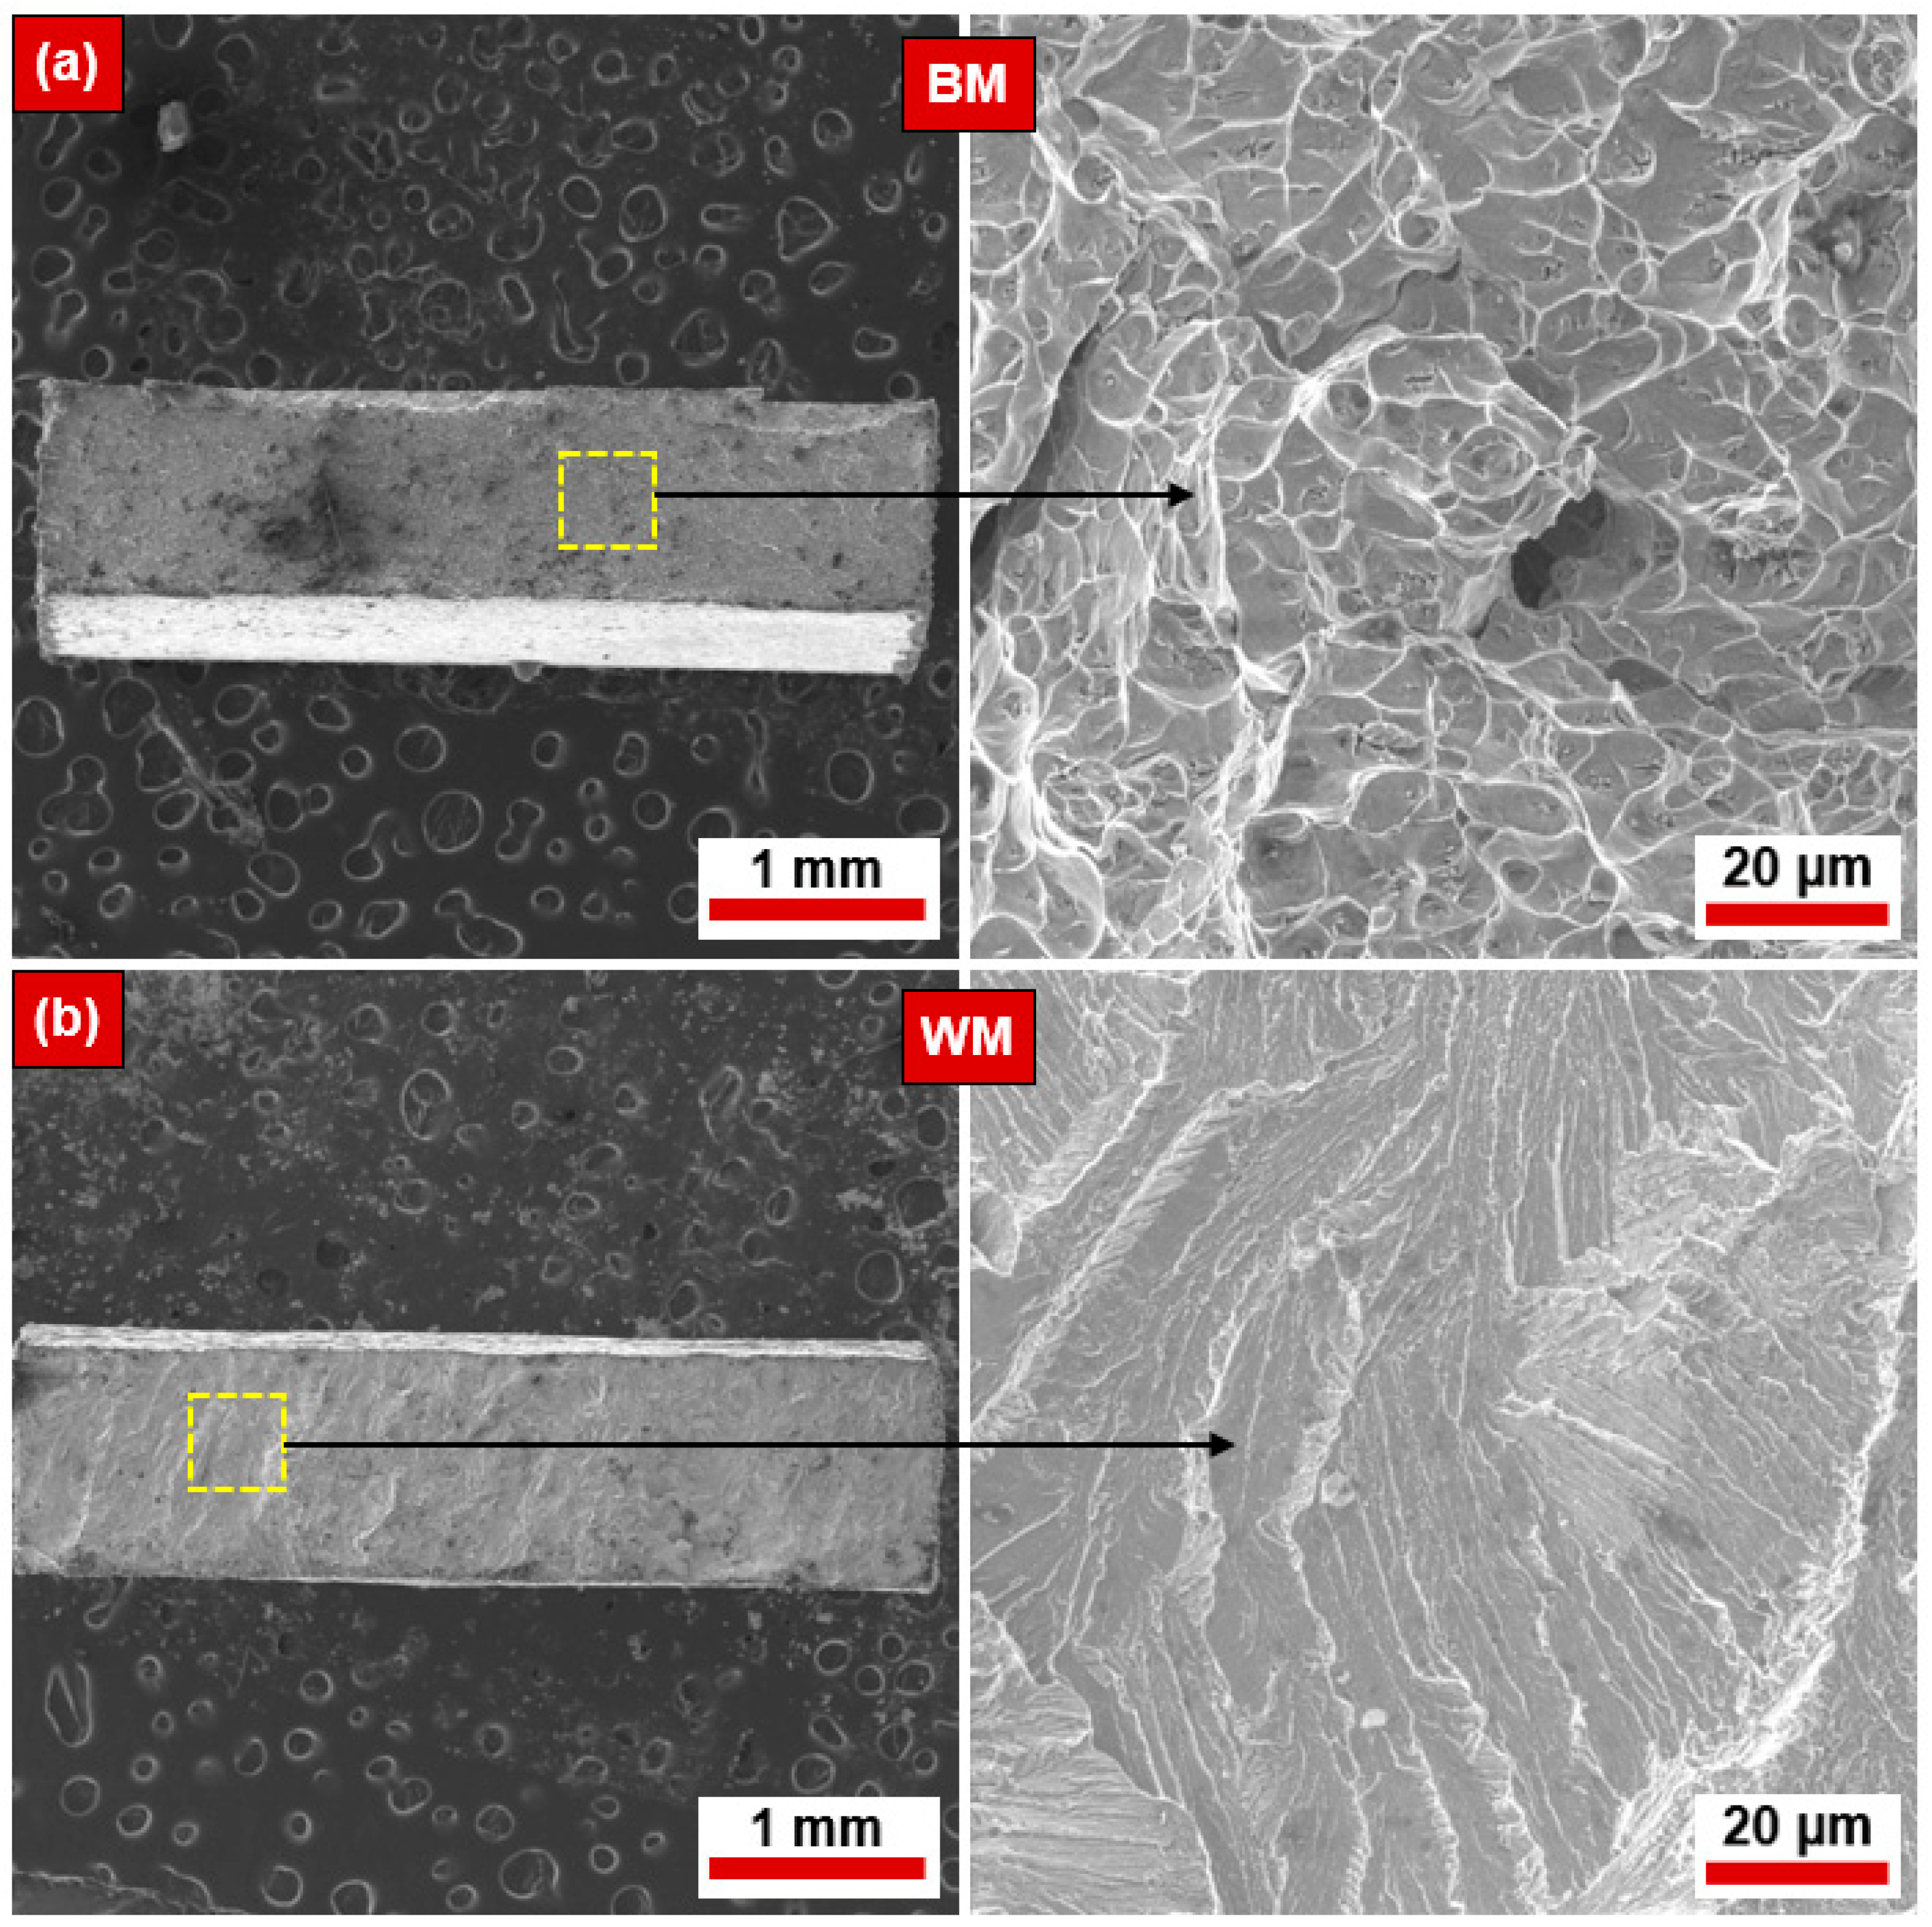
- The mode of ruptures in the NiTi BM was ductile, with the coalescence of dimples and microvoids. At the same time, the NiTi WM exhibited a brittle mode of rupture mechanisms with transgranular cleavage facets.
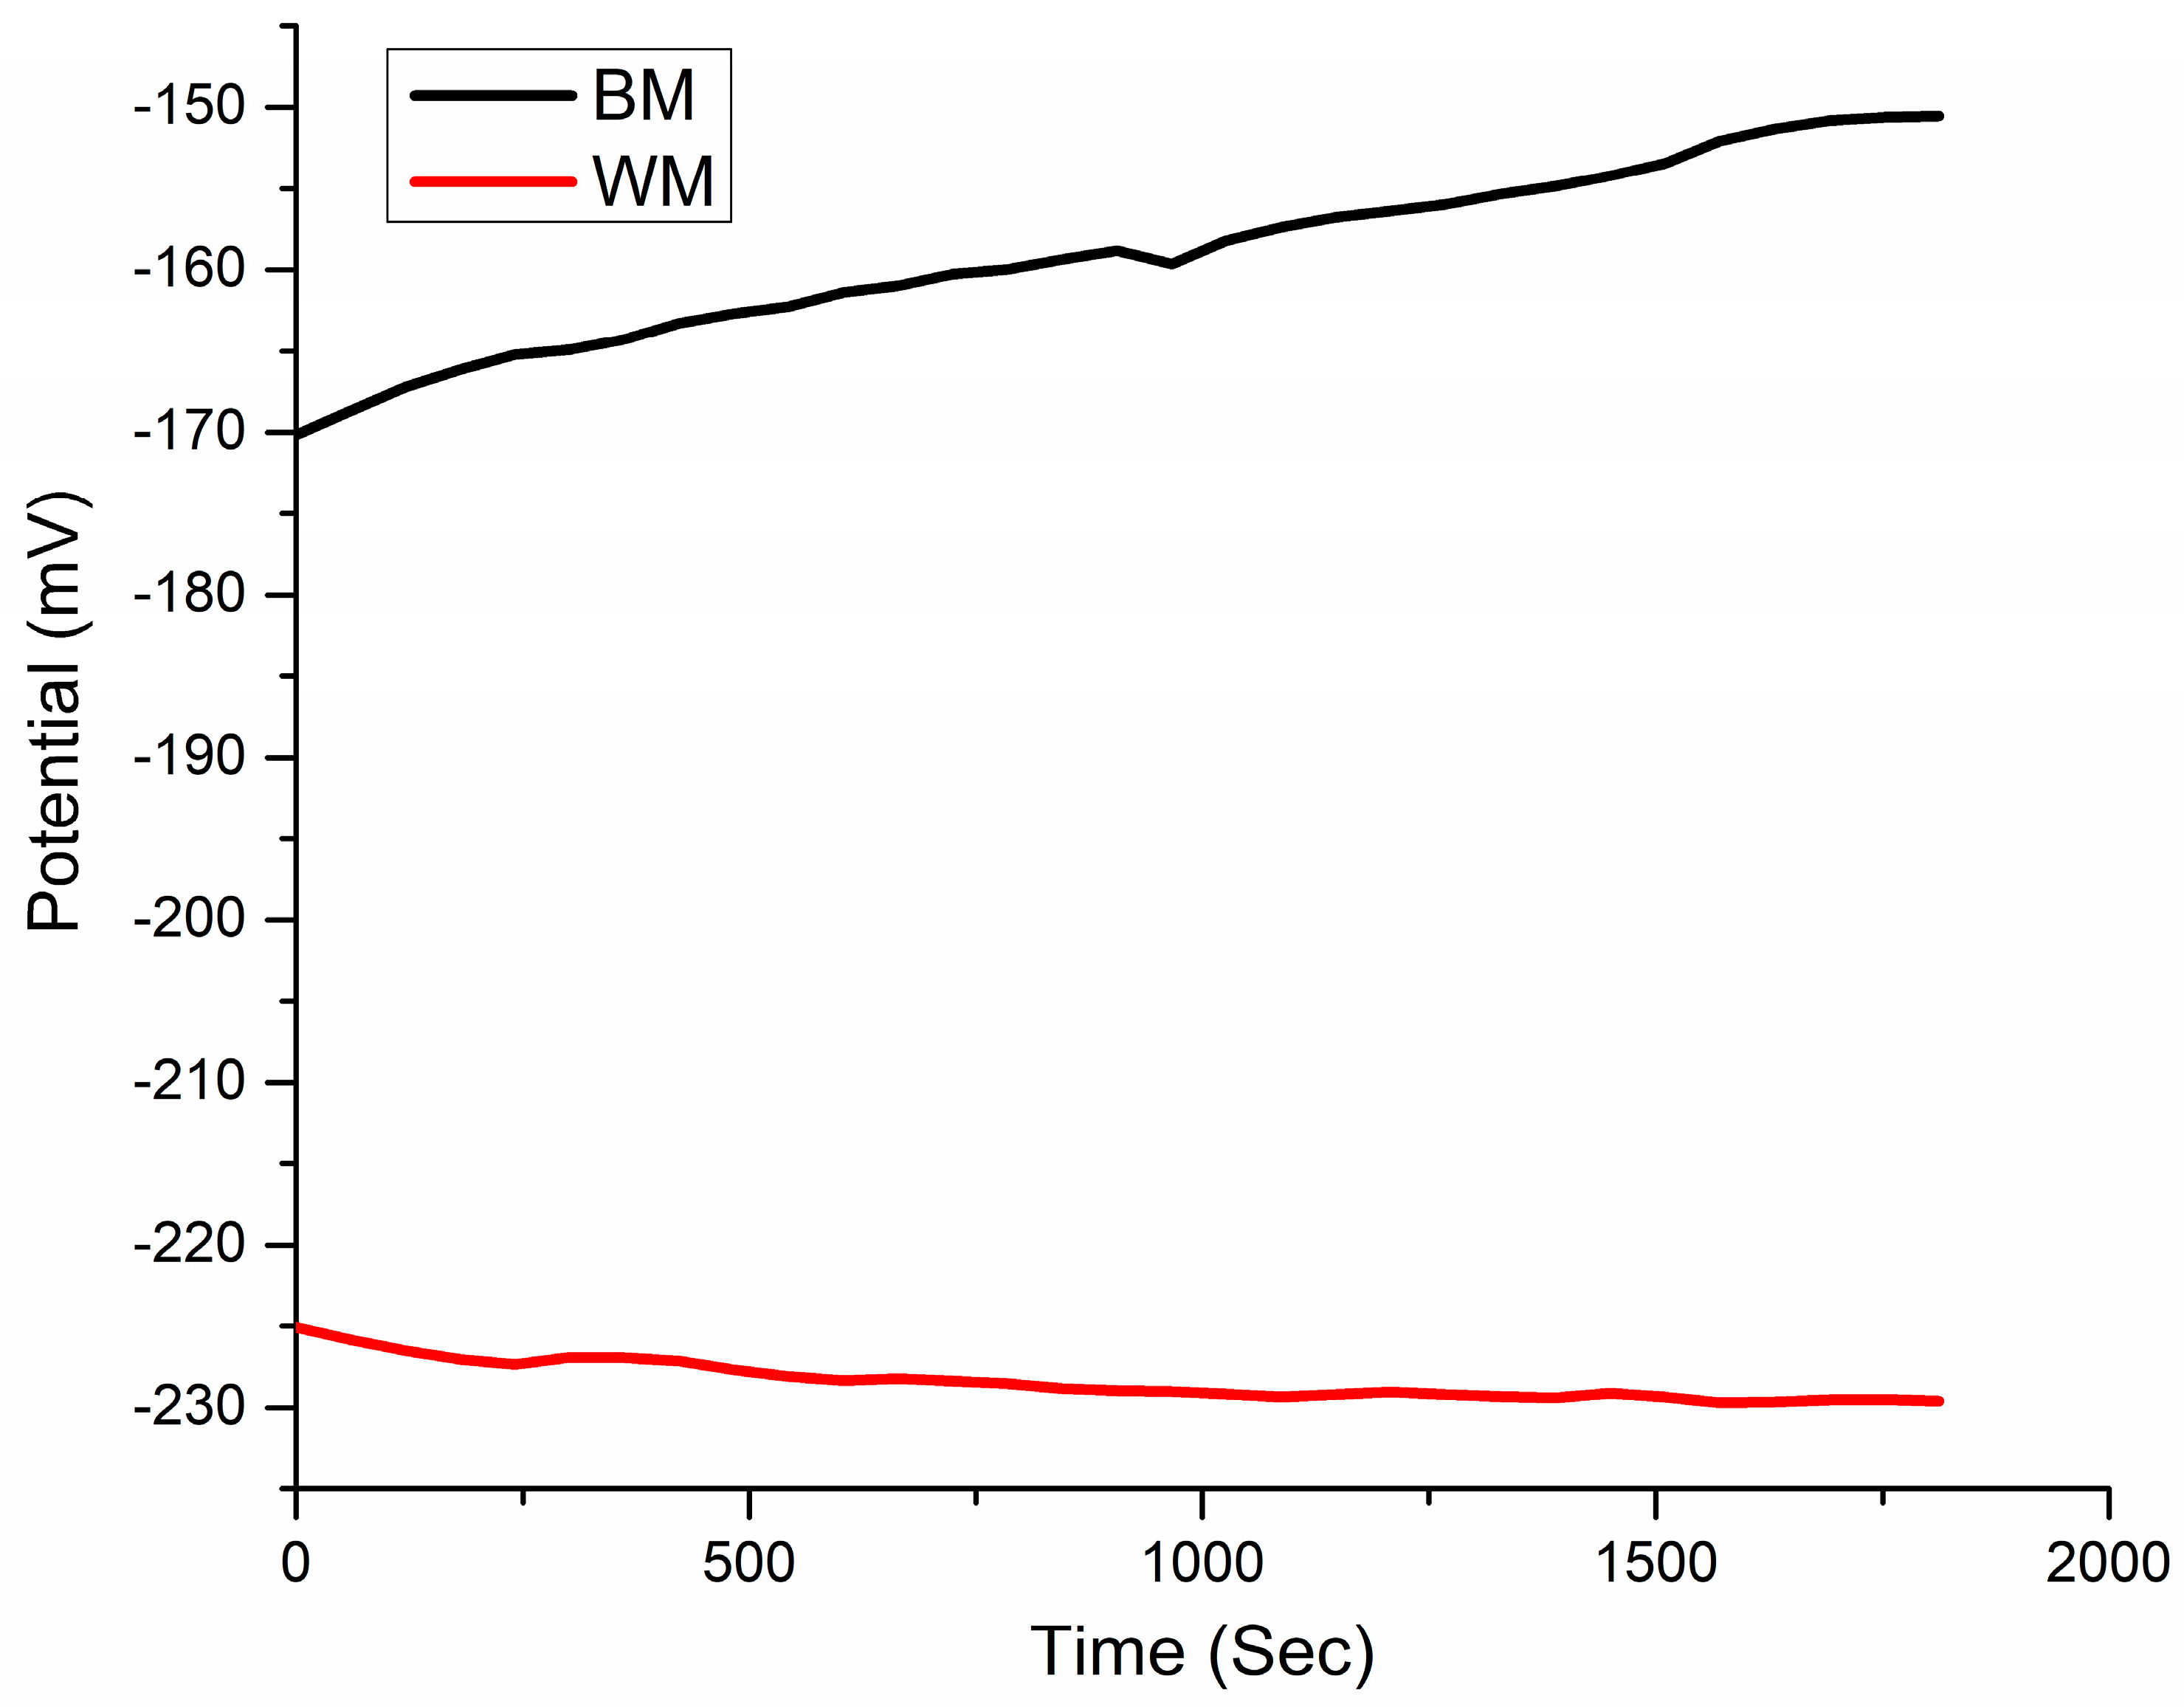
- The OCP value of the NiTi BM specimen was 55 mV higher than the WM sample. The corrosion parameters derived from Tafel plots demonstrate that welding decreased the NiTi alloy’s resistance to corrosion in SBF. The corrosion rate in WM (0.41 ± 0.019 mpy) was higher than that of the NiTi BM (0.048 ± 0.0018 mpy).
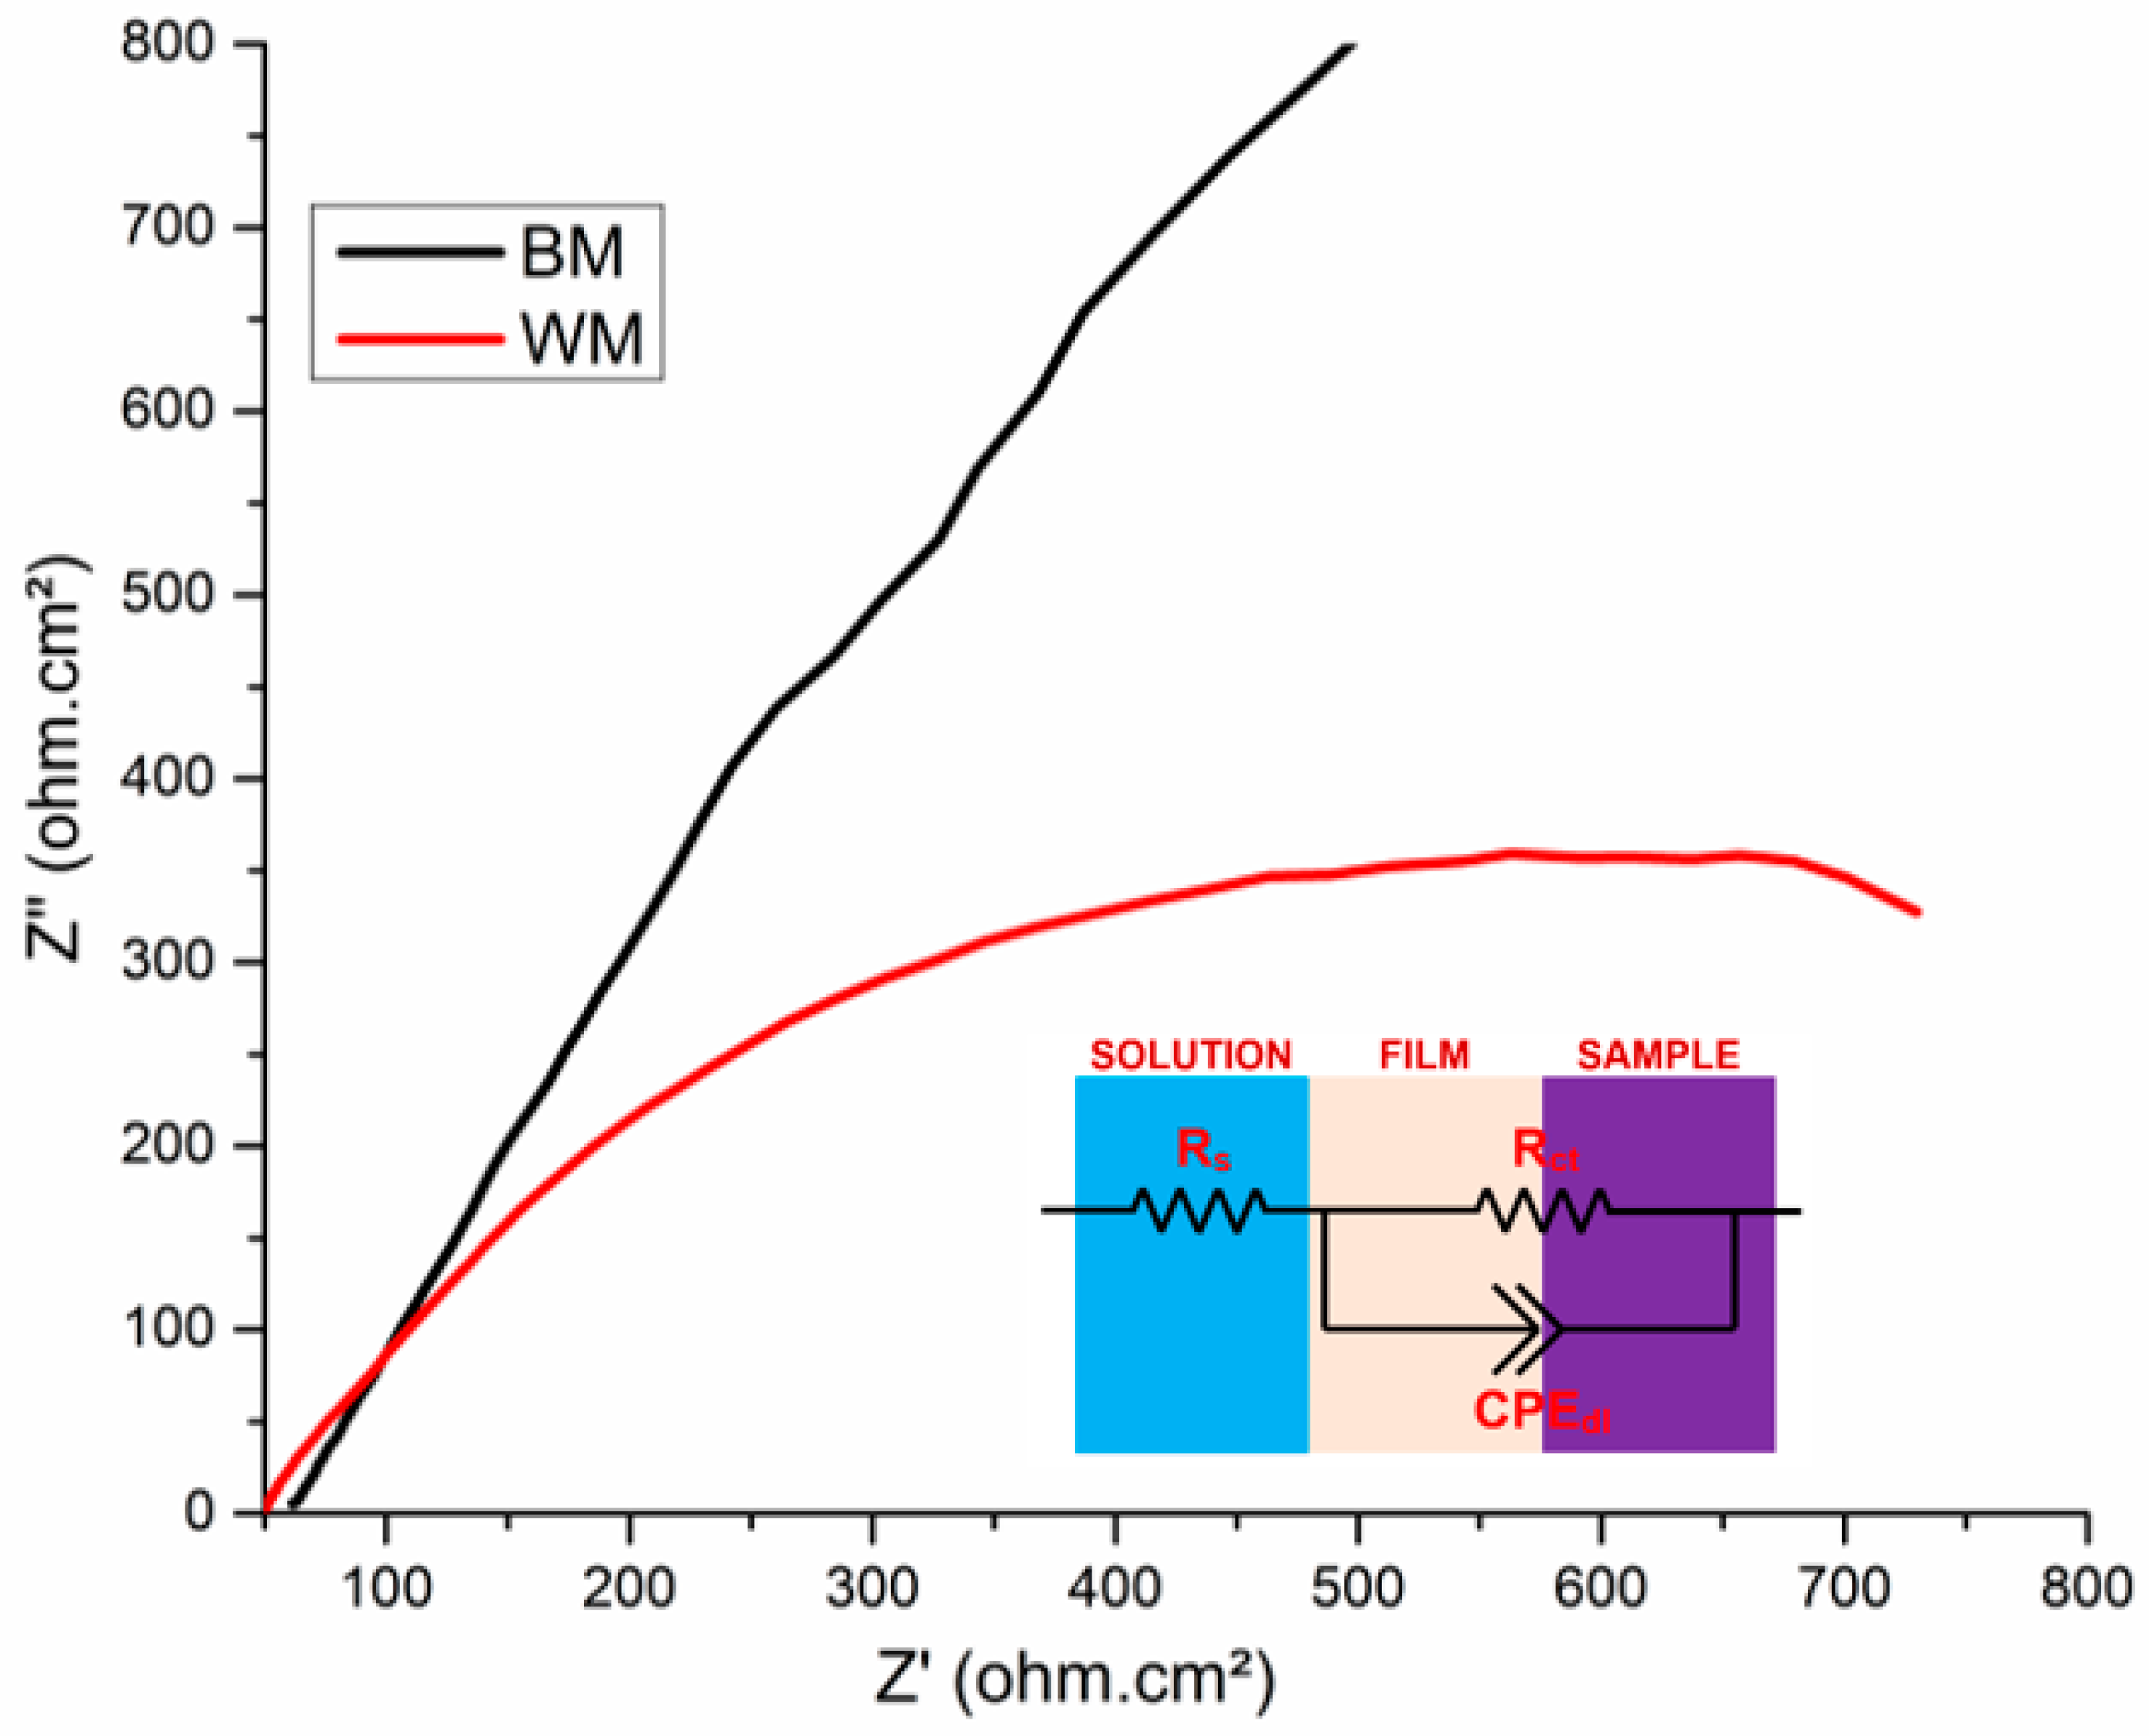
- The Nyquist spectra illustrated the capacitance characteristics of the NiTi BM and WM, highlighting the corrosion performance in SBF. This drastic reduction in the localized passive film formation in the WM was attributed to the development of an inhomogeneous oxide layer as a result of the weld’s coarse microstructure.
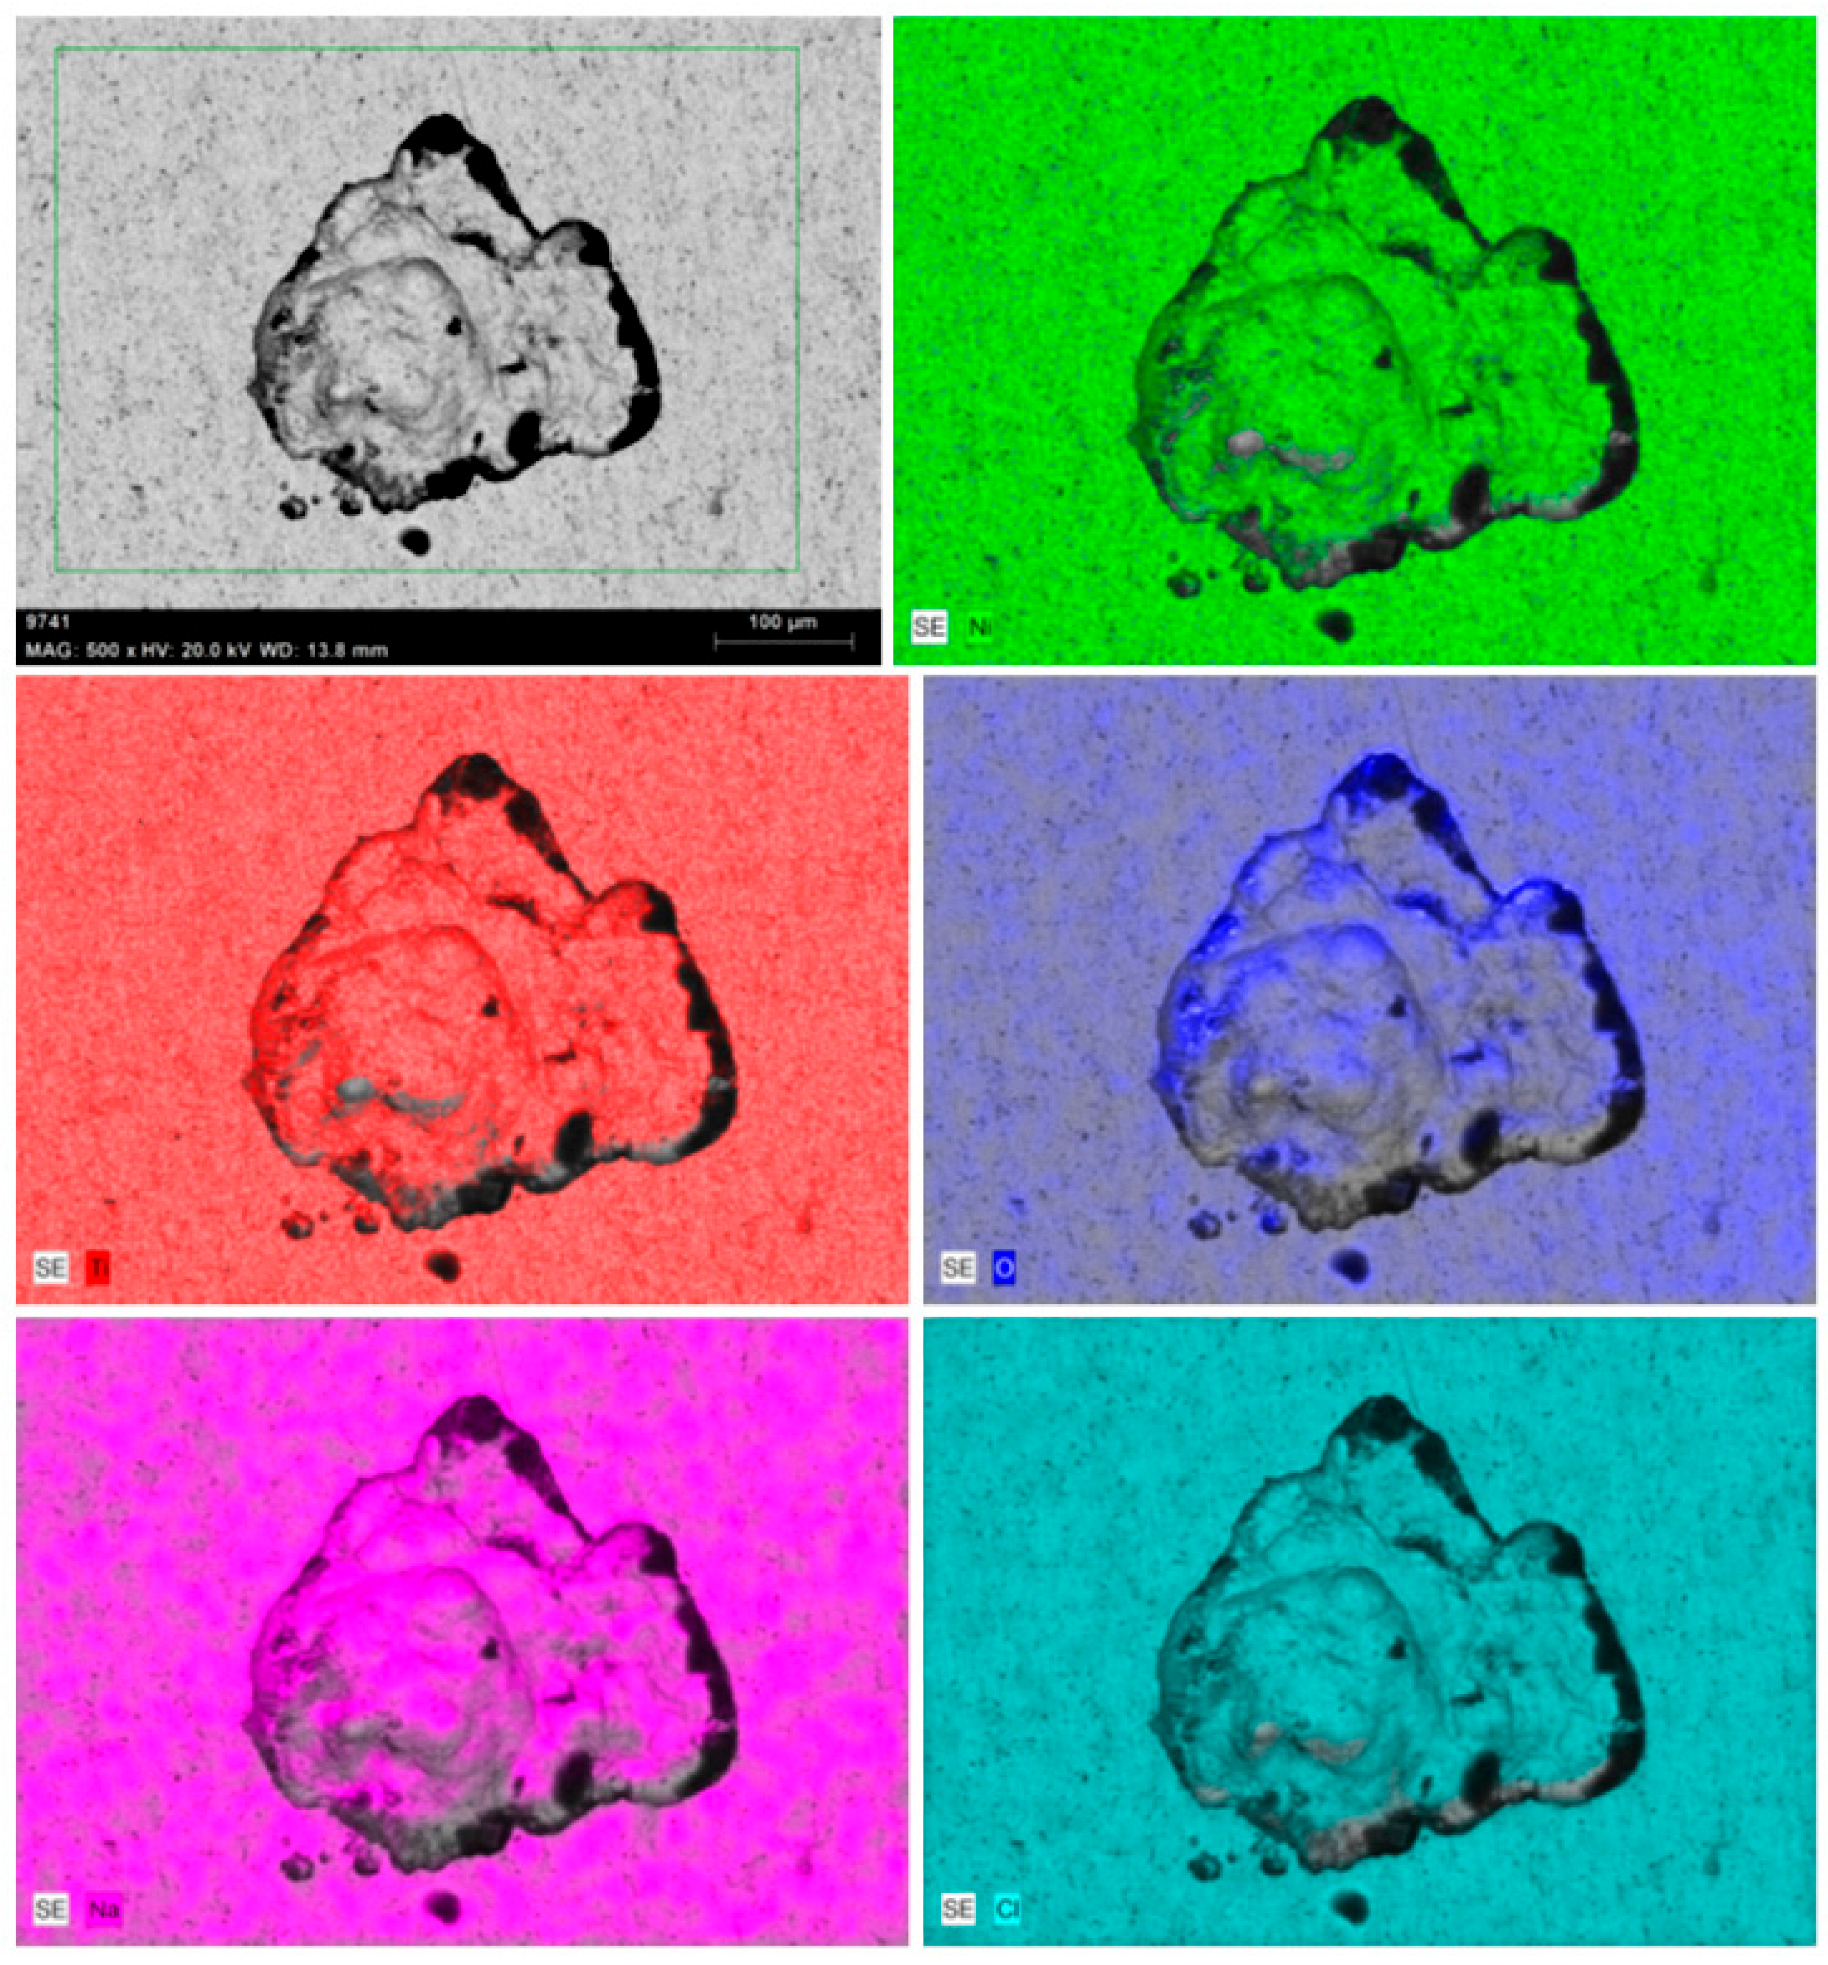
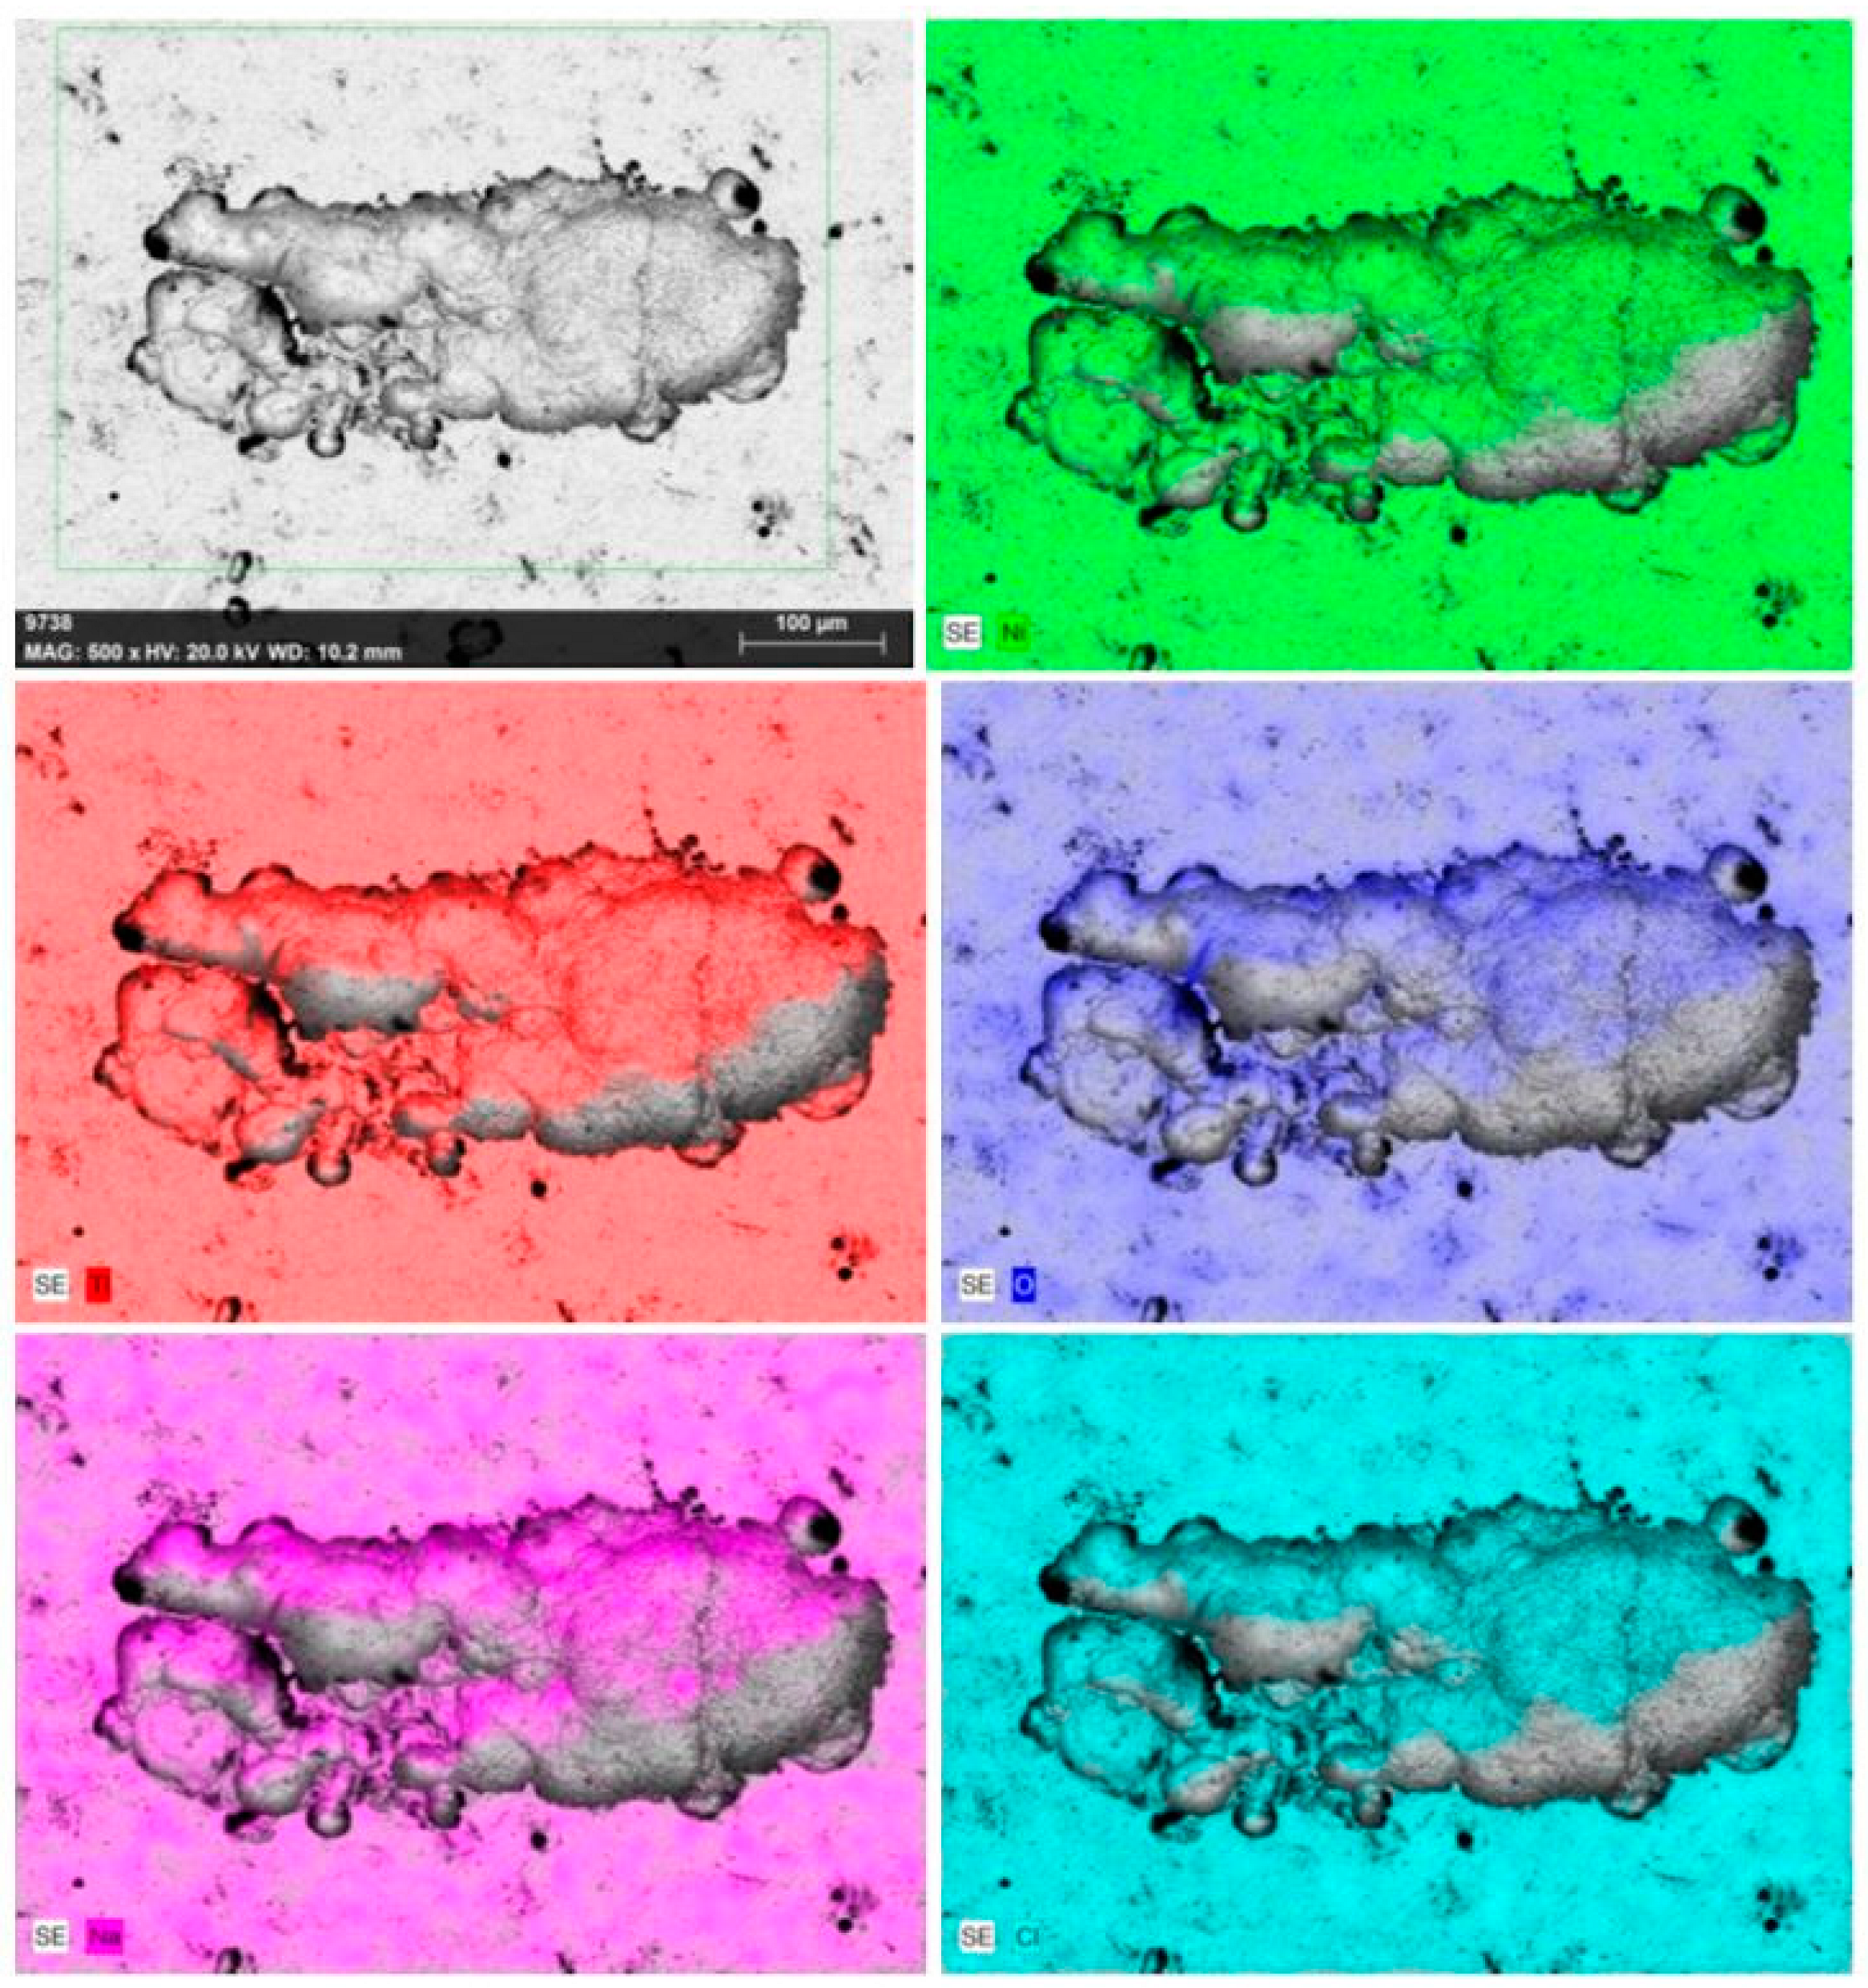
- SEM images confirmed the existence of pits in both the BM and WM samples of the NiTi alloy and EDS elemental mapping around the pit region highlighted the formation of oxides and the depletion of Ni and Ti. The pit size was considerably higher in the WM than in the BM specimen.
Author Contributions
Funding
Institutional Review Board Statement
Informed Consent Statement
Data Availability Statement
Conflicts of Interest
References
- Oliveira, J.P.; Fernandes, F.B.; Miranda, R.M.; Schell, N.; Ocaña, J.L. Effect of laser welding parameters on the austenite and martensite phase fractions of NiTi. Mater. Charact. 2016, 119, 148–151. [Google Scholar] [CrossRef]
- Prabu, S.M.; Madhu, H.C.; Perugu, C.S.; Akash, K.; Kumar, P.A.; Kailas, S.V.; Anbarasu, M.; Palani, I.A. Microstructure, mechanical properties and shape memory behaviour of friction stir welded nitinol. Mater. Sci. Eng. A 2017, 693, 233–236. [Google Scholar] [CrossRef]
- Saedi, S.; Turabi, A.S.; Andani, M.T.; Moghaddam, N.S.; Elahinia, M.; Karaca, H.E. Texture, aging, and super elasticity of selective laser melting fabricated Ni- rich NiTi alloys. Mater. Sci. Eng. A 2017, 686, 1–10. [Google Scholar] [CrossRef]
- Toker, S.M.; Gerstein, G.; Maier, H.J.; Canadinc, D. Effects of microstructural mechanisms on the localized oxidation behavior of NiTi shape memory alloys in simulated body fluid. J. Mater. Sci. 2018, 53, 948–958. [Google Scholar] [CrossRef]
- Oliveira, J.P.; Barbosa, D.; Fernandes, F.B.; Miranda, R.M. Tungsten inert gas (TIG) welding of Ni-rich NiTi plates: Functional behavior. Smart Mater. Struct. 2016, 25, 03LT01. [Google Scholar] [CrossRef]
- Mehrpouya, M.; Gisario, A.; Brotzu, A.; Natali, S. Laser welding of NiTi shape memory sheets using a diode laser. Opt. Laser Technol. 2018, 108, 142–149. [Google Scholar] [CrossRef]
- Benyounis, K.Y.; Olabi, A.G.; Hashmi, M.S.J. Effect of laser welding parameters on the heat input and weld-bead profile. J. Mater. Process. Technol. 2005, 164, 978–985. [Google Scholar] [CrossRef]
- Rasouli, A.; Naffakh-Moosavy, H. Dissimilar laser welding of NiTi shape memory alloy to NiCr alloy. J. Mater. Res. Technol. 2023, 26, 3947–3956. [Google Scholar] [CrossRef]
- Zhang, L.; Wang, X.; Lu, S.; Liu, X.; Zhang, B.; Wang, X. Monitoring the damage evolution of Al 6061-T6 laser welded T-joint structure using nano-carbon tube based buckypaper film sensor. Diam. Relat. Mater. 2024, 146, 111217. [Google Scholar] [CrossRef]
- Chen, C.; Wang, C.; Chen, N.; Liu, L.; Wang, W.; Zhang, K. Effect of multiple hit and break of oscillating pulse laser-TIG hybrid welding on porosity suppression of ultra-high strength steel. J. Manuf. Process. 2022, 83, 387–397. [Google Scholar] [CrossRef]
- Xue, J.; Guo, Y.; Xia, M.; Zhang, Y.; Tan, C.; Shi, J.; Li, X.; Zhu, Y.; Zhang, H. In-depth understanding in the effect of hydrogen on microstructural evolution, mechanical properties and fracture micro-mechanisms of advanced high-strength steels welded joints. Corros. Sci. 2024, 233, 112112. [Google Scholar] [CrossRef]
- Hopf, A.; Jüttner, S.; Goth, K.; Luttmer, M. Evaluation of hydrogen diffusion and trapping in AHSS and effects of laser-welding. J. Adv. Join. Process. 2024, 9, 100195. [Google Scholar] [CrossRef]
- Chen, Y.; Wang, K.; Huang, J.; Li, X.; Rui, Y. An extensive evaluation of laser tissue welding and soldering biotechnologies: Recent advancements, progress, and applications. Curr. Res. Biotechnol. 2024, 8, 100234. [Google Scholar] [CrossRef]
- Li, C.; Huang, J.; Zhang, M.; Chen, Y.; Liu, T.; Wang, K. Effect of preloading force on capability of laser welding for skin tissue. Opt. Lasers Eng. 2023, 165, 107538. [Google Scholar] [CrossRef]
- Zhang, K.; Liu, F.; Tan, C.; Zhou, Y.N.; Peng, P. Effect of heat input modes on microstructure, mechanical properties and porosity of laser welded NiTi-316L joints: A comparative study. Mater. Sci. Eng. A 2022, 848, 143426. [Google Scholar] [CrossRef]
- Datta, S.; Das, A.K.; Raza, M.S.; Saha, P.; Pratihar, D.K. Study on laser beam butt-welding of NiTinol sheet and input-output modelling using neural networks trained by metaheuristic algorithms. Mater. Today Commun. 2022, 32, 104089. [Google Scholar] [CrossRef]
- Sathiya, P.; Ramesh, T. Experimental investigation, and characterization of laser welded NiTinol shape memory alloys. J. Manuf. Process. 2017, 25, 253–261. [Google Scholar] [CrossRef]
- Prabu, S.M.; Perugu, C.S.; Madhu, H.C.; Jangde, A.; Khan, S.; Jayachandran, S.; Manikandan, M.; Kumar, P.A.; Kailas, S.V.; Palani, I.A. Exploring the functional and corrosion behavior of friction stir welded NiTi shape memory alloy. J. Manuf. Process. 2019, 47, 119–128. [Google Scholar] [CrossRef]
- Toker, S.M.; Canadinc, D.; Maier, H.J.; Birer, O. Evaluation of passive oxide layer formation–biocompatibility relationship in NiTi shape memory alloys: Geometry and body location dependency. Mater. Sci. Eng. C 2014, 36, 118–129. [Google Scholar] [CrossRef]
- Shabalovskaya, S.A.; Tian, H.; Anderegg, J.W.; Schryvers, D.U.; Carroll, W.U.; Van Humbeeck, J. The influence of surface oxides on the distribution and release of nickel from Nitinol wires. Biomaterials 2009, 30, 468–477. [Google Scholar] [CrossRef] [PubMed]
- Sevilla, P.; Martorell, F.; Libenson, C.; Planell, J.A.; Gil, F.J. Laser welding of NiTi orthodontic archwires for selective force application. J. Mater. Sci. Mater. Med. 2008, 19, 525–529. [Google Scholar] [CrossRef]
- Kassab, E.; Gomes, J.A.D.C.P. Corrosion induced fracture of NiTi wires in simulated oral environments. J. Mech. Behav. Biomed. Mater. 2021, 116, 104323. [Google Scholar] [CrossRef]
- ASTM F2063-18; Standard Specification for Wrought Nickel-Titanium Shape Memory Alloys for Medical Devices and Surgical Implants. ASTM International: West Conshohocken, PA, USA, 2018.
- Datta, S.; Chakraborty, R.; Raza, M.S.; Saha, P.; Pratihar, D.K. Comparative study on weld characterisation and corrosion performance of laser-welded NiTinol. Sci. Technol. Weld. Join. 2023, 28, 792–802. [Google Scholar] [CrossRef]
- ASTM E3-11(2017); Standard Guide for Preparation of Metallographic Specimens. ASTM International: West Conshohocken, PA, USA, 2017.
- ASTM E384-22; Standard Test Method for Microindentation Hardness of Materials. ASTM International: West Conshohocken, PA, USA, 2022.
- ASTM E8/E8M-22; Standard Test Methods for Tension Testing of Metallic Materials. ASTM International: West Conshohocken, PA, USA, 2022.
- ASTM G61-86(2018); Standard Test Method for Conducting Cyclic Potentiodynamic Polarization Measurements for Localized Corrosion Susceptibility of Iron-, Nickel-, or Cobalt-Based Alloys. ASTM International: West Conshohocken, PA, USA, 2018.
- Vishnukumar, M.; Muthupandi, V.; Jerome, S. Microstructural characteristics, mechanical properties and corrosion performance of super austenitic stainless steel 904L produced by wire arc additive manufacturing. Mater. Today Commun. 2023, 35, 105801. [Google Scholar] [CrossRef]
- Yan, X.J.; Yang, D.Z.; Liu, X.P. Corrosion behavior of a laser-welded NiTi shape memory alloy. Mater. Charact. 2007, 58, 623–628. [Google Scholar] [CrossRef]
- Kannan, T.D.B.; Ramesh, T.; Sathiya, P. Application of Artificial Neural Network Modelling for Optimization of Yb: YAG Laser Welding of Nitinol. Trans. Indian Inst. Met. 2017, 70, 1763–1771. [Google Scholar] [CrossRef]
- Zeng, Z.; Yang, M.; Oliveira, J.P.; Song, D.; Peng, B. Laser welding of NiTi shape memory alloy wires and tubes for multi-functional design applications. Smart Mater. Struct. 2016, 25, 085001. [Google Scholar] [CrossRef]
- Frenzel, J.; George, E.P.; Dlouhy, A.; Somsen, C.; Wagner, M.X.; Eggeler, G. Influence of Ni on martensitic phase transformations in NiTi shape memory alloys. Acta Mater. 2010, 58, 3444–3458. [Google Scholar] [CrossRef]
- Gonela, K.; Vijayavarman, C.; Palanivel, M.; Mariappan, L.; Ramasubramanian, L.; Kannan, A.R. Effect of robotic weaving motion on mechanical and microstructural characteristics of wire arc additively manufactured NiTi shape memory alloy. Int. J. Mater. Res. 2023, 114, 947–954. [Google Scholar] [CrossRef]
- Tam, B.; Khan, M.I.; Zhou, Y. Mechanical and functional properties of laser-welded Ti-55.8 Wt Pct Ni nitinol wires. Metall. Mater. Trans. A 2011, 42, 2166–2175. [Google Scholar] [CrossRef]
- Wen, D.; Long, P.; Li, J.; Huang, L.; Zheng, Z. Effects of linear heat input on microstructure and corrosion behavior of an austenitic stainless steel processed by wire arc additive manufacturing. Vacuum 2020, 173, 109131. [Google Scholar] [CrossRef]
- Thongchuea, N.; Warinsiriruk, E.; Phuraya, N.; Sa-Ngasoongsong, P. Corrosion behavior on cerclage-wire joining using laser welding. AIP Conf. Proc. 2020, 2279, 080002. [Google Scholar] [CrossRef]
- Fontana, M.G. Corrosion Engineering; McGraw-Hill: Boston, MA, USA, 1986; pp. 171–172. [Google Scholar]
- Wang, J.; Shi, W.; Xiang, S.; Ballinger, R.G. Study of the corrosion behaviour of sensitized 904L austenitic stainless steel in Cl-solution. Corros. Sci. 2021, 181, 109234. [Google Scholar] [CrossRef]
- Li, L.; Huang, Z.; Chen, L.; Zhang, L.; Li, M.; Hou, H.; Zhao, Y. Electrochemical corrosion behavior of AZ91D magnesium alloy-graphene nanoplatelets composites in simulated body fluids. J. Mater. Res. Technol. 2023, 24, 449–462. [Google Scholar] [CrossRef]
- Cisse, O.; Savadogo, O.; Wu, M.; Yahia, L.H. Effect of surface treatment of NiTi alloy on its corrosion behavior in Hanks’ solution. J. Biomed. Mater. Res. 2002, 61, 339–345. [Google Scholar] [CrossRef]


| Element | Ni | Cr | Fe | C | Nb | Co | O | Cu | N | H | Ti |
|---|---|---|---|---|---|---|---|---|---|---|---|
| at·% | 55.12 | 0.005 | 0.012 | 0.038 | 0.015 | 0.05 | 0.035 | 0.005 | 0.001 | 0.001 | Bal. |
| Variable | Laser Power | Focal Position | Welding Speed | Shielding Gas |
|---|---|---|---|---|
| Unit | W | mm | mm/min | L/min |
| Value | 950 | +0.50 | 200 | 15 |
| Reagents | Amount in g/1000 mL | pH |
|---|---|---|
| NaCl | 8.036 | ~7.4 |
| NaHCO3 | 0.352 | |
| KCl | 0.225 | |
| K2HPO4·3H2O | 0.230 | |
| MgCl2·6H2O | 0.311 | |
| 1.0 M HCl | 40 mL | |
| CaCl2·2H2O | 0.293 | |
| Na2SO4 | 0.072 | |
| (HOCH2)3CNH2 | 6.063 | |
| 1.0 M HCl | An appropriate amount was added to adjust the pH |
| Location | Elemental Composition in wt% | ||
|---|---|---|---|
| Ni | Ti | Cu | |
| BM | 55.12 | 44.23 | 0.006 |
| IF | 53.80 | 45.69 | 0.05 |
| WM | 53.45 | 46.12 | 0.03 |
| Specimen Type | Tensile Strength, UTS | Percent of Elongation, EL | Fracture Location |
|---|---|---|---|
| Unit | MPa | % | |
| BM | 1430 ± 34 | 34.50 ± 1 | center |
| WM | 481 ± 19 | 13.60 ± 0.5 | center |
| Specimen Type | Ecorr | Icorr | Epit | Corrosion Rate |
|---|---|---|---|---|
| Unit | mV | (mA/cm2) | mV | mpy |
| BM | −217.05 ± 4 | −2.39 ± 0.10 | 281.43 ± 11 | 0.048 ± 0.0018 |
| WM | −259.53 ± 9 | −2.01 ± 0.09 | 330.05 ± 7 | 0.41 ± 0.019 |
Disclaimer/Publisher’s Note: The statements, opinions and data contained in all publications are solely those of the individual author(s) and contributor(s) and not of MDPI and/or the editor(s). MDPI and/or the editor(s) disclaim responsibility for any injury to people or property resulting from any ideas, methods, instructions or products referred to in the content. |
© 2024 by the authors. Licensee MDPI, Basel, Switzerland. This article is an open access article distributed under the terms and conditions of the Creative Commons Attribution (CC BY) license (https://creativecommons.org/licenses/by/4.0/).
Share and Cite
Kannan, A.R.; Shanmugam, N.S.; Rajkumar, V.; Vishnukumar, M.; Channabasavanna, S.G.; Oh, J.; Dat, T.T.K.; Yoon, J. Microstructure, Mechanical Properties and Corrosion Performance of Laser-Welded NiTi Shape Memory Alloy in Simulated Body Fluid. Materials 2024, 17, 4801. https://doi.org/10.3390/ma17194801
Kannan AR, Shanmugam NS, Rajkumar V, Vishnukumar M, Channabasavanna SG, Oh J, Dat TTK, Yoon J. Microstructure, Mechanical Properties and Corrosion Performance of Laser-Welded NiTi Shape Memory Alloy in Simulated Body Fluid. Materials. 2024; 17(19):4801. https://doi.org/10.3390/ma17194801
Chicago/Turabian StyleKannan, A. Rajesh, N. Siva Shanmugam, V. Rajkumar, M. Vishnukumar, S. G. Channabasavanna, Junho Oh, Than Trong Khanh Dat, and Jonghun Yoon. 2024. "Microstructure, Mechanical Properties and Corrosion Performance of Laser-Welded NiTi Shape Memory Alloy in Simulated Body Fluid" Materials 17, no. 19: 4801. https://doi.org/10.3390/ma17194801
APA StyleKannan, A. R., Shanmugam, N. S., Rajkumar, V., Vishnukumar, M., Channabasavanna, S. G., Oh, J., Dat, T. T. K., & Yoon, J. (2024). Microstructure, Mechanical Properties and Corrosion Performance of Laser-Welded NiTi Shape Memory Alloy in Simulated Body Fluid. Materials, 17(19), 4801. https://doi.org/10.3390/ma17194801