
Calorimetric Studies and Thermodynamic Modeling of Ag–Mg–Ti Liquid Alloys

 ,
,  , , and
Abstract
:1. Introduction
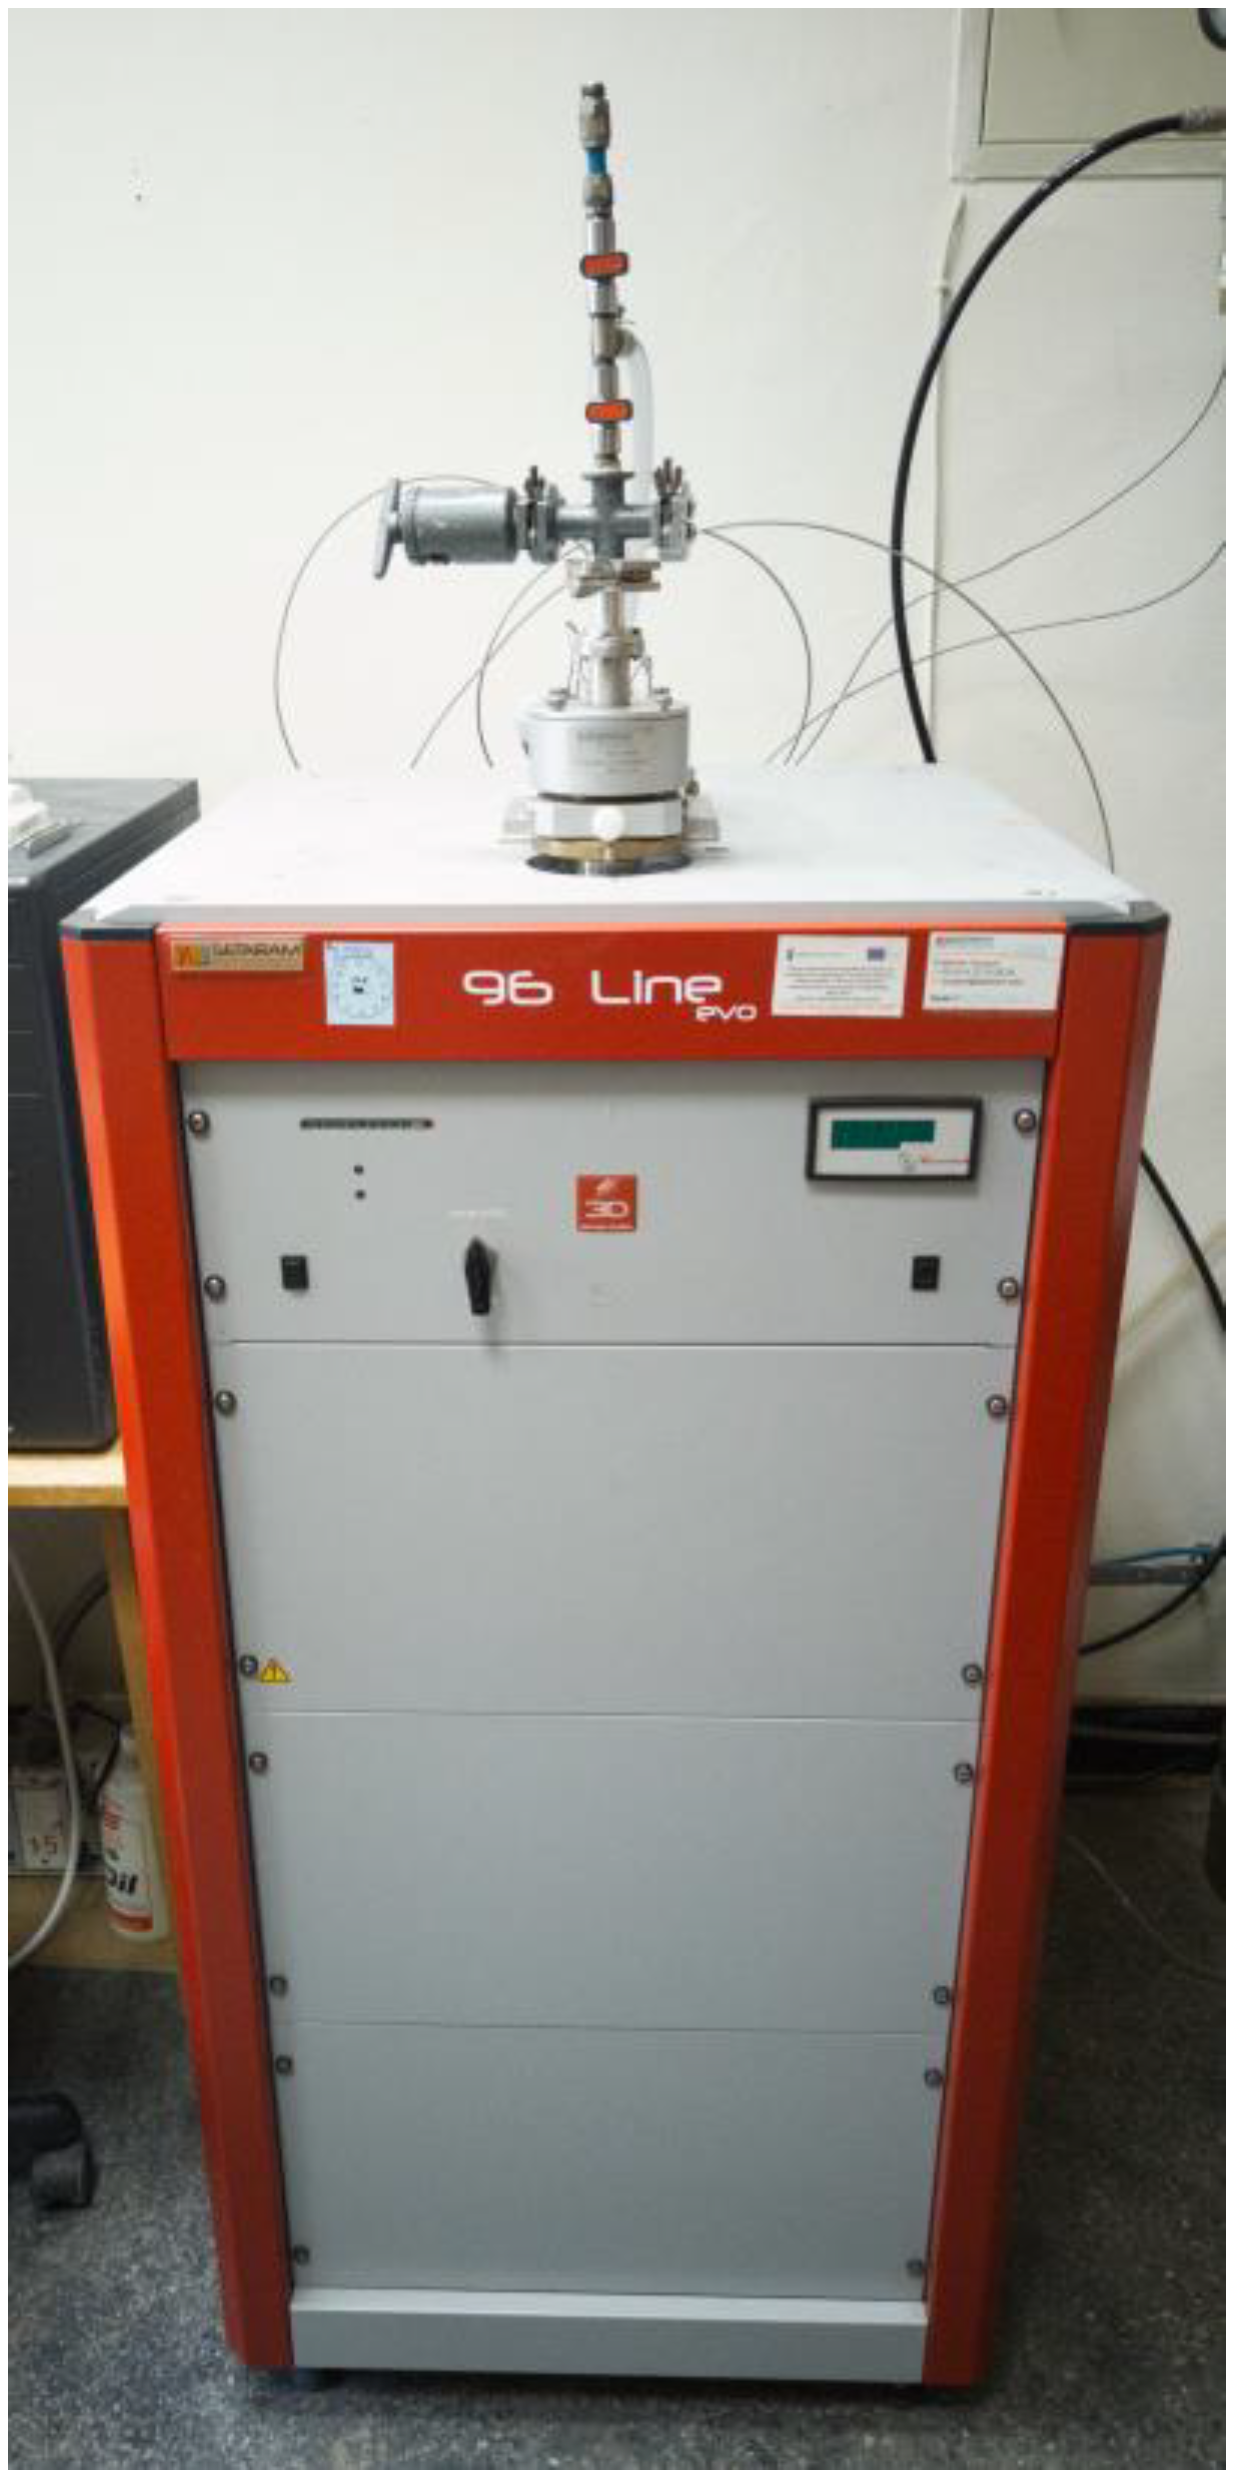
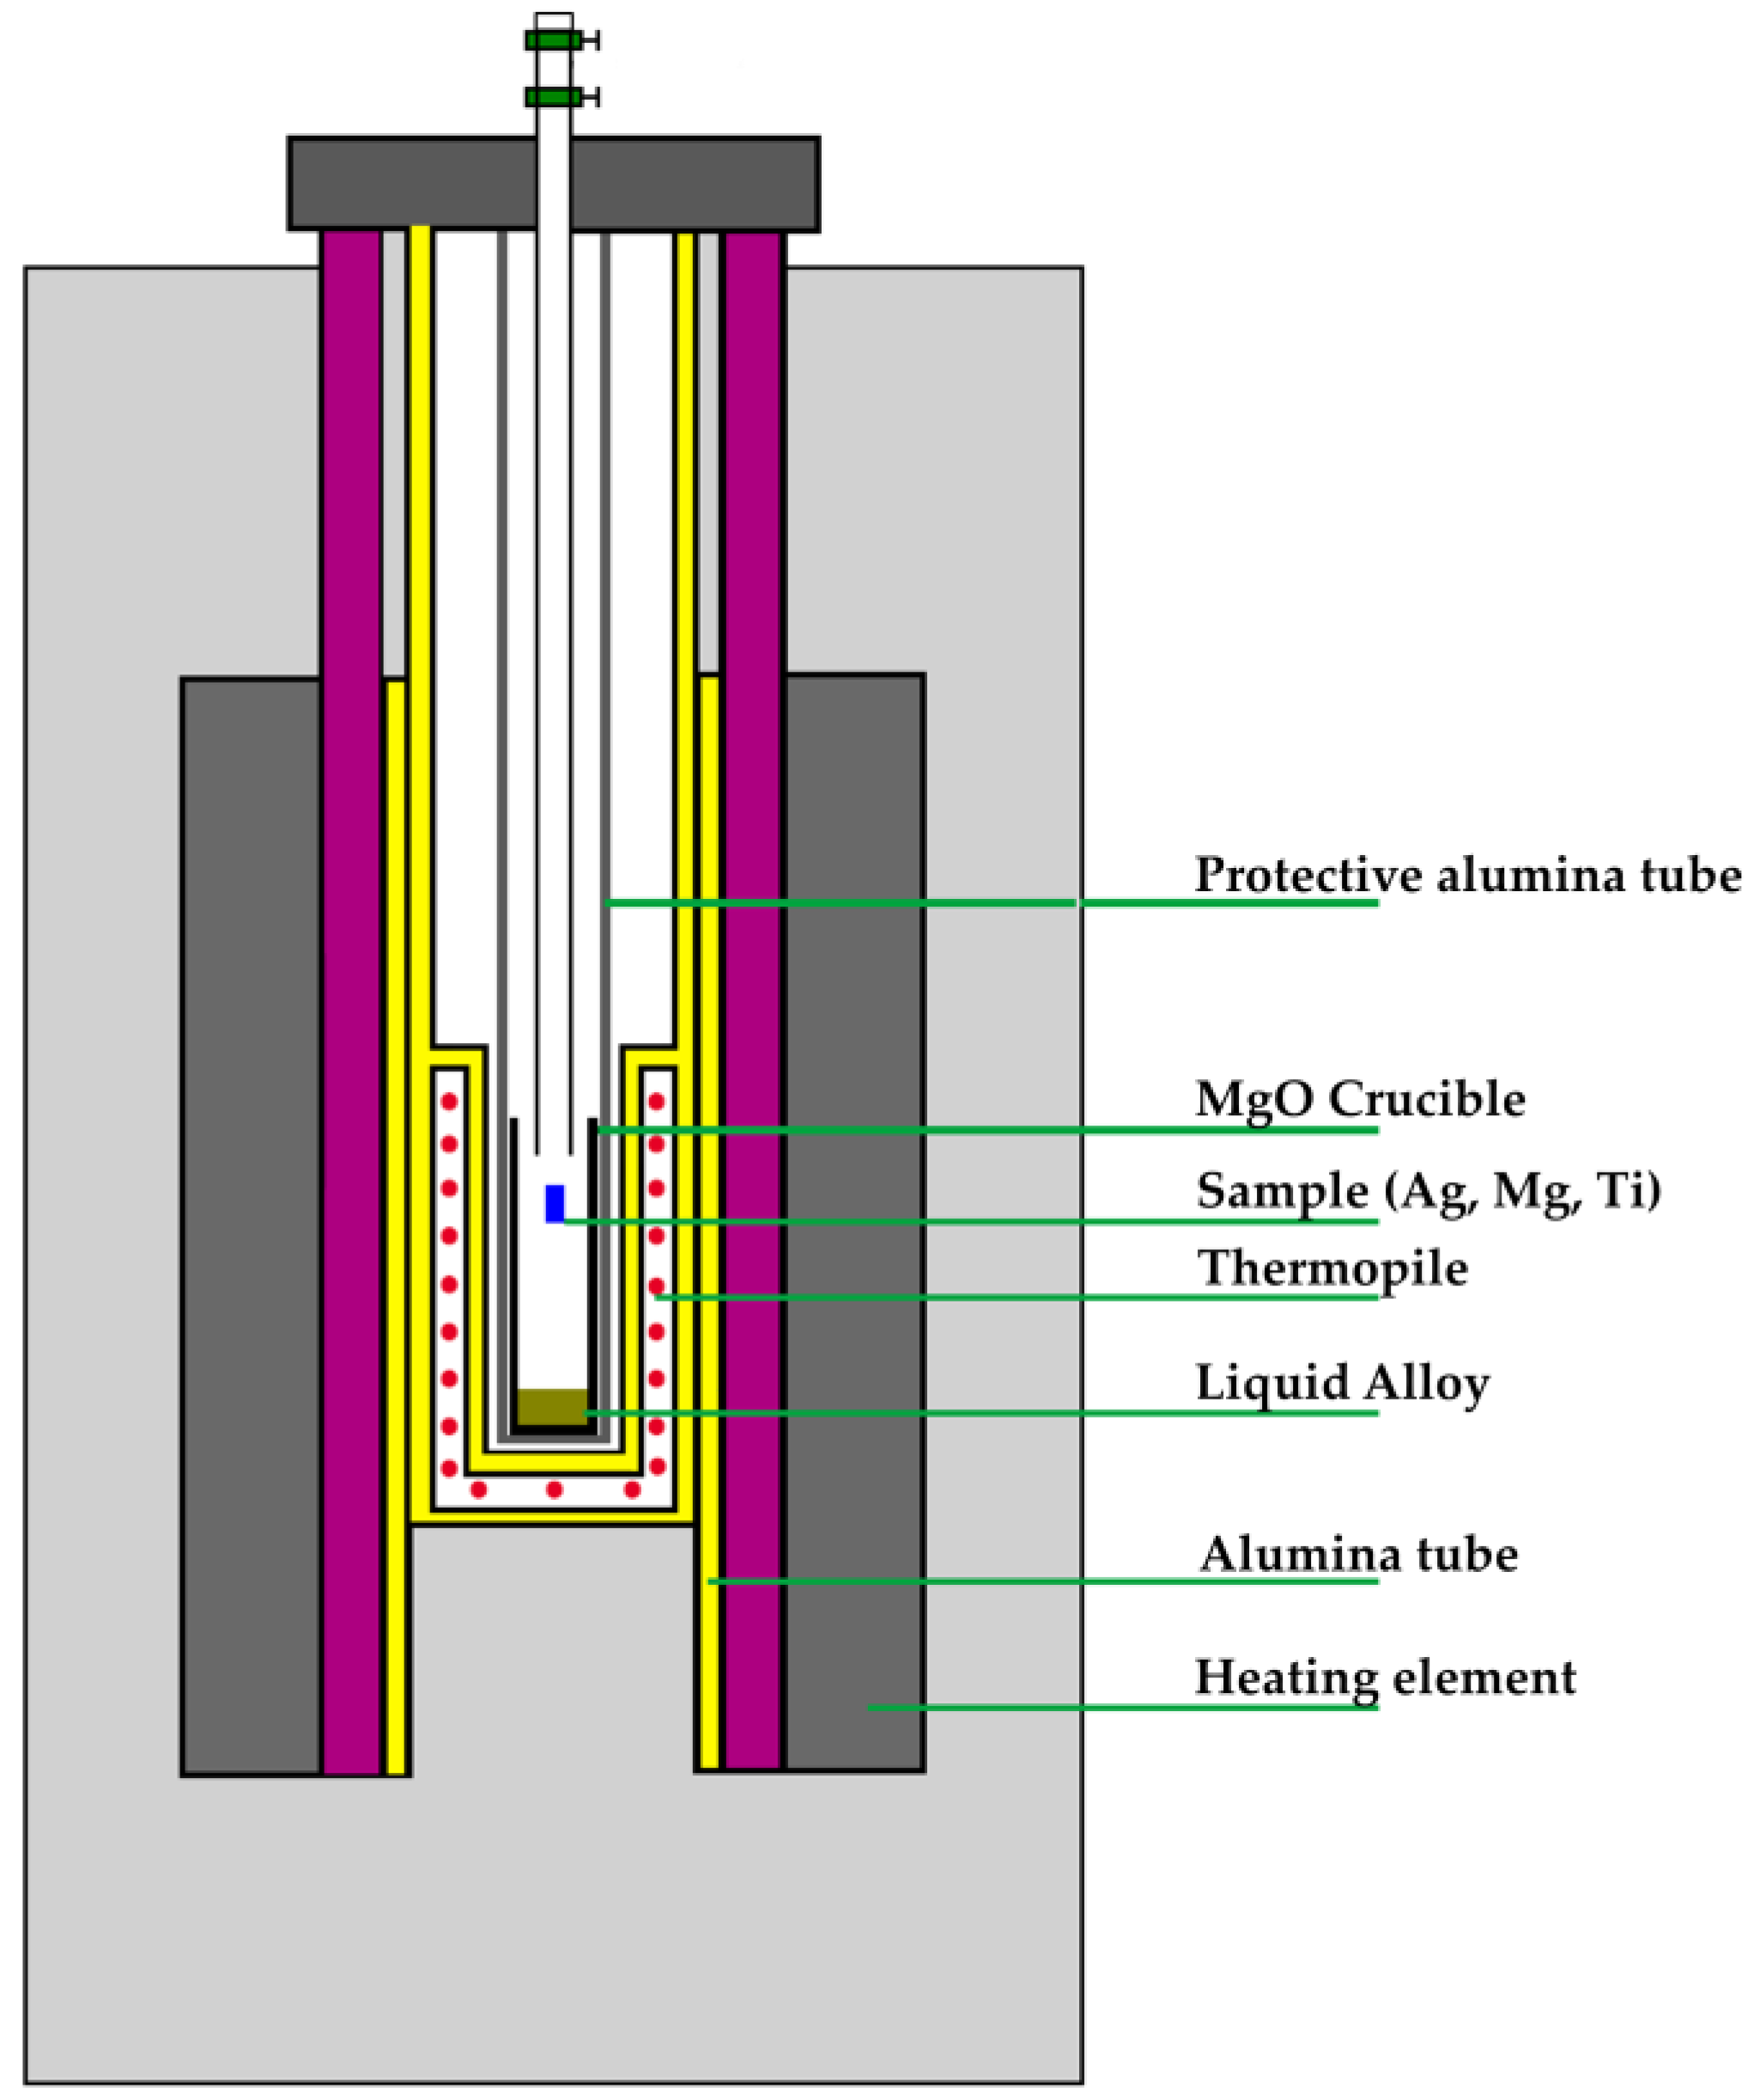
2. Materials and Methods
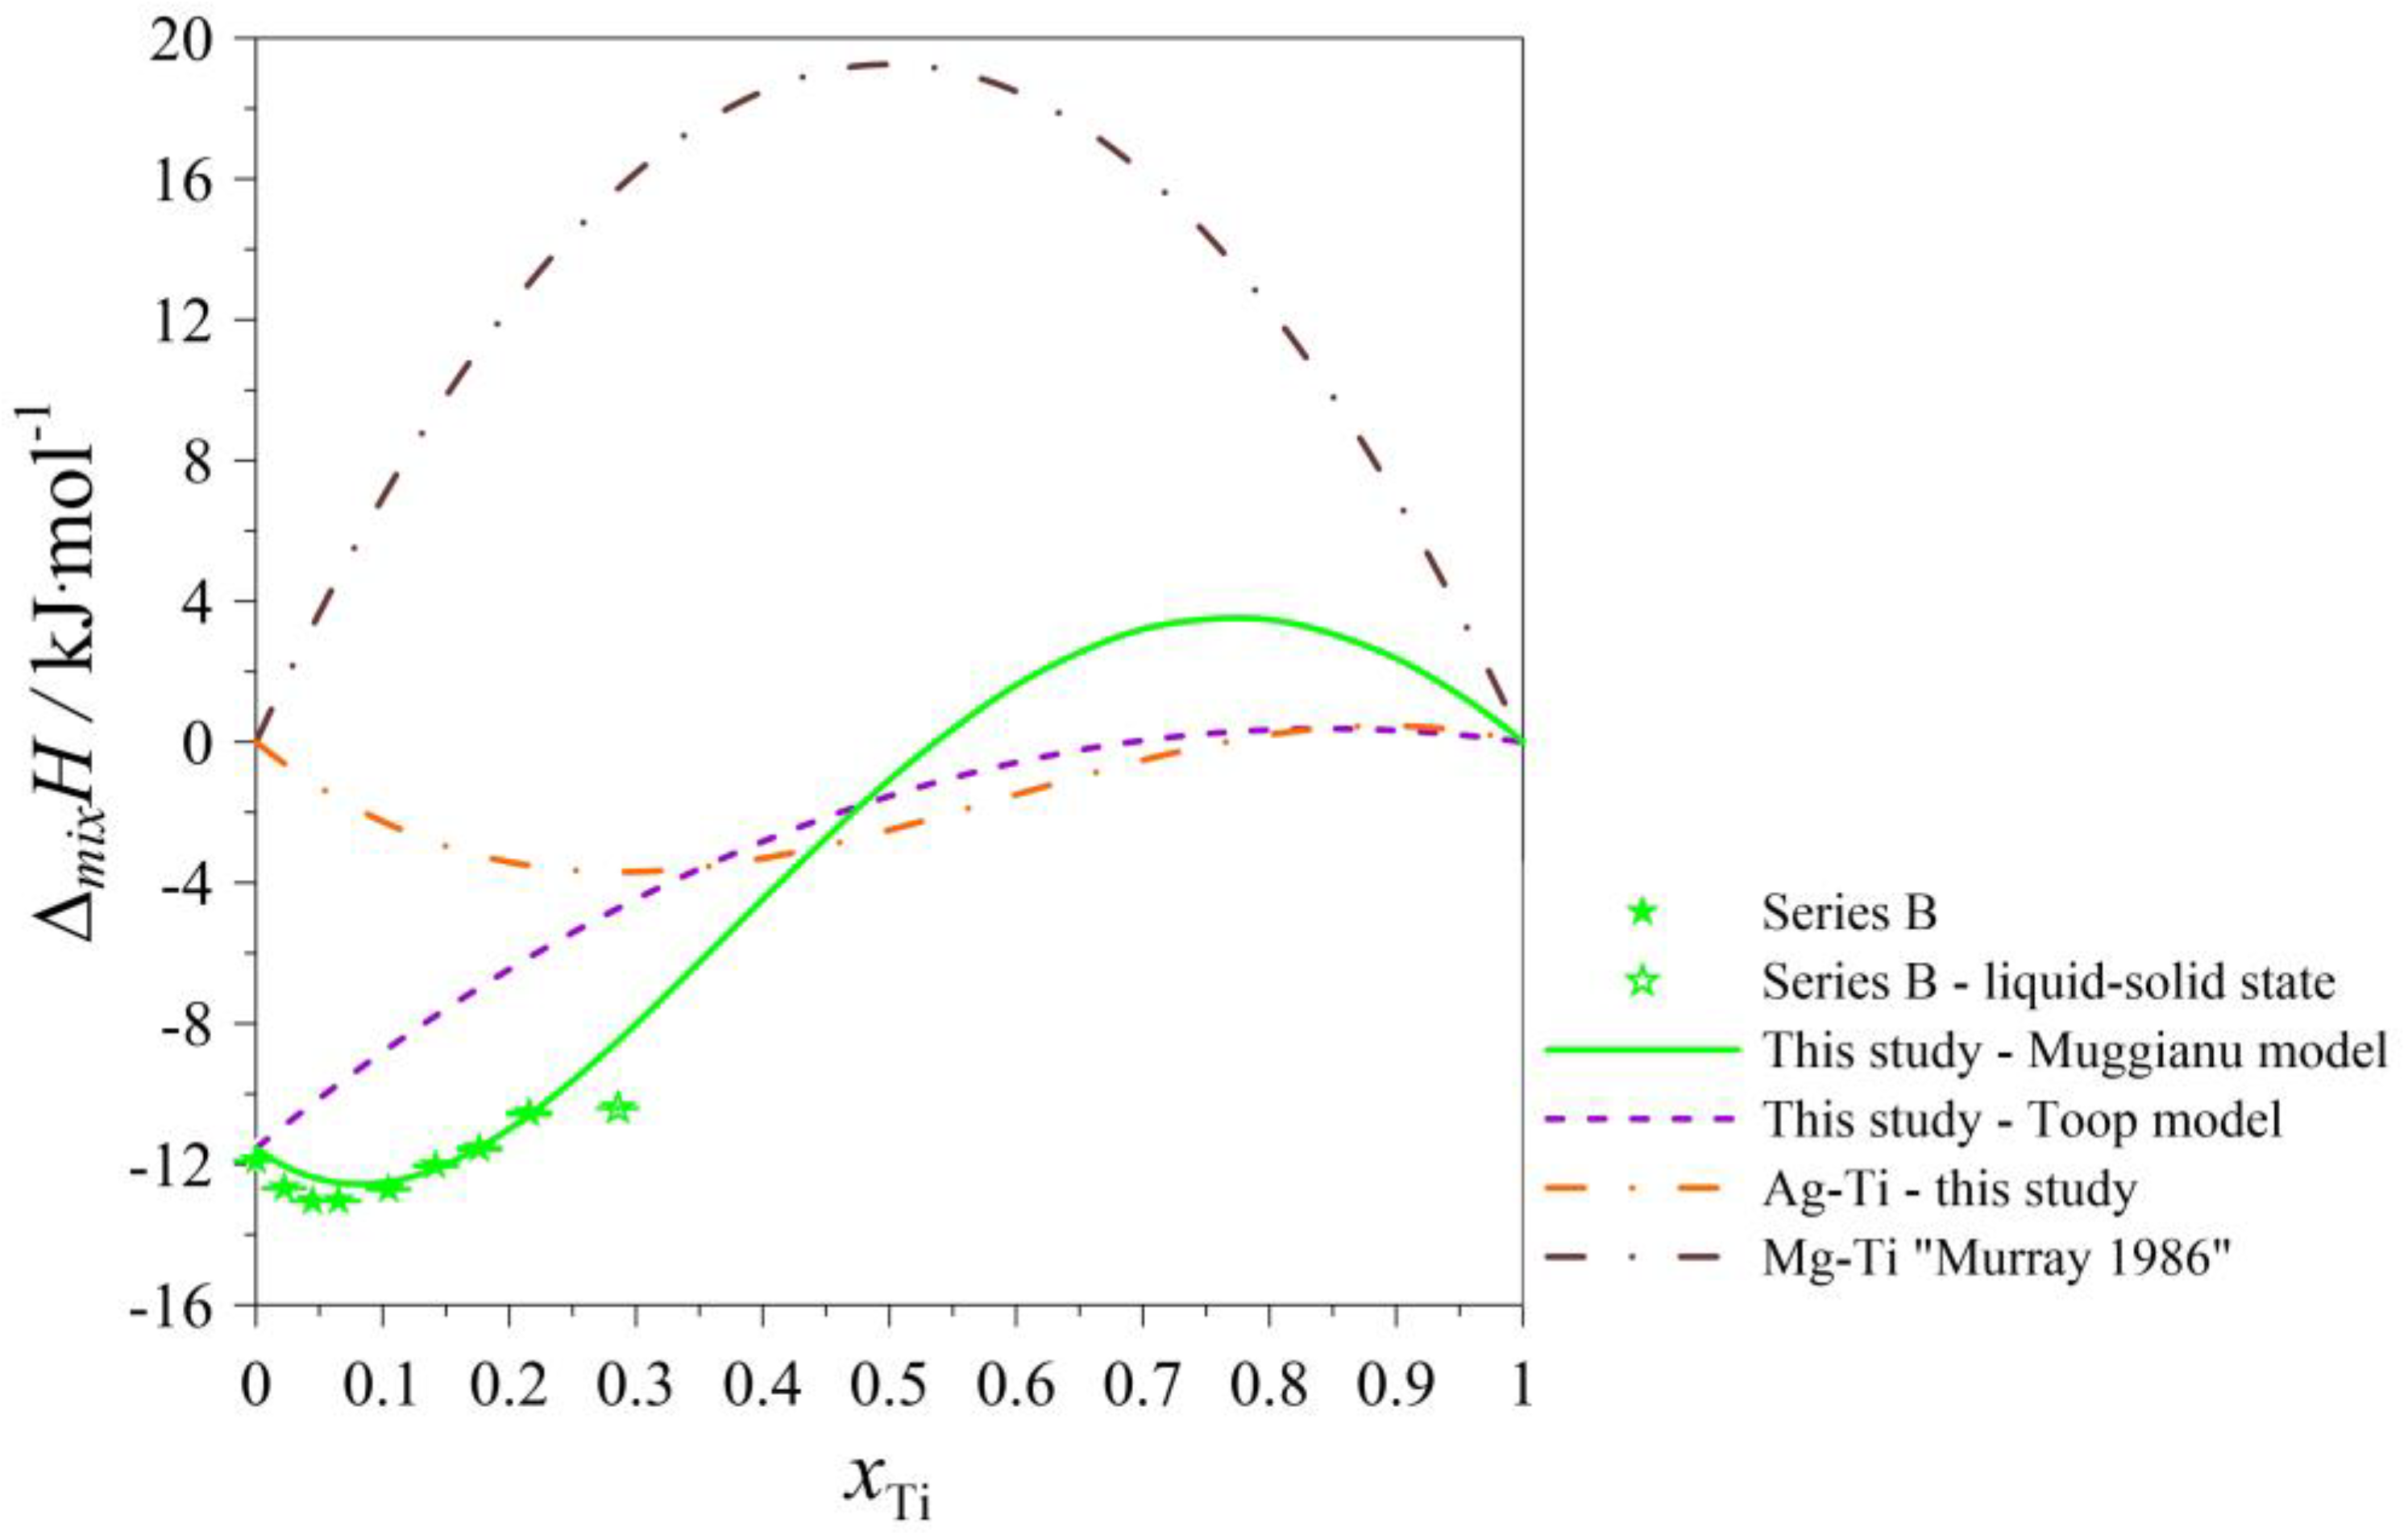
3. Results and Discussion

| Number of Dropped Moles ni [mol] | Heat Effect ∆HSignal ·K [kJ] | Drop Enthalpy HDISS-i [kJ] | Mole Fraction xi | Integral Molar Enthalpy ∆mixH [kJ/mol] | Partial Molar Enthalpy [kJ/mol] | Standard Uncertainties u(∆mixH) [kJ/mol] |
|---|---|---|---|---|---|---|
| Series A: (Ag0.90Mg0.10)1−xTix Atmosphere: Argon at pressure p = 0.1 MPa. Starting parameters: nAg = 0.013123 mol; K = 0.000007076 kJ/μVs; TD = 298 K; TM = 1294 K; = 39.7295 kJ/mol; = 38.9594 kJ/mol; = 42.9264 kJ/mol. Standard uncertainties: u(nAg) = 0.0000009 mol; u(nMg) = 0.0000041 mol; u(nTi) = 0.0000021; u(TD) = 1 K; u(TM) = 1 K; u(p) = 10 kPa; u(K) = 0.000000151 kJ/μVs. | ||||||
| nMg | ∆HSignal ·K | HDISS-Mg | xMg | ∆mixH | ΔMg | u(∆mixH) |
| 0.001461 | −0.015129 | −0.072 | 0.1002 | −4.939 | −49.3 | 0.025 |
| nTi | ∆HSignal ·K | HDISS-Ti | xTi | ∆mixH | ΔTi | u(∆mixH) |
| 0.0003384 | 0.014117 | −0.0004 | 0.0227 | −4.855 | −1.2 | 0.05 |
| 0.0003928 | −0.019389 | −0.0362 | 0.0477 | −7.097 | −92.3 * | 0.08 |
| 0.0004930 | 0.015384 | −0.0058 | 0.0774 | −7.241 | −11.7 * | 0.10 |
| 0.0005515 | 0.018455 | −0.0052 | 0.1085 | −7.316 | −9.5 * | 0.13 |
| 0.0010258 | 0.035827 | −0.0082 | 0.1611 | −7.357 | −8.0 * | 0.18 |
| 0.0011239 | 0.041276 | −0.0070 | 0.2121 | −7.287 | −6.2 * | 0.23 |
| Series A’: (Ag0.90Mg0.10)1−xTix Atmosphere: Argon at pressure p = 0.1 MPa. Starting parameters: nAg = 0.013419 mol; K = 0.000008991 kJ/μVs; TD = 298 K; TM = 1297 K; = 39.8299 kJ/mol; = 39.8299 kJ/mol; = 43.0337 kJ/mol. Standard uncertainties: u(nAg) = 0.0000009 mol; u(nMg) = 0.0000041 mol; u(nTi) = 0.0000021; u(TD) = 1 K; u(TM) = 1 K; u(p) = 10 kPa; u(K) = 0.000000151 kJ/μVs. | ||||||
| nMg | ∆HSignal ·K | HDISS-Mg | xMg | ∆mixH | ΔMg | u(∆mixH) |
| 0.001489 | −0.010079 | −0.068 | 0.0999 | −4.579 | −45.8 | 0.012 |
| nTi | ∆HSignal ·K | HDISS-Ti | xTi | ∆mixH | ΔTi | u(∆mixH) |
| 0.0002402 | 0.009602 | −0.0007 | 0.0159 | −4.555 | −3.1 | 0.02 |
| 0.0005369 | 0.022891 | −0.0002 | 0.0495 | −4.412 | −0.4 | 0.05 |
| 0.0007584 | 0.025723 | −0.0069 | 0.0934 | −4.629 | −9.1 | 0.08 |
| 0.0006246 | 0.014385 | −0.0125 | 0.1266 | −5.192 | −20.0 | 0.09 |
| 0.0007145 | −0.019600 | −0.0503 | 0.1617 | −7.814 | −70.5 * | 0.11 |
| 0.0014164 | 0.048640 | −0.0123 | 0.2235 | −7.879 | −8.7 * | 0.15 |
| Series B: (Ag0.70Mg0.30)1−xTix Atmosphere: Argon at pressure p = 0.1 MPa. Starting parameters: nAg = 0.013119 mol; K = 0.000007296 kJ/μVs; TD = 298 K; TM = 1294 K; = 39.7295 kJ/mol; = 38.9594 kJ/mol; = 42.9264 kJ/mol. Standard uncertainties: u(nAg) = 0.0000009 mol; u(nMg) = 0.0000041 mol; u(nTi) = 0.0000021; u(TD) = 1 K; u(TM) = 1 K; u(p) = 10 kPa; u(K) = 0.000000030 kJ/μVs. | ||||||
| nMg | ∆HSignal ·K | HDISS-Mg | xMg | ∆mixH | ΔMg | u(∆mixH) |
| 0.005624 | −0.003969 | −0.223 | 0.3001 | −11.902 | −39.7 | 0.001 |
| nTi | ∆HSignal ·K | HDISS-Ti | xTi | ∆mixH | ΔTi | u(∆mixH) |
| 0.0004262 | −0.001736 | −0.020 | 0.0222 | −12.682 | −47.0 | 0.001 |
| 0.0004492 | 0.006449 | −0.013 | 0.0446 | −13.046 | −28.6 | 0.003 |
| 0.0004283 | 0.013037 | −0.005 | 0.0650 | −13.034 | −12.5 | 0.005 |
| 0.0008816 | 0.033552 | −0.004 | 0.1044 | −12.690 | −4.9 | 0.012 |
| 0.0009171 | 0.042679 | 0.003 | 0.1420 | −12.006 | 3.6 | 0.020 |
| 0.0009150 | 0.039681 | 0.000 | 0.1765 | −11.506 | 0.4 | 0.027 |
| 0.0011365 | 0.060138 | 0.011 | 0.2157 | −10.483 | 10.0 | 0.037 |
| 0.0023398 | 0.080252 | −0.020 | 0.2856 | −10.318 | −8.6 * | 0.049 |
| Series C: (Ag0.50Mg0.50)1−xTix Atmosphere: Argon at pressure p = 0.1 MPa. Starting parameters: nAg = 0.010210 mol; K = 0.000007166 kJ/μVs; TD = 298 K; TM = 1298 K; = 39.8634 kJ/mol; = 39.0967 kJ/mol; = 43.0695 kJ/mol. Standard uncertainties: u(nAg) = 0.0000009 mol; u(nMg) = 0.0000041 mol; u(nTi) = 0.0000021; u(TD) = 1 K; u(TM) = 1 K; u(p) = 10 kPa; u(K) = 0.000000123 kJ/μVs. | ||||||
| nMg | ∆HSignal ·K | HDISS-Mg | xMg | ∆mixH | ΔMg | u(∆mixH) |
| 0.003670 | −0.012785 | −0.156 | 0.2644 | −11.258 | −42.6 | 0.016 |
| 0.003275 | 0.048014 | −0.080 | 0.4048 | −13.774 | −24.4 | 0.064 |
| 0.003279 | 0.088052 | −0.040 | 0.5003 | −13.529 | −12.2 | 0.138 |
| nTi | ∆HSignal ·K | HDISS-Ti | xTi | ∆mixH | ΔTi | u(∆mixH) |
| 0.0005160 | 0.019757 | −0.0025 | 0.0246 | −13.313 | −4.8 | 0.154 |
| 0.0003990 | 0.019514 | 0.0023 | 0.0429 | −12.955 | 5.8 | 0.169 |
| 0.0004304 | 0.011631 | −0.0069 | 0.0618 | −13.016 | −16.0 | 0.179 |
| 0.0008649 | 0.037429 | 0.0002 | 0.0976 | −12.511 | 0.2 | 0.207 |
| 0.0008712 | 0.114159 | 0.0766 | 0.1310 | −8.789 | 88.0 * | 0.290 |
| 0.0022124 | 0.072838 | −0.0224 | 0.2058 | −8.906 | −10.1 * | 0.339 |
| Series D: (Ag0.30Mg0.70)1−xTix Atmosphere: Argon at pressure p = 0.1 MPa. Starting parameters: nAg = 0.010581 mol; K = 0.000007126 kJ/μVs; TD = 298 K; TM = 1297 K; = 39.8299 kJ/mol; = 39.0624 kJ/mol; = 43.0337 kJ/mol. Standard uncertainties: u(nAg) = 0.0000009 mol; u(nMg) = 0.0000041 mol; u(nTi) = 0.0000021; u(TD) = 1 K; u(TM) = 1 K; u(p) = 10 kPa; u(K) = 0.000000334 kJ/μVs. | ||||||
| nMg | ∆HSignal ·K | HDISS-Mg | xMg | ∆mixH | ΔMg | u(∆mixH) |
| 0.00822 | 0.060154 | −0.261 | 0.4373 | −13.885 | −31.7 | 0.150 |
| 0.00822 | 0.233755 | −0.087 | 0.6085 | −12.894 | −10.6 | 0.555 |
| 0.00824 | 0.281176 | −0.041 | 0.7000 | −11.036 | −4.9 | 0.929 |
| nTi | ∆HSignal ·K | HDISS-Ti | xTi | ∆mixH | ΔTi | u(∆mixH) |
| 0.0003928 | 0.008879 | −0.0080 | 0.0110 | −11.140 | −20.4 | 0.385 |
| 0.0004241 | 0.011736 | −0.0065 | 0.0226 | −11.189 | −15.4 | 0.401 |
| 0.0005223 | 0.017379 | −0.0051 | 0.0366 | −11.169 | −9.8 | 0.423 |
| 0.0009150 | 0.033982 | −0.0054 | 0.0601 | −11.040 | −5.9 | 0.465 |
| 0.0010592 | 0.037067 | −0.0085 | 0.0859 | −10.958 | −8.0 | 0.510 |
| 0.0015606 | 0.054283 | −0.0129 | 0.1214 | −10.853 | −8.2 | 0.574 |
| 0.0017674 | 0.067073 | −0.0090 | 0.1585 | −10.609 | −5.1 | 0.649 |
| 0.0019700 | 0.062100 | −0.0227 | 0.1963 | −10.650 | −11.5 * | 0.715 |
| 0.0019930 | 0.056292 | −0.0295 | 0.2312 | −10.830 | −14.8 * | 0.773 |
| Number of Dropped Moles ni [mol] | Heat Effect ∆HSignal ·K [kJ] | Drop Enthalpy HDISS-i [kJ] | Mole Fraction xi | Integral Molar Enthalpy ∆mixH [kJ/mol] | Partial Molar Enthalpy [kJ/mol] | Standard Uncertainties u(∆mixH) [kJ/mol] |
|---|---|---|---|---|---|---|
| Series E: (Ag0.95Ti0.05)1−xMgx Atmosphere: Argon at pressure p = 0.1 MPa. Starting parameters: nAg = 0.025064 mol; K = 0.000006794 kJ/μVs; TD = 298 K; TM = 1296 K; = 39.7964 kJ/mol; = 39.0281 kJ/mol; = 42.9979 kJ/mol. Standard uncertainties: u(nAg) = 0.0000009 mol; u(nMg) = 0.0000041 mol; u(nTi) = 0.0000021; u(TD) = 1 K; u(TM) = 1 K; u(p) = 10 kPa; u(K) = 0.000000158 kJ/μVs. | ||||||
| nTi | ∆HSignal ·K | HDISS-Mg | xTi | ∆mixH | ΔTi | u(∆mixH) |
| 0.00125 | 0.020789 | −0.033 | 0.0475 | −1.251 | −26.4 | 0.018 |
| nMg | ∆HSignal ·K | HDISS-Mg | xMg | ∆mixH | ΔMg | u(∆mixH) |
| 0.00109 | −0.009531 | −0.0519 | 0.0396 | −3.097 | −47.8 | 0.026 |
| 0.00123 | −0.005510 | −0.0534 | 0.0808 | −4.828 | −43.5 | 0.031 |
| 0.00160 | −0.010782 | −0.0731 | 0.1293 | −6.991 | −45.8 | 0.039 |
| 0.00170 | −0.003057 | −0.0694 | 0.1757 | −8.793 | −40.8 | 0.042 |
| 0.00156 | −0.005299 | −0.0662 | 0.2141 | −10.359 | −42.4 | 0.045 |
| 0.00592 | 0.088317 | −0.1428 | 0.3322 | −12.425 | −24.1 | 0.097 |
| 0.00583 | 0.108936 | −0.1184 | 0.4182 | −13.444 | −20.3 | 0.153 |
| 0.00569 | 0.165765 | −0.0565 | 0.4833 | −13.049 | −9.9 | 0.229 |
| 0.00804 | 0.228579 | −0.0853 | 0.5537 | −12.717 | −10.6 | 0.320 |
4. Conclusions
Author Contributions
Funding
Institutional Review Board Statement
Informed Consent Statement
Data Availability Statement
Conflicts of Interest
References
- Mezbahul-Islam, M.; Mostafa, A.O.; Medraj, M. Essential Magnesium Alloys Binary Phase Diagrams and Their Thermochemical Data. J. Mater. Sci. 2014, 2014, 704283. [Google Scholar] [CrossRef]
- Żemcżużnyj, S.F. Über Die Legierungen Des Magnesiums Mit Silber. Z. Anorg. Chem. 1906, 49, 400–414. [Google Scholar] [CrossRef]
- Lim, M.; Tibballs, J.E.; Rossiter, P.L. Thermodynamic Assessment of the Ag-Mg Binary System. Int. J. Mater. Res. 1997, 88, 162–169. [Google Scholar]
- Terlicka, S.; Dębski, A.; Sypien, A.; Gąsior, W.; Budziak, A. Determination of Thermophysical and Thermody- namic Properties, of Ag-Mg Alloys. Mater. Today Commun. 2021, 29, 102946. [Google Scholar] [CrossRef]
- Dębski, A.; Gierlotka, W.; Gąsior, W. Calorimetric Studies and Thermodynamic Calculations of the Ag-Mg System. J. Alloys Compd. 2022, 891, 161937. [Google Scholar] [CrossRef]
- Dai, C.; Malakhov, D.V. Reoptimization of the Ag-Mg System. J. Alloys Compd. 2015, 619, 20–25. [Google Scholar] [CrossRef]
- Kawakami, M. A Further Investigation of the Heat of Mixture in Molten Metals. Sci. Rep. Tohoku Imp. Univ. 1930, 7, 351–364. [Google Scholar]
- Murray, J.L.; Bhansali, K.J. The Ag−Ti (Silver-Titanium) system. Bull. Alloy Phase Diagr. 1983, 4, 178–183. [Google Scholar] [CrossRef]
- Gierlotka, W.; Dębski, A.; Gąsior, W.; Polański, M. Computational Approach to the Ag-Ti System. Comput. Mater. Sci. 2023, 230, 112519. [Google Scholar] [CrossRef]
- McQuillan, M.K. A Study of the Titanium Silver System. J. Inst. Met. 1960, 88, 235–239. [Google Scholar]
- Arróyave, R. Thermodynamics and Kinetics of Ceramic/Metal Interfacial Interactions; MIT Libraries: Cambridge, MA, USA, 1996; p. 286. Available online: https://dspace.mit.edu/handle/1721.1/16625 (accessed on 12 December 2023).
- Eremenko, V.N.; Buyanov, Y.I.; Panchenko, N.M. Constitution Diagram of the System Titanium-Silver. Sov. Powder Metall. Met. Ceram. 1969, 8, 562–566. [Google Scholar] [CrossRef]
- Fitzner, K.; Kleppa, O.J. Thermochemistry of Binary Alloys of Transition Metals: The Me-Ti, Me-Zr, and Me-Hf(Me = Ag, Au) Systems. Metall. Trans. A 1992, 23, 997–1003. [Google Scholar] [CrossRef]
- Murray, J.L. The Mg−Ti (Magnesium-Titanium) System. Bull. Alloy Phase Diagr. 1986, 7, 245–248. [Google Scholar] [CrossRef]
- Scientific Group Thermodata Europe Unary SGTE Database 5.0. 2015. Available online: https://www.sgte.net/en/sgte-substance-sgsub (accessed on 18 December 2023).
- Muggianu, Y.-M.; Gambino, M.; Bros, J.-P. Enthalpies of Formation of Liquid Bi-Ga-Sn Tin Alloys at 723 K -The Analytical Representation of the Total and Partial Excess Functions of Mixing. J. Chim. Phys. 1975, 72, 83–88. [Google Scholar] [CrossRef]
- Toop, G.W. Predicting Ternary Activities Using Binary Data. Trans. Metall. Soc. AIME 1965, 233, 850–855. [Google Scholar]
- Redlich, O.; Kister, A.T. Algebraic Representation of Thermodynamic Properties and the Classification of Solutions. Ind. Eng. Chem. Res. 1948, 40, 345–348. [Google Scholar] [CrossRef]
- Plevachuk, Y.; Yakymovych, A.; Fürtauer, S.; Ipser, H.; Flandorfer, H. The enthalpies of mixing of liquid Ni-Sn-Zn alloys. J. Phase Equilibria Diffus. 2014, 35, 359–368. [Google Scholar] [CrossRef] [PubMed]
- Yakymovych, A.; Fürtauer, S.; Flandorfer, H.; Ipser, H. Enthalpies of mixing of liquid ternary Co–Li–Sn alloys. Monatshefte Chem.-Chem. Mon. 2014, 145, 1697–1706. [Google Scholar] [CrossRef] [PubMed]
- Dezellus, O.; Arroyave, R.; Fries, S.G. Thermodynamic Modelling of the Ag–Cu–Ti Ternary System. Int. J. Mater. Res. 2011, 102, 286–297. [Google Scholar] [CrossRef]


| Chemical Name | Source | Purity [mass%] | Purification Method | Analysis Method |
|---|---|---|---|---|
| Magnesium | Goodfellow Cambridge Ltd., Huntingdon, England | 99.9 | None | Certified purity |
| Silver | Innovator Sp. z o.o., Gliwice, Poland | 99.9 | None | Certified purity |
| Titanium | Alfa Aesar, Thermo Scientific Kandel GmBH, Kandel, Germany | 99.99 | None | Certified purity |
| Argon | Pioniergas, Kraków, Poland | 99.9999 | None | Certified purity |
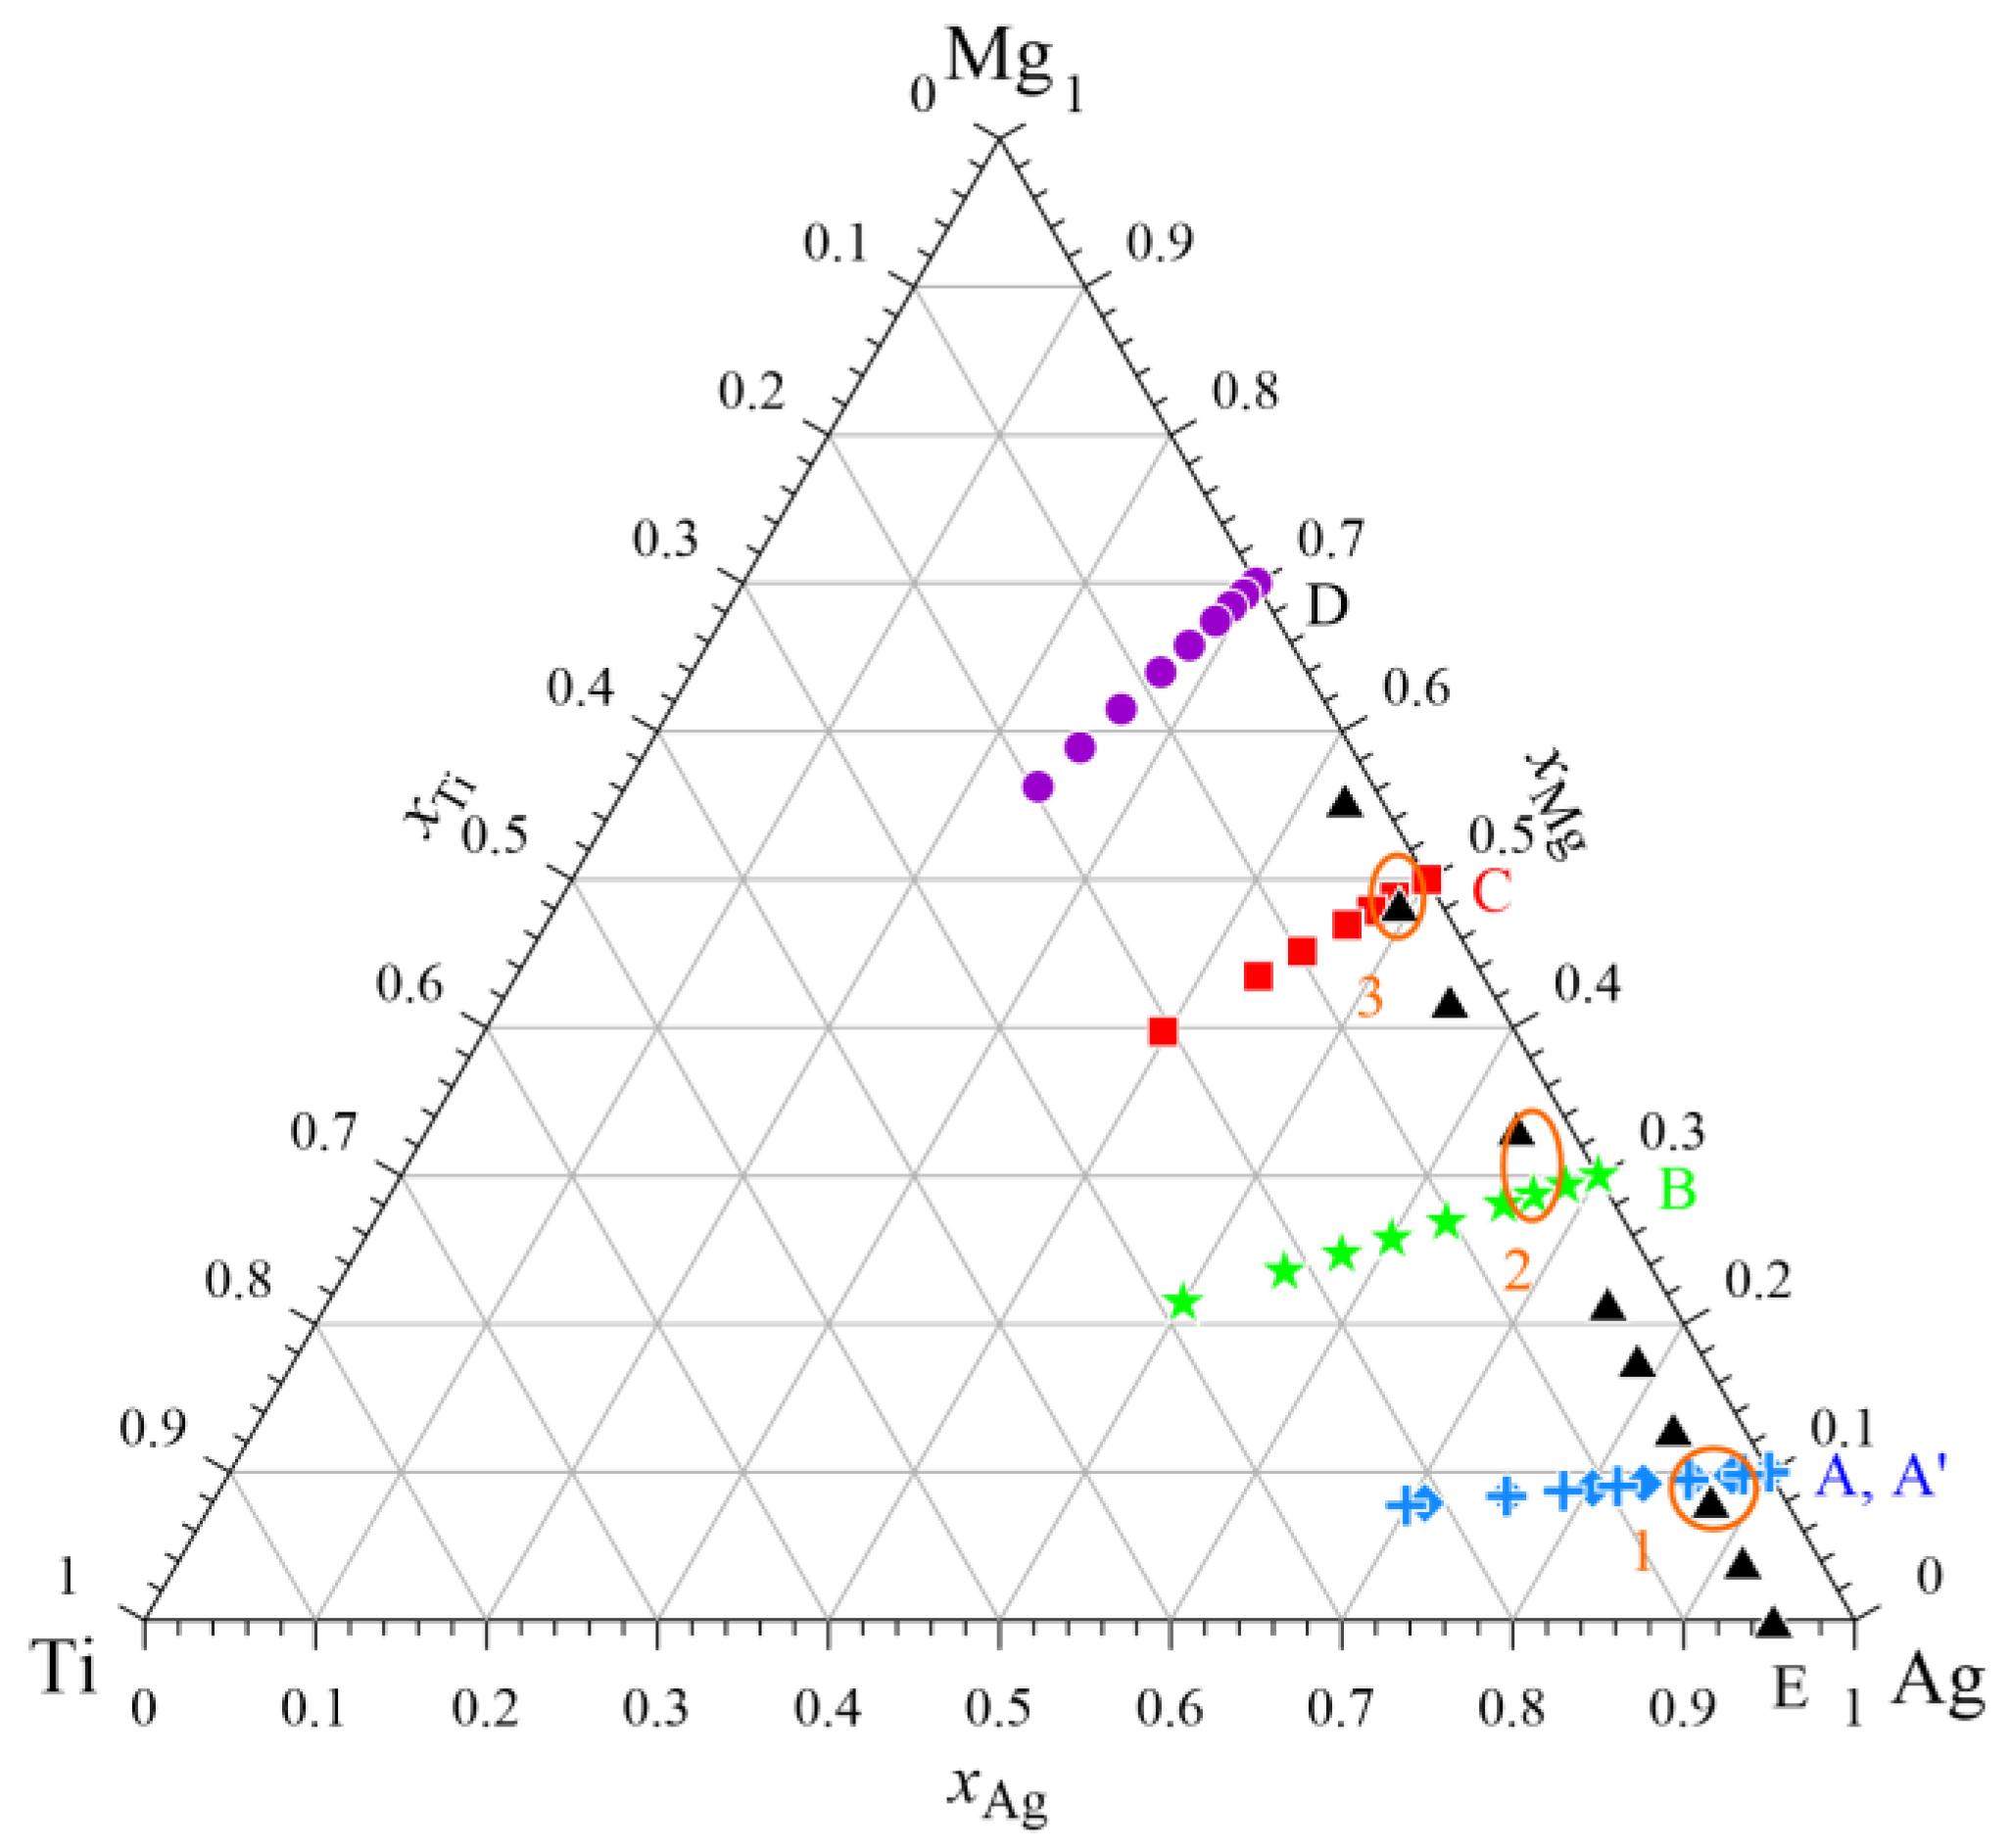
| Points of Intersection | A | A’ | B | C | E |
|---|---|---|---|---|---|
| 1 | −4.855 | −4.412 | −4.828 | ||
| 2 | −13.046 | −12.425 | |||
| 3 | −13.313 | −13.049 |
| System | Interaction Parameters [J/mol] | Reference |
|---|---|---|
| Ag–Mg | −53,346.5 | [5] |
| −3694 | ||
| −905.8 | ||
| Ag–Ti | −10,011.8 | [This study] |
| −18,866.8 | ||
| Mg–Ti | 77,020 | [14] |
| Ag–Mg–Ti | −198,140.53 | [This study] |
| −434,984.54 | ||
| 59,643.579 |
| xAg | xMg | xTi | Ag | Mg | Ti | ∆mixH |
|---|---|---|---|---|---|---|
| kJ/mol | ||||||
| Series A and A’: (Ag0.90Mg0.10)1−xTix alloys at T = 1297 K | ||||||
| 0.900 | 0.100 | 0.00 | −0.661 | −45.241 | −31.065 | −5.119 |
| 0.855 | 0.095 | 0.05 | −0.846 | −46.036 | −21.246 | −6.159 |
| 0.810 | 0.090 | 0.10 | −1.601 | −45.635 | −13.281 | −6.732 |
| 0.720 | 0.080 | 0.20 | −4.214 | −41.378 | −2.077 | −6.759 |
| 0.630 | 0.070 | 0.30 | −7.397 | −32.844 | 4.112 | −5.726 |
| 0.540 | 0.060 | 0.40 | −10.228 | −20.588 | 6.663 | −4.093 |
| 0.450 | 0.050 | 0.50 | −11.967 | −5.350 | 6.778 | −2.264 |
| 0.360 | 0.040 | 0.60 | −12.058 | 11.952 | 5.471 | −0.580 |
| 0.270 | 0.030 | 0.70 | −10.124 | 30.215 | 3.579 | 0.678 |
| 0.180 | 0.020 | 0.80 | −5.971 | 48.155 | 1.753 | 1.290 |
| 0.090 | 0.010 | 0.90 | 0.412 | 64.306 | 0.464 | 1.097 |
| 0.000 | 0.000 | 1.00 | 8.855 | 77.020 | 0.000 | 0.000 |
| Series B: (Ag0.70Mg0.30)1−xTix alloys at T = 1297 K | ||||||
| 0.700 | 0.300 | 0.00 | −5.504 | −25.636 | −37.763 | −11.544 |
| 0.665 | 0.285 | 0.05 | −5.750 | −26.431 | −21.224 | −12.418 |
| 0.630 | 0.270 | 0.10 | −7.018 | −26.909 | −8.348 | −12.521 |
| 0.560 | 0.240 | 0.20 | −11.373 | −26.211 | 8,325 | −10.994 |
| 0.490 | 0.210 | 0.30 | −16.389 | −22.449 | 15,769 | −8.014 |
| 0.420 | 0.180 | 0.40 | −20.381 | −15.030 | 16.997 | −4.467 |
| 0.350 | 0.150 | 0.50 | −22.163 | −3.854 | 14.526 | −1.072 |
| 0.280 | 0.120 | 0.60 | −21.044 | 10.680 | 10.377 | 1.615 |
| 0.210 | 0.090 | 0.70 | −16.830 | 27.676 | 6.072 | 3.207 |
| 0.140 | 0.060 | 0.80 | −9.826 | 45.740 | 2.637 | 3.479 |
| 0.070 | 0.030 | 0.90 | −0.831 | 62.984 | 0.603 | 2.374 |
| 0.000 | 0.000 | 1.00 | 8.855 | 77.020 | 0.000 | 0.000 |
| Series C: (Ag0.50Mg0.50)1−xTix alloys at T = 1297 K | ||||||
| 0.500 | 0.500 | 0.00 | −14.260 | −12.413 | −37.016 | −13.337 |
| 0.475 | 0.475 | 0.05 | −15.927 | −11.731 | −17.137 | −13.994 |
| 0.450 | 0.450 | 0.10 | −18.502 | −11.589 | −1.920 | −13.733 |
| 0.400 | 0.400 | 0.20 | −24.897 | −11.623 | 17.046 | −11.199 |
| 0.350 | 0.350 | 0.30 | −30.906 | −10.332 | 24.498 | −7.084 |
| 0.300 | 0.300 | 0.40 | −34.669 | −6.209 | 24.377 | −2.513 |
| 0.250 | 0.250 | 0.50 | −35.001 | 1.576 | 19.947 | 1.617 |
| 0.200 | 0.200 | 0.60 | −31.394 | 13.172 | 13.795 | 4.633 |
| 0.150 | 0.150 | 0.70 | −24.019 | 28.056 | 7.831 | 6.087 |
| 0.100 | 0.100 | 0.80 | −13.724 | 45.025 | 3.286 | 5.759 |
| 0.050 | 0.050 | 0.90 | −2.032 | 62.198 | 0.717 | 3.653 |
| 0.000 | 0.000 | 1.00 | 8.855 | 77.020 | 0.000 | 0.000 |
| Series D: (Ag0.30Mg0.70)1−xTix alloys at T = 1297 K | ||||||
| 0.300 | 0.700 | 0.00 | −26.360 | −4.307 | −16.539 | −10.923 |
| 0.285 | 0.665 | 0.05 | −32.359 | −2.322 | 0.080 | −10.762 |
| 0.270 | 0.630 | 0.10 | −38.140 | −1.256 | 12.461 | −9.843 |
| 0.240 | 0.560 | 0.20 | −48.008 | −0.482 | 26.862 | −6.419 |
| 0.210 | 0.490 | 0.30 | −54.285 | 0.412 | 30.980 | −1.904 |
| 0.180 | 0.420 | 0.40 | −55.933 | 3.184 | 28.491 | 2.666 |
| 0.150 | 0.350 | 0.50 | −52.554 | 8.951 | 22.431 | 6.465 |
| 0.120 | 0.280 | 0.60 | −44.391 | 18.191 | 15.195 | 8.884 |
| 0.090 | 0.210 | 0.70 | −32.325 | 30.742 | 8.539 | 9.524 |
| 0.060 | 0.140 | 0.80 | −17.880 | 45.799 | 3.578 | 8.202 |
| 0.030 | 0.070 | 0.90 | −3.219 | 61.919 | 0.787 | 4.946 |
| 0.000 | 0.000 | 1.00 | 8.855 | 77.020 | 0.000 | 0.000 |
| Series E: (Ag0.9525Ti0.0475)1−xMgx alloys at T = 1297 K | ||||||
| 0.95250 | 0.00 | 0.04750 | −0.142 | −57.701 | −22.948 | −1.226 |
| 0.90488 | 0.05 | 0.04513 | −0.338 | −51.439 | −22.404 | −3.889 |
| 0.85725 | 0.10 | 0.04275 | −0.836 | −45.499 | −22.547 | −6.231 |
| 0.76200 | 0.20 | 0.03800 | −2.760 | −34.665 | −24.180 | −9.955 |
| 0.66675 | 0.30 | 0.03325 | −5.915 | −25.322 | −26.385 | −12.418 |
| 0.57150 | 0.40 | 0.02850 | −10.246 | −17.536 | −27.643 | −13.658 |
| 0.47625 | 0.50 | 0.02375 | −15.640 | −11.317 | −26.376 | −13.733 |
| 0.38100 | 0.60 | 0.01900 | −21.925 | −6.615 | −20.952 | −12.721 |
| 0.28575 | 0.70 | 0.01425 | −28.873 | −3.325 | −9.678 | −10.716 |
| 0.19050 | 0.80 | 0.00950 | −36.200 | −1.283 | 9.195 | −7.835 |
| 0.09525 | 0.90 | 0.00475 | −43.562 | −0.267 | 37.473 | −4.212 |
| 0.00000 | 1.00 | 0.00000 | −50.559 | 0.000 | 77.020 | 0.000 |
Disclaimer/Publisher’s Note: The statements, opinions and data contained in all publications are solely those of the individual author(s) and contributor(s) and not of MDPI and/or the editor(s). MDPI and/or the editor(s) disclaim responsibility for any injury to people or property resulting from any ideas, methods, instructions or products referred to in the content. |
© 2024 by the authors. Licensee MDPI, Basel, Switzerland. This article is an open access article distributed under the terms and conditions of the Creative Commons Attribution (CC BY) license (https://creativecommons.org/licenses/by/4.0/).
Share and Cite
Gozdur, W.; Gąsior, W.; Zrobek, M.; Budziak, A.; Dębski, R.; Gierlotka, W.; Pęska, M.; Polański, M.; Dębski, A. Calorimetric Studies and Thermodynamic Modeling of Ag–Mg–Ti Liquid Alloys. Materials 2024, 17, 1786. https://doi.org/10.3390/ma17081786
Gozdur W, Gąsior W, Zrobek M, Budziak A, Dębski R, Gierlotka W, Pęska M, Polański M, Dębski A. Calorimetric Studies and Thermodynamic Modeling of Ag–Mg–Ti Liquid Alloys. Materials. 2024; 17(8):1786. https://doi.org/10.3390/ma17081786
Chicago/Turabian StyleGozdur, Weronika, Władysław Gąsior, Maciej Zrobek, Andrzej Budziak, Roman Dębski, Wojciech Gierlotka, Magda Pęska, Marek Polański, and Adam Dębski. 2024. "Calorimetric Studies and Thermodynamic Modeling of Ag–Mg–Ti Liquid Alloys" Materials 17, no. 8: 1786. https://doi.org/10.3390/ma17081786