
A Multivariate Linear Regression-Based Ultrasonic Non-Destructive Evaluating Method for Characterizing Weld Tensile Strength Properties


Abstract
:1. Introduction
2. Methodology
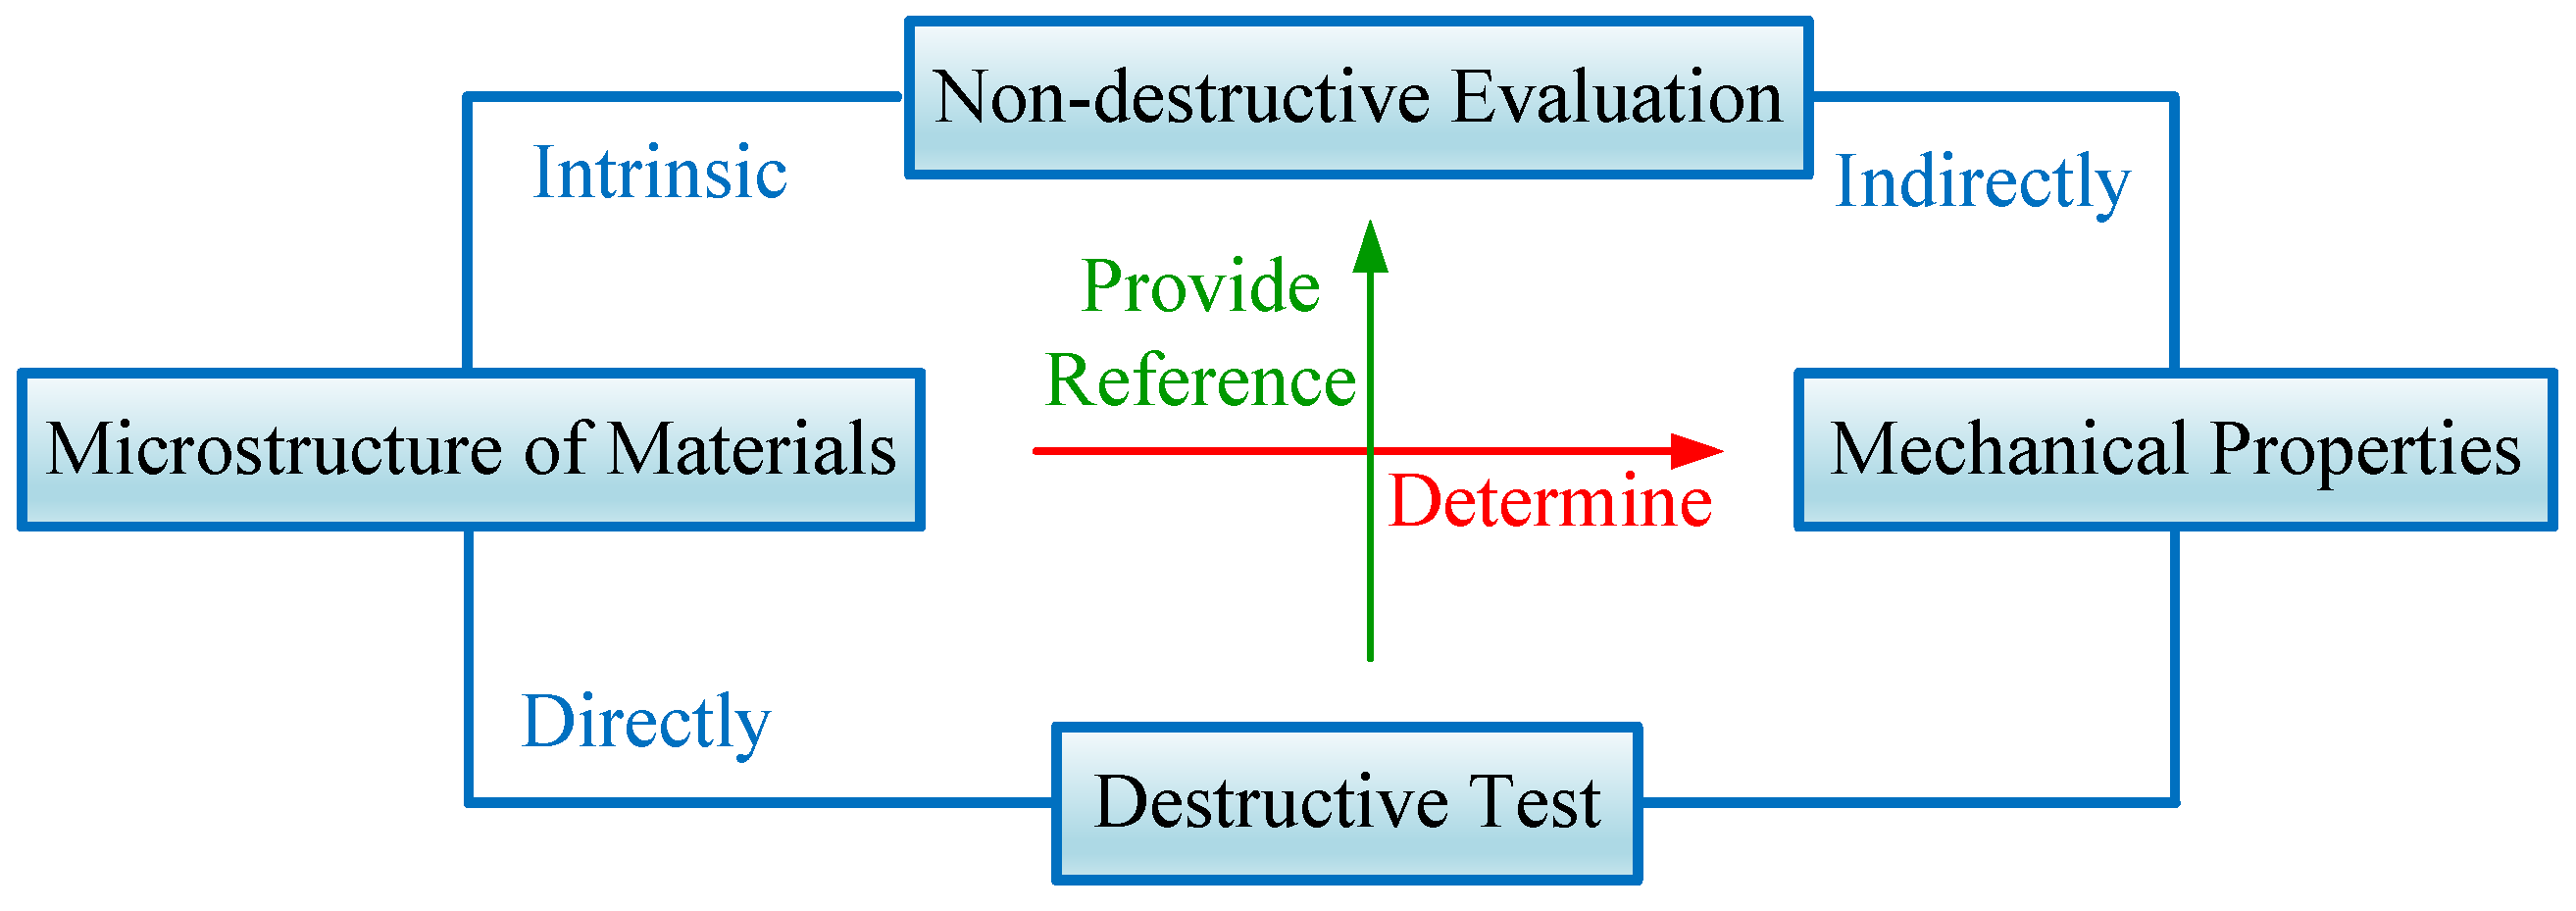
2.1. Principle
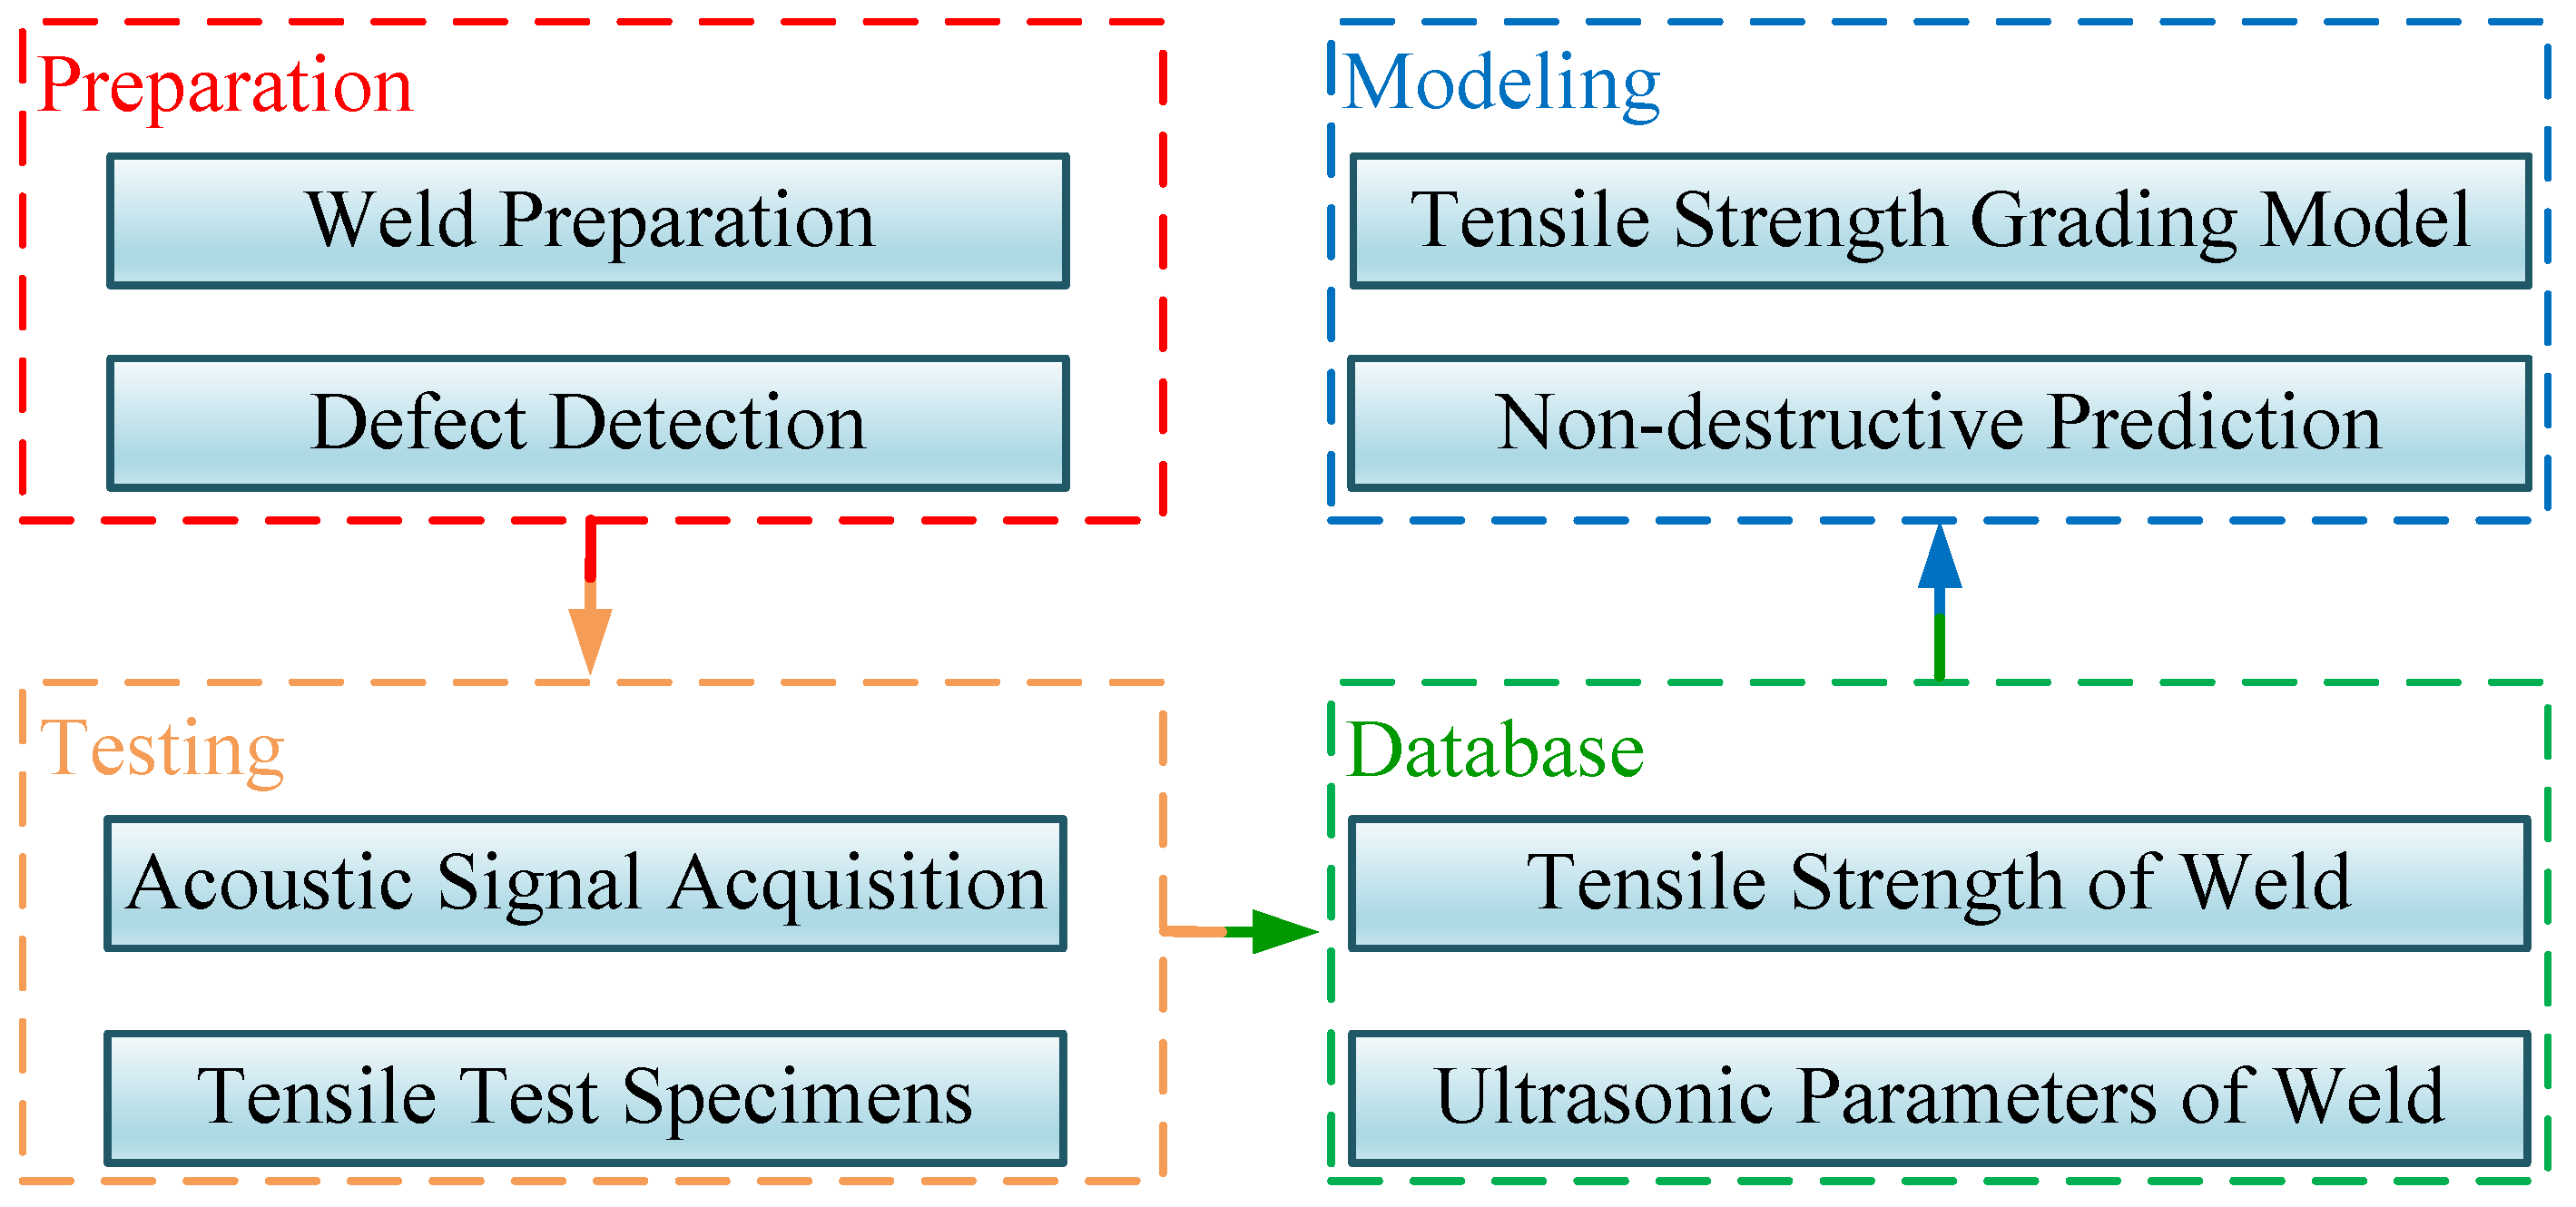
2.2. Research Process
3. Specimens and Test System
3.1. Preparation for Weld Specimen
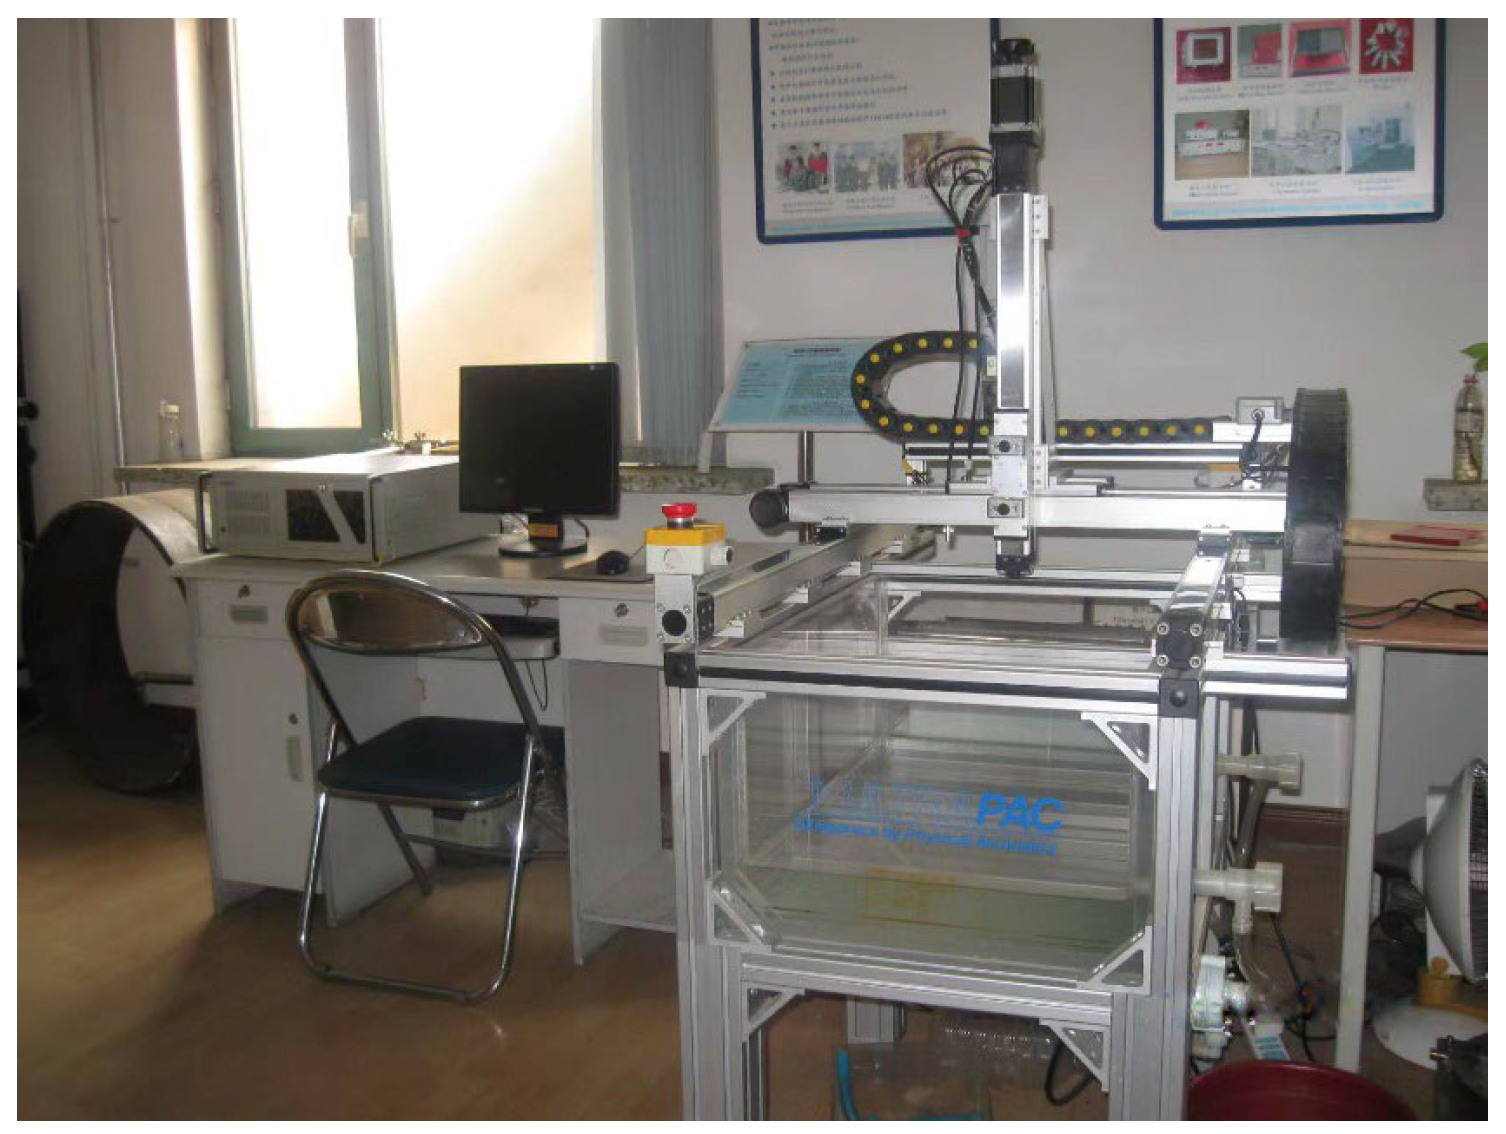
3.2. Ultrasonic Test System
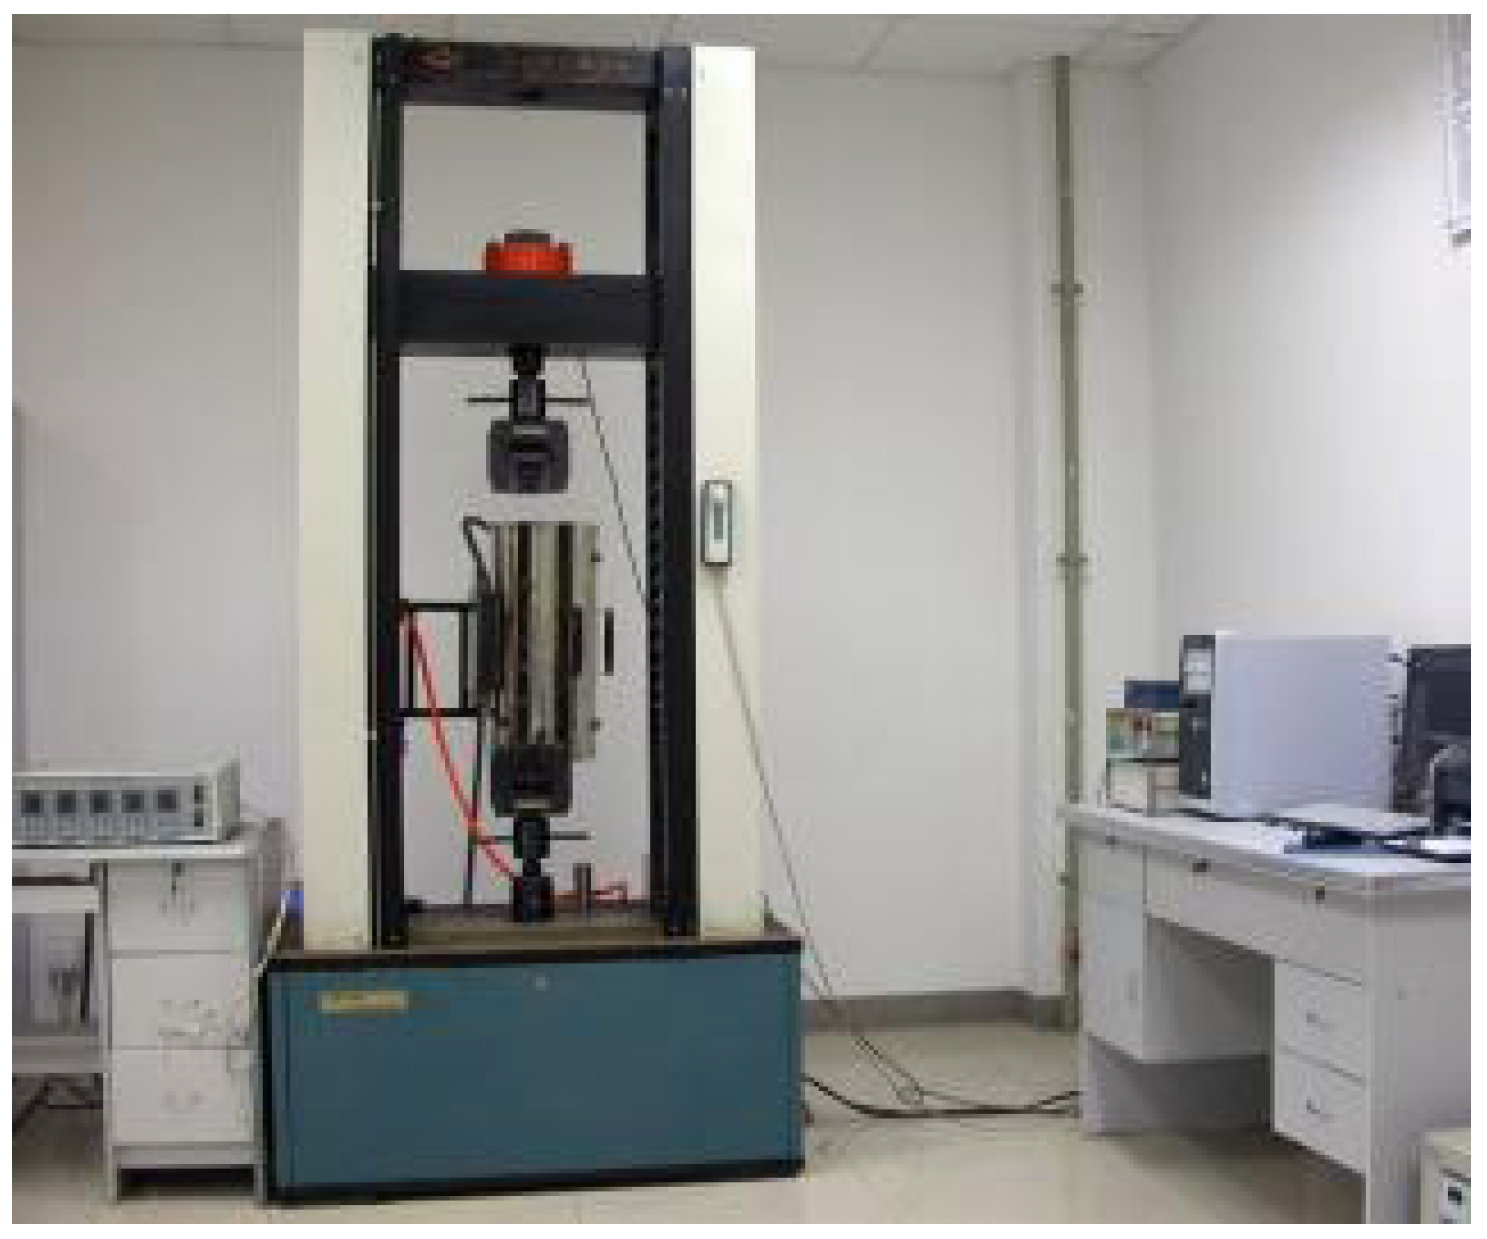
3.3. Tensile Test System
4. Databases
4.1. Ultrasonic Characteristic Parameters Database
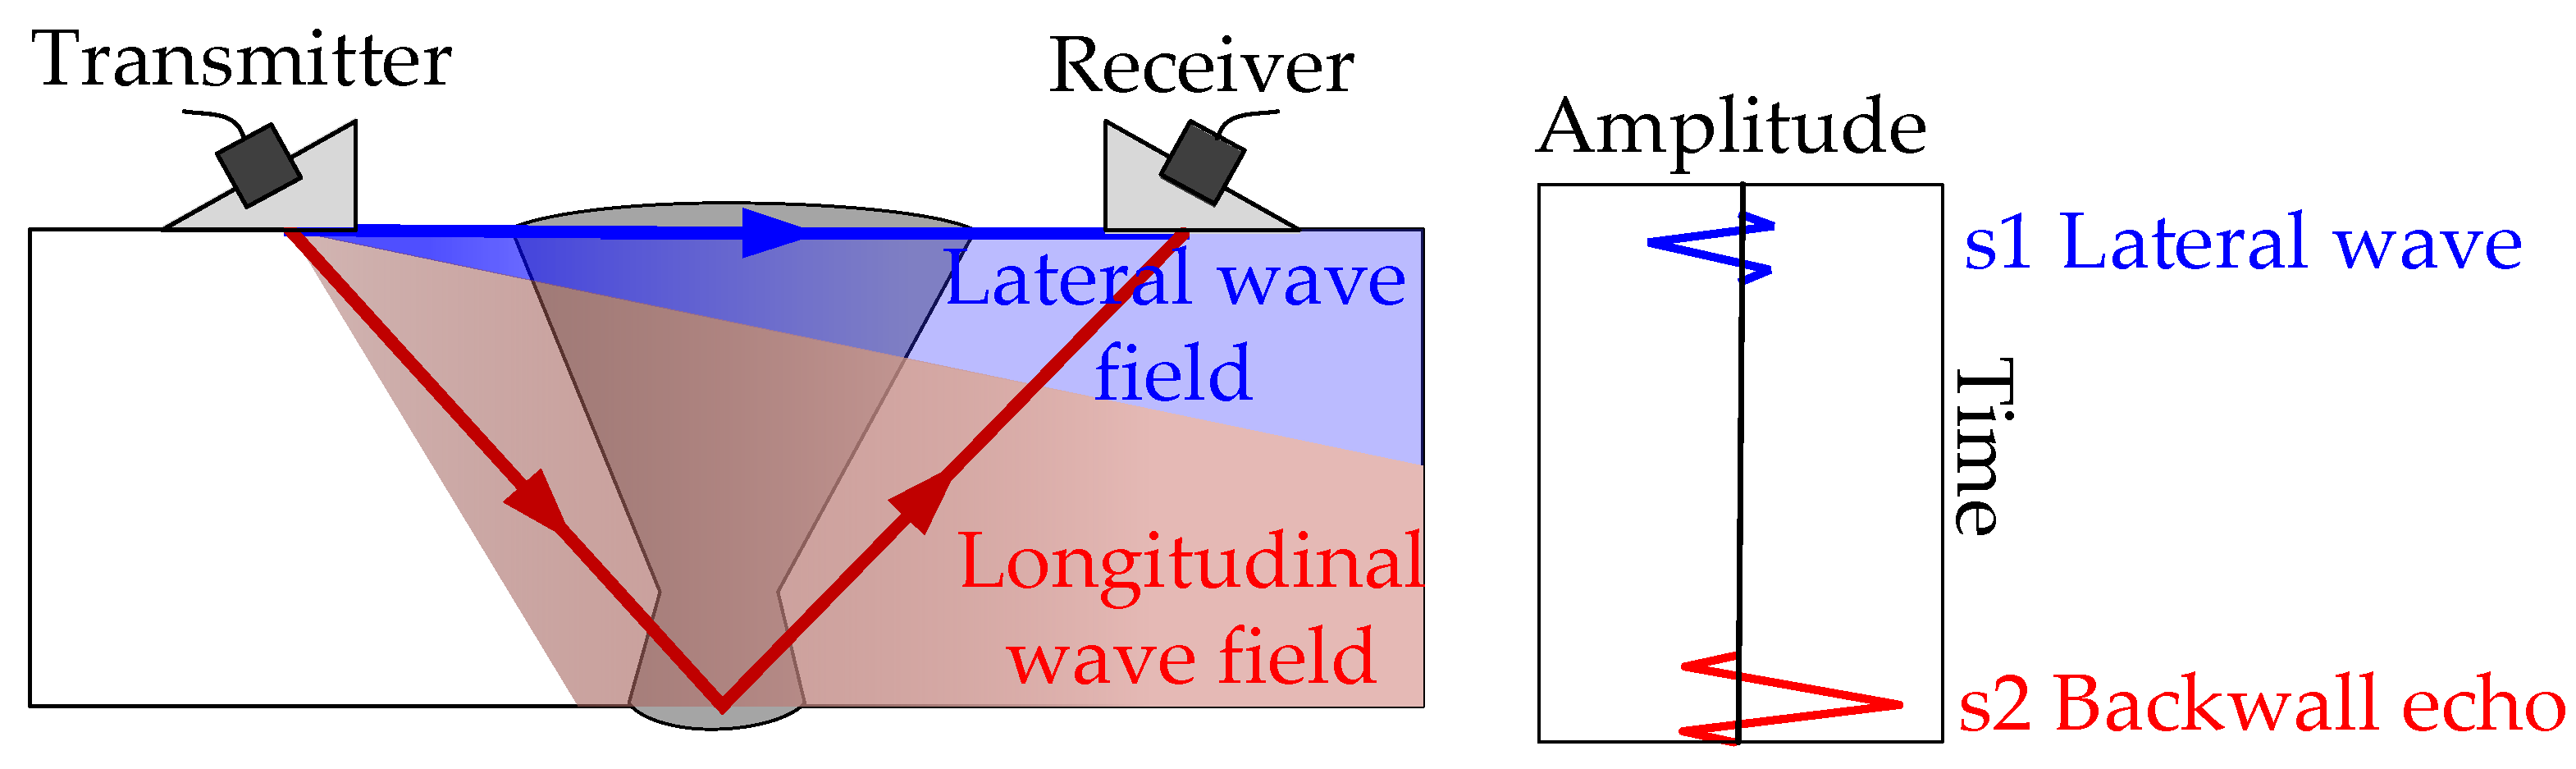
4.1.1. Method for Acquiring Ultrasonic Signals
4.1.2. Ultrasonic Characteristic Parameters
4.2. Tensile Strength Database
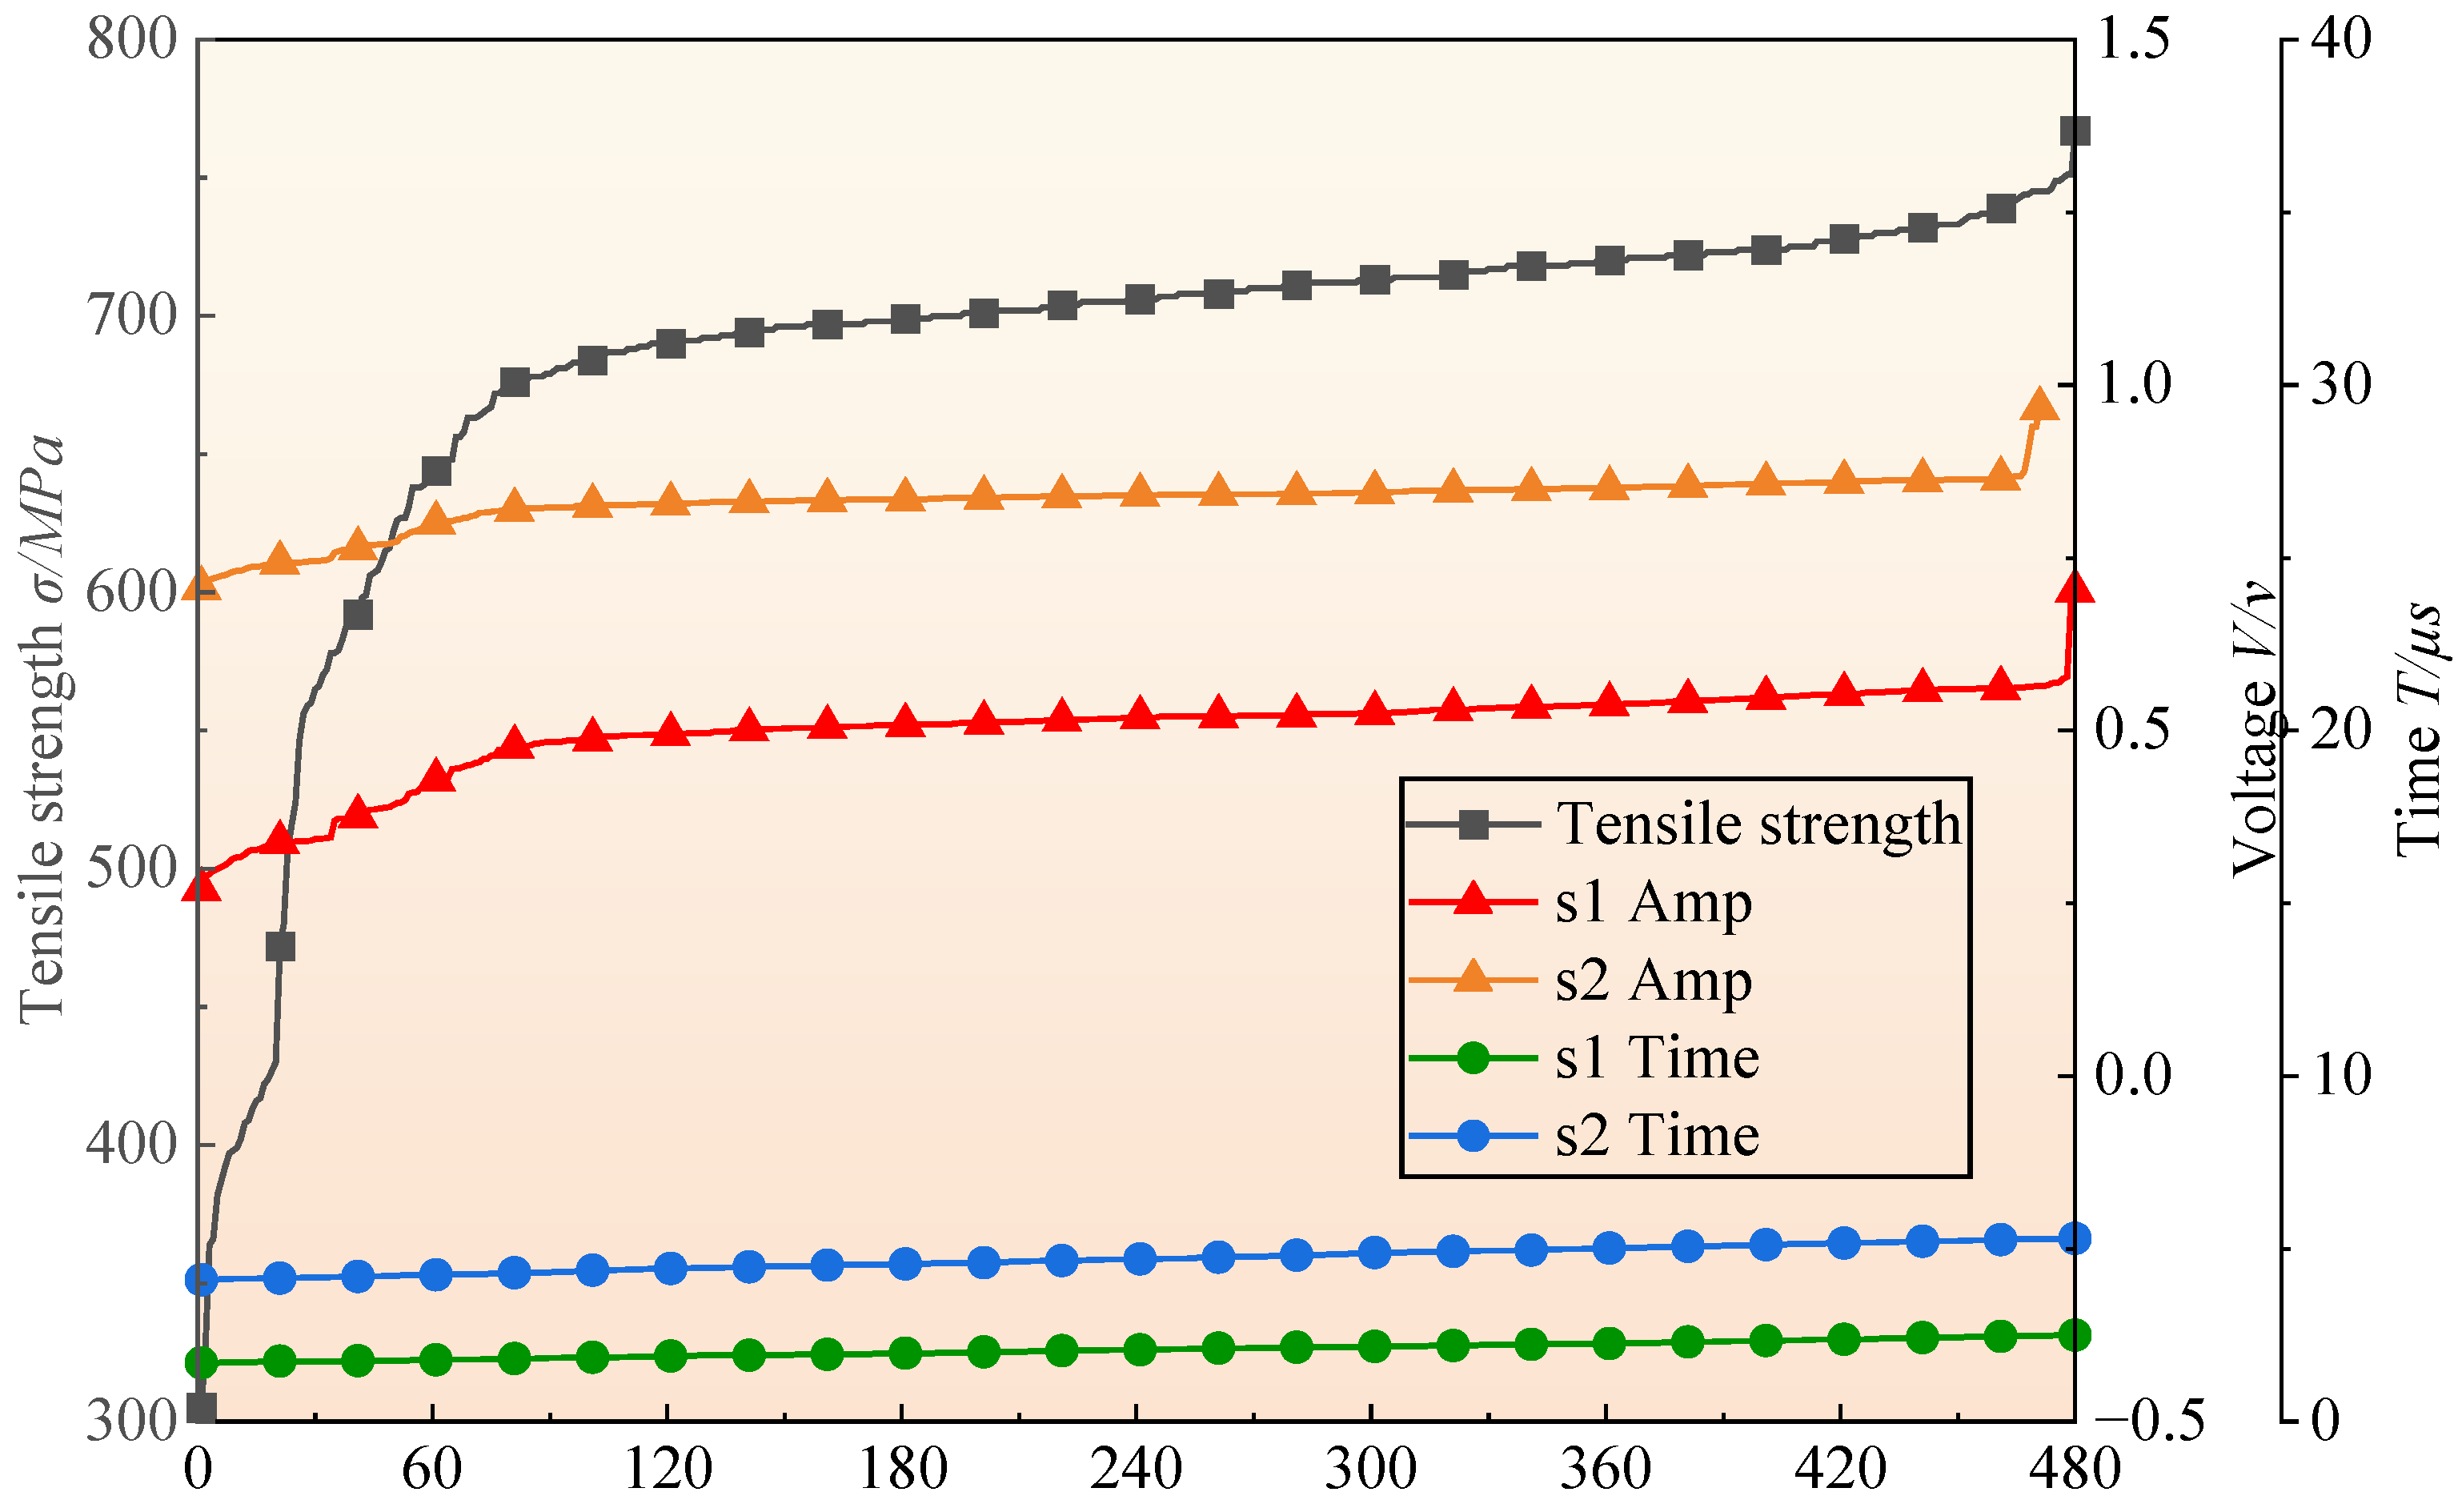
4.3. Demonstration of Databases
5. Evaluation of Weld Tensile Strength
5.1. MLR Model
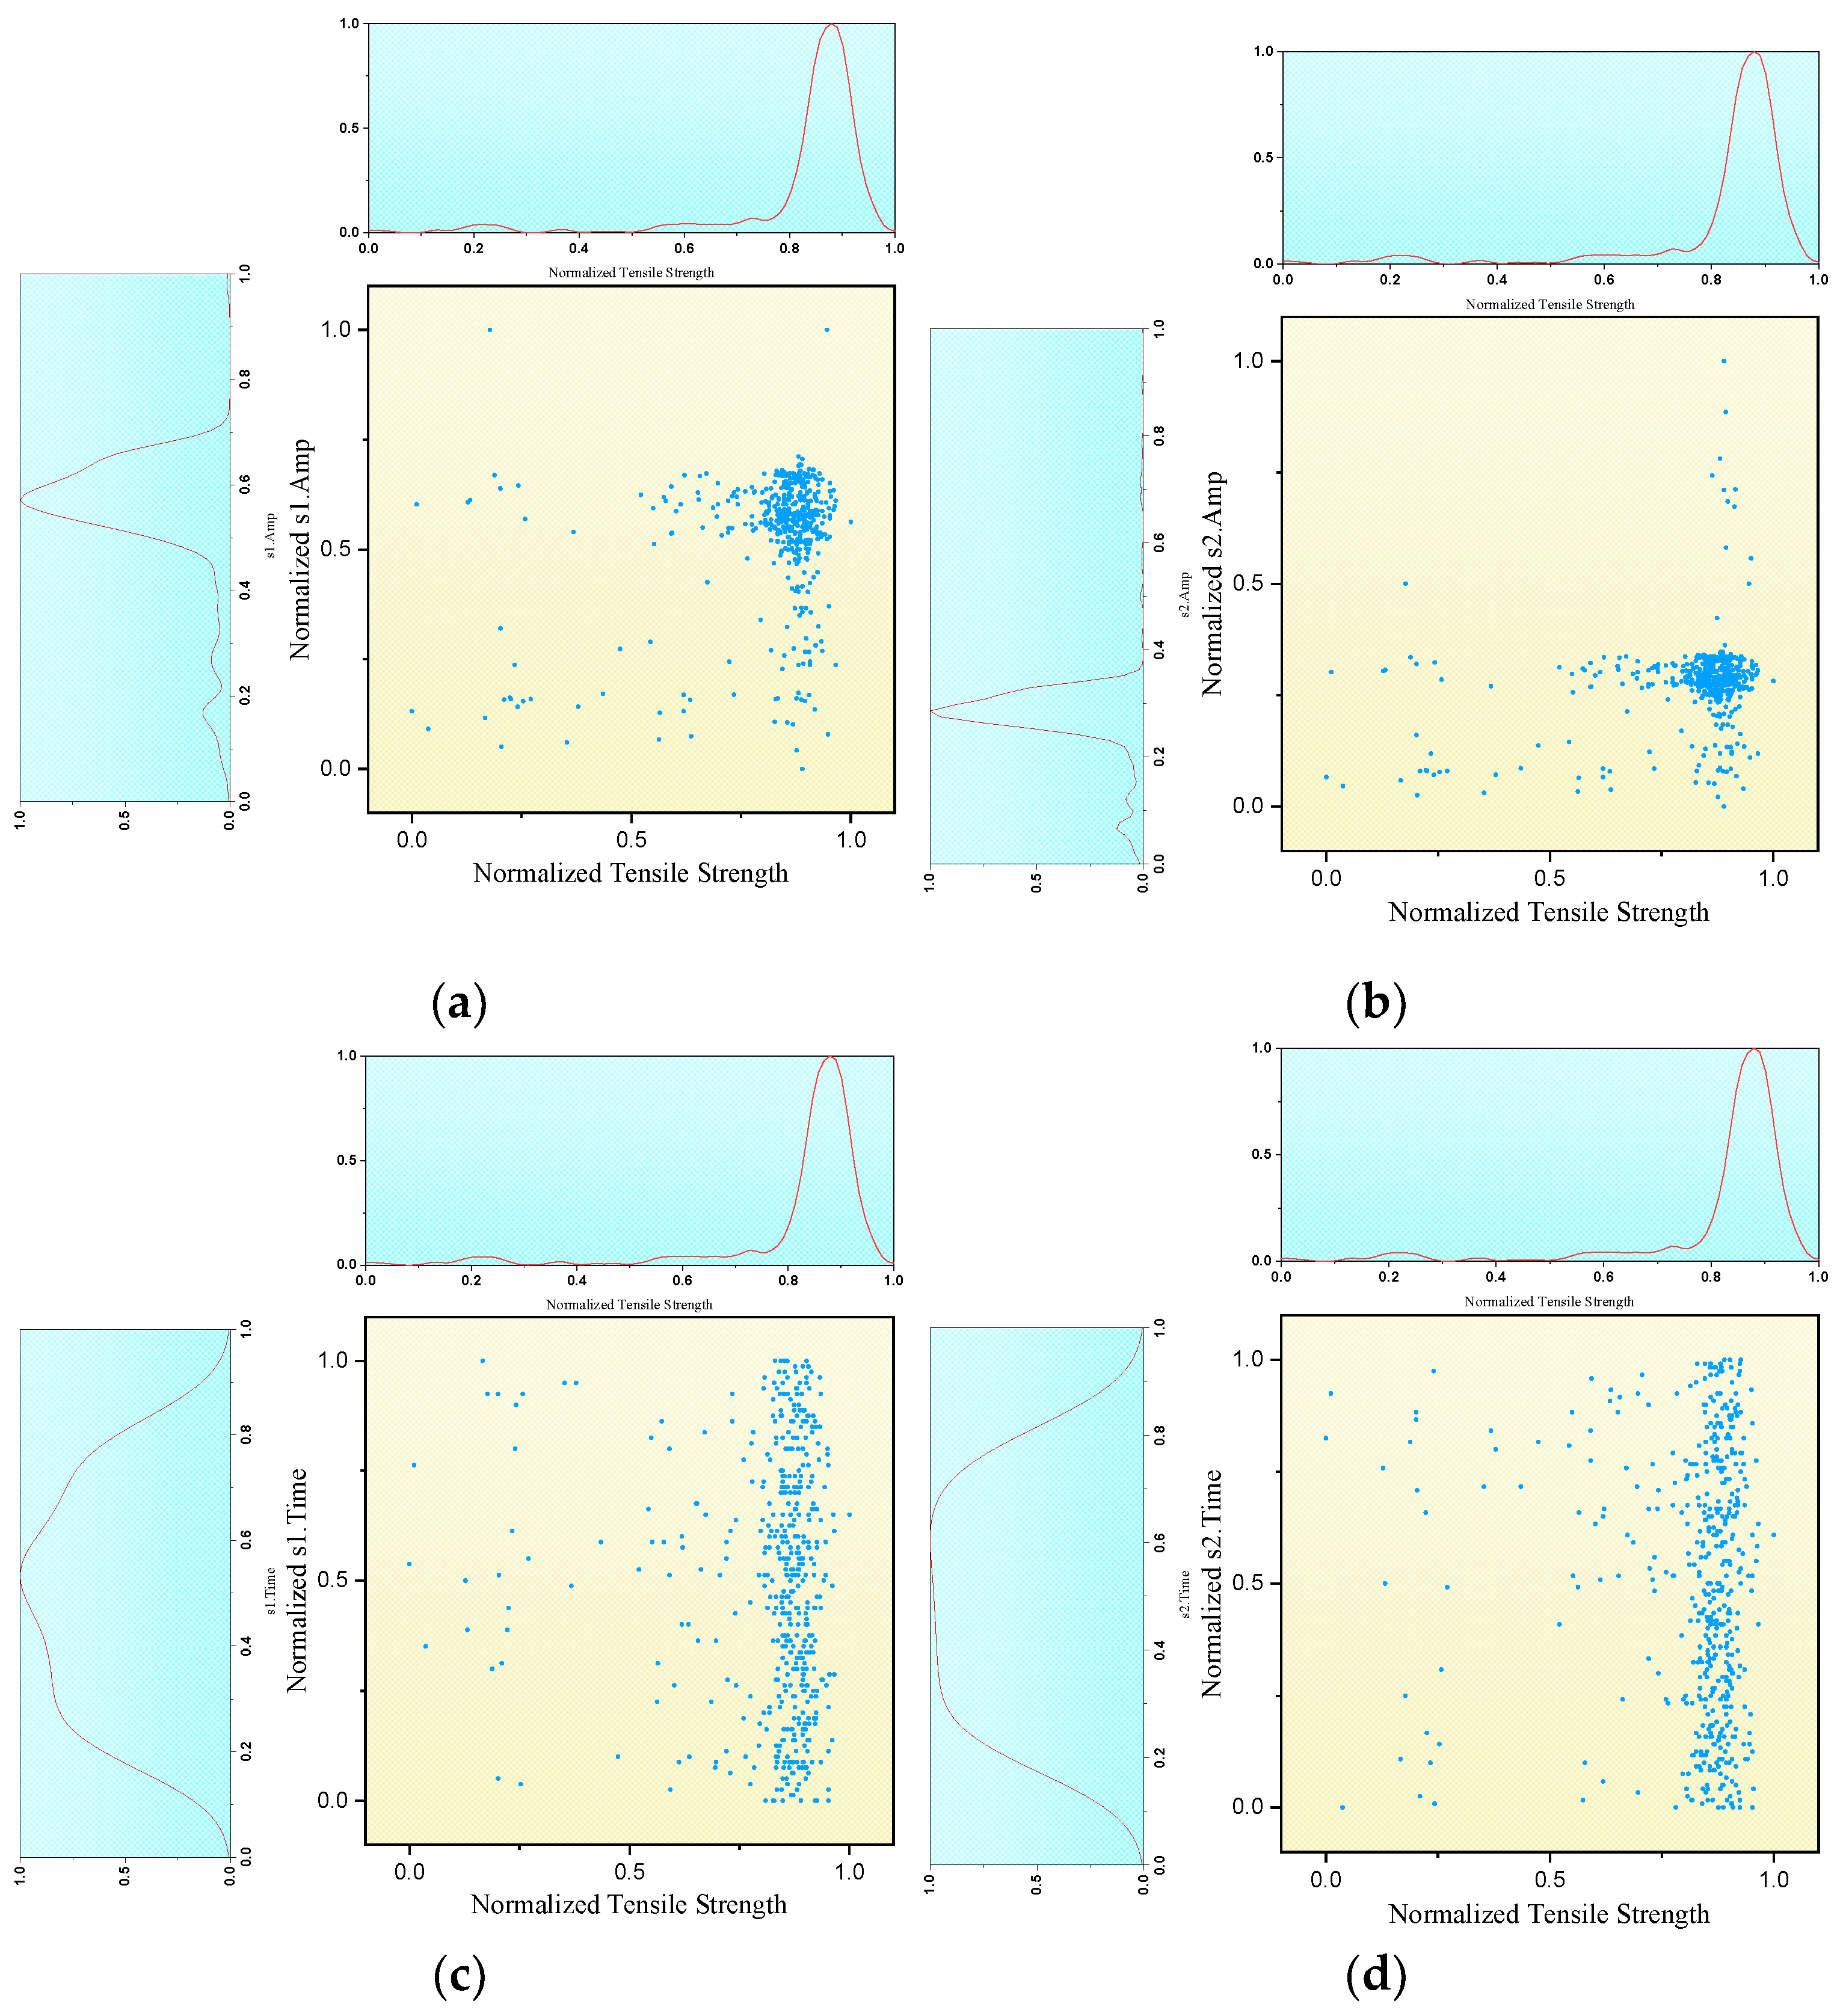
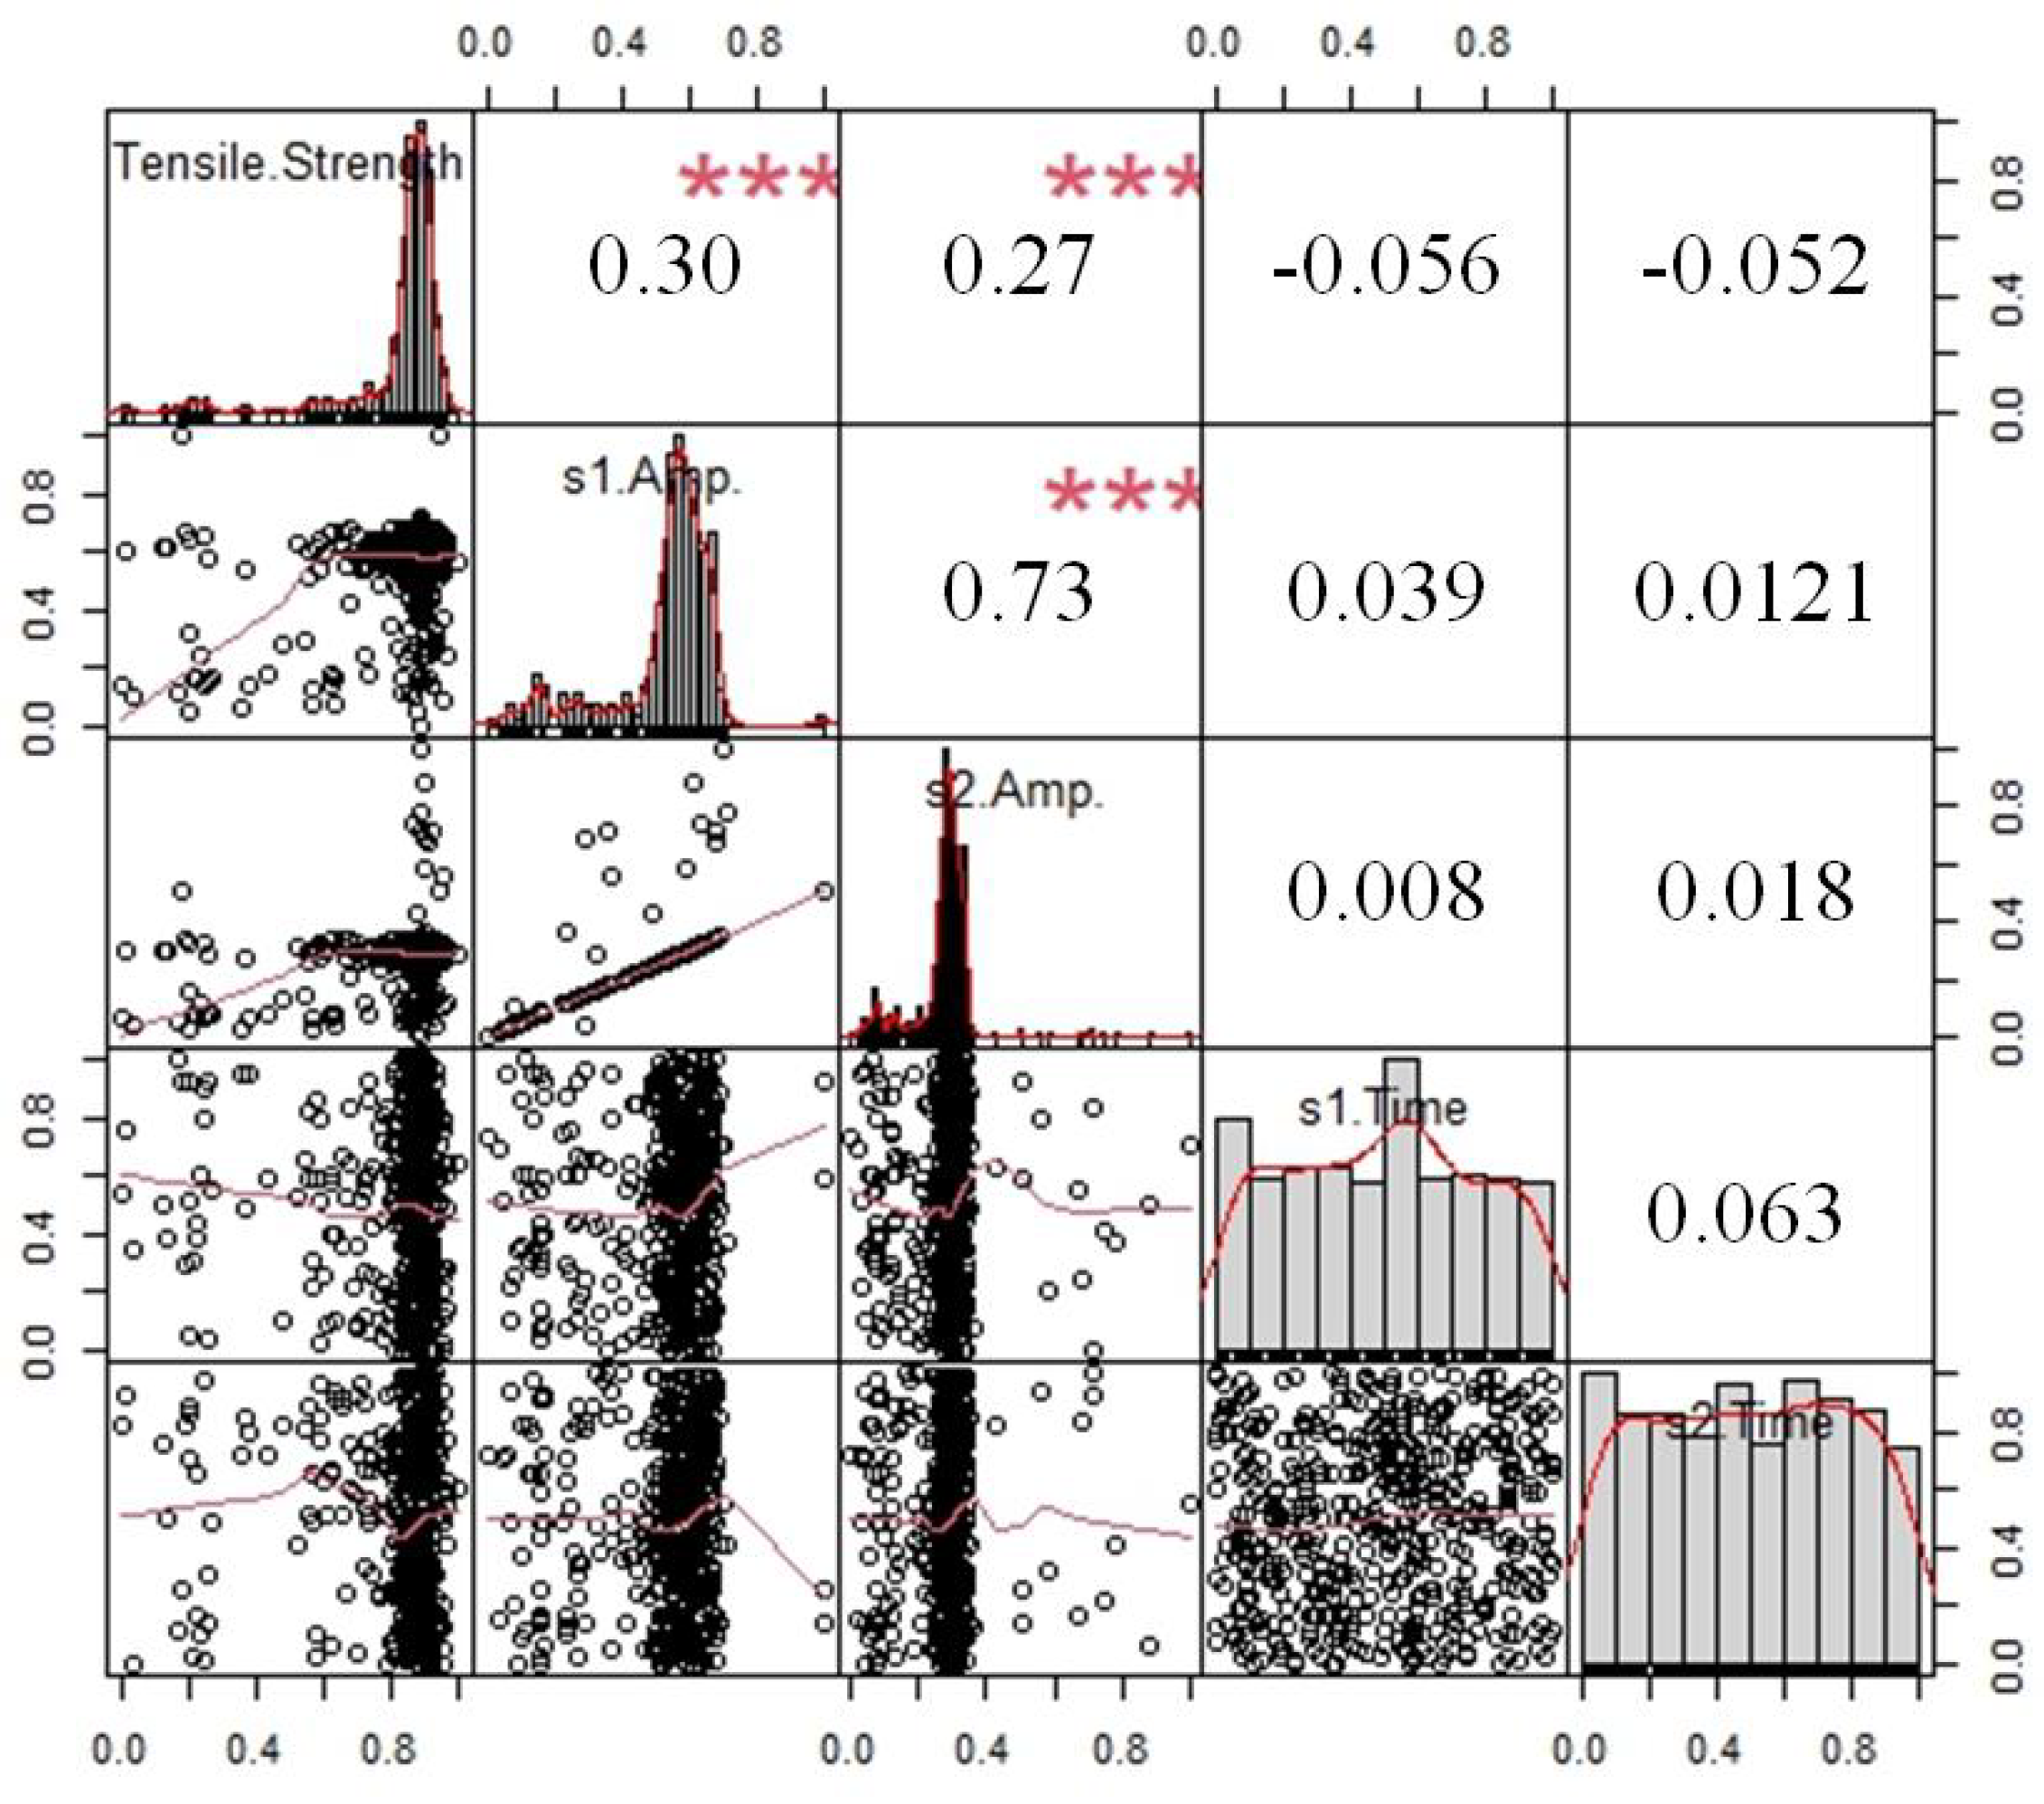
5.1.1. Correlation Analysis and Variable Selection
5.1.2. MLR Prediction Model for Tensile Strength
5.2. Evaluation Model for Weld Tensile Strength Properties
6. Discussion
6.1. Signal Extraction
6.2. Selection of Ultrasonic Characteristic Parameters
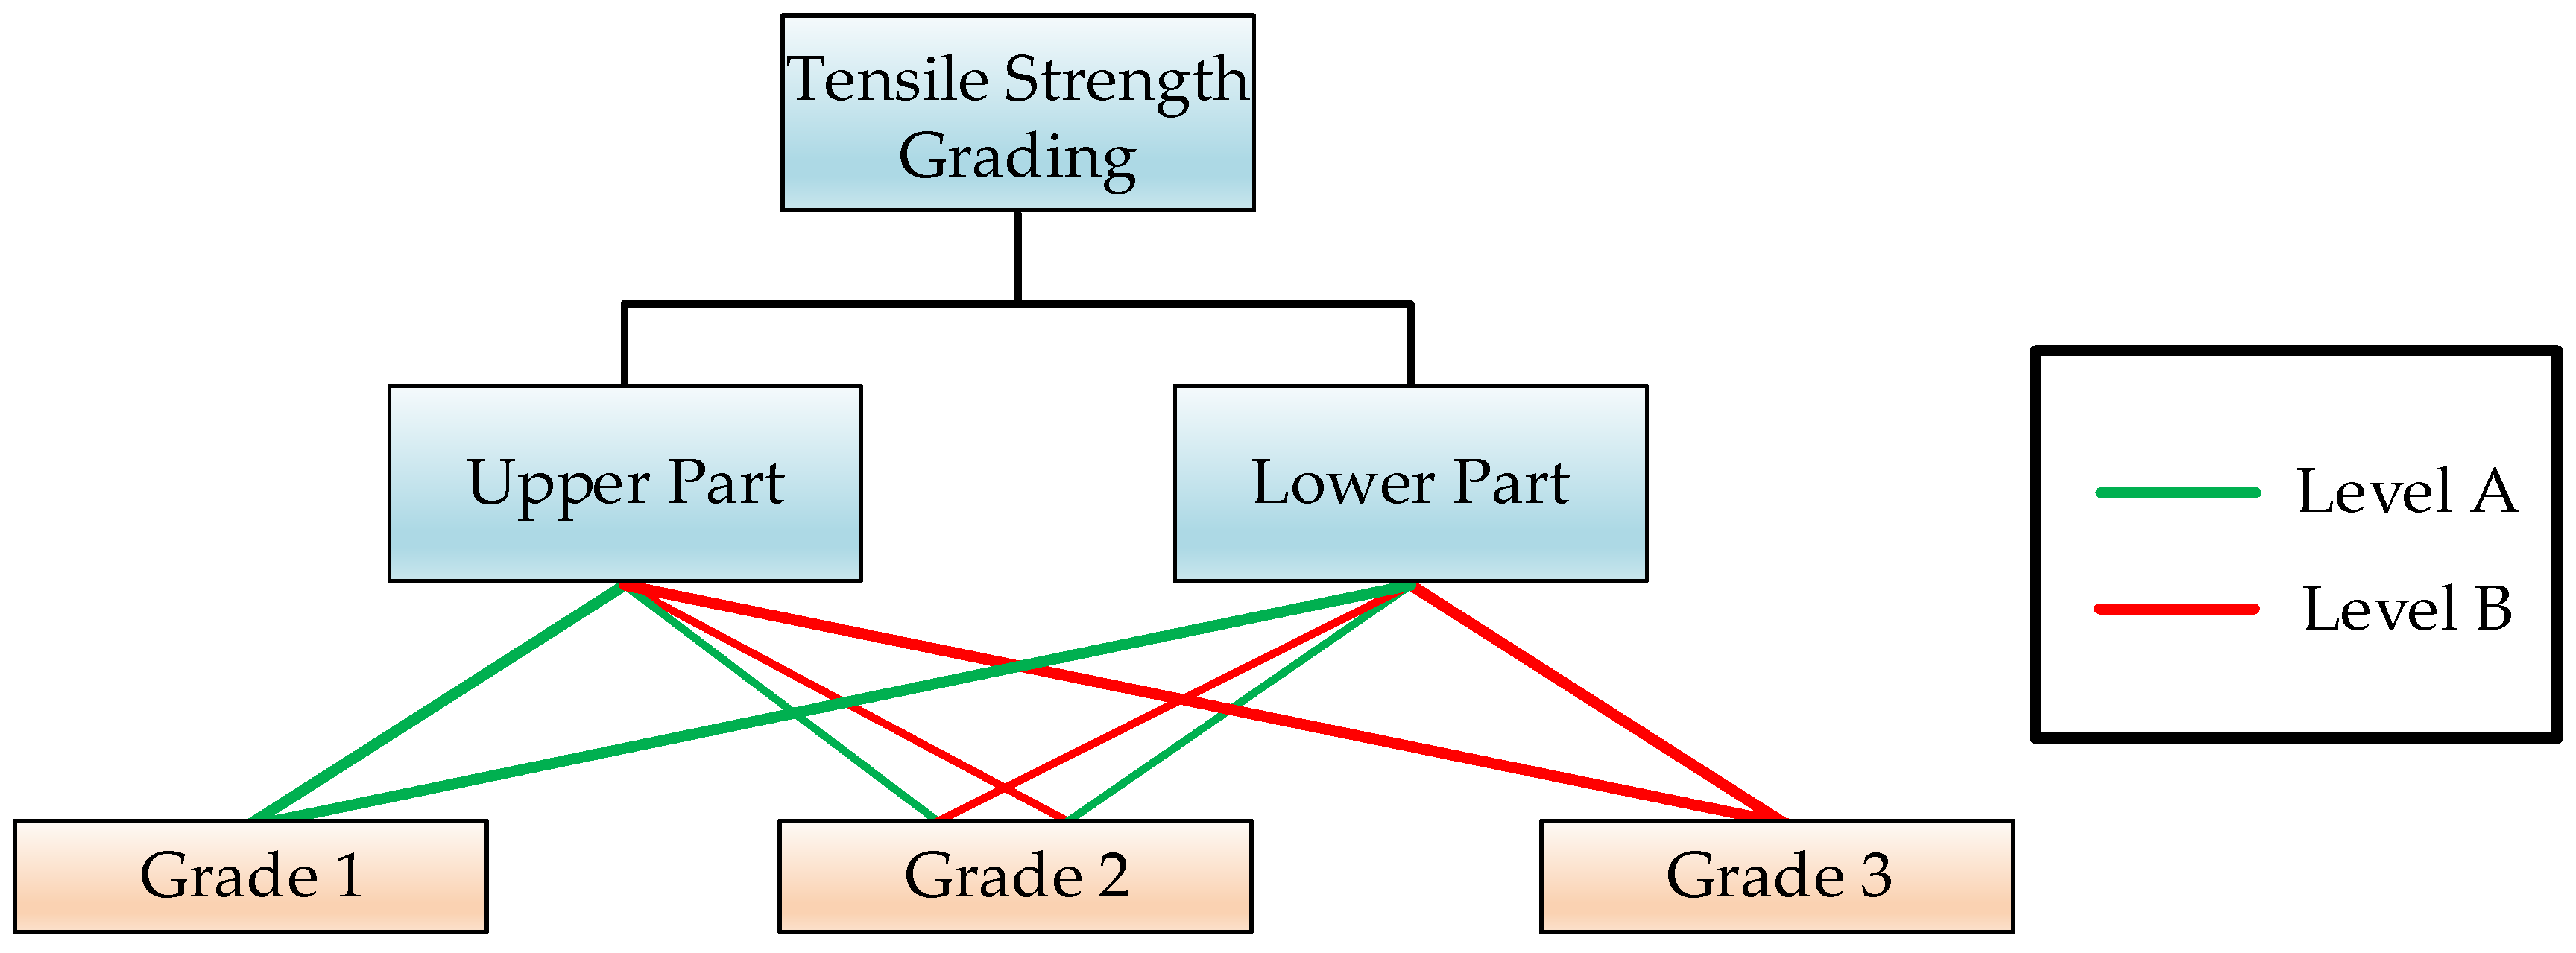
6.3. Grading Evaluation Model
6.4. Post Development
7. Conclusions
- In this study, the databases including ultrasonic characteristic parameters and tensile strength of 240 measurement points were established. Based on these databases, parameter selection based on correlation analysis and normalization was conducted to enhance the computational efficiency and eliminate the scale influence. Subsequently, a weld tensile strength prediction model was developed based on multivariate regression analysis.
- In order to rapidly characterize the welds, a grading evaluation model was introduced. The test result of 240 measurement points indicates that the accuracy of the proposed method is 76.3%.
- This study provides a comprehensive research framework for ultrasonic non-destructive characterization of weld mechanical properties. Apart from manual selection of ultrasonic parameters, deep learning-based methods will be researched in the near future.
Author Contributions
Funding
Institutional Review Board Statement
Informed Consent Statement
Data Availability Statement
Acknowledgments
Conflicts of Interest
References
- Zhen, R.; Li, L.; Gong, Y.; Gong, J.; Huang, Y.; Chang, S. Study on Properties of Additive Manufacturing Ta10W Alloy Laser-Welded Joints. Materials 2024, 17, 6268. [Google Scholar] [CrossRef] [PubMed]
- Szwajka, K.; Zielińska-Szwajka, J.; Trzepieciński, T. The Influence of the Shielding-Gas Flow Rate on the Mechanical Properties of TIG-Welded Butt Joints of Commercially Pure Grade 1 Titanium. Materials 2024, 17, 1217. [Google Scholar] [CrossRef] [PubMed]
- Li, D.; Zhang, Z.; Li, S.; Yang, J.; Zhang, S.; Bian, X.; Zhang, Y.; Qi, L.; Ojo, O.A. Microstructure, mechanical properties and fatigue crack growth behavior of an Al-Zn-Mg-Cu-Si-Zr-Er alloy fabricated by laser powder bed fusion. Materials 2023, 172, 107636. [Google Scholar] [CrossRef]
- Dong, H.; Liu, X.; Song, Y.; Wang, B.; Chen, S.; He, C. Quantitative evaluation of residual stress and surface hardness in deep drawn parts based on magneti. Measurement 2021, 168, 108473. [Google Scholar] [CrossRef]
- Roskosz, M.; Fryczowski, K.; Schabowicz, K. Evaluation of Ferromagnetic Steel Hardness Based on an Analysis of the Barkhausen Noise Number of Events. Materials 2020, 13, 2059. [Google Scholar] [CrossRef]
- Čilliková, M.; Uríček, J.; Neslušan, M.; Ballo, V.; Mičietová, A. Monitoring of thermal damage after deposition of coatings via Barkhausen noise technique. Acta Phys. Pol. A 2020, 137, 637–639. [Google Scholar] [CrossRef]
- Kahrobaee, S.; Sahraei, H.N.; Akhlaghi, I.A. Nondestructive Characterization of Microstructure and Mechanical Properties of Heat Treated H13 Tool Steel Using Magnetic Hysteresis Loop Methodology. Res. Nondestruct. Eval. 2019, 30, 303–315. [Google Scholar] [CrossRef]
- Ding, S.; Tian, G.; Sutthaweekul, R. Non-destructive hardness prediction for 18CrNiMo7-6 steel based on feature selection and fusion of Magnetic Barkhausen Noise. NDT E Int. 2019, 107, 102138. [Google Scholar] [CrossRef]
- Liu, X.; Zhang, R.; Wu, B.; He, C. Quantitative Prediction of Surface Hardness in 12CrMoV Steel Plate Based on Magnetic Barkhausen Noise and Tangential Magnetic Field Measurements. J. Nondestruct. Eval. 2018, 37, 38. [Google Scholar]
- Zhang, X.; Qiao, S.; Peng, J. Determination of hardness in welded rail surface via Barkhausen noise. In Proceedings of the 2019 Far East NDT New Technology & Application Forum (FENDT), Qingdao, China, 24–27 June 2019. [Google Scholar]
- Ávila, J.A.; Conde, F.; Pinto, H. Microstructural and Residuals Stress Analysis of Friction Stir Welding of X80 Pipeline Steel Plates Using Magnetic Barkhausen Noise. J. Nondestruct. Eval. 2019, 38, 86. [Google Scholar] [CrossRef]
- Kiattisaksri, P.; Phung-On, I.; Poopat, B. A development of swept-frequency eddy current for aging characterization of heat resistant steel. Int. J. Appl. Electromagn. Mech. 2017, 55, 279–287. [Google Scholar] [CrossRef]
- Zhang, H.; Wei, Z.; Xie, F.; Sun, B. Assessment of the Properties of AISI 410 Martensitic Stainless Steel by an Eddy Current Method. Materials 2019, 12, 1290. [Google Scholar] [CrossRef] [PubMed]
- Kahrobaee, S.; Fard, E.J. Characterization of Hadfield Steels Subjected to Various Heat-Treating Processes by Nondestructive Eddy Current Method. Russ. J. Nondestruct. Test. 2020, 56, 151–160. [Google Scholar] [CrossRef]
- Liu, K.; Zhao, Z.; Zhang, Z. Eddy Current Assessment of the Cold Rolled Deformation Behavior of AISI 321 Stainless Steel. J. Mater. Eng. Perform. 2012, 21, 1772–1776. [Google Scholar] [CrossRef]
- Konoplyuk, S. Estimation of pearlite fraction in ductile cast irons by eddy current method. NDTE Int. 2010, 43, 360–364. [Google Scholar] [CrossRef]
- Lian, Y.; Du, F.; Xie, L.; Hu, Q.; Jin, P.; Wang, Y.; Lu, Z. Application of laser ultrasonic testing technology in the characterization of material Properties: A review. Measurement 2024, 234, 114855. [Google Scholar] [CrossRef]
- Dong, F.; Wang, X.; Yang, Q.; Yin, A.; Xu, X. Directional dependence of aluminum grain size measurement by laser-ultrasonic technique. Mater. Charact. 2017, 129, 114–120. [Google Scholar] [CrossRef]
- Bai, X.; Zhao, Y.; Ma, J.; Guo, R.; Zhang, H. Grain size characterization by laser-based ultrasonics based on the centroid frequency shift method. Mater. Charact. 2019, 155, 109800. [Google Scholar] [CrossRef]
- Xue, R.; Wang, X.; Yang, Q.; Dong, F.; Zhang, Y.; Cao, J.; Song, G. Grain size characterization of aluminum based on ensemble empirical mode decomposition using a laser ultrasonic technique. Appl. Acoust. 2019, 156, 378–386. [Google Scholar] [CrossRef]
- Garcin, T.; Schmitt, J.H.; Militzer, M. In-situ laser ultrasonic grain size measurement in superalloy INCONEL 718. J. Alloys Compd. 2016, 670, 329–336. [Google Scholar] [CrossRef]
- Sarpün, İ.H.; Kılıçkaya, M.S.; Tuncel, S. Mean grain size determination in marbles by ultrasonic velocity techniques. NDT E Int. 2005, 1, 21–25. [Google Scholar] [CrossRef]
- Ünal, R.; Sarpün, I.H.; Yalım, H.A.; Erol, A.; Özdemir, T.; Tuncel, S. The mean grain size determination of boron carbide (B 4 C)–aluminium (Al) and boron carbide (B 4 C)–nickel (Ni) composites by ultrasonic velocity technique. Mater. Charaterization 2006, 3, 241–244. [Google Scholar] [CrossRef]
- Du, H.; Turner, J.A. Ultrasonic attenuation in pearlitic steel. Ultrasonics 2014, 54, 882–887. [Google Scholar] [CrossRef]
- El Rayes, M.M.; El-Danaf, E.A.; Almajid, A.A. Ultrasonic characterization of heat-treatment effects on SAE-1040 and -4340 steels. J. Mater. Process. Technol. 2015, 216, 188–198. [Google Scholar] [CrossRef]
- Li, W.; Jiang, C.; Xiao, J.; Xu, C.; Deng, M. Assessment of Thermal Damage in Polymethyl Methacrylate Using Quasi-static Components of Ultrasonic Waves. J. Nondestruct. Eval. 2023, 42, 13. [Google Scholar] [CrossRef]
- Men, P.; Dong, S.; Kang, X.; Yan, S.; Cheng, Z.; Lv, R. Research on the method of quantitative evaluating material hardness and tensile strength by critically refracted longitudinal wave. Appl. Acoust. 2020, 159, 107105. [Google Scholar] [CrossRef]
- Choi, S.; Ryu, J.; Kim, J.S.; Jhang, K.Y. Comparison of Linear and Nonlinear Ultrasonic Parameters in Characterizing Grain Size and Mechanical Properties of 304L Stainless Steel. Metals 2019, 9, 1279. [Google Scholar] [CrossRef]
- Zhu, L.; Liu, X.; Fan, P.; Liu, J. A Study of Microstructure Evolution During Creep of 9Cr-1Mo Steel Using Ultrasonic and Hardness Measurements. J. Mater. Eng. Perform. 2019, 28, 2348–2355. [Google Scholar] [CrossRef]
- Ma, Z.; Zhang, W.; Luo, Z.; Sun, X.; Li, Z.; Lin, L. Ultrasonic Characterization of Thermal Barrier Coatings Porosity through BP Neural Network Optimizing Gaussian Process Regression Algorithm. Ultrasonics 2020, 100, 105981. [Google Scholar] [CrossRef]


| s1 Amp | s2 Amp | s1 Time | s2 Time | ||
|---|---|---|---|---|---|
| Tensile Strength | Coef. | 0.29745 | 0.26545 | −0.05644 | −0.05244 |
| p-value | 2.91182 × 10⁻¹¹ | 3.48687 × 10⁻⁹ | 0.21711 | 0.25149 |
| Grade 1 | Grade 2 | Grade 3 | Total | |
|---|---|---|---|---|
| Tensile Test Results | 206 | 24 | 10 | 240 |
| Model Evaluated Results | 205 | 22 | 13 | 240 |
| Consistent Results | 160 | 16 | 7 | 183 |
| Accuracy | 77.7% | 66.6% | 70.0% | 76.3% |
Disclaimer/Publisher’s Note: The statements, opinions and data contained in all publications are solely those of the individual author(s) and contributor(s) and not of MDPI and/or the editor(s). MDPI and/or the editor(s) disclaim responsibility for any injury to people or property resulting from any ideas, methods, instructions or products referred to in the content. |
© 2025 by the authors. Licensee MDPI, Basel, Switzerland. This article is an open access article distributed under the terms and conditions of the Creative Commons Attribution (CC BY) license (https://creativecommons.org/licenses/by/4.0/).
Share and Cite
Chi, D.; Wang, Z.; Liu, H. A Multivariate Linear Regression-Based Ultrasonic Non-Destructive Evaluating Method for Characterizing Weld Tensile Strength Properties. Materials 2025, 18, 1925. https://doi.org/10.3390/ma18091925
Chi D, Wang Z, Liu H. A Multivariate Linear Regression-Based Ultrasonic Non-Destructive Evaluating Method for Characterizing Weld Tensile Strength Properties. Materials. 2025; 18(9):1925. https://doi.org/10.3390/ma18091925
Chicago/Turabian StyleChi, Dazhao, Ziming Wang, and Haichun Liu. 2025. "A Multivariate Linear Regression-Based Ultrasonic Non-Destructive Evaluating Method for Characterizing Weld Tensile Strength Properties" Materials 18, no. 9: 1925. https://doi.org/10.3390/ma18091925
APA StyleChi, D., Wang, Z., & Liu, H. (2025). A Multivariate Linear Regression-Based Ultrasonic Non-Destructive Evaluating Method for Characterizing Weld Tensile Strength Properties. Materials, 18(9), 1925. https://doi.org/10.3390/ma18091925