
Improving Laser Powder Bed Fusion IN718 Process Development Efficiency by Eliminating Pore Defects of Specified Size
 , ,
, ,
Abstract
1. Introduction
2. Materials and Methods
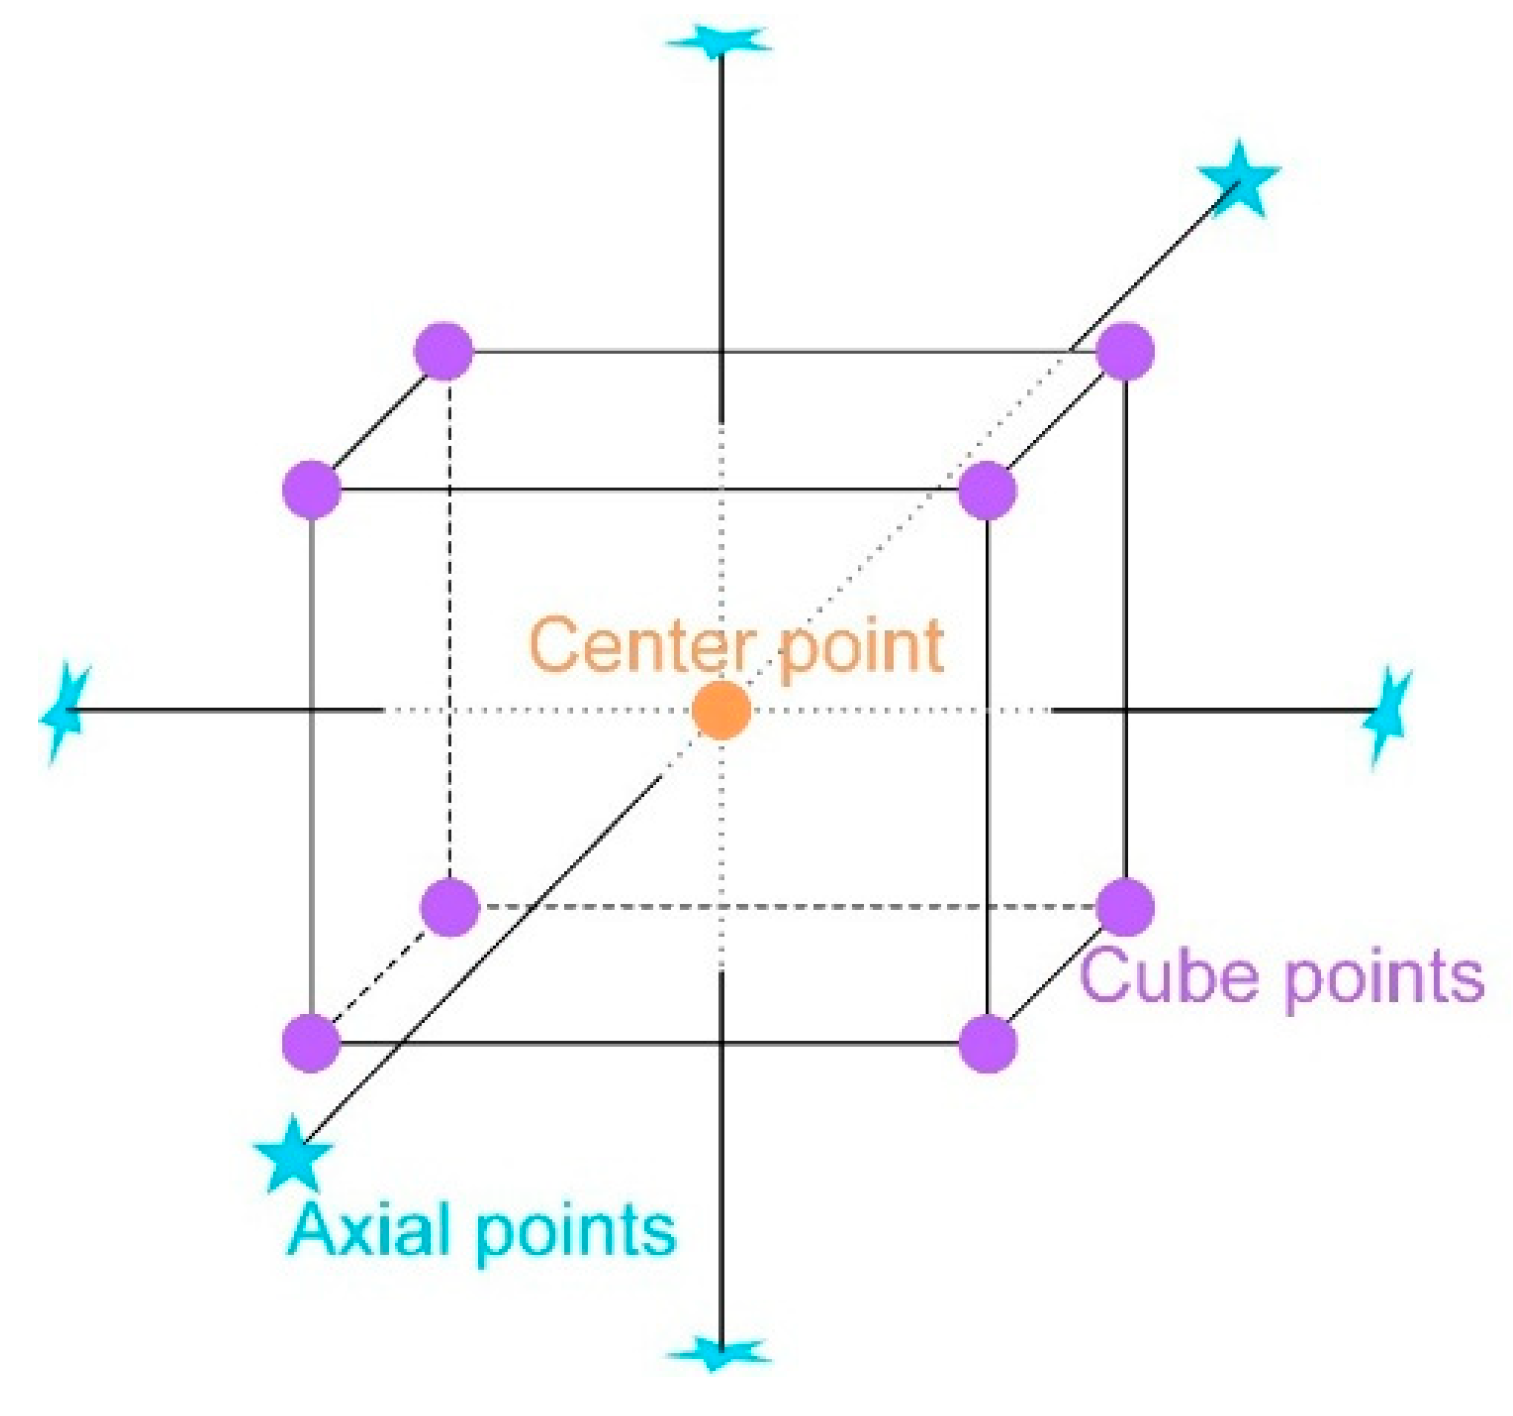
2.1. Experiment Design
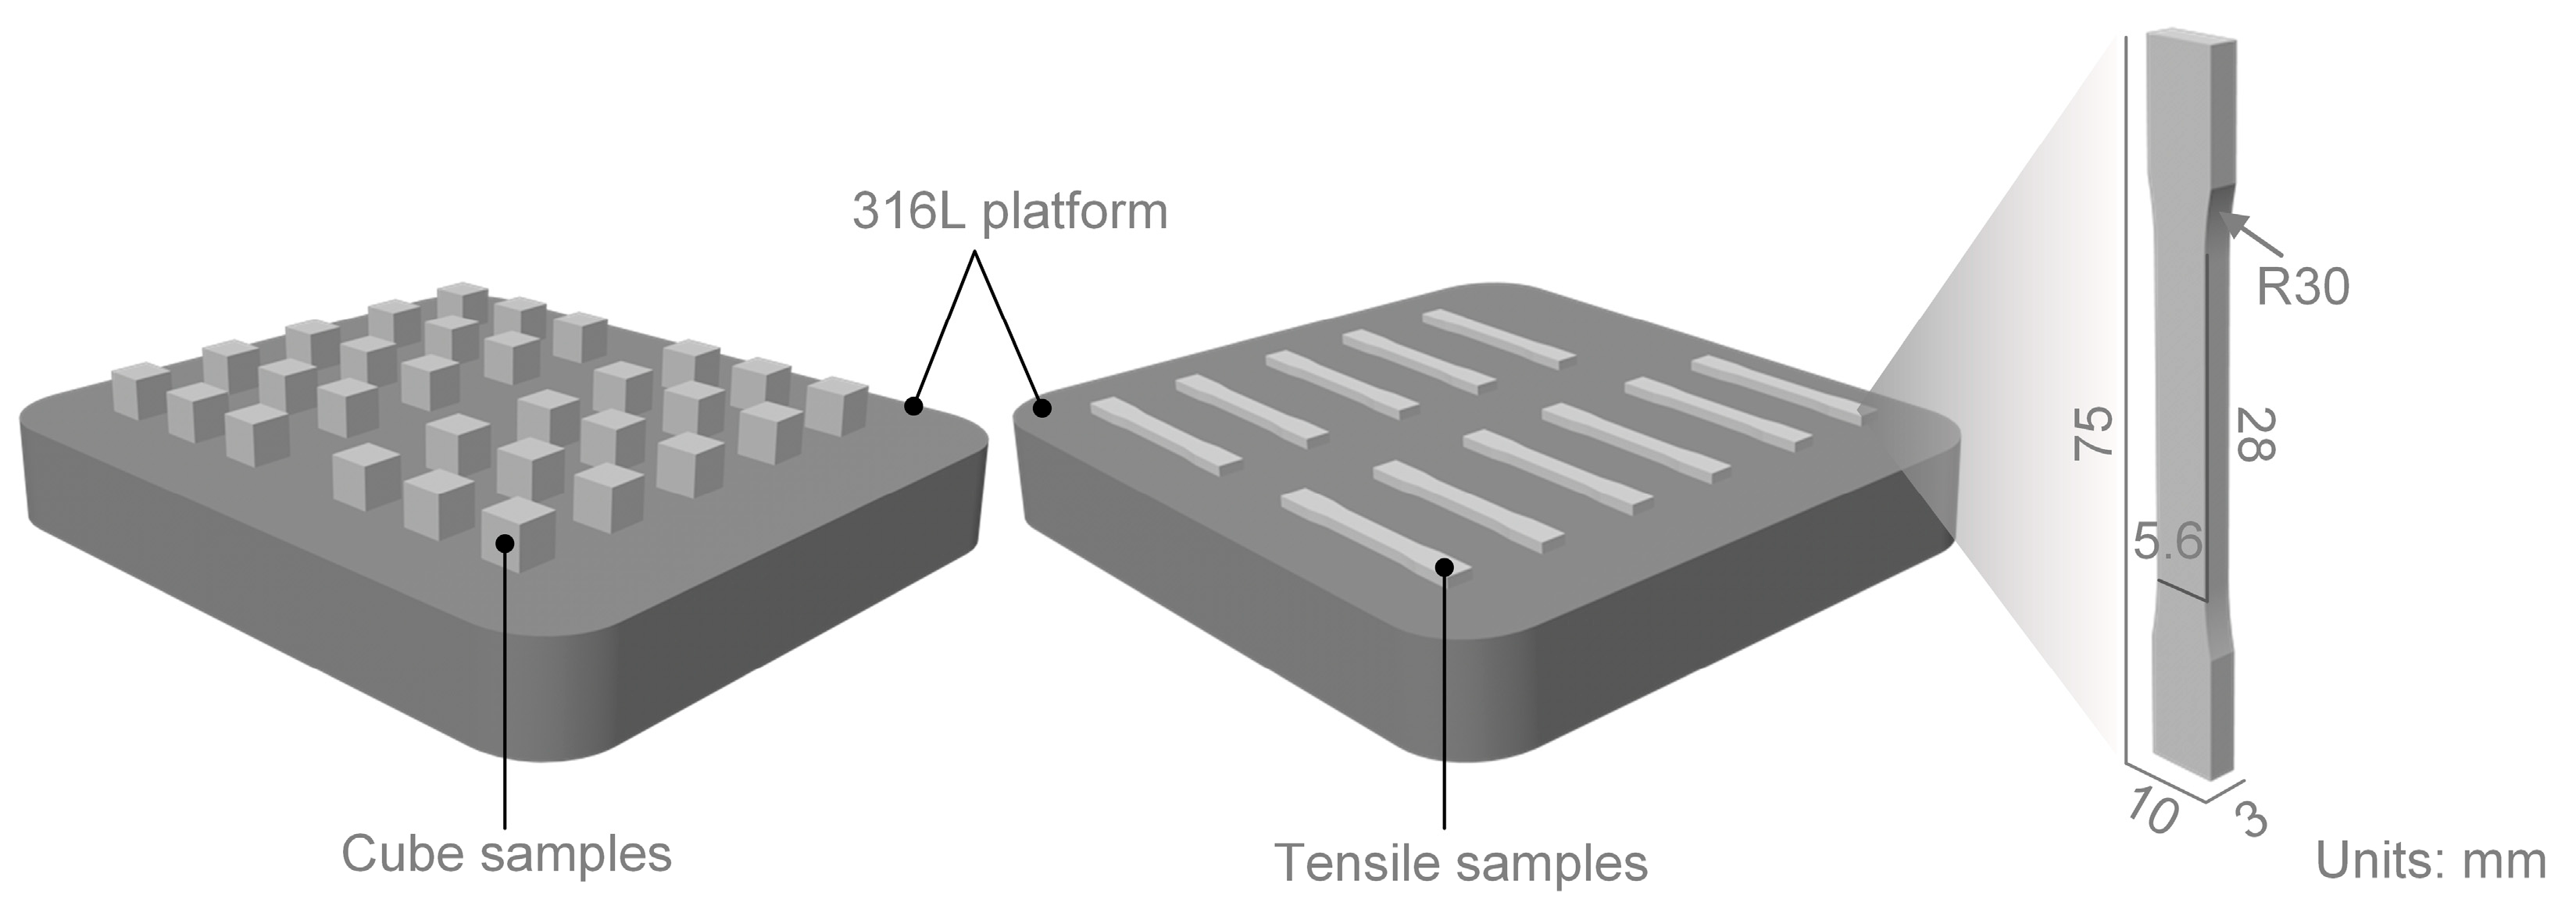
2.2. Fabrication and Characterization
2.2.1. IN718 Alloy Fabrication
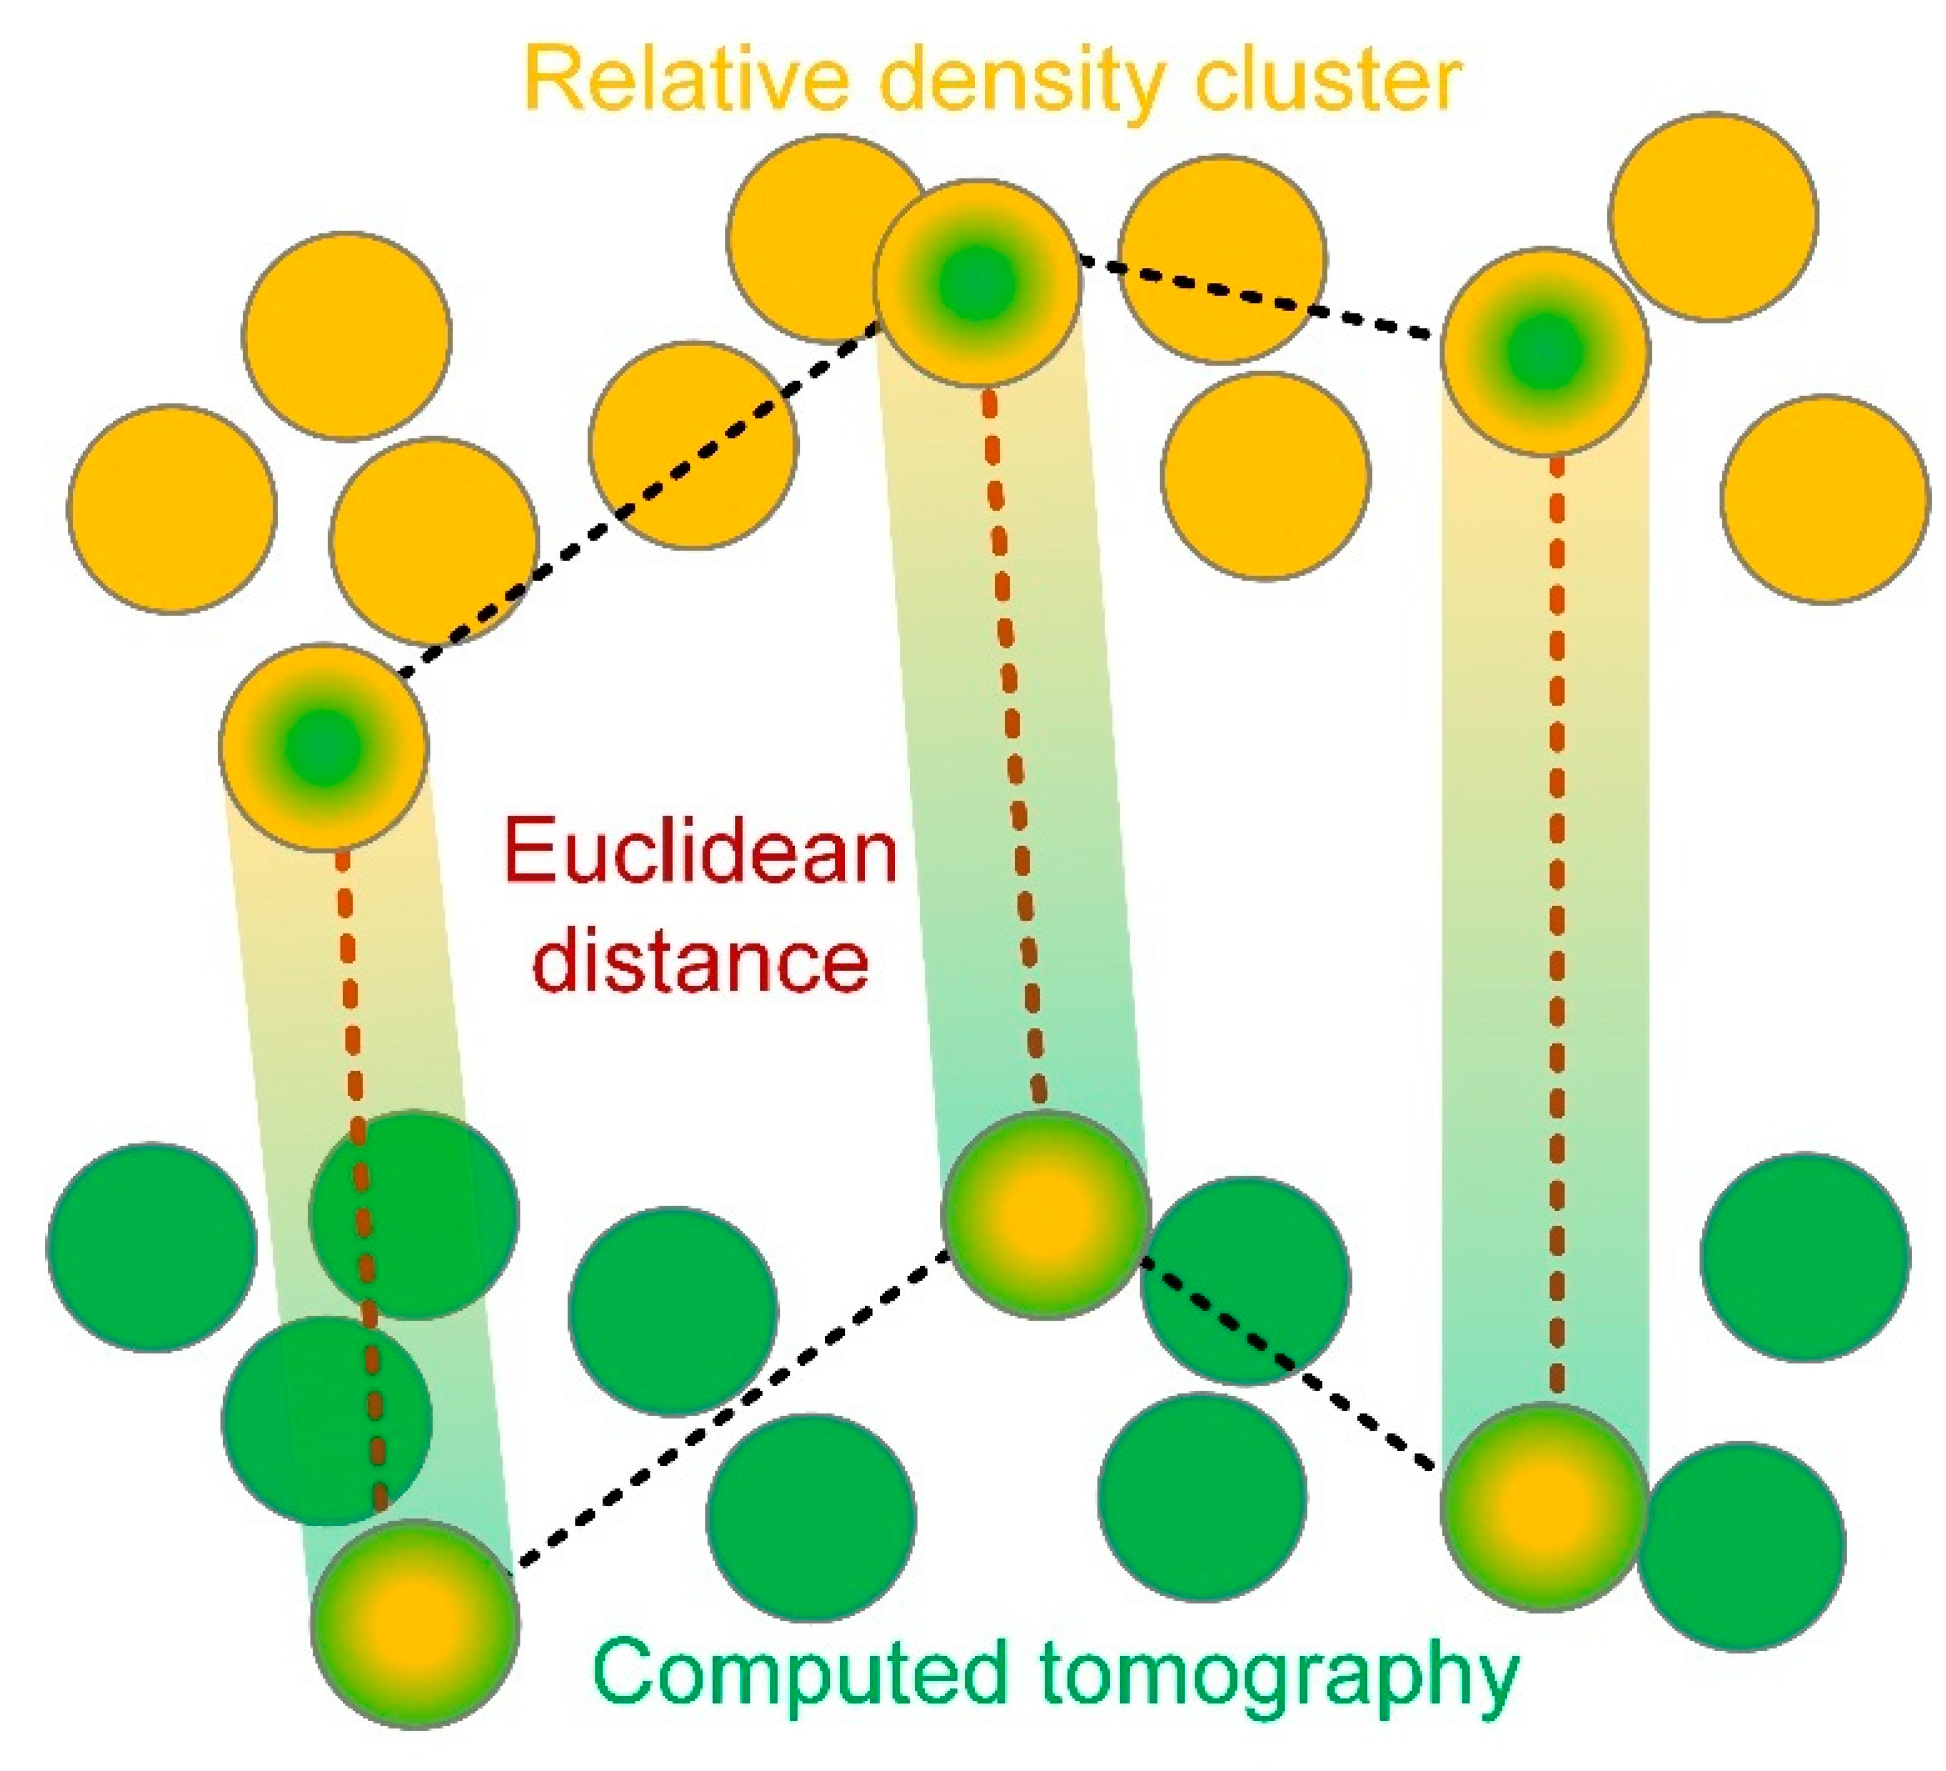
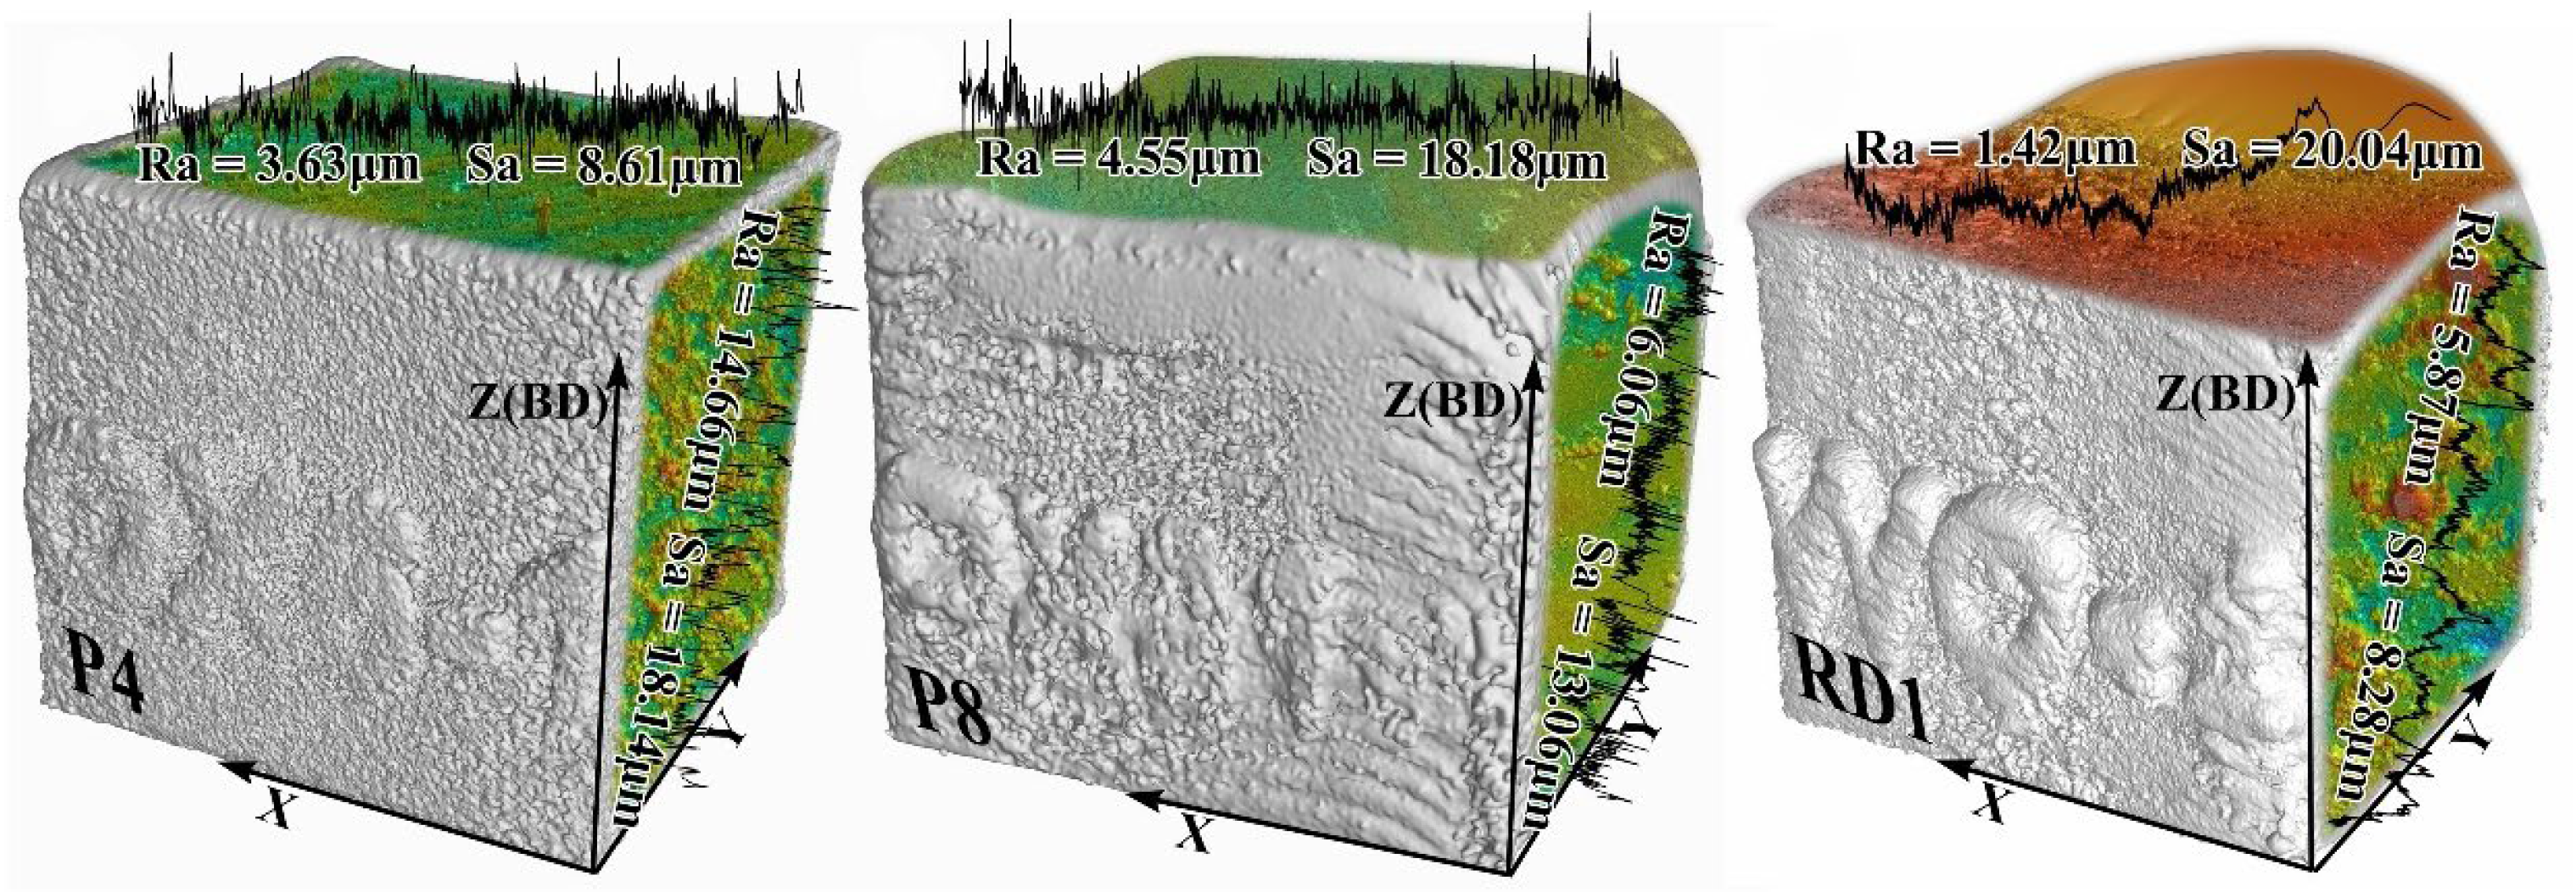
2.2.2. Surface Topography and Porosity Characterization
2.2.3. Microstructure Characterization
2.2.4. Mechanics Performance Testing
3. Results
3.1. Reliability Verification of Porosity
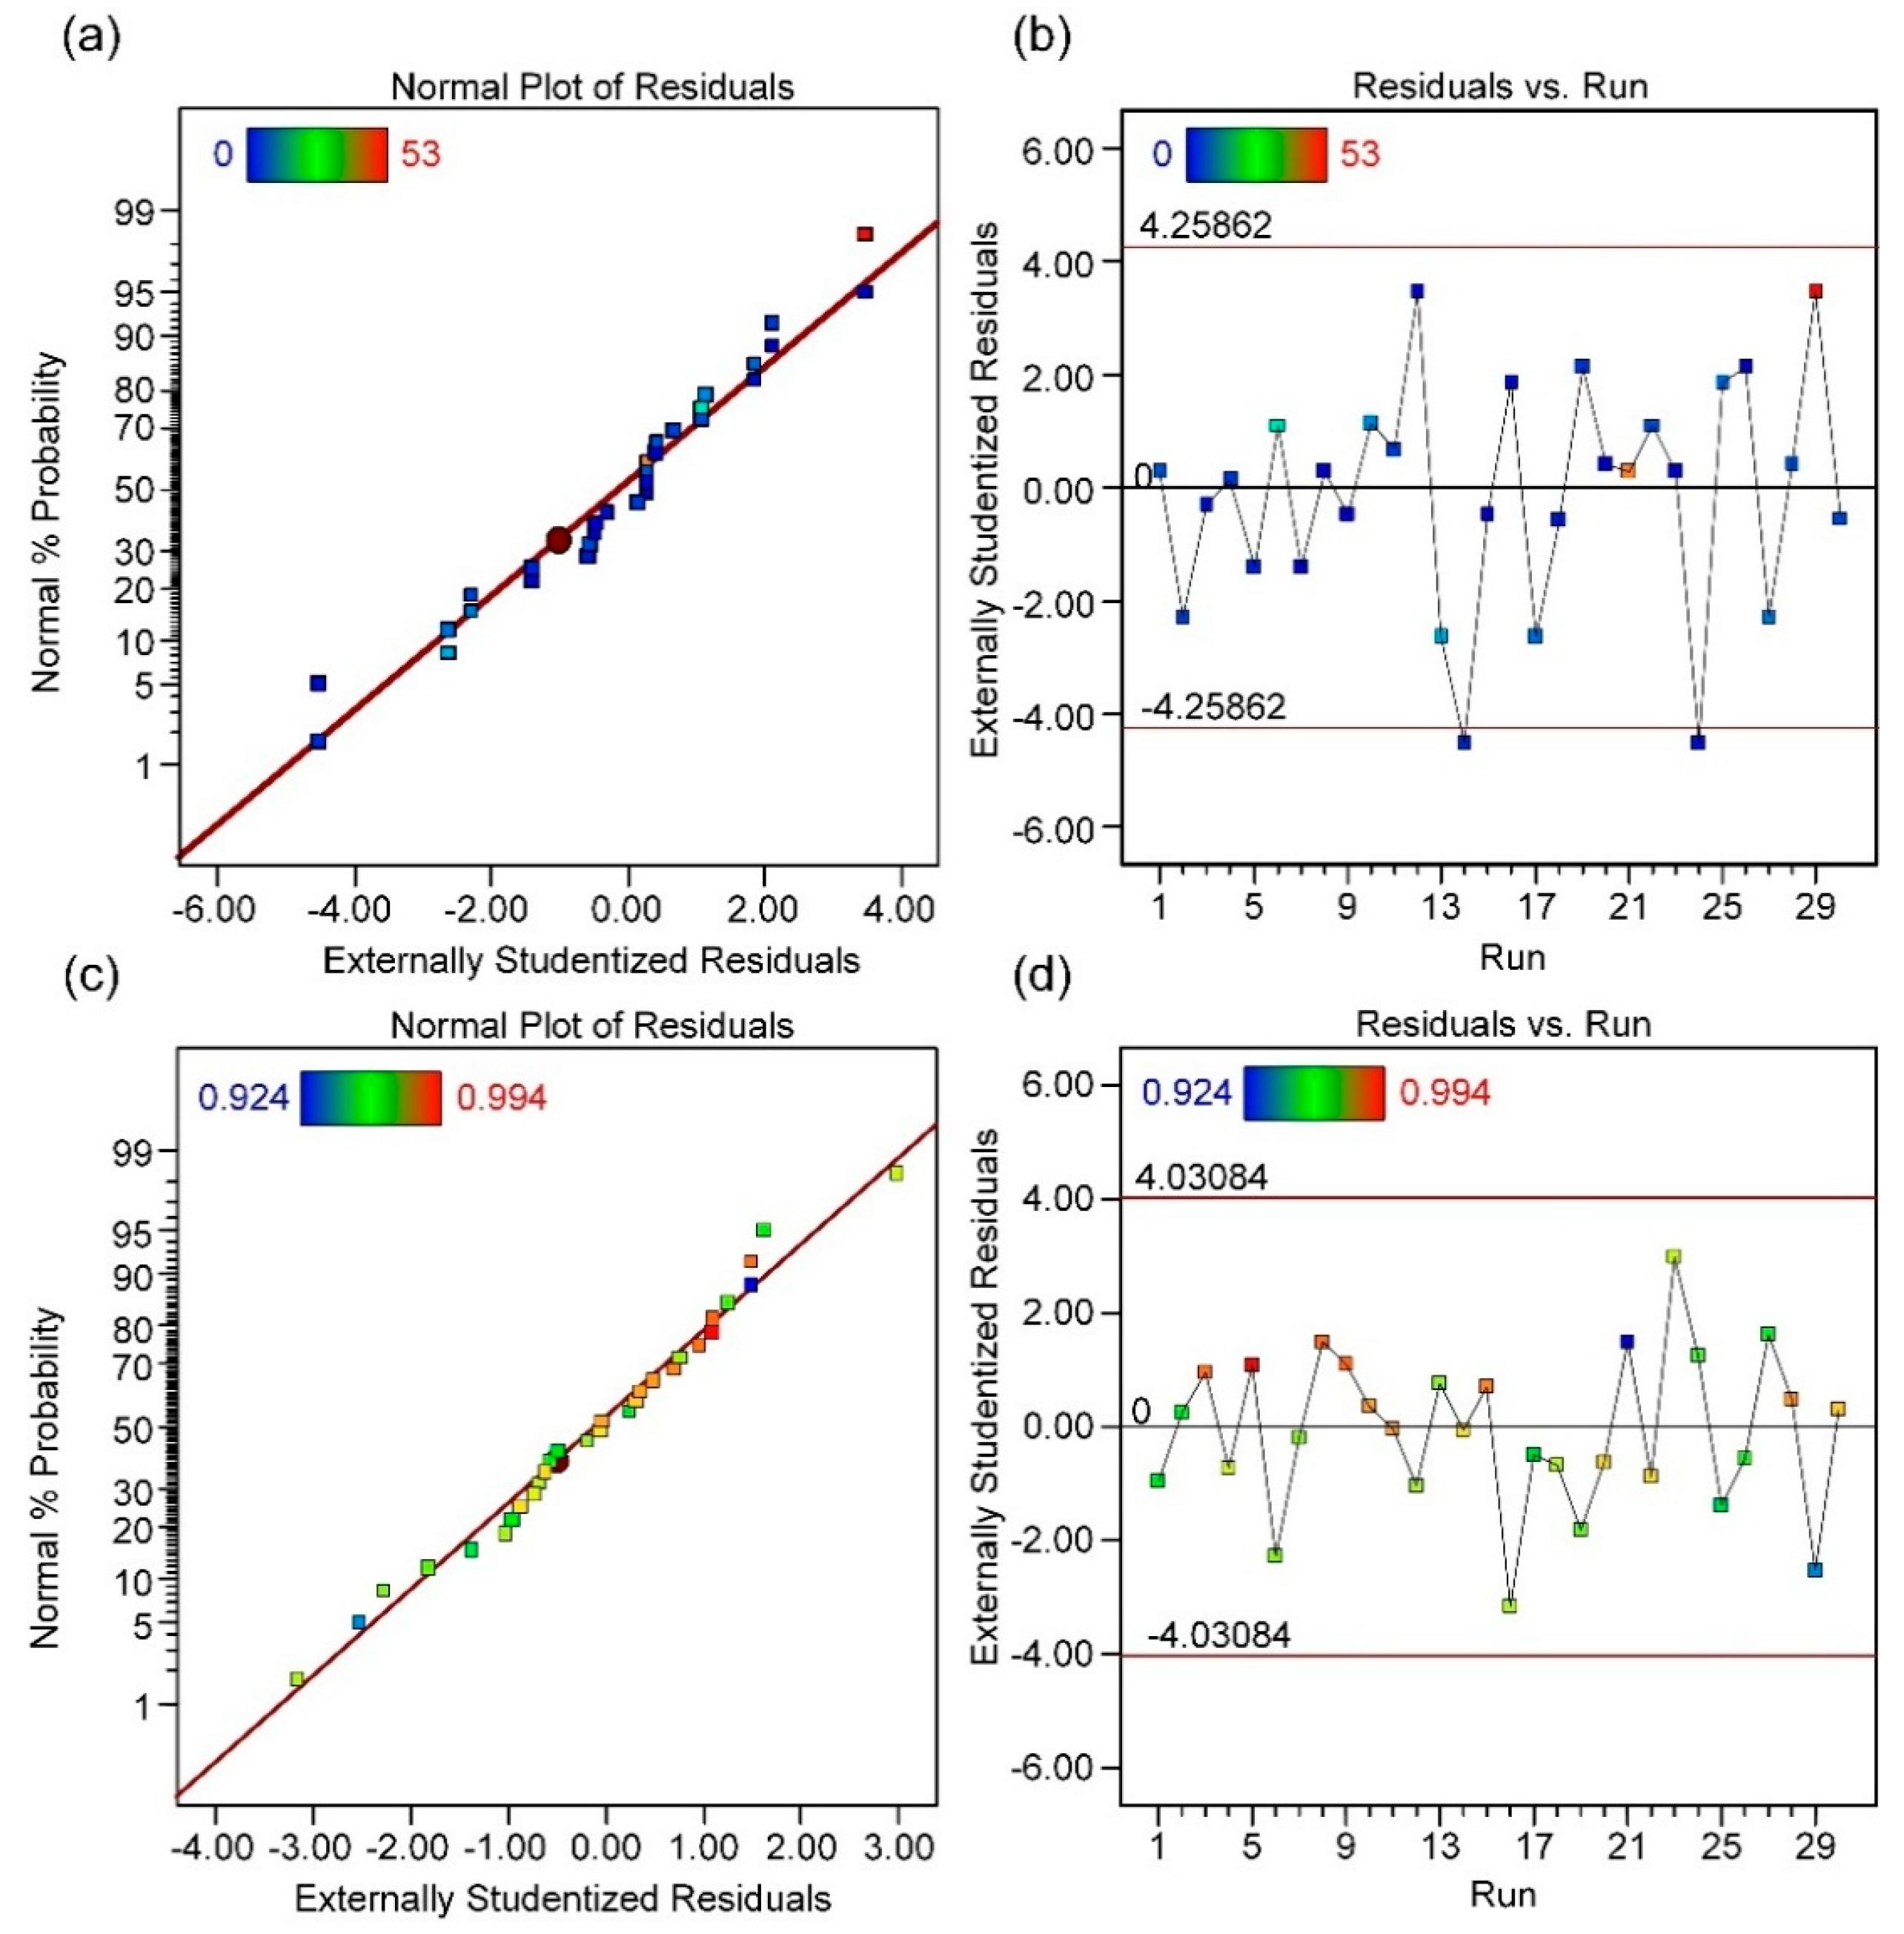
3.2. Response Surface Model
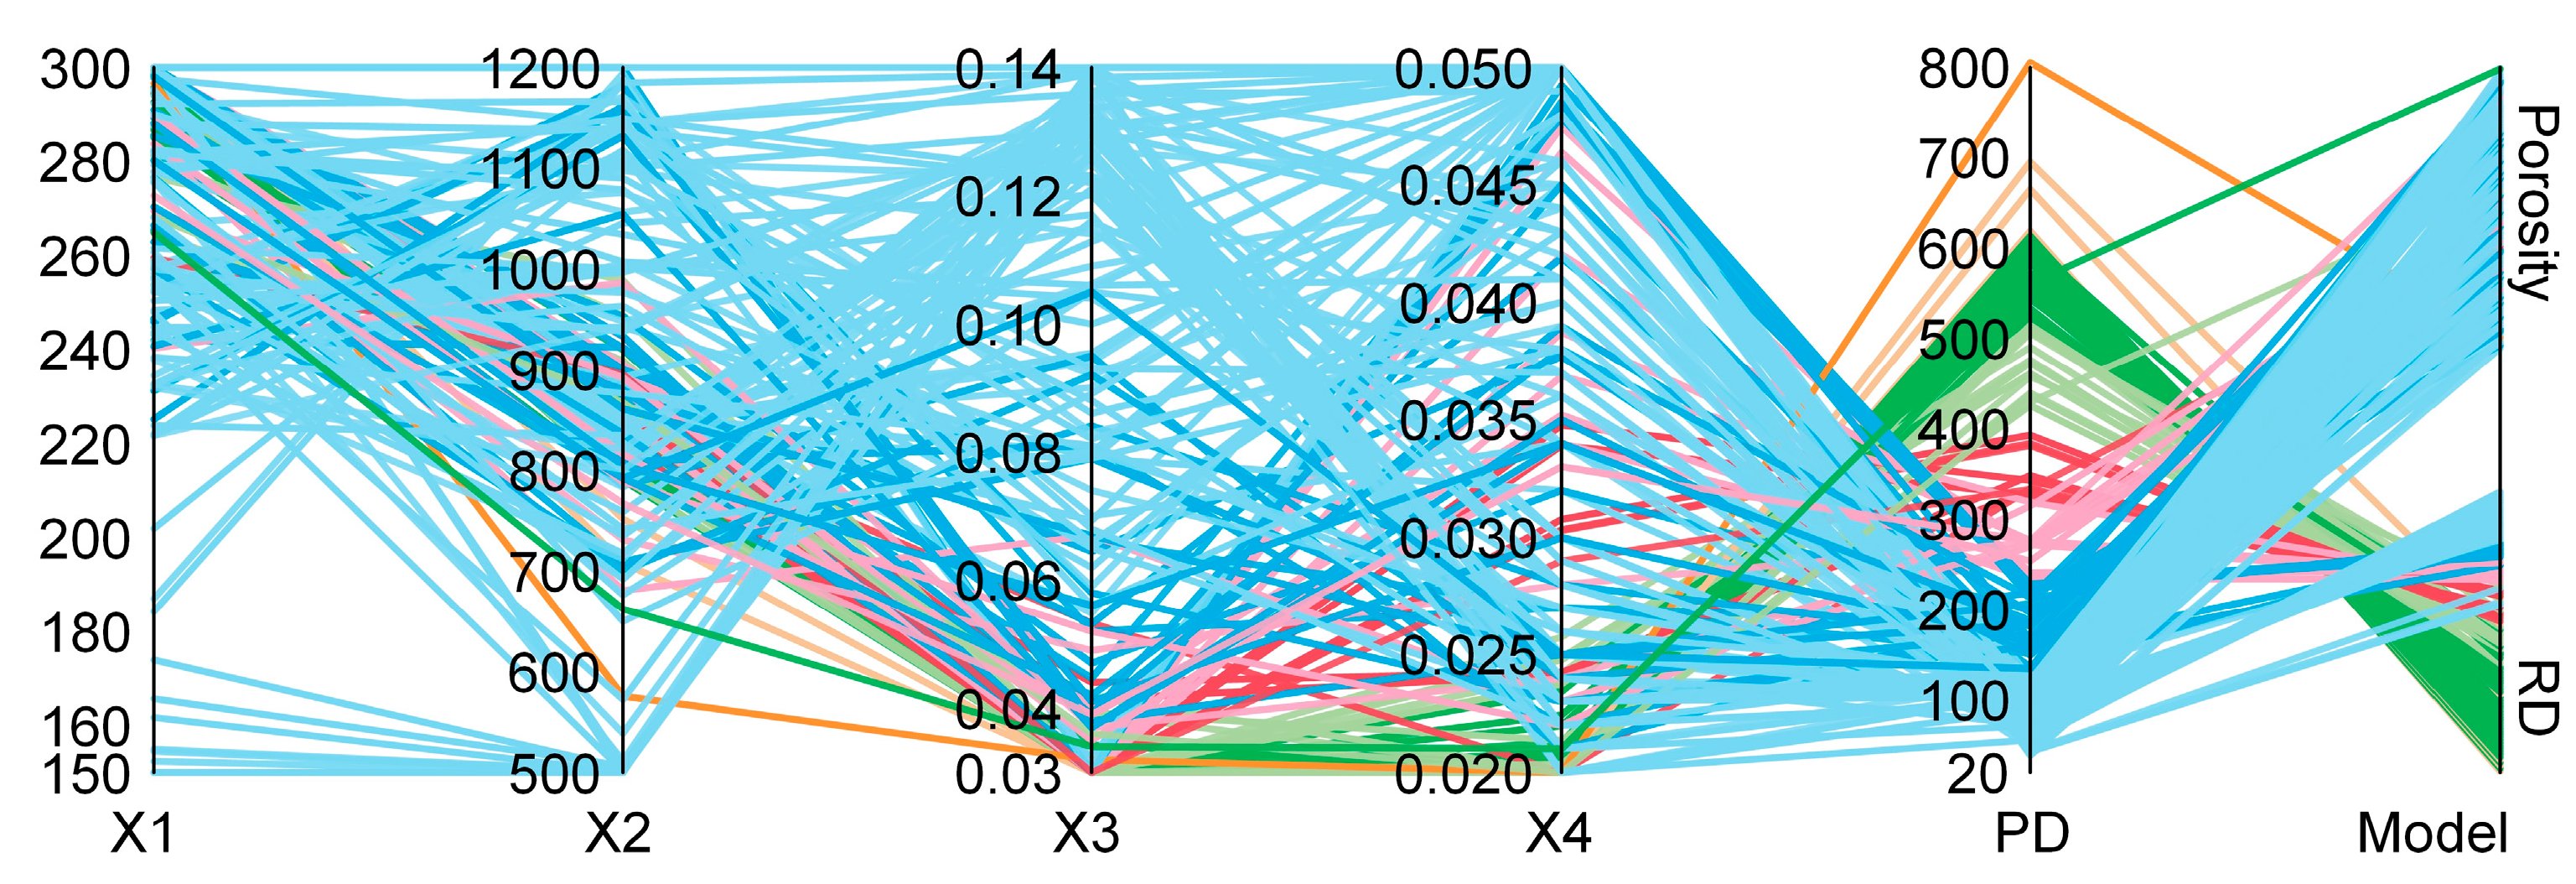
3.3. Optimal Solution Set
3.4. Formable Window Validation
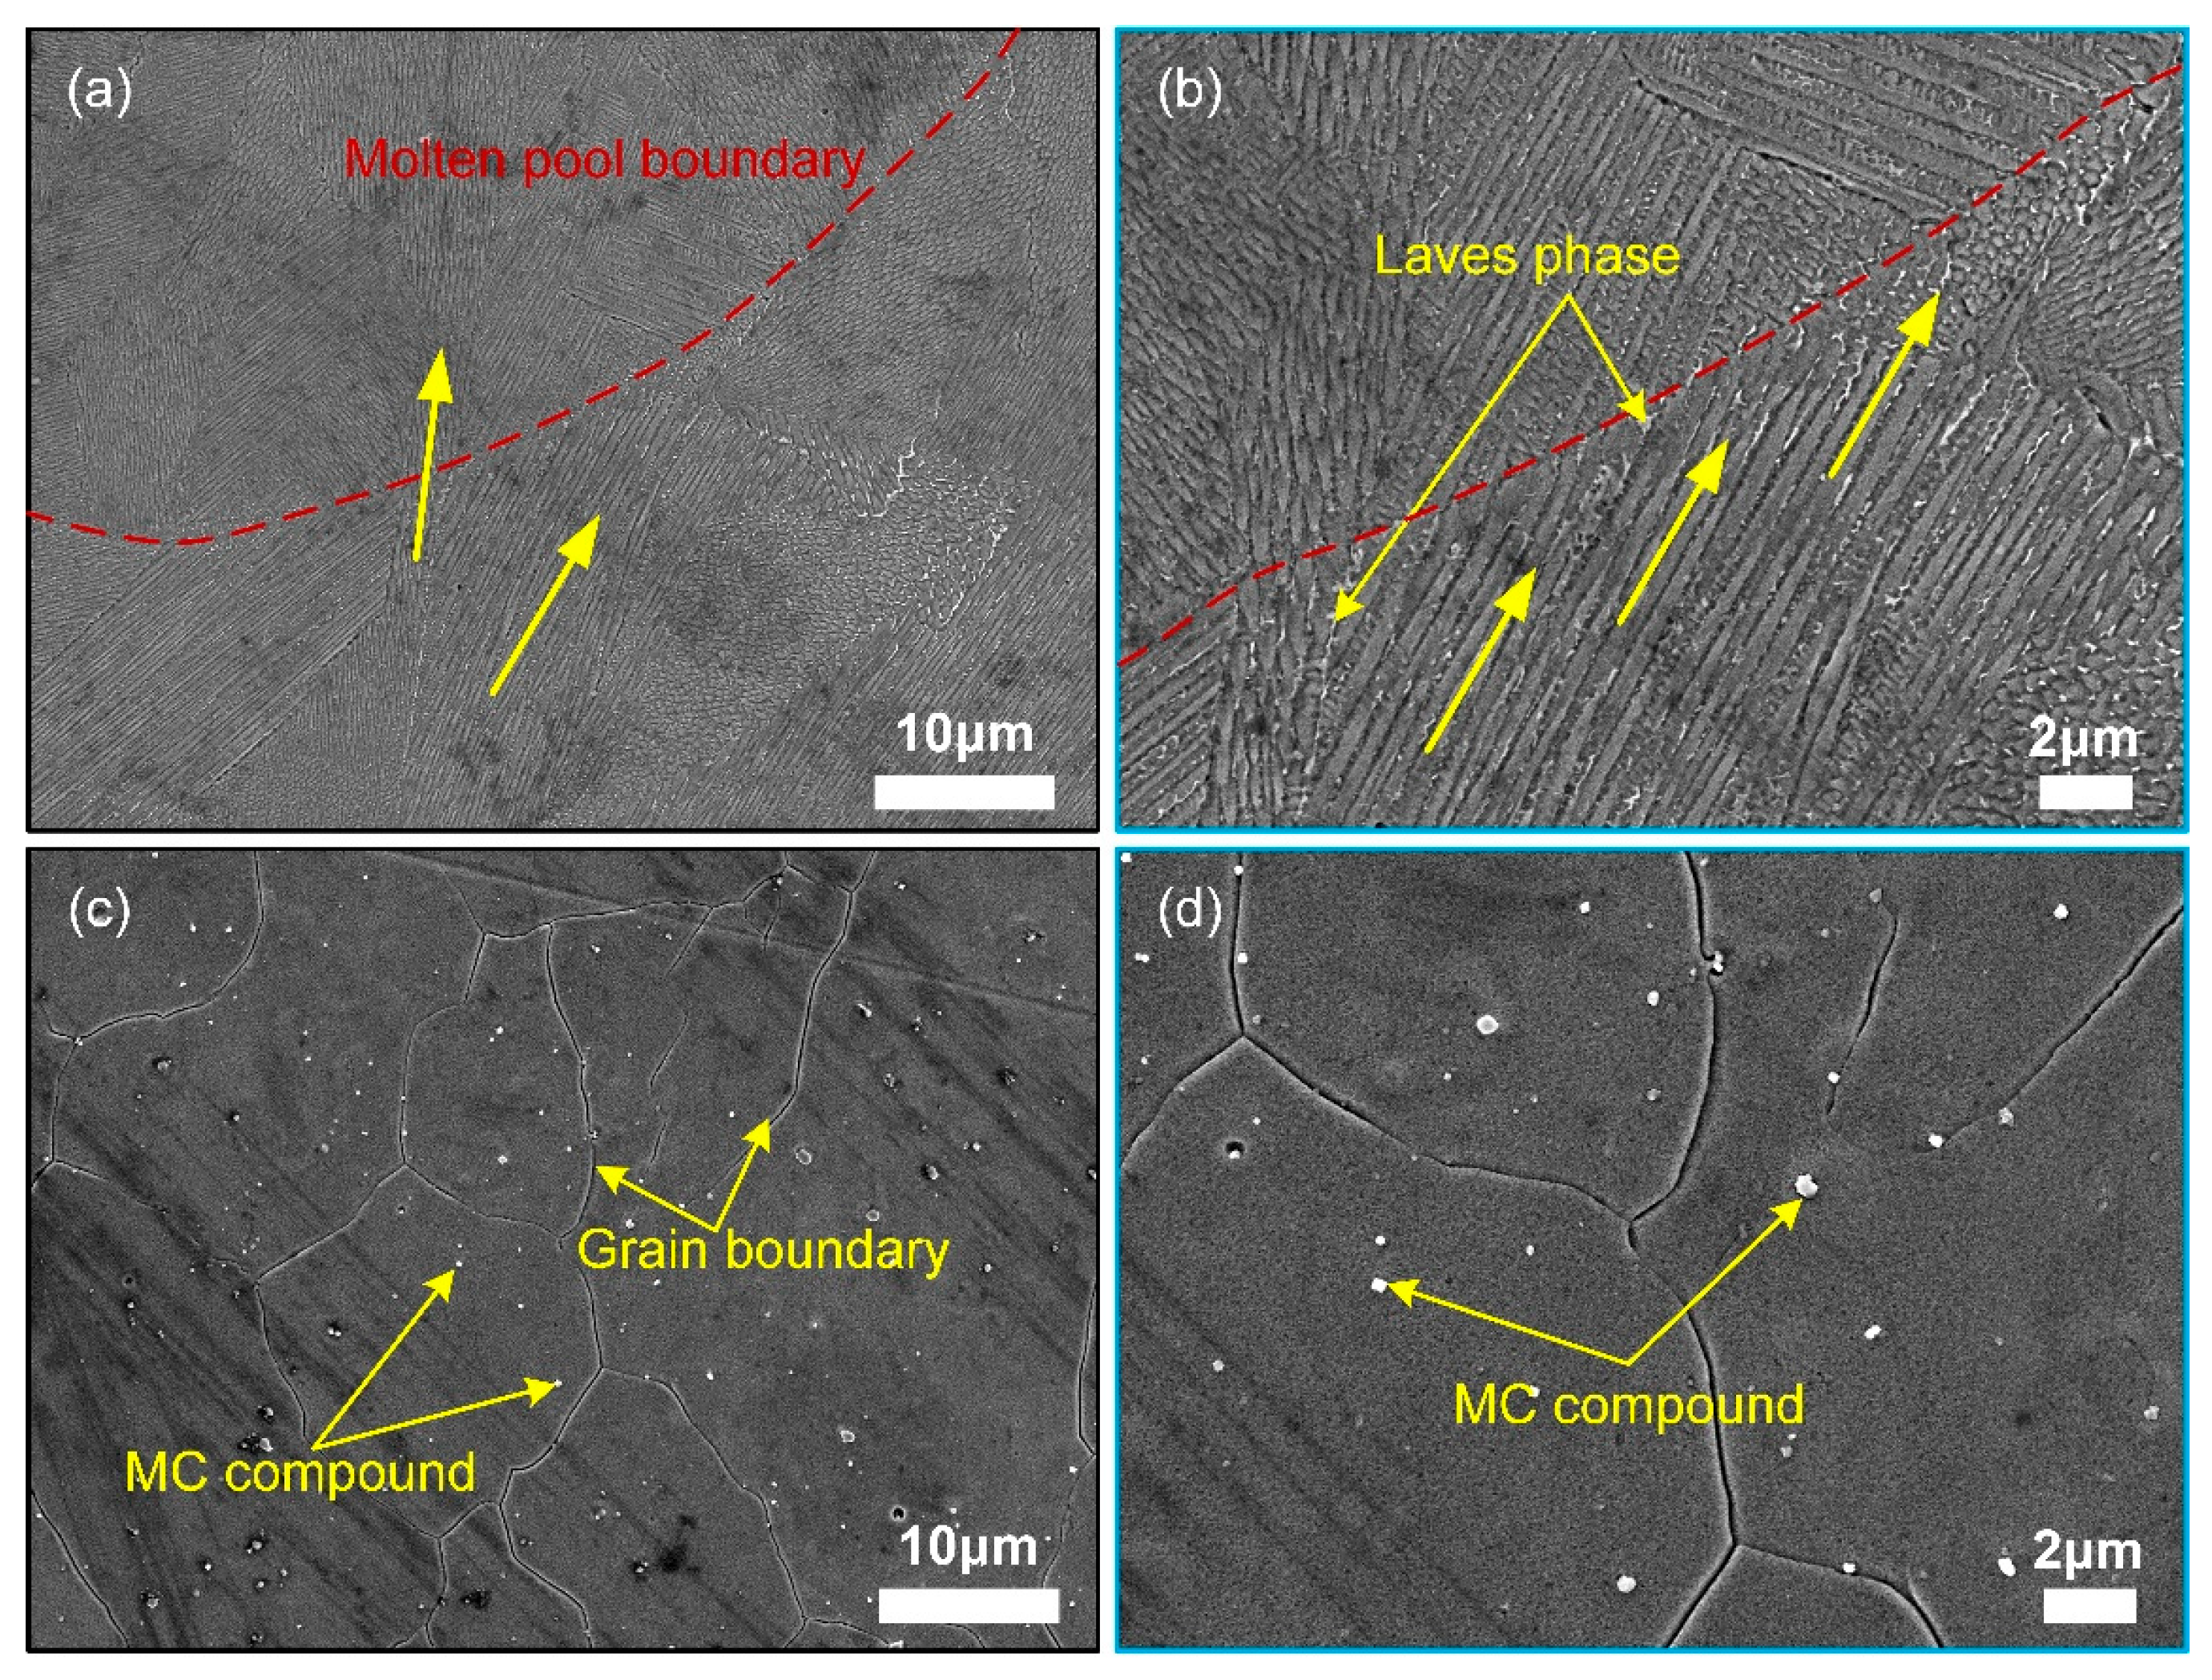
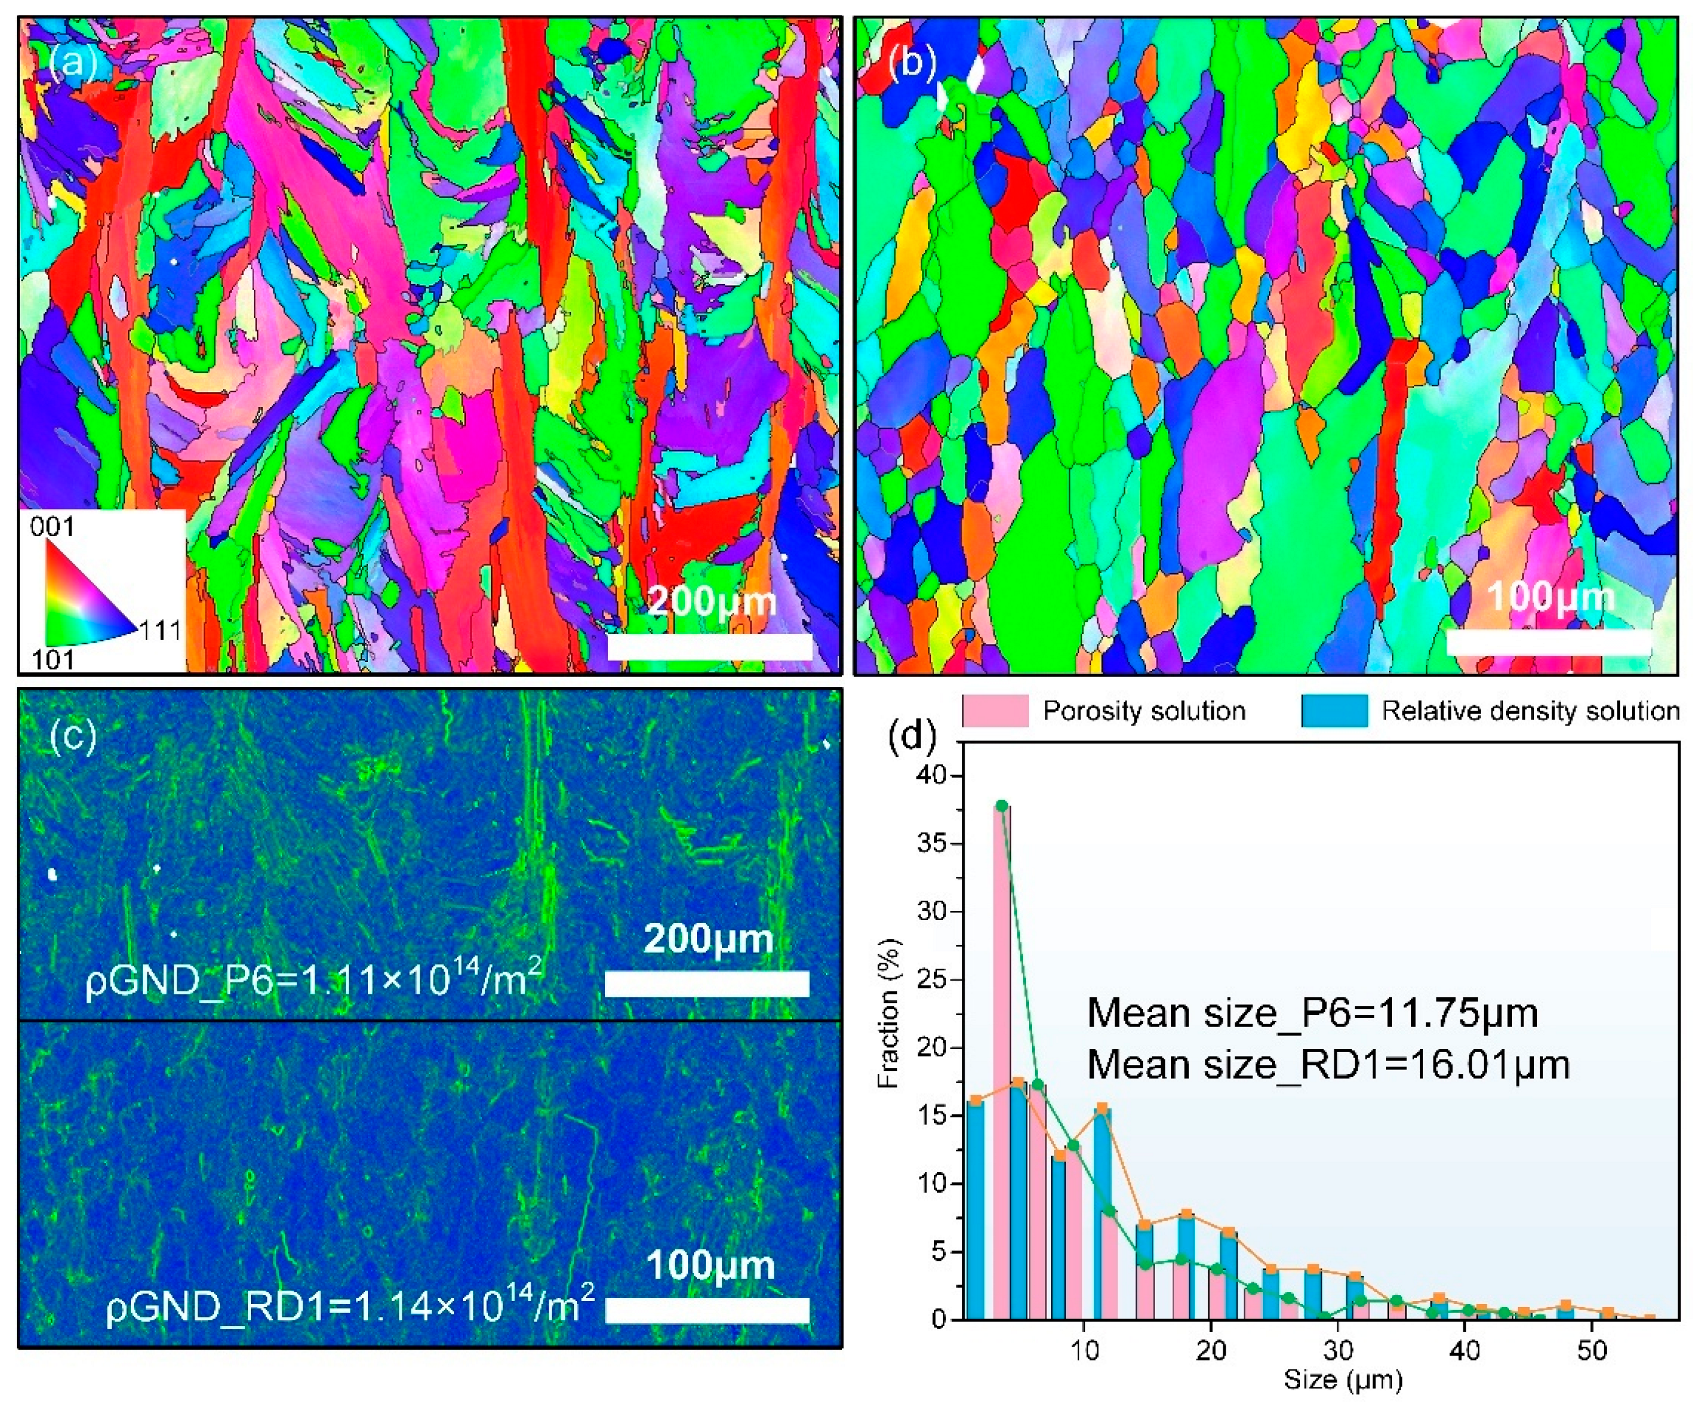
3.5. Microstructure
4. Discussion
5. Conclusions
Author Contributions
Funding
Informed Consent Statement
Data Availability Statement
Acknowledgments
Conflicts of Interest
References
- Liu, Q.; Wu, H.; Paul, M.J.; He, P.; Peng, Z.; Gludovatz, B.; Kruzic, J.J.; Wang, C.H.; Li, X. Machine-Learning Assisted Laser Powder Bed Fusion Process Optimization for AlSi10Mg: New Microstructure Description Indices and Fracture Mechanisms. Acta Mater. 2020, 201, 316–328. [Google Scholar] [CrossRef]
- Abhishek, S.; Anand Kumar, S.; Rao, S. Multi-Scale Modelling for Optimization of Process Parameters of Laser Powder Bed Fusion Processed Inconel 718 Surrogate Part. Eng. Fail. Anal. 2024, 155, 107713. [Google Scholar] [CrossRef]
- Jirandehi, A.P.; Hajshirmohammadi, B.; Carrion, P.; Khonsari, M.M.; Shamsaei, N.; Shao, S. Strain Energy-Based Fatigue Failure Analyses of LB-PBF Inconel 718: Effect of Build Orientation. Addit. Manuf. 2022, 52, 102661. [Google Scholar] [CrossRef]
- Liu, B.; Ding, Y.; Xu, J.; Gao, Y.; Wang, X.; Zhang, H.; Hu, Y.; Sun, F. Outstanding Strength-Ductility Synergy in Inconel 718 Superalloy via Laser Powder Bed Fusion and Thermomechanical Treatment. Addit. Manuf. 2023, 67, 103491. [Google Scholar] [CrossRef]
- Stopka, K.S.; Desrosiers, A.; Nicodemus, T.; Krutz, N.; Andreaco, A.; Sangid, M.D. Intentionally Seeding Pores in Additively Manufactured Alloy 718: Process Parameters, Microstructure, Defects, and Fatigue. Addit. Manuf. 2023, 66, 103450. [Google Scholar] [CrossRef]
- Watring, D.S.; Benzing, J.T.; Hrabe, N.; Spear, A.D. Effects of Laser-Energy Density and Build Orientation on the Structure–Property Relationships in as-Built Inconel 718 Manufactured by Laser Powder Bed Fusion. Addit. Manuf. 2020, 36, 101425. [Google Scholar] [CrossRef]
- Babamiri, B.B.; Indeck, J.; Demeneghi, G.; Cuadra, J.; Hazeli, K. Quantification of Porosity and Microstructure and Their Effect on Quasi-Static and Dynamic Behavior of Additively Manufactured Inconel 718. Addit. Manuf. 2020, 34, 101380. [Google Scholar] [CrossRef]
- Wu, S.; Lei, Z.; Jiang, M.; Liang, J.; Li, B.; Chen, Y. Experimental Investigation and Discrete Element Modeling for Particle-Scale Powder Spreading Dynamics in Powder-Bed-Fusion-Based Additive Manufacturing. Powder Technol. 2022, 403, 117390. [Google Scholar] [CrossRef]
- Bayat, M.; Mohanty, S.; Hattel, J.H. Multiphysics Modelling of Lack-of-Fusion Voids Formation and Evolution in IN718 Made by Multi-Track/Multi-Layer L-PBF. Int. J. Heat Mass Transf. 2019, 139, 95–114. [Google Scholar] [CrossRef]
- Wang, L.; Zhang, Y.; Chia, H.Y.; Yan, W. Mechanism of Keyhole Pore Formation in Metal Additive Manufacturing. npj Comput. Mater. 2022, 8, 22. [Google Scholar] [CrossRef]
- Yu, T.; Zhao, J. Semi-Coupled Resolved CFD–DEM Simulation of Powder-Based Selective Laser Melting for Additive Manufacturing. Comput. Methods Appl. Mech. Eng. 2021, 377, 113707. [Google Scholar] [CrossRef]
- Shi, Q.; Gu, D.; Xia, M.; Cao, S.; Rong, T. Effects of Laser Processing Parameters on Thermal Behavior and Melting/Solidification Mechanism during Selective Laser Melting of TiC/Inconel 718 Composites. Opt. Laser Technol. 2016, 84, 9–22. [Google Scholar] [CrossRef]
- Foroozmehr, A.; Badrossamay, M.; Foroozmehr, E.; Golabi, S. Finite Element Simulation of Selective Laser Melting Process Considering Optical Penetration Depth of Laser in Powder Bed. Mater. Des. 2016, 89, 255–263. [Google Scholar] [CrossRef]
- Chen, F.; Yan, W. High-Fidelity Modelling of Thermal Stress for Additive Manufacturing by Linking Thermal-Fluid and Mechanical Models. Mater. Des. 2020, 196, 109185. [Google Scholar] [CrossRef]
- Parry, L.; Ashcroft, I.A.; Wildman, R.D. Understanding the Effect of Laser Scan Strategy on Residual Stress in Selective Laser Melting through Thermo-Mechanical Simulation. Addit. Manuf. 2016, 12, 1–15. [Google Scholar] [CrossRef]
- Yan, W.; Lian, Y.; Yu, C.; Kafka, O.L.; Liu, Z.; Liu, W.K.; Wagner, G.J. An Integrated Process–Structure–Property Modeling Framework for Additive Manufacturing. Comput. Methods Appl. Mech. Eng. 2018, 339, 184–204. [Google Scholar] [CrossRef]
- Maamoun, A.H.; Xue, Y.F.; Elbestawi, M.A.; Veldhuis, S.C. Effect of Selective Laser Melting Process Parameters on the Quality of al Alloy Parts: Powder Characterization, Density, Surface Roughness, and Dimensional Accuracy. Materials 2018, 11, 2343. [Google Scholar] [CrossRef]
- Yakout, M.; Elbestawi, M.A.; Veldhuis, S.C. Density and Mechanical Properties in Selective Laser Melting of Invar 36 and Stainless Steel 316L. J. Mater. Process. Technol. 2019, 266, 397–420. [Google Scholar] [CrossRef]
- Aboutaleb, A.M.; Mahtabi, M.J.; Tschopp, M.A.; Bian, L. Multi-Objective Accelerated Process Optimization of Mechanical Properties in Laser-Based Additive Manufacturing: Case Study on Selective Laser Melting (SLM) Ti-6Al-4V. J. Manuf. Process. 2019, 38, 432–444. [Google Scholar] [CrossRef]
- Jiang, H.Z.; Li, Z.Y.; Feng, T.; Wu, P.Y.; Chen, Q.S.; Feng, Y.L.; Li, S.W.; Gao, H.; Xu, H.J. Factor Analysis of Selective Laser Melting Process Parameters with Normalised Quantities and Taguchi Method. Opt. Laser Technol. 2019, 119, 105592. [Google Scholar] [CrossRef]
- Mehrabi, O.; Hossein Seyedkashi, S.M.; Moradi, M. Experimental and Response Surface Study on Additive Manufacturing of Functionally Graded Steel-Inconel Wall Using Direct Laser Metal Deposition. Opt. Laser Technol. 2023, 167, 109707. [Google Scholar] [CrossRef]
- Gheysen, J.; Marteleur, M.; van der Rest, C.; Simar, A. Efficient Optimization Methodology for Laser Powder Bed Fusion Parameters to Manufacture Dense and Mechanically Sound Parts Validated on AlSi12 Alloy. Mater. Des. 2021, 199, 109433. [Google Scholar] [CrossRef]
- Jin, Z.; Zhang, Z.; Demir, K.; Gu, G.X. Machine Learning for Advanced Additive Manufacturing. Matter 2020, 3, 1541–1556. [Google Scholar] [CrossRef]
- Chia, H.Y.; Wu, J.; Wang, X.; Yan, W. Process Parameter Optimization of Metal Additive Manufacturing: A Review and Outlook. J. Mater. Inform. 2022, 2, 1–34. [Google Scholar] [CrossRef]
- Liu, C.; Tian, W.; Kan, C. When AI Meets Additive Manufacturing: Challenges and Emerging Opportunities for Human-Centered Products Development. J. Manuf. Syst. 2022, 64, 648–656. [Google Scholar] [CrossRef]
- Lee, S.; Rasoolian, B.; Silva, D.F.; Pegues, J.W.; Shamsaei, N. Surface Roughness Parameter and Modeling for Fatigue Behavior of Additive Manufactured Parts: A Non-Destructive Data-Driven Approach. Addit. Manuf. 2021, 46, 102094. [Google Scholar] [CrossRef]
- Cao, L.; Li, J.; Hu, J.; Liu, H.; Wu, Y.; Zhou, Q. Optimization of Surface Roughness and Dimensional Accuracy in LPBF Additive Manufacturing. Opt. Laser Technol. 2021, 142, 107246. [Google Scholar] [CrossRef]
- Gan, Z.; Li, H.; Wolff, S.J.; Bennett, J.L.; Hyatt, G.; Wagner, G.J.; Cao, J.; Liu, W.K. Data-Driven Microstructure and Microhardness Design in Additive Manufacturing Using a Self-Organizing Map. Engineering 2019, 5, 730–735. [Google Scholar] [CrossRef]
- Tapia, G.; Elwany, A.H.; Sang, H. Prediction of Porosity in Metal-Based Additive Manufacturing Using Spatial Gaussian Process Models. Addit. Manuf. 2016, 12, 282–290. [Google Scholar] [CrossRef]
- Vieille, B.; Keller, C.; Mokhtari, M.; Briatta, H.; Breteau, T.; Nguejio, J.; Barbe, F.; Ben Azzouna, M.; Baustert, E. Investigations on the Fracture Behavior of Inconel 718 Superalloys Obtained from Cast and Additive Manufacturing Processes. Mater. Sci. Eng. A 2020, 790, 139666. [Google Scholar] [CrossRef]
- Chen, Z.; Chen, S.; Wei, Z.; Zhang, L.; Wei, P.; Lu, B.; Zhang, S.; Xiang, Y. Anisotropy of Nickel-Based Superalloy K418 Fabricated by Selective Laser Melting. Prog. Nat. Sci. Mater. Int. 2018, 28, 496–504. [Google Scholar] [CrossRef]
- Yao, X.; Moon, S.K.; Lee, B.Y.; Bi, G. Effects of Heat Treatment on Microstructures and Tensile Properties of IN718/TiC Nanocomposite Fabricated by Selective Laser Melting. Int. J. Precis. Eng. Manuf. 2017, 18, 1693–1701. [Google Scholar] [CrossRef]
- Gradl, P.R.; Tinker, D.C.; Ivester, J.; Skinner, S.W.; Teasley, T.; Bili, J.L. Geometric Feature Reproducibility for Laser Powder Bed Fusion (L-PBF) Additive Manufacturing with Inconel 718. Addit. Manuf. 2021, 47, 102305. [Google Scholar] [CrossRef]
- Mostafaei, A.; Zhao, C.; He, Y.; Reza Ghiaasiaan, S.; Shi, B.; Shao, S.; Shamsaei, N.; Wu, Z.; Kouraytem, N.; Sun, T.; et al. Defects and Anomalies in Powder Bed Fusion Metal Additive Manufacturing. Curr. Opin. Solid State Mater. Sci. 2022, 26, 100974. [Google Scholar]
- Kaletsch, A.; Qin, S.; Herzog, S.; Broeckmann, C. Influence of High Initial Porosity Introduced by Laser Powder Bed Fusion on the Fatigue Strength of Inconel 718 after Post-Processing with Hot Isostatic Pressing. Addit. Manuf. 2021, 47, 102331. [Google Scholar] [CrossRef]
- Salarian, M.; Asgari, H.; Vlasea, M. Pore Space Characteristics and Corresponding Effect on Tensile Properties of Inconel 625 Fabricated via Laser Powder Bed Fusion. Mater. Sci. Eng. A 2020, 769, 138525. [Google Scholar] [CrossRef]
- Hilaire, A.; Andrieu, E.; Wu, X. High-Temperature Mechanical Properties of Alloy 718 Produced by Laser Powder Bed Fusion with Different Processing Parameters. Addit. Manuf. 2019, 26, 147–160. [Google Scholar] [CrossRef]
- Pike, D.J.; Box, G.E.P.; Draper, N.R. Empirical Model-Building and Response Surfaces. J. R. Stat. Soc. Ser. A Stat. Soc. 1988, 151, 669. [Google Scholar] [CrossRef]
- Gunst, R.F.; Myers, R.H.; Montgomery, D.C. Response Surface Methodology: Process and Product Optimization Using Designed Experiments. Technometrics 1996, 38, 284–286. [Google Scholar] [CrossRef]
- WK75329 New Practice for Nondestructive Testing (NDT), Part Quality, and Acceptability Levels of Additively Manufactured Laser Beam Powder Bed Fusion Aerospace Components. Available online: https://www.astm.org/workitem-wk75329 (accessed on 9 December 2024).
- BS EN 10002-1:2001/ISO 6892-1; Metallic Materials-Tensile Testing-Part 1: Method of Test at Room Temperature. Deutsche Norm: Berlin, Germany, 2009. Available online: https://www.iso.org/obp/ui/#iso:std:iso:6892:-1:ed-1:v1:en (accessed on 11 April 2025).
- Khorasani, M.; Ghasemi, A.H.; Leary, M.; Downing, D.; Gibson, I.; Sharabian, E.G.; Veetil, J.K.; Brandt, M.; Bateman, S.; Rolfe, B. Benchmark Models for Conduction and Keyhole Modes in Laser-Based Powder Bed Fusion of Inconel 718. Opt. Laser Technol. 2023, 164, 109509. [Google Scholar] [CrossRef]
- Mayi, Y.A.; Dal, M.; Peyre, P.; Bellet, M.; Fabbro, R. Physical Mechanisms of Conduction-to-Keyhole Transition in Laser Welding and Additive Manufacturing Processes. Opt. Laser Technol. 2023, 158, 108811. [Google Scholar] [CrossRef]
- Zhao, C.; Parab, N.D.; Li, X.; Fezzaa, K.; Tan, W.; Rollett, A.D.; Sun, T. Critical Instability at Moving Keyhole Tip Generates Porosity in Laser Melting. Science 2020, 370, 1080–1086. [Google Scholar] [CrossRef] [PubMed]
- Fleming, T.G.; Clark, S.J.; Fan, X.; Fezzaa, K.; Leung, C.L.A.; Lee, P.D.; Fraser, J.M. Synchrotron Validation of Inline Coherent Imaging for Tracking Laser Keyhole Depth. Addit. Manuf. 2023, 77, 103798. [Google Scholar] [CrossRef]
- Guo, L.; Liu, H.; Wang, H.; Wei, Q.; Xiao, Y.; Tang, Z.; Wu, Y.; Wang, H. Identifying the Keyhole Stability and Pore Formation Mechanisms in Laser Powder Bed Fusion Additive Manufacturing. J. Mater. Process. Technol. 2023, 321, 118153. [Google Scholar] [CrossRef]
- Huang, Y.; Fleming, T.G.; Clark, S.J.; Marussi, S.; Fezzaa, K.; Thiyagalingam, J.; Leung, C.L.A.; Lee, P.D. Keyhole Fluctuation and Pore Formation Mechanisms during Laser Powder Bed Fusion Additive Manufacturing. Nat. Commun. 2022, 13, 1170. [Google Scholar] [CrossRef]
- Yang, H.; Wang, Z.; Wang, H.; Wu, Y.; Wang, H. Microstructure, Mechanical Property and Heat Treatment Schedule of the Inconel 718 Manufactured by Low and High Power Laser Powder Bed Fusion. Mater. Sci. Eng. A 2023, 863, 144517. [Google Scholar] [CrossRef]
- de Leon Nope, G.V.; Perez-Andrade, L.I.; Corona-Castuera, J.; Espinosa-Arbelaez, D.G.; Muñoz-Saldaña, J.; Alvarado-Orozco, J.M. Study of Volumetric Energy Density Limitations on the IN718 Mesostructure and Microstructure in Laser Powder Bed Fusion Process. J. Manuf. Process. 2021, 64, 1261–1272. [Google Scholar] [CrossRef]
- Haines, M.P.; Rielli, V.V.; Primig, S.; Haghdadi, N. Powder Bed Fusion Additive Manufacturing of Ni-Based Superalloys: A Review of the Main Microstructural Constituents and Characterization Techniques. J. Mater. Sci. 2022, 57, 14135–14187. [Google Scholar] [CrossRef]
- Mostafaei, A.; Ghiaasiaan, R.; Ho, I.T.; Strayer, S.; Chang, K.C.; Shamsaei, N.; Shao, S.; Paul, S.; Yeh, A.C.; Tin, S.; et al. Additive Manufacturing of Nickel-Based Superalloys: A State-of-the-Art Review on Process-Structure-Defect-Property Relationship. Prog. Mater. Sci. 2023, 136, 101108. [Google Scholar] [CrossRef]


| Name | Goal | Minimum | Maximum |
|---|---|---|---|
| X1 (Laser power, W) | Range | 150 | 300 |
| X2 (Scanning speed, mm/s) | Range | 500 | 1200 |
| X3 (Hatch spacing, mm) | Range | 0.03 | 0.14 |
| X4 (Layer thickness, mm) | Range | 0.02 | 0.05 |
| Ni | Cr | Nb | Mo | Ti | Al | C | Mn | Si | Fe |
|---|---|---|---|---|---|---|---|---|---|
| 53 | 20 | 5.3 | 3 | 1.05 | 2.5 | 0.03 | <0.35 | <0.35 | Bal. |
| ED (E1) | 1.6203 | ED (E2) | 1.6083 | ED (E3) | 1.4012 | |||
|---|---|---|---|---|---|---|---|---|
| NVP | POV | RDOV | NVP | POV | RDOV | NVP | POV | RDOV |
| 0.0264 | 1.3900 | 0.9735 | 0.0089 | 0.4700 | 0.9742 | 0.3166 | 16.6500 | 0.9706 |
| 0.0352 | 1.8500 | 0.9945 | 0.1154 | 6.0700 | 0.9579 | 0.1322 | 6.9500 | 0.9658 |
| 0.0662 | 3.4800 | 0.9651 | 0.0004 | 0.0200 | 0.9726 | 0.0662 | 3.4800 | 0.9831 |
| Cosine similarity | Cosine similarity | Cosine similarity | ||||||
| E1 and E2 | 1.0000 | E2 and E3 | 0.9974 | E3 and E1 | 0.9976 | |||
| Run | X1 | X2 | X3 | X4 | Pd | Porosity | Relative Density |
|---|---|---|---|---|---|---|---|
| 1 | 225 | 150 | 0.085 | 0.035 | 504 | 4.73 | 0.964 |
| 2 | 150 | 1200 | 0.14 | 0.02 | 45 | 3.48 | 0.965 |
| 3 | 225 | 850 | 0.085 | 0.035 | 89 | 0.84 | 0.987 |
| 4 | 225 | 850 | 0.085 | 0.035 | 89 | 2.97 | 0.976 |
| 5 | 150 | 500 | 0.14 | 0.05 | 43 | 1.85 | 0.995 |
| 6 | 150 | 1200 | 0.03 | 0.02 | 208 | 16.65 | 0.971 |
| 7 | 300 | 1200 | 0.14 | 0.05 | 36 | 0.33 | 0.971 |
| 8 | 375 | 850 | 0.085 | 0.035 | 148 | 0.34 | 0.987 |
| 9 | 225 | 850 | 0.085 | 0.035 | 89 | 0.10 | 0.988 |
| 10 | 225 | 850 | 0.085 | 0.035 | 89 | 7.27 | 0.983 |
| 11 | 225 | 850 | 0.025 | 0.035 | 303 | 3.48 | 0.983 |
| 12 | 300 | 500 | 0.14 | 0.05 | 86 | 0.02 | 0.973 |
| 13 | 300 | 500 | 0.03 | 0.05 | 400 | 9.79 | 0.971 |
| 14 | 300 | 1200 | 0.03 | 0.02 | 417 | 2.20 | 0.978 |
| 15 | 225 | 850 | 0.085 | 0.035 | 89 | 0.08 | 0.985 |
| 16 | 300 | 1200 | 0.03 | 0.05 | 167 | 0.60 | 0.973 |
| 17 | 150 | 1200 | 0.03 | 0.05 | 83 | 6.07 | 0.958 |
| 18 | 225 | 850 | 0.195 | 0.035 | 39 | 1.39 | 0.974 |
| 19 | 300 | 1200 | 0.14 | 0.02 | 89 | 2.92 | 0.969 |
| 20 | 225 | 850 | 0.085 | 0.005 | 623 | 0.00 | 0.979 |
| 21 | 75 | 850 | 0.085 | 0.035 | 30 | 45.86 | 0.924 |
| 22 | 300 | 500 | 0.03 | 0.02 | 1000 | 3.93 | 0.979 |
| 23 | 225 | 1550 | 0.085 | 0.035 | 49 | 0.47 | 0.974 |
| 24 | 150 | 500 | 0.03 | 0.02 | 500 | 0.87 | 0.968 |
| 25 | 150 | 500 | 0.03 | 0.05 | 200 | 5.49 | 0.955 |
| 26 | 150 | 500 | 0.14 | 0.02 | 107 | 0.01 | 0.966 |
| 27 | 300 | 500 | 0.14 | 0.02 | 214 | 6.95 | 0.966 |
| 28 | 225 | 850 | 0.085 | 0.035 | 89 | 4.20 | 0.984 |
| 29 | 150 | 1200 | 0.14 | 0.05 | 18 | 52.59 | 0.935 |
| 30 | 225 | 850 | 0.085 | 0.065 | 48 | 3.91 | 0.980 |
| Models | |||||
|---|---|---|---|---|---|
| RD | Porosity | ||||
| Factors | F value | p value | Factors | F value | p value |
| Model | 7.1 | 0.0005 | Model | 10.67 | 0.0001 |
| X1 | 39.49 | <0.0001 | X1 | 48.48 | <0.0001 |
| X2 | 0.86 | 0.3717 | X2 | 0.42 | 0.5281 |
| X3 | 0.93 | 0.3528 | X3 | 0.66 | 0.4345 |
| X4 | 0.72 | 0.4115 | X4 | 4.41 | 0.0597 |
| X1X2 | 4.39 | 0.0563 | X1X2 | 21.23 | 0.0008 |
| X1X3 | 1.15 | 0.3026 | X1X3 | 3.61 | 0.0838 |
| X1X4 | 0.7 | 0.4171 | X1X4 | 7.38 | 0.02 |
| X2X3 | 5.27 | 0.0389 | X2X3 | 5.93 | 0.033 |
| X2X4 | 4.76 | 0.0481 | X2X4 | 2.45 | 0.1458 |
| X3X4 | 2.52 | 0.1366 | X3X4 | 5.44 | 0.0397 |
| X2 | 27.57 | 0.0002 | X12 | 34.66 | 0.0001 |
| X22 | 7.74 | 0.0156 | X22 | 0.0006 | 0.9802 |
| X1X2X3 | 5.49 | 0.0357 | X1X2X3 | 2.75 | 0.1256 |
| X1X2X4 | 3.85 | 0.0714 | X1X2X42 | 3.62 | 0.0835 |
| X2X3X4 | 5.33 | 0.038 | X1X3X4 | 14.61 | 0.0028 |
| X1X22 | 14.07 | 0.0024 | X2X3X4 | 16.13 | 0.002 |
| - | - | - | X12X2 | 5.19 | 0.0437 |
| - | - | - | X1X22 | 14.46 | 0.0029 |
| Lack of Fit | 3.48 | 9.28E-02 | Lack of Fit | 4.04 | 7.35E-02 |
| R2 | 0.9 | - | R2 | 0.95 | - |
| Adj. R2 | 0.77 | - | Adj. R2 | 0.86 | - |
| ID | P (W) | SS (mm/s) | HS (mm) | LT (mm) | Pd (J/mm3) |
|---|---|---|---|---|---|
| P1 | 298 | 1145 | 0.14 | 0.05 | 39 |
| P2 | 292 | 1150 | 0.12 | 0.05 | 44 |
| P3 | 184 | 1185 | 0.14 | 0.02 | 55 |
| P4 | 238 | 1136 | 0.12 | 0.02 | 74 |
| P5 | 230 | 1173 | 0.07 | 0.03 | 85 |
| P6 | 298 | 924 | 0.10 | 0.02 | 128 |
| P7 | 245 | 921 | 0.09 | 0.02 | 135 |
| P8 | 282 | 836 | 0.03 | 0.05 | 220 |
| P9 | 294 | 674 | 0.05 | 0.03 | 260 |
| P10 | 278 | 674 | 0.03 | 0.02 | 568 |
| RD1 | 300 | 812 | 0.03 | 0.02 | 616 |
| RD2 | 300 | 815 | 0.03 | 0.02 | 613 |
| RD3 | 300 | 809 | 0.03 | 0.02 | 618 |
| ID | RD/% | Porosity/% |
|---|---|---|
| P1 | 99.1 | 4.17 |
| P2 | 99.3 | 2.52 |
| P3 | 99.4 | 0.00 |
| P4 | 99.4 | 0.00 |
| P5 | 99.5 | 0.00 |
| P6 | 99.4 | 0.00 |
| P7 | 99.4 | 0.00 |
| P8 | 98.8 | 0.54 |
| P9 | 99.1 | 0.31 |
| P10 | 99.3 | 1.22 |
| RD1 | 98.4 | 0.22 |
| RD2 | 98.2 | 0.15 |
| RD3 | 98.5 | 0.28 |
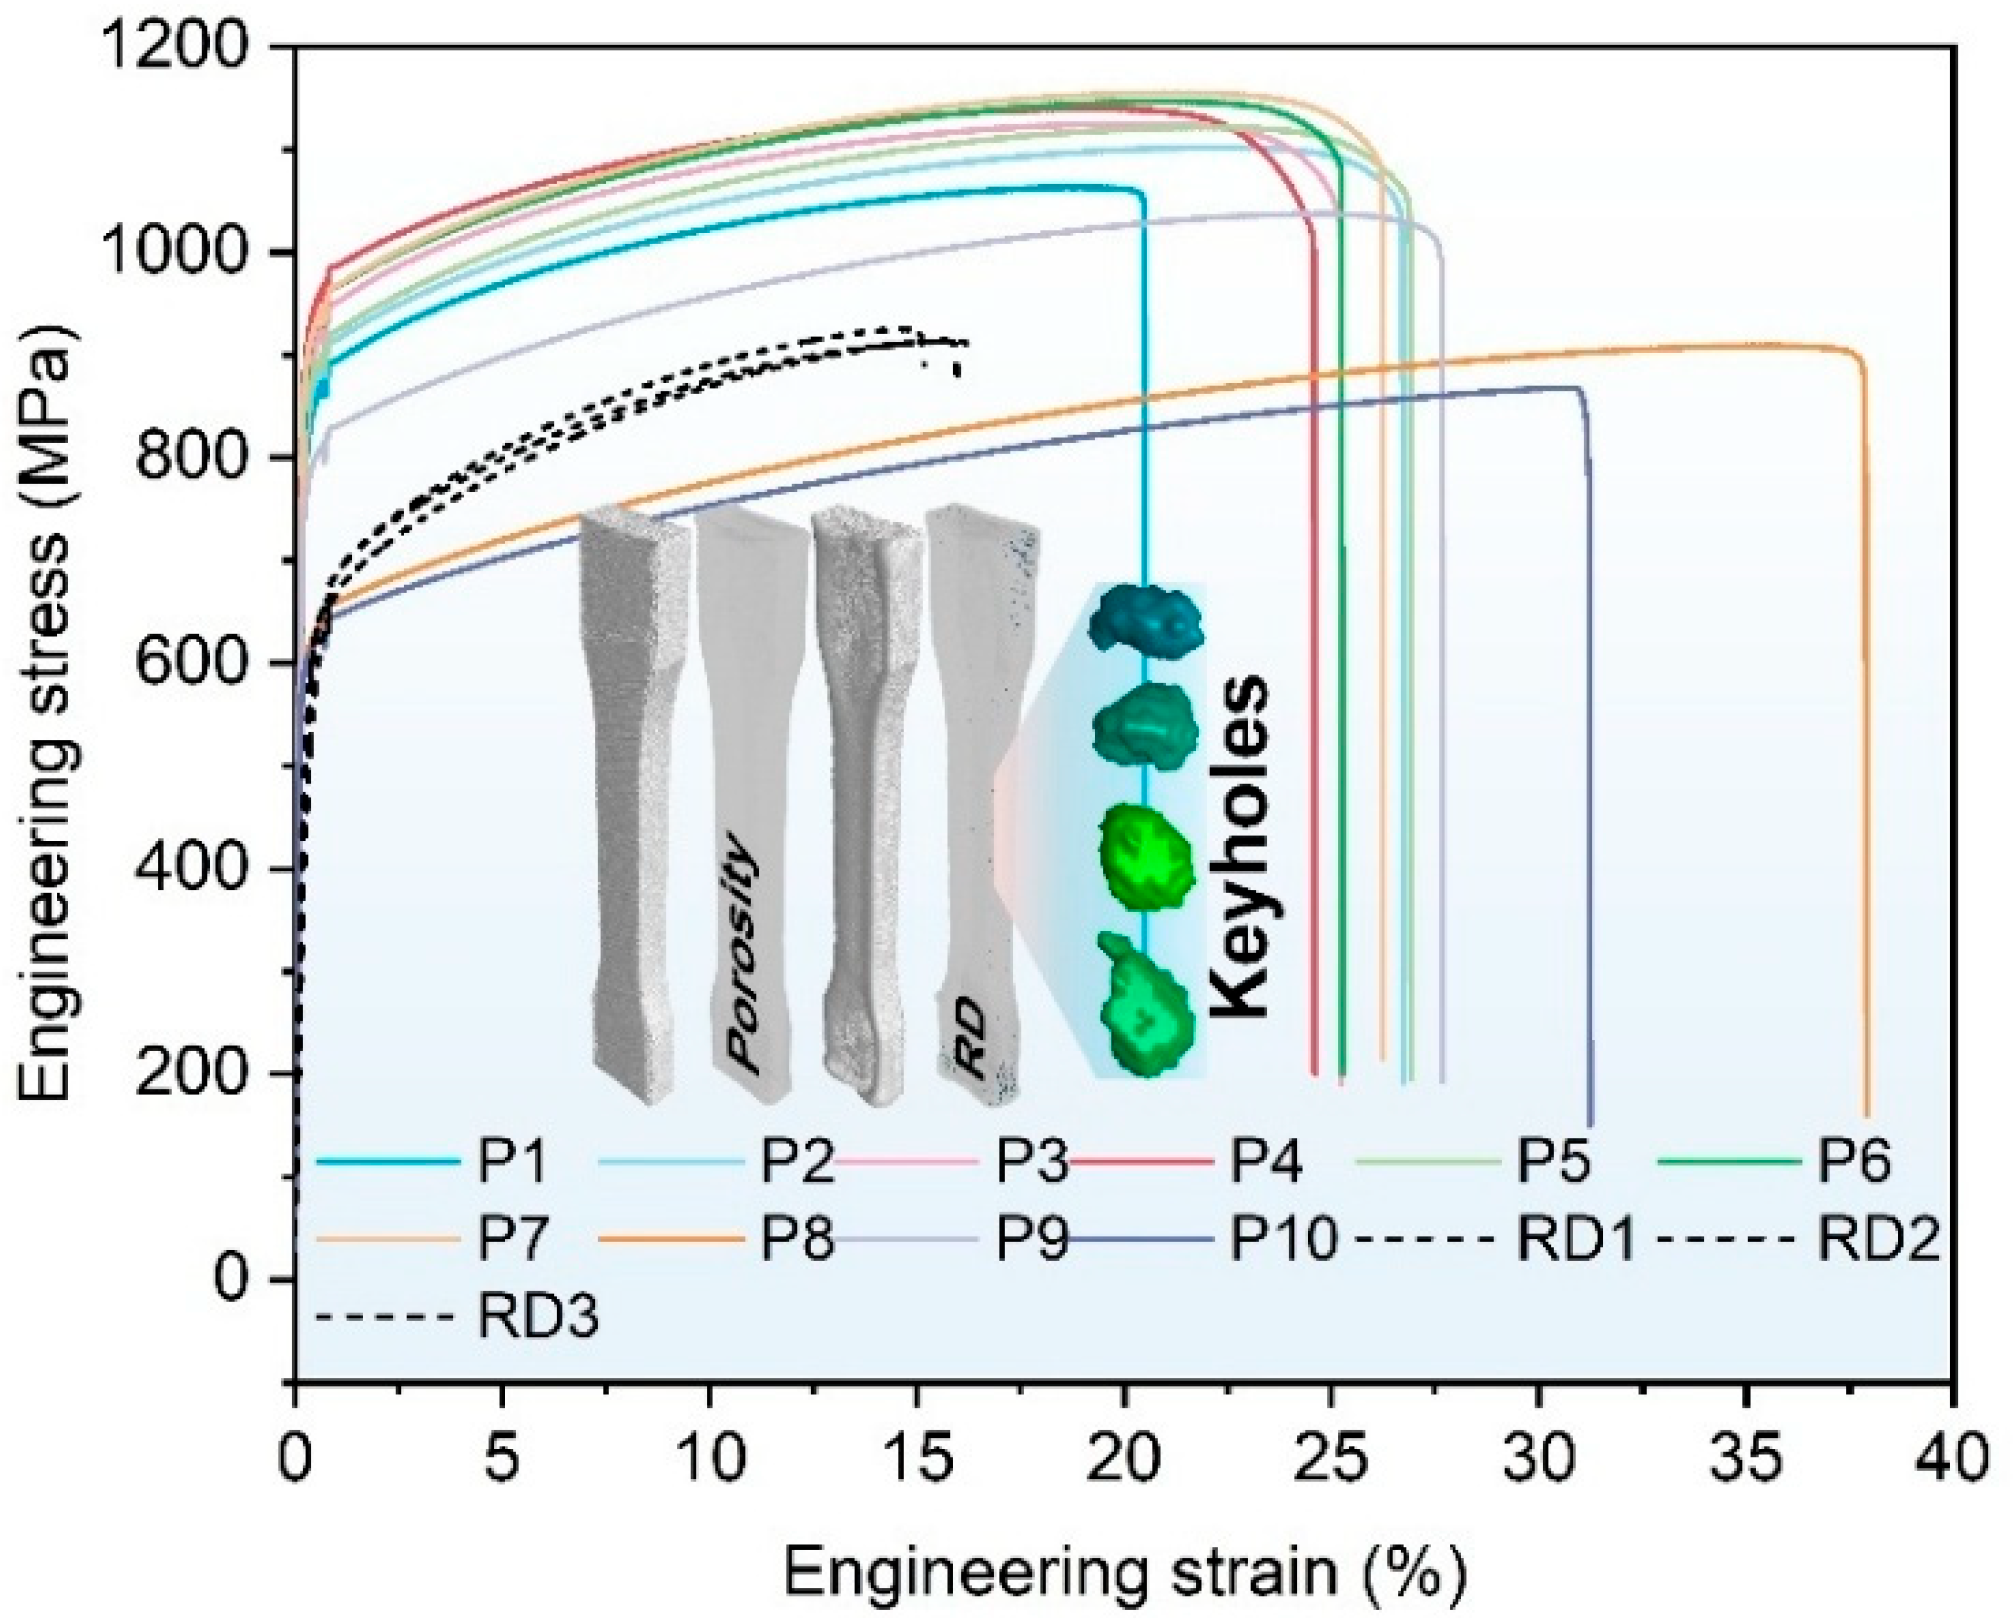
| ID | UTS/MPa | YS/MPa | Elongation/% |
|---|---|---|---|
| P1 | 1063 | 836 | 20 |
| P2 | 1102 | 850 | 28 |
| P3 | 1125 | 896 | 25 |
| P4 | 1140 | 926 | 28 |
| P5 | 1121 | 872 | 28 |
| P6 | 1146 | 913 | 26 |
| P7 | 1155 | 908 | 30 |
| P8 | 909 | 611 | 38 |
| P9 | 1037 | 784 | 30 |
| P10 | 868 | 606 | 31 |
| RD1 | 913 | 621 | 16 |
| RD2 | 914 | 587 | 16 |
| RD3 | 925 | 616 | 15 |
Disclaimer/Publisher’s Note: The statements, opinions and data contained in all publications are solely those of the individual author(s) and contributor(s) and not of MDPI and/or the editor(s). MDPI and/or the editor(s) disclaim responsibility for any injury to people or property resulting from any ideas, methods, instructions or products referred to in the content. |
© 2025 by the authors. Licensee MDPI, Basel, Switzerland. This article is an open access article distributed under the terms and conditions of the Creative Commons Attribution (CC BY) license (https://creativecommons.org/licenses/by/4.0/).
Share and Cite
Wang, Y.; Guo, W.; Li, W.; Zhang, Y.; Ma, K.; Ji, Q.; Han, R.; Zhang, Y.; Wang, C.; Zhao, S.; et al. Improving Laser Powder Bed Fusion IN718 Process Development Efficiency by Eliminating Pore Defects of Specified Size. Materials 2025, 18, 1929. https://doi.org/10.3390/ma18091929
Wang Y, Guo W, Li W, Zhang Y, Ma K, Ji Q, Han R, Zhang Y, Wang C, Zhao S, et al. Improving Laser Powder Bed Fusion IN718 Process Development Efficiency by Eliminating Pore Defects of Specified Size. Materials. 2025; 18(9):1929. https://doi.org/10.3390/ma18091929
Chicago/Turabian StyleWang, Yuzhong, Wenhua Guo, Wenxian Li, Yaru Zhang, Kaiyue Ma, Qianyu Ji, Rui Han, Yihui Zhang, Chenwei Wang, Sihang Zhao, and et al. 2025. "Improving Laser Powder Bed Fusion IN718 Process Development Efficiency by Eliminating Pore Defects of Specified Size" Materials 18, no. 9: 1929. https://doi.org/10.3390/ma18091929
APA StyleWang, Y., Guo, W., Li, W., Zhang, Y., Ma, K., Ji, Q., Han, R., Zhang, Y., Wang, C., Zhao, S., & Lu, B. (2025). Improving Laser Powder Bed Fusion IN718 Process Development Efficiency by Eliminating Pore Defects of Specified Size. Materials, 18(9), 1929. https://doi.org/10.3390/ma18091929