1. Introduction
Diabetic retinopathy (DR) has become increasingly prevalent with the rise of sugar consumption among modern populations [
1], causing permanent and irreversible blindness [
2]. Therefore, the early diagnosis of DR and timely medical intervention in patients can effectively control disease progression, prevent vision impairment, and improve patients’ quality of life [
3]. However, such a time-consuming and labor-intensive task would significantly lead to an unnecessary burden on ophthalmologists and limit their abilities to engage in more complex medical work [
4]. To alleviate the redundant workload on ophthalmologists and achieve a more efficient diagnosis, many researchers have attempted to propose automated DR diagnosis methods including image-level and pixel-level diagnosis. Image-level diagnosis involves the classification of DR images [
5], while pixel-level diagnosis involves the segmentation of DR lesions [
6], specifically identifying four types of lesions with distinct DR pathological features: microaneurysms (MAs), hemorrhages (HEs), soft exudates (SEs), and hard exudates (EXs) [
7]. Among numerous automated DR lesion segmentation methods, deep learning-based methods have been widely applied due to their high performance and easy implementation.
Deep learning-based methods have been proven to be highly accurate and stable in DR segmentation with their strong ability to extract tiny lesions in retinal fundus images. Many scholars have proposed different methods to improve their segmentation performances persistently. For example, Tavakoli et al. [
8] proposed different preprocessing methods for DR segmentation, and Huang et al. [
9] proposed a relation Transformer for segmenting two types of diseases concurrently. Zhou et al. [
10] proposed a semi-supervised method for both segmentation and classification. Guo et al. [
11] proposed a set of fully convolutional networks with different input sizes to extract multi-scale lesions.
The aforementioned deep learning-based methods have made significant progress in DR lesion segmentation. However, they have not fully exploited the multi-scale features in fundus images and exhibit limited capability in segmenting small lesions, leading to relatively inaccurate segmentation results. These limitations can be attributed to the inability of existing methods to effectively capture and leverage multi-scale information and accurately perceive subtle lesions. Furthermore, it is difficult to comprehensively harness the diverse scales of features present in fundus images. To address these issues, this paper proposes a DR lesion segmentation method, MLNet, based on multi-scale attention and lesion perception. The major contributions of this paper can be summarized as follows:
1. By combining VGG16 [
12] and the Multi-Scale Attention Block (MSAB) through skip connections, MLNet can not only extract the characteristics of DR multi-level lesion features but also effectively capture multi-scale lesion information.
2. The Lesion Perception Block (LPB) is designed and introduced in MLNet. After the MSAB upsampling, decoding, and adding the retinal fundus image feature map element by element, the LPB is used to deeply perceive the information of subtle lesions in DR images.
3. A novel loss function combining the Tversky loss function and binary cross-entropy loss function is proposed to alleviate the negative effects of highly imbalanced DR datasets. Additionally, different weights are assigned to different lesions within the loss function to guide the training of the algorithm.
The experimental results show that compared with other state-of-the-art algorithms, MLNet achieves better scores in various evaluation metrics and has the best DR lesion segmentation performance, especially in subtle lesions.
The rest of this paper is organized as follows: In
Section 2, we briefly discuss the existing deep learning-based DR image segmentation methods. In
Section 3, this paper introduces the algorithm framework of MLNet and its two main blocks, MSAB and LPB, and introduces the design of the loss function.
Section 4 provides an overview of the datasets, along with specific experimental details. It further presents and discusses the obtained experimental results. In
Section 5, we conclude the work and outline potential future research directions.
2. Related Work
Since deep learning was proposed, it has been considered to be highly suitable for various image processing tasks because of its remarkable capability to extract rich features from images [
13]. In recent years, deep learning has made great progress in medical image processing, and DR lesion segmentation based on deep learning has become the mainstream research direction in this field.
Early deep learning-based image segmentation methods include fully convolutional networks (FCNs) [
14], U-Net [
15], SegNet [
16], and U-Transformer [
17], which incorporated the Transformer framework and introduced a self-attention mechanism. The emergence of these methods benefits from the rapid development of computer technology and AI (Artificial Intelligence), which effectively promotes the progress of medical image analysis technology and lays a foundation for researchers to propose new DR lesion segmentation methods. He et al. [
18] proposed an efficient hierarchical hybrid visual Transformer, named H2Former, which combined the strengths of CNN, multi-scale channel attention, and Transformer for DR lesion segmentation. He et al. [
19] developed a Progressive Multi-scale Consistent Network (PMCNet) to achieve improved DR lesion segmentation. This network integrated Progressive Feature Fusion (PFF) and the Dynamic Attention Block (DAB) to facilitate progressive learning and the dynamic fusion of multi-scale features.
Furthermore, the introduction of innovative approaches like RTNet by Huang et al. [
9], hyperbolic space-based Transformer by Wang et al. [
20], SSMD-Unet by Ullah et al. [
21], and M2MRF operator by Liu et al. [
22] has contributed to further advancements in DR lesion segmentation. These methods have leveraged self-attention, cross-attention, relation Transformer blocks, hyperbolic embeddings, and auxiliary reconstruction tasks to enhance segmentation accuracy and address specific challenges associated with scale discrepancy and optimal feature representation.
However, despite the significant progress made in DR lesion segmentation using deep learning, there are still research gaps that need to be addressed. Particularly, there is a need to develop robust segmentation models that effectively capture multi-scale lesion features in fundus images while perceiving subtle lesions in depth. Current approaches have shown promising results; however, there is room for improvement in simultaneously leveraging multi-scale information and depth perception to enhance the accuracy and completeness of DR lesion segmentation.
Furthermore, the influence of imbalanced datasets on the algorithm’s performance remains a challenge. Existing methods often struggle with imbalanced data, where the number of positive lesion samples is significantly smaller than the number of negative samples. To overcome this issue, it is essential to design a novel loss function that incorporates tailored lesion weights. Such a loss function would effectively reduce the negative impact of imbalanced datasets on the segmentation algorithm, ensuring the accurate delineation of both common and rare DR lesions.
3. Methods
3.1. Overview of MLNet
MLNet consists of two key blocks: the MSAB and the LPB. The MSAB plays a crucial role in MLNet for capturing multi-scale lesion features in fundus images. It combines the VGG16 architecture, a prevalent convolutional neural network, with the MSAB through skip connections. This integration allows MLNet to extract the characteristics of DR multi-level lesion features effectively. The LPB is another essential component of MLNet, designed specifically to perceive subtle lesions in depth. After the upsampling, decoding, and addition of the retinal fundus image feature map element by element, the LPB is utilized to deeply perceive the information of subtle lesions in DR images. In addition to the MSAB and LPB, MLNet also incorporates a novel loss function with tailored lesion weights to address the influence of imbalanced datasets on the algorithm’s performance. This loss function aims to reduce the impact of data imbalance and prioritize the accurate segmentation of lesions, further enhancing the reliability and robustness of the segmentation results.
The specific framework of MLNet is illustrated in
Figure 1. Firstly, VGG16 is employed to extract multi-level feature maps from retinal fundus images, and these feature maps are transmitted to multiple MSABs through skip connections. The MSAB utilizes a combination of various types of convolutional layers and self-attention mechanisms to automatically assign different attention weights to different spatial positions and channels based on the content of the input feature maps, and this combination ensures the efficient capture of multi-scale lesion features while establishing long-range dependency relationships. Subsequently, the multiple MSABs perform upsampling, decoding, and channel-wise concatenation on the feature maps and then transmit to the LPB. The LPB utilizes multiple parallel convolutional layers along with the internal Lesion Attention Head (LAH) to generate unique channel information that highlights subtle lesions within each lesion category. This information is then element-wise multiplied with the high-level semantic feature maps inputted into the LPB, enhancing the network’s sensitivity to subtle lesions. Finally, the feature map containing rich lesion information is passed to the segmentation head, which contains a convolutional layer and sigmoid function, to generate the final accurate lesion segmentation results.
In
Figure 1, given a retinal fundus image
(with height H, width W, and 3 channels) as input, the VGG16 is used as a feature encoder to extract multi-level feature maps
. VGG16 is selected as the backbone network in MLNet due to its robust hierarchical feature extraction ability, pre-trained weights on ImageNet, and convenient architecture with skip connections. These features allow MLNet to accurately capture and represent the complex structures and variations present in DR lesions. By leveraging pre-trained weights, MLNet benefits from the generalized representations learned by VGG16, enhancing its ability to extract meaningful features from fundus images. The skip connections enable the fusion of multi-level feature representations, combining fine-grained local details with a broader global context for a comprehensive understanding of the images. Then, multiple MSABs process
separately to obtain multi-scale feature information and build long-range dependency relationships. Then the upsampled and decoded feature maps
with the same resolution of 512 × 512 are obtained. Subsequently, multiple
are summed channel-wise to generate the high-level semantic feature map
, which is feedforwarded into the LPB to further perceive subtle lesions in the fundus image. The output feature map
contains rich lesion information. Finally,
is fed into a segmentation head, to generate four types of lesion segmentation results
.
3.2. Multi-Scale Attention Block
The MSAB structure is illustrated in
Figure 2, which primarily consists of a combination of different types of convolutions and a unique self-attention head. The utilization of different types of convolution operations enables the capturing of multi-scale lesion features in retinal fundus images. The distinctive self-attention head replaces the linear projection in traditional methods [
23] with a 1 × 1 convolutional layer for channel contraction and expansion. This replacement helps reduce the number of hyperparameters. Overall, this block is designed to capture cross-channel multi-scale lesion features in the retinal fundus image and build long-range dependency relationships.
Figure 2 shows that the output of the feature encoder
is passed to the MSAB. The MSAB utilizes two convolutional layers with kernel sizes of 1 × 1 and 3 × 3 to capture multi-scale feature information, resulting in
and
. Subsequently, the MSAB employs self-attention heads to dynamically establish long-range dependency relationships within
and
. Each self-attention head consists of three convolutional layers with a kernel size of 1 × 1, followed by a spatial flattening operation, which generates Query, Key, and Value. The matrix multiplication with Query and Key to obtain attention
process is as follows:
where
and
denote the Key and Value generators, respectively, and
denotes matrix multiplication.
further utilizes the generated Query and its corresponding Value to generate the attention feature map
. The process is as follows:
where
denotes the Value generator, and
denotes the softmax function. Then, the matrix
is de-flattened and multiplied element-wise with trainable scaling factor
s. The results are then added element-wise to
and
, yielding
and
. Subsequently,
and
are added element-wise and undergo upsampling and decoding to generate
. The entire process can be represented as follows:
where
denotes element-wise addition operation,
s is the trainable scaling factor and is enclosed as S in
Figure 2, and
U denotes upsampling and decoding.
3.3. Lesion Perception Block
The LPB is structured as shown in
Figure 3, which primarily consists of multiple parallel convolutional layers with a kernel size of 1 × 1 and an LAH. The parallel convolutional layers are capable of extracting unique feature information for different types of lesions. The LAH utilizes different types of pooling layers to extract diverse feature information. It also introduces two consecutive 1 × 1 convolutional layers for channel contraction and expansion. A sigmoid activation function is inserted after the convolutional layers to introduce non-linearity and prevent gradient vanishing. Finally, the unique skip connection is used to enhance the perception ability of the network for subtle lesions.
Specifically, the LPB performs element-wise addition on the output
from the MSAB to generate
.
is then passed through four parallel convolutional layers with a kernel size of 1 × 1 to reduce the channel dimension, resulting in four types of lesion features,
,
. Afterwards,
is passed to LAH, where specific channel attention factors
,
are generated to emphasize the unique channel information for each lesion type. The mathematical process of the LAH can be described as follows:
where
denotes the sigmoid activation function,
is the scaling factor, and
and
represent global spatial features obtained through average pooling and max pooling.
and
are the 1 × 1 convolutional layer;
denoting the operation is performed twice. Then, the LPB utilizes skip connections to perform element-wise multiplication between
and
, generating feature maps
that contain rich lesion information. This can be represented as follows:
At this point, the LPB completes the extraction of effective lesion information, especially subtle lesion information. Finally, is feedforwarded to the segmentation head containing a convolutional layer with a kernel size of 1 × 1 and a sigmoid function and then generates the segmentation results S for four types of lesions.
3.4. Loss Function
To mitigate the influence of imbalanced datasets on the algorithm’s performance, MLNet incorporates a novel loss function with tailored lesion weights. This loss function assigns higher weights to lesion regions and lower weights to non-lesion regions. By doing so, MLNet can effectively handle imbalanced datasets, prioritize the accurate segmentation of lesions, and reduce the impact of data imbalance on the final segmentation results. Specifically, this paper employs the Tversky loss function [
24] and binary cross-entropy loss function (BCE loss) [
25] to alleviate the negative impact of highly imbalanced datasets on the network during DR lesion segmentation tasks.
The traditional Dice loss function treats
FP (false positives) and
FN (false negatives) equally [
26]. However, in the case of DR datasets, there is a significant class imbalance, and the size of lesions is typically small compared to the background. This creates a challenge where the impact of
FN (missing lesions) is more critical than that of
FP (incorrectly identified non-lesion areas). To address this issue, the Tversky index is incorporated into the Dice loss function to create the Tversky loss function. The Tversky index is a variant of the Dice coefficient that allows for the adjustment of the relative importance of
FP and
FN. Specifically, the Tversky loss function assigns a higher weight to
FN compared to
FP, acknowledging the importance of correctly identifying and capturing the small lesions prevalent in DR images. By prioritizing the reduction in
FN, the Tversky loss function helps mitigate the risk of overlooking critical lesions, leading to more reliable and clinically meaningful segmentation outcomes. The weights of
FP and
FN are coordinated using
α and
β, as shown below:
where,
α set to 0.1 and
β set to 0.9, this parameter configuration increases the network’s sensitivity to lesions in imbalanced datasets.
The binary cross-entropy loss function utilizes the binary cross-entropy formula to compare the predicted probabilities with the ground truth values. It utilizes the binary cross-entropy formula to quantitatively measure the dissimilarity between the predicted probabilities and the corresponding ground truth values. This loss function serves as a key optimization objective in training models to accurately segment the lesion parts from fundus images. It can be expressed as follows:
where
y is the ground truth value;
p is the predicted probability.
Finally, the total loss function
is expressed as follows:
where
λ is the balance coefficient of the loss function, which is used to balance the influence of the two loss functions on the network’s training optimization direction and is generally set to 0.5. In addition, considering that different lesions have different segmentation difficulties, inspired by RTNet [
9], this paper assigns weights of [1, 1, 5, 10] to HEs, EXs, SEs, and MAs to ensure the overall segmentation accuracy. Moreover, the determination of weights was guided by comprehensive experimentation. This work conducted extensive experiments to identify optimal weight assignments that would enhance the overall segmentation accuracy.
4. Experiments and Results
4.1. Datasets
DDR [
27]: This dataset consists of 13,673 color retinal fundus images with varying sizes ranging from 1088 × 1920 to 3456 × 5184. Among these images, 757 are pixel-level annotated with EXs, HEs, MAs, and SEs. Specifically, there are 486 images annotated with EXs, 570 images with MAs, 239 images with SEs, and 601 images with HEs. In this paper, based on the original partition provided by the DDR dataset, 383 images are used for training, 149 images for validation, and the remaining 225 images for testing. This dataset is employed for the training and validation of MLNet and other state-of-the-art methods for the comparison of segmentation results, ablation experiments, and generalization experiments.
DIARETDB1 [
28]: This dataset consists of 89 color fundus images with a size of 1500 × 1152, and 84 fundus images were marked with lesions, and the other 5 were fundus images without lesions. A single fundus image may contain multiple types of lesions. There are 48 images annotated with EXs, 80 images with MAs, 36 images with SEs, and 54 images with HEs. In this paper, we refer to reference [
11] for a more accurate pixel-level labeling of this dataset and the division of DIARETDB1; 67 images are used for training and the remaining 22 images for testing. This dataset is used to train and test MLNet’s performance on datasets other than DDR datasets.
IDRiD [
29]: This dataset consists of 81 color retinal fundus images with a size of 4288 × 2848. Each image is pixel-level annotated with EXs, HEs, MAs, and SEs. Among these annotations, there are 81 images annotated with EXs, 81 images with MAs, 80 images with SEs, and 40 images with HEs. This dataset is used for evaluating the generalization performance of MLNet in the experiments.
4.2. Data Preprocess
Considering that the contrast between lesion areas and normal tissues in retinal fundus images is often imperceptible, it is difficult to distinguish between them with the naked eye and automated DR diagnosis based on deep learning [
30]. Therefore, many methods [
31,
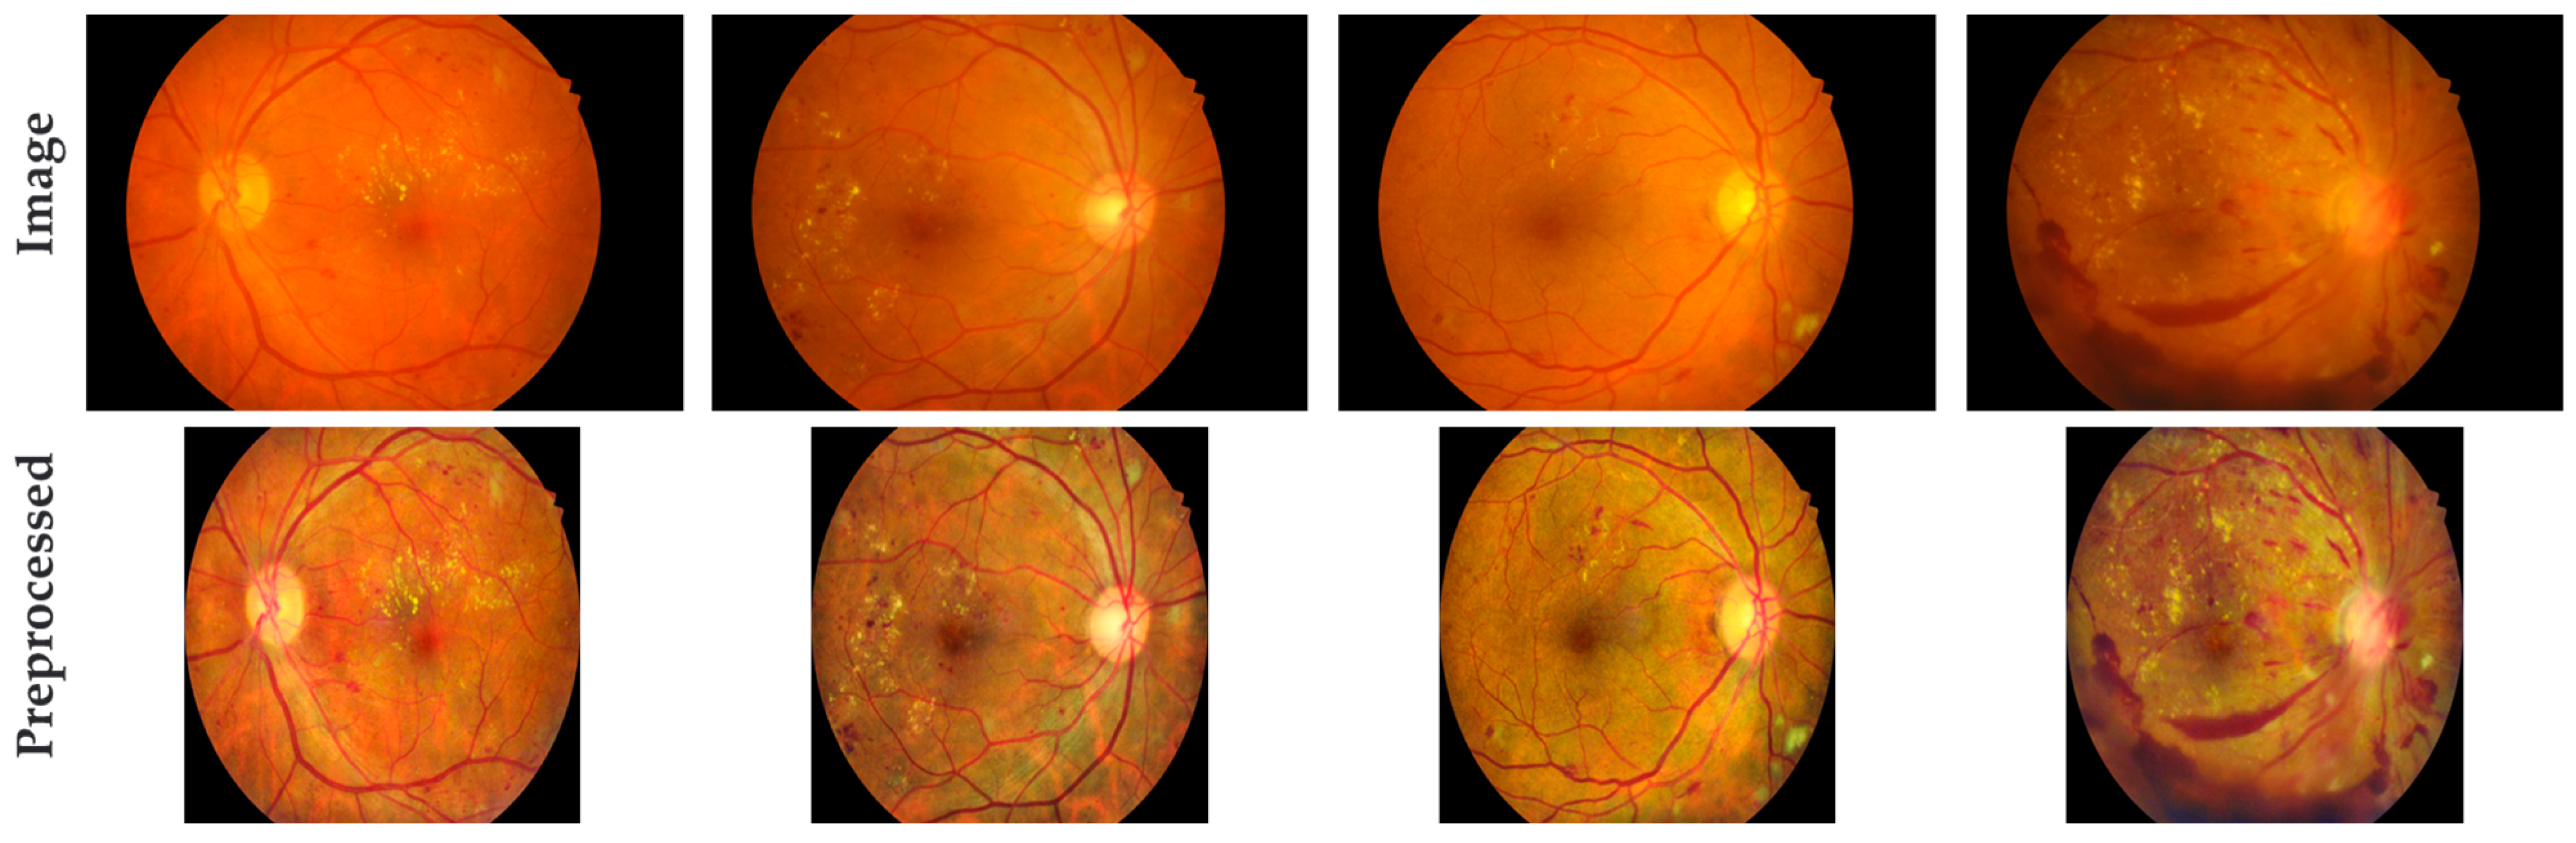
32] employ various techniques to highlight the lesion areas in the images before performing DR diagnosis, assisting the network to better process the images. Following the above-mentioned methods, this paper applies the following preprocessing steps to the DDR dataset, DIARETDB1 dataset, and IDRiD dataset: First, the black borders are cropped to reduce computation time and suppress irrelevant noise information. Then, the images are uniformly resized to 512 × 512 dimensions. Contrast Limited Adaptive Histogram Equalization (CLAHE) [
33] is applied to enhance the images, with the processing parameters set as ClipLimit = 2 and GridSize = 8. Finally, the image pixel values are normalized from 0~255 to 0~1 for subsequent network processing.
Figure 4 illustrates the comparison between the original retinal fundus images and the preprocessed images. It can be observed that after preprocessing, the irrelevant information at the edge of the images is cut, the retinal blood vessels become clearer, and the lesion areas become more prominent. This enhancement aids MLNet in the subsequent training, testing, and validation of the datasets.
4.3. Experimental Setting
MLNet is implemented using the PyTorch backend and executed on two NVIDIA GeForce RTX 4070Ti GPUs with a memory capacity of 12 GB each. During the training process, the batch size is set to 8, the initial learning rate is set to 1 × 10
−4, and the learning rate scheduler is a power of 0.9 of the polynomial. The network is trained using the Adam optimizer [
34], and a total of 500 epochs are conducted. The weight decay rate is set to 2 × 10
−2.
4.4. Evaluation Metrics
In this paper, the segmentation performance is evaluated using Area Under the Precision–Recall Curve (AUPR), Dice coefficient (Dice), and Intersection over Union (IoU) [
35,
36]. Higher scores in these three metrics indicate the better segmentation capability of the proposed method.
The AUPR reflects the ability of a method to enrich true positive samples, which is the area accuracy under the precision–recall curve, and mAUPR is the average of the AUPR values for all lesion types.
The Dice coefficient is a similarity metric that measures the overlap between the segmented region and the actual lesion area. The mDice is the average of the Dice coefficients for all lesion types. The Dice coefficient is calculated using the following formula:
IoU represents the ratio of the intersection to the union between the segmented region and the actual lesion area. The mIoU is the average IoU value obtained for all types of lesions. Specifically, the IoU is calculated using the following formula:
In Equations (9) and (10), the following definitions are used: TP (true positives) represents the number of pixels correctly segmented as lesion pixels. TN (true negatives) represents the number of pixels correctly segmented as background pixels. FP represents the number of pixels incorrectly segmented as background pixels, while they are actually lesion pixels. FN represents the number of pixels incorrectly segmented as lesion pixels, while they are actually background pixels.
4.5. Experimental Results and Analysis
4.5.1. Comparison of Evaluation Metrics’ Results on DDR Dataset
In this paper, MLNet is compared with seven state-of-the-art DR lesion segmentation methods, including M2MRF [
22], L-Seg [
37], RTNet [
9], HEDNet [
38], Swin Transformer [
39], VTA [
20], and Guo et al. [
11].
Table 1 presents the evaluation metrics and mean evaluation metrics’ results of MLNet and the seven advanced methods on the DDR dataset.
According to
Table 1, MLNet outperforms other advanced methods in all average evaluation metrics, showcasing its superior segmentation performance. The improvements achieved by MLNet compared to the second-best results are notable, with an enhancement of 1.87% in mAUPR, 4.28% in mDice, and 6.92% in mIoU. These results highlight MLNet’s ability to capture fine-grained lesion details and generate precise segmentations.
Furthermore, according to
Table 1, a comparison with M2MRF reveals substantial improvements achieved by MLNet in the MA segmentation results. Specifically, MLNet shows improvements of 6.07%, 3.44%, and 13.66% in AUPR, Dice, and IoU, respectively, emphasizing its effectiveness in accurately segmenting MA lesions. Similarly, for the EX segmentation results, MLNet demonstrates improvements of 2.99%, 2.06%, and 8.43% in AUPR, Dice, and IoU, respectively, further consolidating its superior performance in capturing and delineating EX lesions. However, for the SE segmentation results, MLNet’s AUPR is lower than M2MRF by 4.78%, but Dice and IoU show improvements of 1.69% and 0.97%, respectively. This observation could be attributed to MLNet’s loss function, which considers all four lesion types simultaneously. While this may lead to a potential decrease in the segmentation capability for a specific lesion type, the overall evaluation metrics remain excellent, indicating MLNet’s robust performance in segmenting DR lesions. Compared to Swin Transformer, which has the second-best evaluation metrics for the HE segmentation results, MLNet achieves improvements of 3%, 4.7%, and 0.09% in AUPR, Dice, and IoU, respectively. These advancements underscore MLNet’s effectiveness in accurately segmenting HE lesions, further solidifying its superiority over other methods. Overall, MLNet achieves the best average evaluation metrics and significant improvements compared to the second-best results. It also achieves the best results in Dice and IoU in non-average evaluation metrics and mostly achieves the highest scores in AUPR. These experimental results demonstrate that MLNet exhibits superior segmentation performance compared to the other seven advanced methods. The consistent superiority of MLNet across various evaluation metrics and lesion types confirms its effectiveness in accurately segmenting DR lesions.
4.5.2. Comparison of Visual Segmentation Results on DIARETDB1 Dataset
In this paper, the DIARETDB1 dataset is utilized for a complementary validation of the performance of MLNet and compared with U-Net [
15], Swin-UNet [
40], and Guo et al. [
11]; the data results of these algorithms are from the relevant paper. The results are shown in
Table 2.
According to
Table 2, MLNet achieved the highest scores on the DIARETDB1 dataset for both MA and SE types of lesions, achieving an AUPR of 53.01% and 65.19%, respectively, and improved by 6.42% and 1.76% relative to the suboptimal results. However, for the segmentation results of HE and EX types of lesions, the results obtained by MLNet were 73.81% and 76.66%, which were inferior to the 76.30% and 81.15% obtained by the algorithm proposed by reference [
11]. Nevertheless, it is still more advantageous than the results of U-Net and Swin-UNet. In addition, for the average results, the proposed algorithm can achieve a significant improvement compared with U-Net and Swin-UNet, which are 6.95% and 9.28%, respectively, and a slight improvement of 0.25% compared with the algorithm in reference [
11]. In addition to the analysis of AUPR values on the DIARETDB1 dataset, we also compare Dice indicators. As can be seen from
Table 2, for the segmentation results of lesions of HE and EX types, the method proposed in this paper is inferior to that proposed by Guo et al. [
11]. In addition, for mDice, we have a decrease of 2.59% compared with method in reference [
11]. However, compared with the compared algorithms, MLNet can still obtain suboptimal results on HE- and EX-type lesions and mDice. Regarding the performance metrics of MA and SE types of lesions, the proposed algorithm achieved the highest scores of 51.72% and 64.48%, respectively. While MLNet did not obtain the highest Dice scores for certain lesion types, it still demonstrated relatively excellent results for other lesion types. Moreover, MLNet exhibited a commendable overall performance score when considering the average results. It is worth noting that these results highlight the algorithm’s competence in lesion segmentation.
In general, the results of MLNet on the DIARETDB1 dataset complementarily verify that MLNet has good segmentation performance for fundus images.
4.5.3. Comparison of Visual Segmentation Results
To visually illustrate the effectiveness of MLNet in DR lesion segmentation, this paper selects five representative DR images and corresponding ground truth and presents the visual results of five different DR lesion segmentation methods, including MLNet, as shown in
Figure 5.
According to
Figure 5, a visual analysis of the segmentation results provides further insights. In the first row, for the case with a single type of lesion cluster, MLNet, Swin-T, and VTA accurately capture the lesion areas, but MLNet can segment EX-type subtle lesions more precisely. In the second row, for the case with irregular distributions of lesions in multiple sizes and types, MLNet can segment all sizes of lesions and accurately identify the lesion types compared to other methods. This capability sets MLNet apart from other methods in accurately representing the diverse characteristics of lesions. In the third row, for the case of lesion clusters with a rectangular-like shape and scattered lesions, all methods except HEDNet can capture the rough shape of the lesion cluster. However, MLNet achieves a more refined segmentation result, accurately delineates the EX-type lesion, and better captures other subtle lesions. In the fourth row, for the case with concentrated lesions of multiple sizes and types, MLNet outperforms other methods in accurately capturing lesions of all sizes and types. This highlights MLNet’s robustness in handling complex lesion distributions and accurately delineating the diverse range of lesions. In the fifth row, for the case with sporadically distributed single-type lesions, only MLNet correctly segments MA-type lesions without any segmentation errors. This further demonstrates MLNet’s ability to accurately capture specific lesion types even in challenging scenarios.
In conclusion, based on the visual comparison of the segmentation results, MLNet demonstrates superior segmentation performance for various distributions of lesions, particularly for subtle lesions. This is attributed to the effective combination of the MSAB, the LPB, and the unique loss function designed in this paper. These components enable MLNet to capture the multi-scale lesion characteristics in retinal fundus images and exhibit a deep perception of subtle lesions, thereby enhancing its segmentation capability.
4.5.4. Generalization Experiment
MLNet was trained using DDR’s training and validation dataset and tested on IDRiD’s testing dataset to evaluate its generalization ability, and the results are shown in
Table 3.
According to
Table 3, MLNet achieves the highest score in the mAUPR. Specifically, MLNet achieves an mAUPR of 59.44%, which is 1.11%, 19.56%, 17.39%, and 22.87% higher than M2MRF, L-Seg, RTNet, and HEDNet, respectively. However, MLNet’s performance in EX segmentation is slightly inferior to other methods. This discrepancy can be attributed to the training of MLNet using the DDR dataset, where EX-type lesions have a wide distribution and a larger number of pixels, resulting in a relatively lower weight assigned to EX-type lesions in the loss function. On the other hand, the distribution and pixel characteristics of EX-type lesions in the IDRiD dataset are different from those in the DDR dataset, leading to MLNet’s relatively weaker performance in EX segmentation compared to other advanced methods. Nevertheless, it is important to note the improvements achieved by MLNet in other lesion types. In detail, MLNet demonstrates improvements of 5.47%, 5.88%, and 0.94% in the AUPR for MA, SE, and HE segmentation results, respectively, compared to the second-best method, M2MRF. These results indicate that MLNet exhibits good generalization ability for DR lesion segmentation, showcasing its effectiveness across various lesion types.
In summary, MLNet’s impressive performance in the mAUPR highlights its superiority in overall DR lesion segmentation. While it may exhibit slightly weaker performance in EX segmentation due to dataset-specific characteristics, MLNet showcases its strength in accurately segmenting other lesion types, demonstrating its robust generalization ability for DR lesion segmentation.
4.5.5. Ablation Experimental
In this experiment, the standard VGG16 is used as a baseline, and the effectiveness of different modules is validated by inserting them. MLNet’s AUPR scores on the DDR dataset with different network structure settings are shown in
Table 4.
According to
Table 4, a comparative analysis reveals the performance improvements achieved by different variations of the model. Compared to No.1, No.2 improves the mAUPR from 32.43% to 37.48% and improves the segmentation results of MAs, SEs, HEs, and EXs by 3.52%, 9.43%, 1.26%, and 5.97%, respectively. These results highlight the positive impact of incorporating the additional components on the overall segmentation performance. Additionally, despite both incorporating the MSAB, compared to No.3, No.4 shows an improvement range of 4.94% to 19.82% in the AUPR, with an 11.93% increase in the mAUPR. When the LPB is added to the baseline (No.3), the mAUPR significantly increases from 32.43% to 39.22%. For the segmentation results of MAs, SEs, HEs, and EXs, the AUPR improves by 4.85%, 11.68%, 1.88%, and 8.72%, respectively. No.4 also exhibits a similar performance improvement trend compared to No.2, further demonstrating the effective combination of the MSAB and the LPB in generating the optimal segmentation results. The inclusion of the novel loss function with a customized lesion weight, as proposed in this paper, is added to No.4. Consequently, these additions contribute to the enhancement of the AUPR metric, resulting in No.5. This demonstrates the effectiveness of the novel loss function in improving the segmentation results.
To investigate the impact of different loss functions on the algorithm’s performance and demonstrate the effectiveness of the proposed loss function, we performed additional ablation experiments by varying the settings of the loss functions. Based on No.4, the loss function is replaced by different loss functions in
Section 3.4, and the results are compared. The results are shown in
Table 5.
According to
Table 5, replacing the loss function in the No.4 model with other loss functions, similar to No.6 utilizing the Tversky loss and No.7 employing BCE loss, did not lead to effective improvements. Although, No.6 exhibited a slight improvement in the mAUPR compared with No.4, and the segmentation results for SE lesion types decreased from 45.41% to 43.91%. Furthermore, No.7 experienced a 6.7% decrease in the mAUPR compared to No.4. In addition, by changing the loss function to a combination of Dice loss and BCE loss (No.8), there was a significant drop in performance. However, if the loss function is set as the proposed method (No.5), both the AUPR and mAUPR showed significant improvements compared with other loss function configurations. In summary, the loss function designed in this paper exhibits better compatibility with MLNet for segment fundus images.
In conclusion, the comparative analysis of different model variations in
Table 4 and different loss function settings in
Table 5 highlights the performance improvements achieved by incorporating additional components and the novel loss function. These enhancements lead to significant improvements in mAUPR and AUPR scores, as well as more accurate segmentation results for specific lesion types. The findings underscore the effectiveness of the proposed components and the novel loss function in enhancing the overall segmentation performance of the algorithm.
5. Conclusions
This paper presents MLNet, a DR lesion segmentation method based on multi-scale attention and lesion perception. MLNet mainly consists of the MSAB and the LPB, which effectively capture multi-scale DR lesion features and deeply perceive subtle lesions in retinal fundus images. Additionally, a novel loss function is designed to alleviate the negative impact of data imbalance, resulting in more accurate segmentation results. MLNet is evaluated on the DDR dataset and compared with seven state-of-the-art methods, achieving mAUPR, mDice, and mIoU scores of 51.81%, 49.85%, and 37.19%, respectively, and achieving 67.16% mAUPR and 61.82% mDice on the DIARETDB1 dataset. These results show the superior performance of MLNet on the DDR dataset and good segmentation results on the DIARETDB1 dataset. MLNet also establishes excellent generalization on the IDRiD dataset, indicating its superior performance on the new dataset. In summary, MLNet improves the accuracy of DR lesion segmentation and has huge potential for future clinical practicality. It can serve as an assistive tool for ophthalmologists to accurately diagnose and treat patients with DR. It can also be used for training primary eye care practitioners to enhance their diagnostic abilities. Furthermore, MLNet can provide valuable insights for other types of lesion segmentation tasks, advancing research and development in the field.
However, this work has certain limitations that can be addressed in future research. For example, this study does not employ any adaptive methods to address the issue of data imbalance in lesion segmentation. This means that researchers need to manually adjust weights and repeat experiments to obtain the optimal network parameters. While this approach allowed for some degree of optimization, it resulted in a longer training time and limited the network’s compatibility with different datasets. To overcome this limitation, future research can focus on exploring adaptive methods specifically designed to handle imbalanced sample distributions in lesion segmentation. By developing techniques that automatically adjust for data imbalance, researchers can streamline the training process and improve the network’s performance on diverse datasets. This would enhance the practicality and applicability of new DR image segmentation methods in real-world scenarios. Additionally, after providing fine-grained DR segmentation results, MLNet can be used to assist with DR classification tasks. By leveraging the segmentation outcomes, MLNet can contribute to more accurate DR diagnosis, aiding in the identification of disease severity and informing appropriate treatment strategies. Combining segmentation results with classification tasks has the potential to enhance overall diagnostic accuracy and improve patient management.
Finally, the presentation of these limitations offers exciting prospects for future research. Proposing adaptive techniques to address data imbalance in lesion segmentation would shorten training time as well as improve the compatibility of deep learning-based methods across various datasets. Furthermore, integrating segmentation results with classification tasks can lead to more accurate and comprehensive DR diagnosis and ultimately improve patient care. These avenues of exploration hold the potential to enhance the practicality of deep learning-based methods in clinical settings and further advance the field.
Author Contributions
Conceptualization, Y.B. and C.S.; methodology, Y.B., C.S., and L.W.; software, Y.B. and C.S.; validation, C.S. and L.W.; formal analysis, C.S. and L.W.; investigation, Y.B. and C.S.; resources, Y.B. and L.W.; data curation, Y.B.; writing—original draft preparation, Y.B. and C.S.; writing—review and editing, C.S. and L.W.; visualization, Y.B. and L.W.; supervision, C.S. and L.W.; project administration, C.S.; funding acquisition, C.S. All authors have read and agreed to the published version of the manuscript.
Funding
This work was funded by the National Natural Science Foundation of China (grant number 72273044).
Data Availability Statement
All data used in this paper are available in public databases. The DDR dataset is available at ref. [
27]. The IDRiD dataset is available at ref. [
29]. The DIARETDB1 dataset is available at ref. [
28]. The new pixel-level annotation of the DIARETDB1 dataset was obtained in ref. [
11]. We did not generate any other datasets in this paper.
Conflicts of Interest
The authors declare no conflicts of interest.
References
- Yau, J.W.; Rogers, S.L.; Kawasaki, R.; Lamoureux, E.L.; Kowalski, J.W.; Bek, T.; Chen, S.J.; Dekker, J.M.; Fletcher, A.; Grauslund, J.; et al. Global prevalence and major risk factors of diabetic retinopathy. Diabetes Care 2012, 35, 556–564. [Google Scholar] [CrossRef] [PubMed]
- Wang, S.; Chen, Y.; Yi, Z. nmODE-Unet: A Novel Network for Semantic Segmentation of Medical Images. Appl. Sci. 2024, 14, 411. [Google Scholar] [CrossRef]
- Wong, T.Y.; Sun, J.; Kawasaki, R.; Ruamviboonsuk, P.; Gupta, N.; Lansingh, V.C.; Maia, M.; Mathenge, W.; Moreker, S.; Muqit, M.M.K.; et al. Guidelines on Diabetic Eye Care: The International Council of Ophthalmology Recommendations for Screening, Follow-up, Referral, and Treatment Based on Resource Settings. Ophthalmology 2018, 125, 1608–1622. [Google Scholar] [CrossRef] [PubMed]
- Bhati, A.; Gour, N.; Khanna, P.; Ojha, A.; Werghi, N. An interpretable dual attention network for diabetic retinopathy grading: IDANet. Artif. Intell. Med. 2024, 149, 102782. [Google Scholar] [CrossRef] [PubMed]
- Ilesanmi, A.E.; Ilesanmi, T.; Gbotoso, G.A. A systematic review of retinal fundus image segmentation and classification methods using convolutional neural networks. Healthc. Anal. 2023, 4, 100261. [Google Scholar] [CrossRef]
- Li, T.; Bo, W.; Hu, C.; Kang, H.; Liu, H.; Wang, K.; Fu, H. Applications of deep learning in fundus images: A review. Med. Image Anal. 2021, 69, 101971. [Google Scholar] [CrossRef] [PubMed]
- Zhang, Z.; Sun, G.; Zheng, K.; Yang, J.K.; Zhu, X.R.; Li, Y. TC-Net: A joint learning framework based on CNN and vision transformer for multi-lesion medical images segmentation. Comput. Biol. Med. 2023, 161, 106967. [Google Scholar] [CrossRef] [PubMed]
- Tavakoli, M.; Jazani, S.; Nazar, M. Automated Detection of Microaneurysms in Color Fundus Images using Deep Learning with Different Preprocessing Approaches. arXiv 2020, arXiv:2004.09493. [Google Scholar]
- Huang, S.; Li, J.; Xiao, Y.; Shen, N.; Xu, T. RTNet: Relation Transformer Network for Diabetic Retinopathy Multi-Lesion Segmentation. IEEE Trans. Med. Imaging 2022, 41, 1596–1607. [Google Scholar] [CrossRef] [PubMed]
- Zhou, Y.; He, X.; Huang, L.; Liu, L.; Zhu, F.; Cui, S.; Shao, L. Collaborative learning of semi-supervised segmentation and classification for medical images. In Proceedings of the 2020 IEEE/CVF Conference on Computer Vision and Pattern Recognition (CVPR), Seattle, WA, USA, 14–19 June 2020; pp. 2079–2088. [Google Scholar]
- Guo, T.; Yang, J.; Yu, Q. Diabetic retinopathy lesion segmentation using deep multi-scale framework. Biomed. Signal Process. Control 2024, 88, 105050. [Google Scholar] [CrossRef]
- Simonyan, K.; Zisserman, A. Very Deep Convolutional Networks for Large-Scale Image Recognition. arXiv 2014, arXiv:1409.1556. [Google Scholar]
- Zhang, H.; Lian, J.; Yi, Z.; Wu, R.; Lu, X.; Ma, P.; Ma, Y. HAU-Net: Hybrid CNN-transformer for breast ultrasound image segmentation. Biomed. Signal Process. Control 2024, 87, 105427. [Google Scholar] [CrossRef]
- Shelhamer, E.; Long, J.; Darrell, T. Fully Convolutional Networks for Semantic Segmentation. IEEE Trans. Pattern Anal. 2017, 39, 640–651. [Google Scholar] [CrossRef] [PubMed]
- Ronneberger, O.; Fischer, P.; Brox, T. U-Net: Convolutional Networks for Biomedical Image Segmentation. arXiv 2015, arXiv:1505.04597. [Google Scholar]
- Badrinarayanan, V.; Kendall, A.; Cipolla, R. SegNet: A Deep Convolutional Encoder-Decoder Architecture for Image Segmentation. IEEE Trans. Pattern Anal. 2017, 39, 2481–2495. [Google Scholar] [CrossRef] [PubMed]
- Petit, O.; Thome, N.; Rambour, C.; Themyr, L.; Collins, T.; Soler, L. U-Net Transformer: Self and Cross Attention for Medical Image Segmentation. In Proceedings of the Machine Learning in Medical Imaging: 12th International Workshop, MLMI 2021, Held in Conjunction with MICCAI 2021, Strasbourg, France, 27 September 2021; Springer: Berlin/Heidelberg, Germany, 2021; pp. 267–276. [Google Scholar]
- He, A.; Wang, K.; Li, T.; Du, C.; Xia, S.; Fu, H. H2Former: An Efficient Hierarchical Hybrid Transformer for Medical Image Segmentation. IEEE Trans. Med. Imaging 2023, 42, 2763–2775. [Google Scholar] [CrossRef] [PubMed]
- He, A.; Wang, K.; Li, T.; Bo, W.; Kang, H.; Fu, H. Progressive Multiscale Consistent Network for Multiclass Fundus Lesion Segmentation. IEEE Trans. Med. Imaging 2022, 41, 3146–3157. [Google Scholar] [CrossRef] [PubMed]
- Wang, Z.; Lu, H.; Yan, H.; Kan, H.; Jin, L. Vison transformer adapter-based hyperbolic embeddings for multi-lesion segmentation in diabetic retinopathy. Sci. Rep. 2023, 13, 11178. [Google Scholar] [CrossRef] [PubMed]
- Ullah, Z.; Usman, M.; Latif, S.; Khan, A.; Gwak, J. SSMD-UNet: Semi-supervised multi-task decoders network for diabetic retinopathy segmentation. Sci. Rep. 2023, 13, 9087. [Google Scholar] [CrossRef] [PubMed]
- Liu, Q.; Liu, H.; Ke, W.; Liang, Y. Automated lesion segmentation in fundus images with many-to-many reassembly of features. Pattern Recogn. 2023, 136, 109191. [Google Scholar] [CrossRef]
- He, J.; Zhang, M.; Li, W.; Peng, Y.; Fu, B.; Liu, C.; Wang, J.; Wang, R. SaB-Net: Self-attention backward network for gastric tumor segmentation in CT images. Comput. Biol. Med. 2024, 169, 107866. [Google Scholar] [CrossRef] [PubMed]
- Salehi, S.S.M.; Erdogmus, D.; Gholipour, A. Tversky Loss Function for Image Segmentation Using 3D Fully Convolutional Deep Networks. In Machine Learning in Medical Imaging; Springer International Publishing: Cham, Switzerland, 2017; pp. 379–387. [Google Scholar]
- Jiang, H.; Imran, M.; Muralidharan, P.; Patel, A.; Pensa, J.; Liang, M.; Benidir, T.; Grajo, J.R.; Joseph, J.P.; Terry, R.; et al. MicroSegNet: A deep learning approach for prostate segmentation on micro-ultrasound images. Comput. Med. Imaging Graph. 2024, 112, 102326. [Google Scholar] [CrossRef] [PubMed]
- Milletari, F.; Navab, N.; Ahmadi, S.A. V-Net: Fully Convolutional Neural Networks for Volumetric Medical Image Segmentation. In Proceedings of the 2016 Fourth International Conference on 3D Vision (3DV), Stanford, CA, USA, 25–28 October 2016; pp. 565–571. [Google Scholar]
- Li, T.; Gao, Y.; Wang, K.; Guo, S.; Liu, H.; Kang, H. Diagnostic assessment of deep learning algorithms for diabetic retinopathy screening. Inform. Sci. 2019, 501, 511–522. [Google Scholar] [CrossRef]
- Kauppi, T.; Kalesnykiene, V.; Kämäräinen, J.; Lensu, L.; Sorri, I.; Raninen, A.; Voutilainen, R.; Uusitalo, H.; Kälviäinen, H.; Pietilä, J. The DIARETDB1 Diabetic Retinopathy Database and Evaluation Protocol. In Proceedings of the British Machine Vision Conference, Warwick, UK, 10–13 September 2007. [Google Scholar]
- Porwal, P.; Pachade, S.; Kokare, M.; Deshmukh, G.; Son, J.; Bae, W.; Liu, L.; Wang, J.; Liu, X.; Gao, L.; et al. IDRiD: Diabetic Retinopathy—Segmentation and Grading Challenge. Med. Image Anal. 2020, 59, 101561. [Google Scholar] [CrossRef] [PubMed]
- Sebastian, A.; Elharrouss, O.; Al-Maadeed, S.; Almaadeed, N. A Survey on Diabetic Retinopathy Lesion Detection and Segmentation. Appl. Sci. 2023, 13, 5111. [Google Scholar] [CrossRef]
- Yu, C.; Pei, H. Dynamic Graph Clustering Learning for Unsupervised Diabetic Retinopathy Classification. Diagnostics 2023, 13, 3251. [Google Scholar] [CrossRef] [PubMed]
- Qin, Q.; Chen, Y. A review of retinal vessel segmentation for fundus image analysis. Eng. Appl. Artif. Intell. 2024, 128, 107454. [Google Scholar] [CrossRef]
- Pisano, E.D.; Zong, S.; Hemminger, B.M.; DeLuca, M.; Johnston, R.E.; Muller, K.; Braeuning, M.P.; Pizer, S.M. Contrast Limited Adaptive Histogram Equalization image processing to improve the detection of simulated spiculations in dense mammograms. J. Digit. Imaging 1998, 11, 193. [Google Scholar] [CrossRef] [PubMed]
- Xie, X.; Zhou, P.; Li, H.; Lin, Z.; Yan, S. Adan: Adaptive Nesterov Momentum Algorithm for Faster Optimizing Deep Models. arXiv 2022, arXiv:2208.06677. [Google Scholar]
- Ali, M.Y.S.; Jabreel, M.; Valls, A.; Baget, M.; Abdel-Nasser, M. LezioSeg: Multi-Scale Attention Affine-Based CNN for Segmenting Diabetic Retinopathy Lesions in Images. Electronics 2023, 12, 4940. [Google Scholar] [CrossRef]
- Sebastian, A.; Elharrouss, O.; Al-Maadeed, S.; Almaadeed, N. GAN-Based Approach for Diabetic Retinopathy Retinal Vasculature Segmentation. Bioengineering 2024, 1, 4. [Google Scholar] [CrossRef] [PubMed]
- Guo, S.; Li, T.; Kang, H.; Li, N.; Zhang, Y.; Wang, K. L-Seg: An end-to-end unified framework for multi-lesion segmentation of fundus images. Neurocomputing 2019, 349, 52–63. [Google Scholar] [CrossRef]
- Xie, S.; Tu, Z. Holistically-Nested Edge Detection. Int. J. Comput. Vis. 2017, 125, 3–18. [Google Scholar] [CrossRef]
- Liu, Z.; Lin, Y.; Cao, Y.; Hu, H.; Wei, Y.; Zhang, Z.; Lin, S.; Guo, B. Swin Transformer: Hierarchical Vision Transformer using Shifted Windows. In Proceedings of the 2021 IEEE/CVF International Conference on Computer Vision (ICCV), Montreal, QC, Canada, 10–17 October 2021; pp. 9992–10002. [Google Scholar]
- Cao, H.; Wang, Y.; Chen, J.; Jiang, D.; Zhang, X.; Tian, Q.; Wang, M. Swin-Unet: Unet-Like Pure Transformer for Medical Image Segmentation. In Proceedings of the Computer Vision—ECCV 2022 Workshops, Tel Aviv, Israel, 23–27 October 2022; pp. 205–218. [Google Scholar]
| Disclaimer/Publisher’s Note: The statements, opinions and data contained in all publications are solely those of the individual author(s) and contributor(s) and not of MDPI and/or the editor(s). MDPI and/or the editor(s) disclaim responsibility for any injury to people or property resulting from any ideas, methods, instructions or products referred to in the content. |
© 2024 by the authors. Licensee MDPI, Basel, Switzerland. This article is an open access article distributed under the terms and conditions of the Creative Commons Attribution (CC BY) license (https://creativecommons.org/licenses/by/4.0/).


