Article

Insights into Distribution of Soil Available Heavy Metals in Karst Area and Its Influencing Factors in Guilin, Southwest China

1
Key Laboratory of Karst Dynamics, Ministry of Natural Resourses (MNR) and Guangxi, Institute of Karst Geology (CAGS), Guilin 541004, China
2
International Research Center on Karst, Under the Auspices of United Nations Educatinal, Scientific and Cultural Organization (UNESCO), Guilin 541004, China
3
Faculty of Science and Engineering, Guilin University of Technology, Guilin 541004, China
4
College of Chemical Engineering, Huaqiao University, Xiamen 361021, China
*
Author to whom correspondence should be addressed.
Forests 2021, 12(5), 609; https://doi.org/10.3390/f12050609
Submission received: 28 February 2021 / Revised: 6 May 2021 / Accepted: 8 May 2021 / Published: 12 May 2021

Abstract

:
The bioavailable contents of heavy metals in karstic soils are a subject of increasing concern since the uptake of heavy metals by plants can pose a severe threat to food safety and public health. However, the bioavailable contents of heavy metals and their effective factors are poorly understood in karst regions. Calcareous soil and red soil developed from carbonate and clastic rocks, respectively, were chosen from a typical karst region (Guilin) of southwestern China, and the total (CT) and available (CA) contents of 11 heavy metals, as well as their influencing factors in soil profiles, were investigated. The results showed that calcareous soil has greater soil organic carbon, total nitrogen, available nitrogen, available potassium, and calcium (Ca) contents than red soil, but lower available phosphorus and C:N. Acid-soluble Ca (Aca) was the dominant fraction in both types of soil. Heavy metals were highly accumulated in calcareous soil, mainly controlled by secondary enrichment in the processing of carbonate rock weathering. For the majority of metals, calcareous soil had higher CT and lower CA than red soil. According to a redundancy analysis (RDA) and Pearson correlation coefficient, the high pH and Ca content in calcareous soils were primary factors influencing both the CT and CA of the metals, especially residual Ca to CT and Aca to CA. Additionally, higher soil cation exchange capacity and clay minerals also probably improved the immobility of heavy metals.

1. Introduction

The global area of exposed carbonate rocks accounts for about 12% of the land area, and these rocks are mainly distributed in tropical and subtropical regions [1,2,3]. China, known for stereotypical karst landforms, is covered by 3,463,000 km2 of karst, accounting for about one-third of the land area [4]. It is mainly distributed in the Guangxi, Guizhou, Yunnan, Sichuan, Hubei, Hunan, Chongqing, and Guangdong provinces of southwestern China [5]. Recently, the karstic soil developed on karst landscapes has received increasing attention due to its potential contribution to the behaviors of trace metals, such as the formation mechanism of its high geochemical background and the effect of the bioavailability of elements on rice grown in soils [6,7,8].
The karst region in southwestern China has reported the highest average concentration values for heavy metals among soils nationwide, such as those found in the Guangxi (cadmium, Cd), Guizhou (zinc and nickel, Zn and Ni), and Yunnan (copper, Cu) provinces [8,9]. The concentration of metal elements in karstic soil is generally high with most studies concluding that the enrichment in soils was related to the parent rocks’dissolution and secondary enrichment [6,7,10,11,12,13].
The uptake of heavy metals by plants poses a severe threat to food safety and public health. However, not all heavy metals present in the soil will be absorbed by plants. The term bioavailability is defined as the part of the total concentration of a chemical that is available to receptor cells (plants, microorganisms, etc.) [7]. The bioavailable content is the main concern regarding the chemical’s absorption and accumulation in plants rather than its total concentration in the soil [8]. For example, geogenic Cd and plumbum (Pb) in karstic soil were mostly found in the residual fractions while the concentration in the water-soluble fraction, as the most mobile fraction, was very low (mean at 1.4% for Cd and 0.4% for Pb) [7]. Yang et al. [14] investigated the distribution of six trace metals in the soil-plant system in Guangxi and reported that the total content (CT) of heavy metals was significantly higher in the calcareous soils derived from the carbonate area than that in the red soils derived from the clastic area whereas the available content (CA) of these metals was greatly lower in the calcareous soils. The factors controlling bioavailability invegetable crops in typical karst regions of Guangxi have previously been studied and it has been suggested that calcium (Ca) content and pH were the critical influencing factors [6,7,14,15].
The CT of soil Cd in karst areas is abnormally high and can reach four times higher than the risk screening values (RSV) of 0.6 mg kg−1 [7,16] for agricultural soil contamination. The exceedance rate of Cd in rice grains cultivated in the karstic soils according to the national food quality standard (FQS) varied from 0–25% [7,17]. Previous studies only included only a few elements and do not totally address the dangers of heavy metals in karst areas. Importantly, do all heavy metals follow this previous rule found in karst areas? Can other environmental factors affect the availability of elements besides pH and Ca content? Moreover, it has not yet been explored what kind of Ca fraction is the critical controlling factor in the distribution of heavy metals in this region. Accordingly, bioavailable heavy metals are still poorly investigated in karst regions. To address these questions, we elaborately selected a typical area (covering 8 km2) with two adjacent soils of monolithology (carbonate vs. clastic) in Guilin, Guangxi, southwestern China, which formed calcareous soil and red soil, respectively. The study aimed to investigate the distribution of heavy metals in soil in the karst area and to determine its influencing variables. The results could be helpful for managing land safety in karst areas.

2. Materials and Methods

2.1. Study Site

The study area was located in Maocun village (110°30′00′′–110°33′45′′ E, 25°10′11′′–25°12′30′′ N), Guilin, southwestern China, with a typical karst peak cluster depression and valley landscape that is constituted by peaks with a common stony basement and closed depressions among the peaks [5].The typical climate of the area is mid-subtropical humid monsoon weather with a hot and humid summer characterized by spatiotemporal variations in rainfall. Its annual average temperature is 19.64–20.39 °C and the annual average rainfall is 1160–1378 mm. The geology of the karst area consists of the Upper Devonian Rongxian Formation (D3r), which is pure limestone, and the Donggangling Formation (D2d2), consisting of dolomite covered by brown calcareous soil, which is classified as Calcaric Cambisol in the World Reference Base (WRB) for Soil Resources [18]. The soil depth is approximately 0.2–1.0 m. The geology of non-karst area is made up of Middle Devonian iron sandstone (D2d1). The soil type is a red soil known as Ferric Acrisol in the WRB [18] with a depth of >1 m [19].

2.2. Sample Collection

We collected soil samples from the main land-use types in the study area (i.e., woodland, shrub, grassland, and orchard) within the karst and clastic regions. In order to avoid interference from external soils and ensure that the soil was derived from the weathering of the underlying bedrock, all the profiles were selected from the hillside and foot of the peak or from the highest depression. The dominant species in the woodland are representative species in this area, such as Cyclobalanopsis glauca in karst areas and Schima superba in non-karst areas. In the orchard area, orange trees (Citrus reticulata Blanco) were widely locally planted and details of the soil profiles are shown in Table S1. For each land-use type, one soil profile was selected and divided into 0–25 cm (layer A), 25–40 cm (layer B1), and 40–70 cm (layer B2) layers for sampling. In each layer, the soil was divided into three equal parts in the vertical direction. From right to left, bottom to top, one sample was collected in each part, and the three samples were mixed into one sample. In total, 24 samples of eight profiles were collected. Plants and stones were removed from the soil and the loose soil hanging on roots was shaken off gently. Soil adhering to the roots was washed off with distilled water and then the soils were air dried, crushed, and passed through a 2 mm plastic sieve. After spreading the remaining part flat, an agate spoon was used to sample more points and grind them through a 0.15 mm sieve for further analysis.

2.3. Chemical Analysis

2.3.1. Soil Heavy Metals and Environmental Indexes

Each soil sample was analyzed for CT and CA of 11 components: Cd, Pb, Cu, Ni, Zn, strontium (Sr), iron (Fe), chromium (Cr), cobalt (Co), molybdenum (Mo), and manganese (Mn). The CT values were determined via inductively coupled plasma-atomic emission spectroscopy (ICP-AES) (IRIS Intrepid II XSP, Thermo Fisher Co., Ltd., Waltham, MA, USA) (1 ppm precision) after being digested using HF-HNO3-HClO4. The CA of Fe, Mn, Cu, and Zn in the calcareous soils were extracted via diethylenetriaminepentaacetic acid (DTPA) at a soil:DTPA ratio of 1:2. For the red soil, 10 g of soil sample was placed into 250 mL plastic bottles to which 50 mL 0.1 mol L−1 HCl was added [14]. Other CA were extracted using1 M MgCl2 [8]. Following horizontal oscillation for 2 h at 25 °C, samples were centrifuged and cleaned with distilled water for ICP-AES testing. Soil pH was measured in an aqueous suspension at a soil:water ratio of 1:2.5 w/v using a pH meter. Soil organic carbon (SOC) was determined via oxidation using the dichromate procedure-volumetric method. Total nitrogen (TN) and available nitrogen (AN) were first treated using Kelvin digestion and alkaline hydrolysis diffusion, respectively, and the ammonia gas produced was absorbed by boric acid and titrated with sulfuric acid. Available phosphorus (AP) in the acidic soil was extracted using an ammonium fluoride–hydrochloric acid solution and the AP in neutral and lime soil was extracted using sodium bicarbonate solution. The obtained phosphorus was determined using a molybdenum antimony colorimetric method. Available potassium (AK) was measured using the acetic ammonium extraction method and ICP-AES testing. The detailed procedures used for extraction of metal elements and the methods of determining TOC, pH, TN, AN, AP, and AK are explored in the literature [20]. Quality assurance and quality control (QA/QC) was assessed for accuracy and precision using blanks, duplicate samples, and standard reference materials. Blank assays with reagent yielded undetected results. The certified reference material (GSS-4) was used to validate the accuracy of the determinations. Replicate analysis of the samples and standards, performed three times, and showed a precision of less than 8.5% (relative deviation). The heavy metal contents of rocks were dated via the literature [21].

2.3.2. Sequential Extraction Procedure for Analysis of Ca Fraction

The sequential extraction procedure was modified from the methods developed by Dahlqvist [22]. This method allowed for the separation and identification of Ca in four major fractions, including F1 acid soluble (Aca, including water-soluble, exchangeable, and carbonates, using 0.11 mol L−1 acetic acid, 20 °C for 16 h), F2 reducible (Rca, Fe/Mn oxides, using 0.1 mol L−1 hydroxylamine hydrochloride and a buffer at pH = 1.5, 20 °C for 16 h), F3 oxidable (Oca, organic matter, using 30% hydrogen peroxide and a buffer at pH = 1.5, 20 °C for 18 h), and F4 residual (ReCa, using HF-HNO3-HClO4, 65 °C for 72 h). The filtered solutions recovered in each step of extraction were measured using ICP-AES. The total Ca content (Tca) is the sum of the four fractions. Three replicate analyses of the samples were performed with a relative deviation less than 5.0%.
Exchangeable Ca can be released under neutral conditions, and carbonate Ca is easily released into active calcium under acidic conditions, so Aca easily migrates into and is absorbed by plants. Rca was stable in the oxidizing environment but migrated moderately and weakly in reducing environments. Oca mainly refers to calcium bound by organic acid polymers, such as humic acid, fulvic acid, protein, fat, resin, etc., and the bound calcium can be released under oxidizing conditions. ReCa basically exists in the crystal lattice of primary or secondary minerals with poor migration and transformation ability and basically cannot be used by plants [22].

2.4. Data Processing

2.4.1. Activation Rate (AR)

The activation rate reflects the soil supply of heavy metals for plants, both present and potential. It is calculated by the equation [14,23]
AR = CA/CT × 100%
where CA is the available content of the heavy metal andCT is the total content of the heavy metal.

2.4.2. Q Index

The Q index is applied to determine the degree of accumulation or loss of elements in the weathering process and is calculated as [6,24]
Qi = Ci-soil/Ci-rock
where Ci-soil and Ci-rock are the concentrations of component i in the soil and rock, respectively.

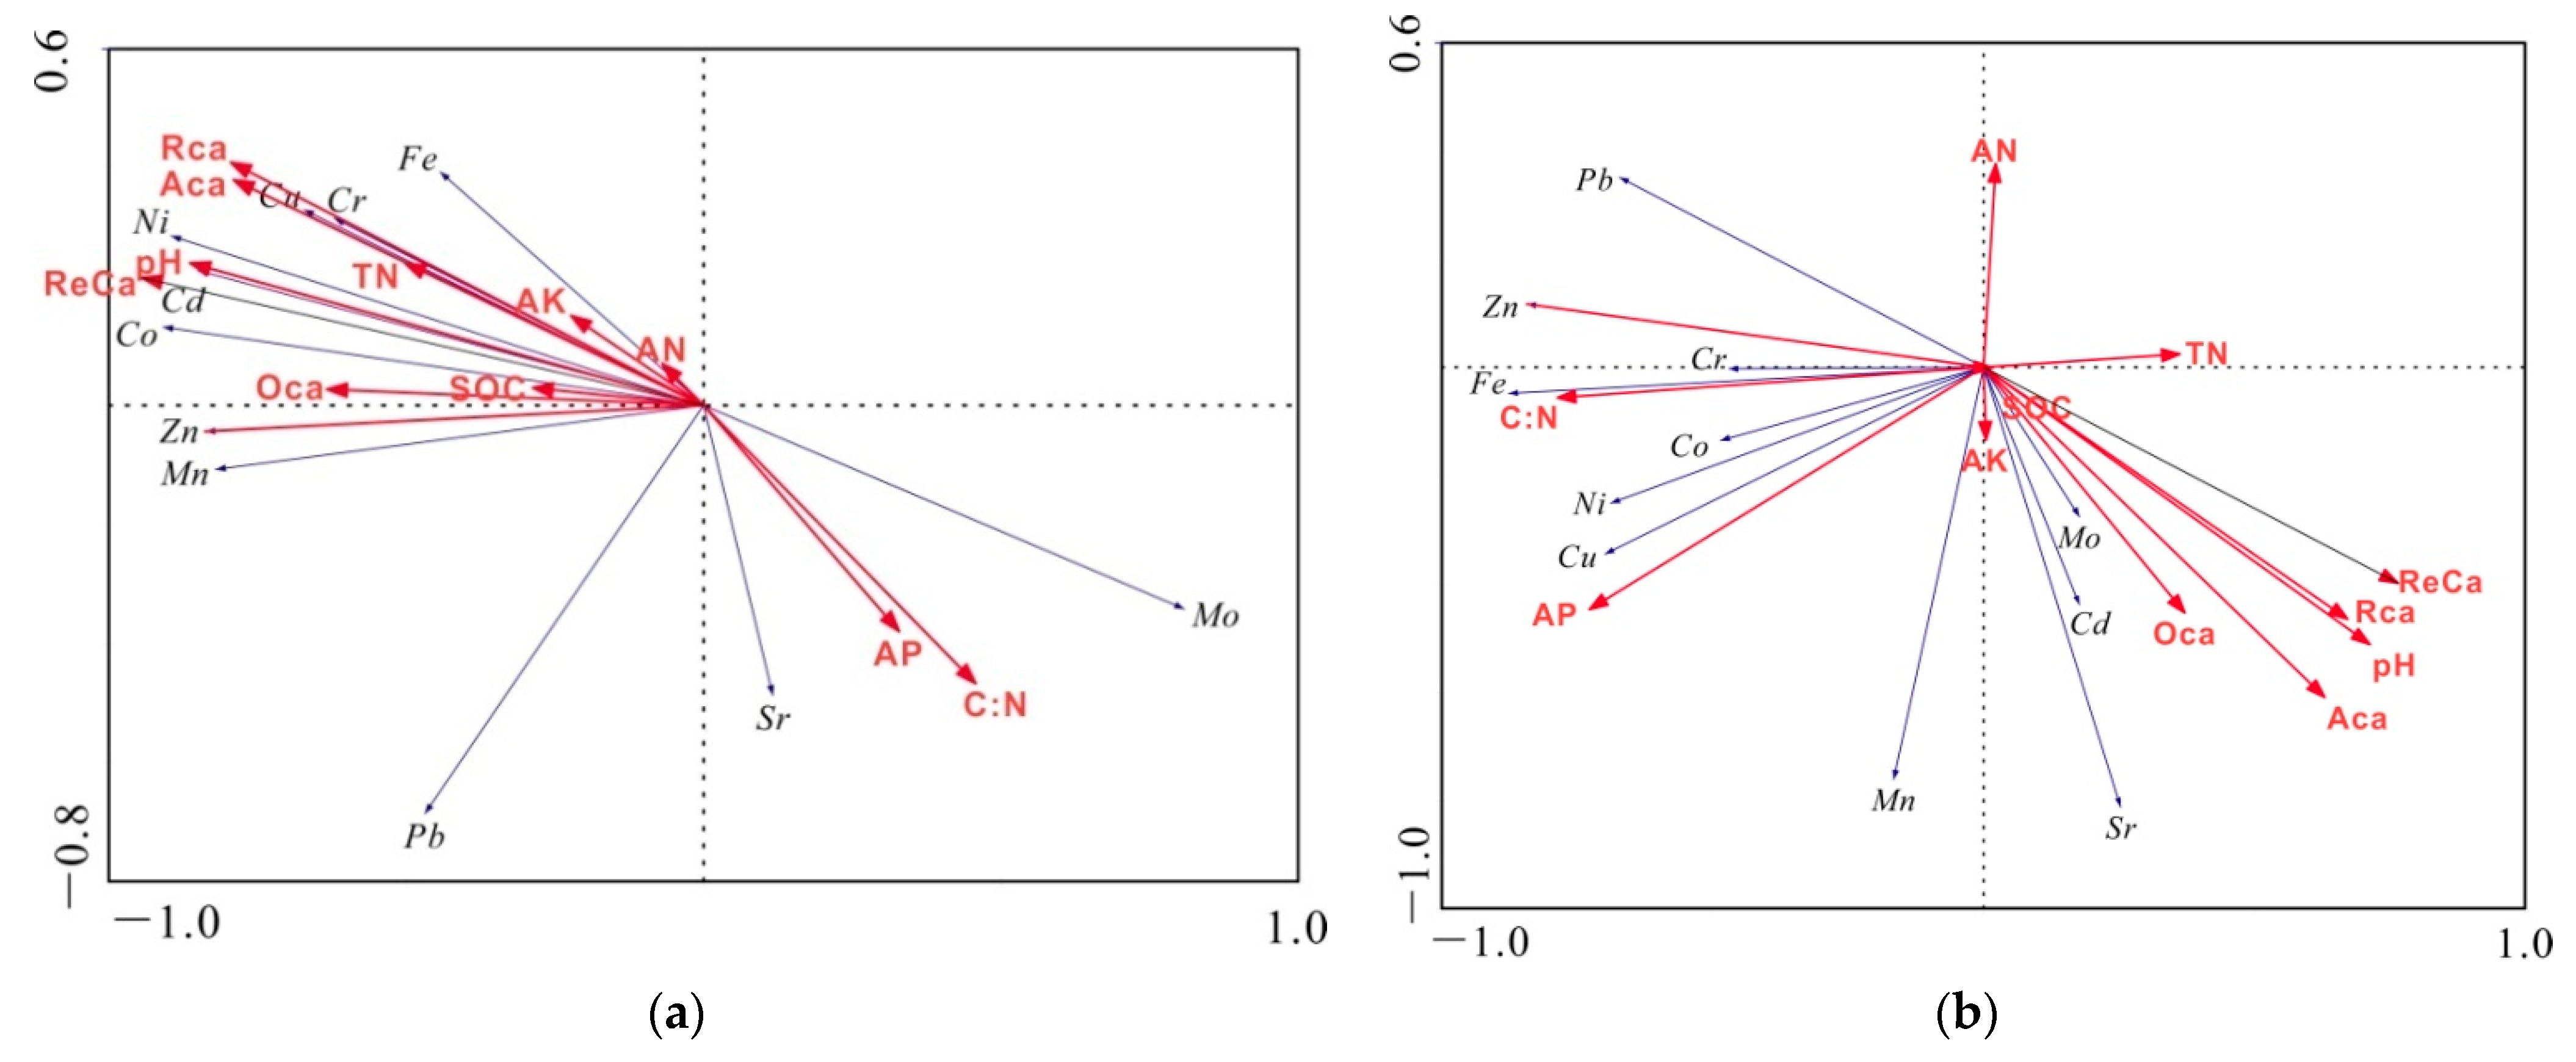
2.4.3. Redundancy Analysis (RDA)

In order to combine as many environmental soil factors (environment) as possible and reveal the relationship between the environmental factors of karst soils and heavy metals (species), we employed RDA analysis [25]. The sorting of species (blue arrow) and the environment (red arrow) are depicted in the same graph, showing the relationship between them. The length of the arrow line represents the degree of correlation between a certain environmental factor and the heavy metals. The longer the connection line, the greater the influence of this environmental factor on the distribution of the research object. The cosine of the angle between species and species, environment and environment, and species and environment is numerically equal to the correlation coefficient of the two variables [25]. The smaller the angle between the arrows, the greater the correlation between the two. In order to eliminate the difference between dimensions, the species (heavy metals) are converted by lg(x + 1), and the environmental factors are converted by lg(x + 1), except for the pH value. Since high Ca is a characteristic value of karst soil, the Ca content and fraction are also included in the environmental data. The RDA was performed using Canoco 4.5 (Microcomputer power, Ithaca, NY, USA). We used one-way analysis of variance (ANOVA) to analyze differences among soil environmental factors and Ca fractions at p = 0.05. Pearson correlation coefficients between element concentrations and environmental factors were calculated with the IBM SPSS statistics 20 software (IBM Crop., Armonk, NY, USA).

3. Results

3.1. Soil Environmental Factors

TOC, TN, AN, AP, AK, and C:N all gradually decreased from the surface to the bottom of the soil (Table 1). The pH gradually becames more acidic in the calcareous soilas depth increased whereas it gradually increasedin the red soil (Table 1). The fertility indexes (TN, AN, AP, AK) were the highest in the surface layer. The pH of calcareous soil was about two units higher than that of red soil. Similarly, the TOC, TN, AN, and AK of the calcareous soil were higher, which is consistent with previous results [14,21]. At the same time, the AP and C:N was lower than in red soil.

3.2. Distribution of Ca Fractions

The Tca, Aca, Rca, and Oca contents decreased from the surface to the bottom of the soil, while ReCa gradually increased (Table 2). The Tca, Aca, and Rca of the calcareous soil were about two orders of magnitude higher than in the red soil, while the differences inOca andReCa wereonly two- to three-foldbetween the two soils (Table 2). The Aca fraction dominated the Ca pool in the two types of soil, followed by Rca, Oca, and ReCa. The high content of Aca and Rca indicates that the Ca activity in calcareous soil is very high, with an active migration and bio-utilization state [22,26].

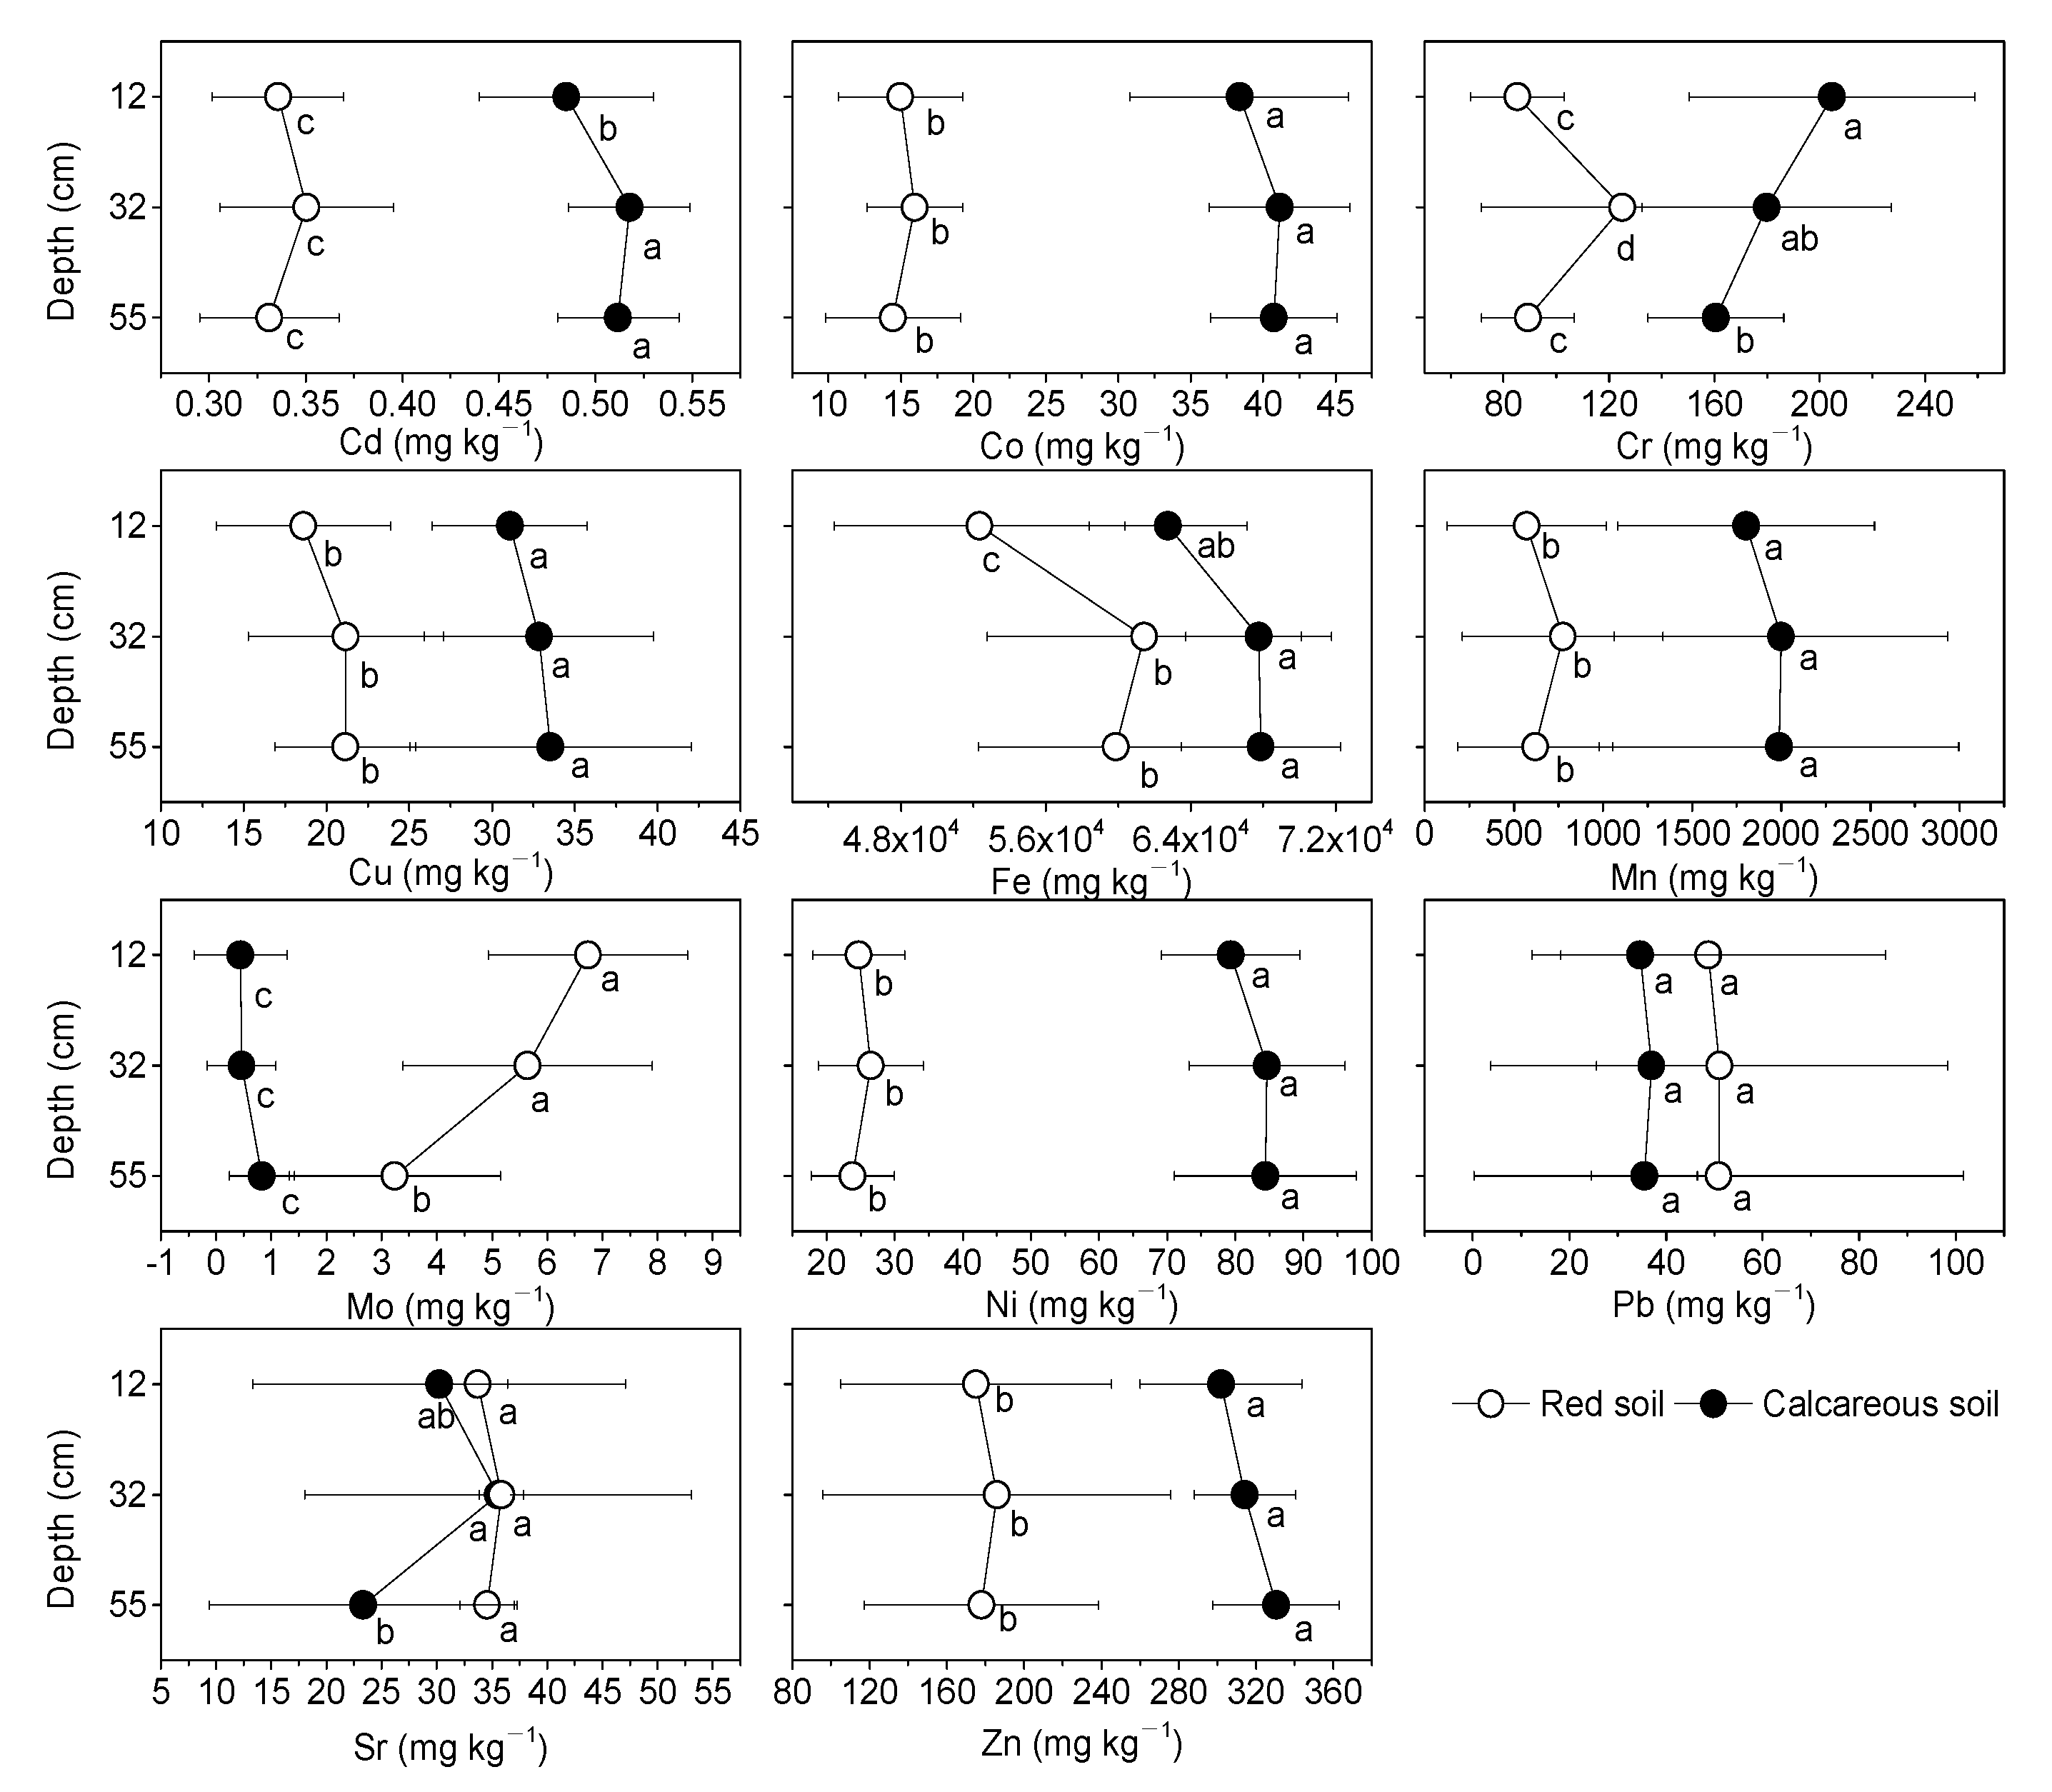
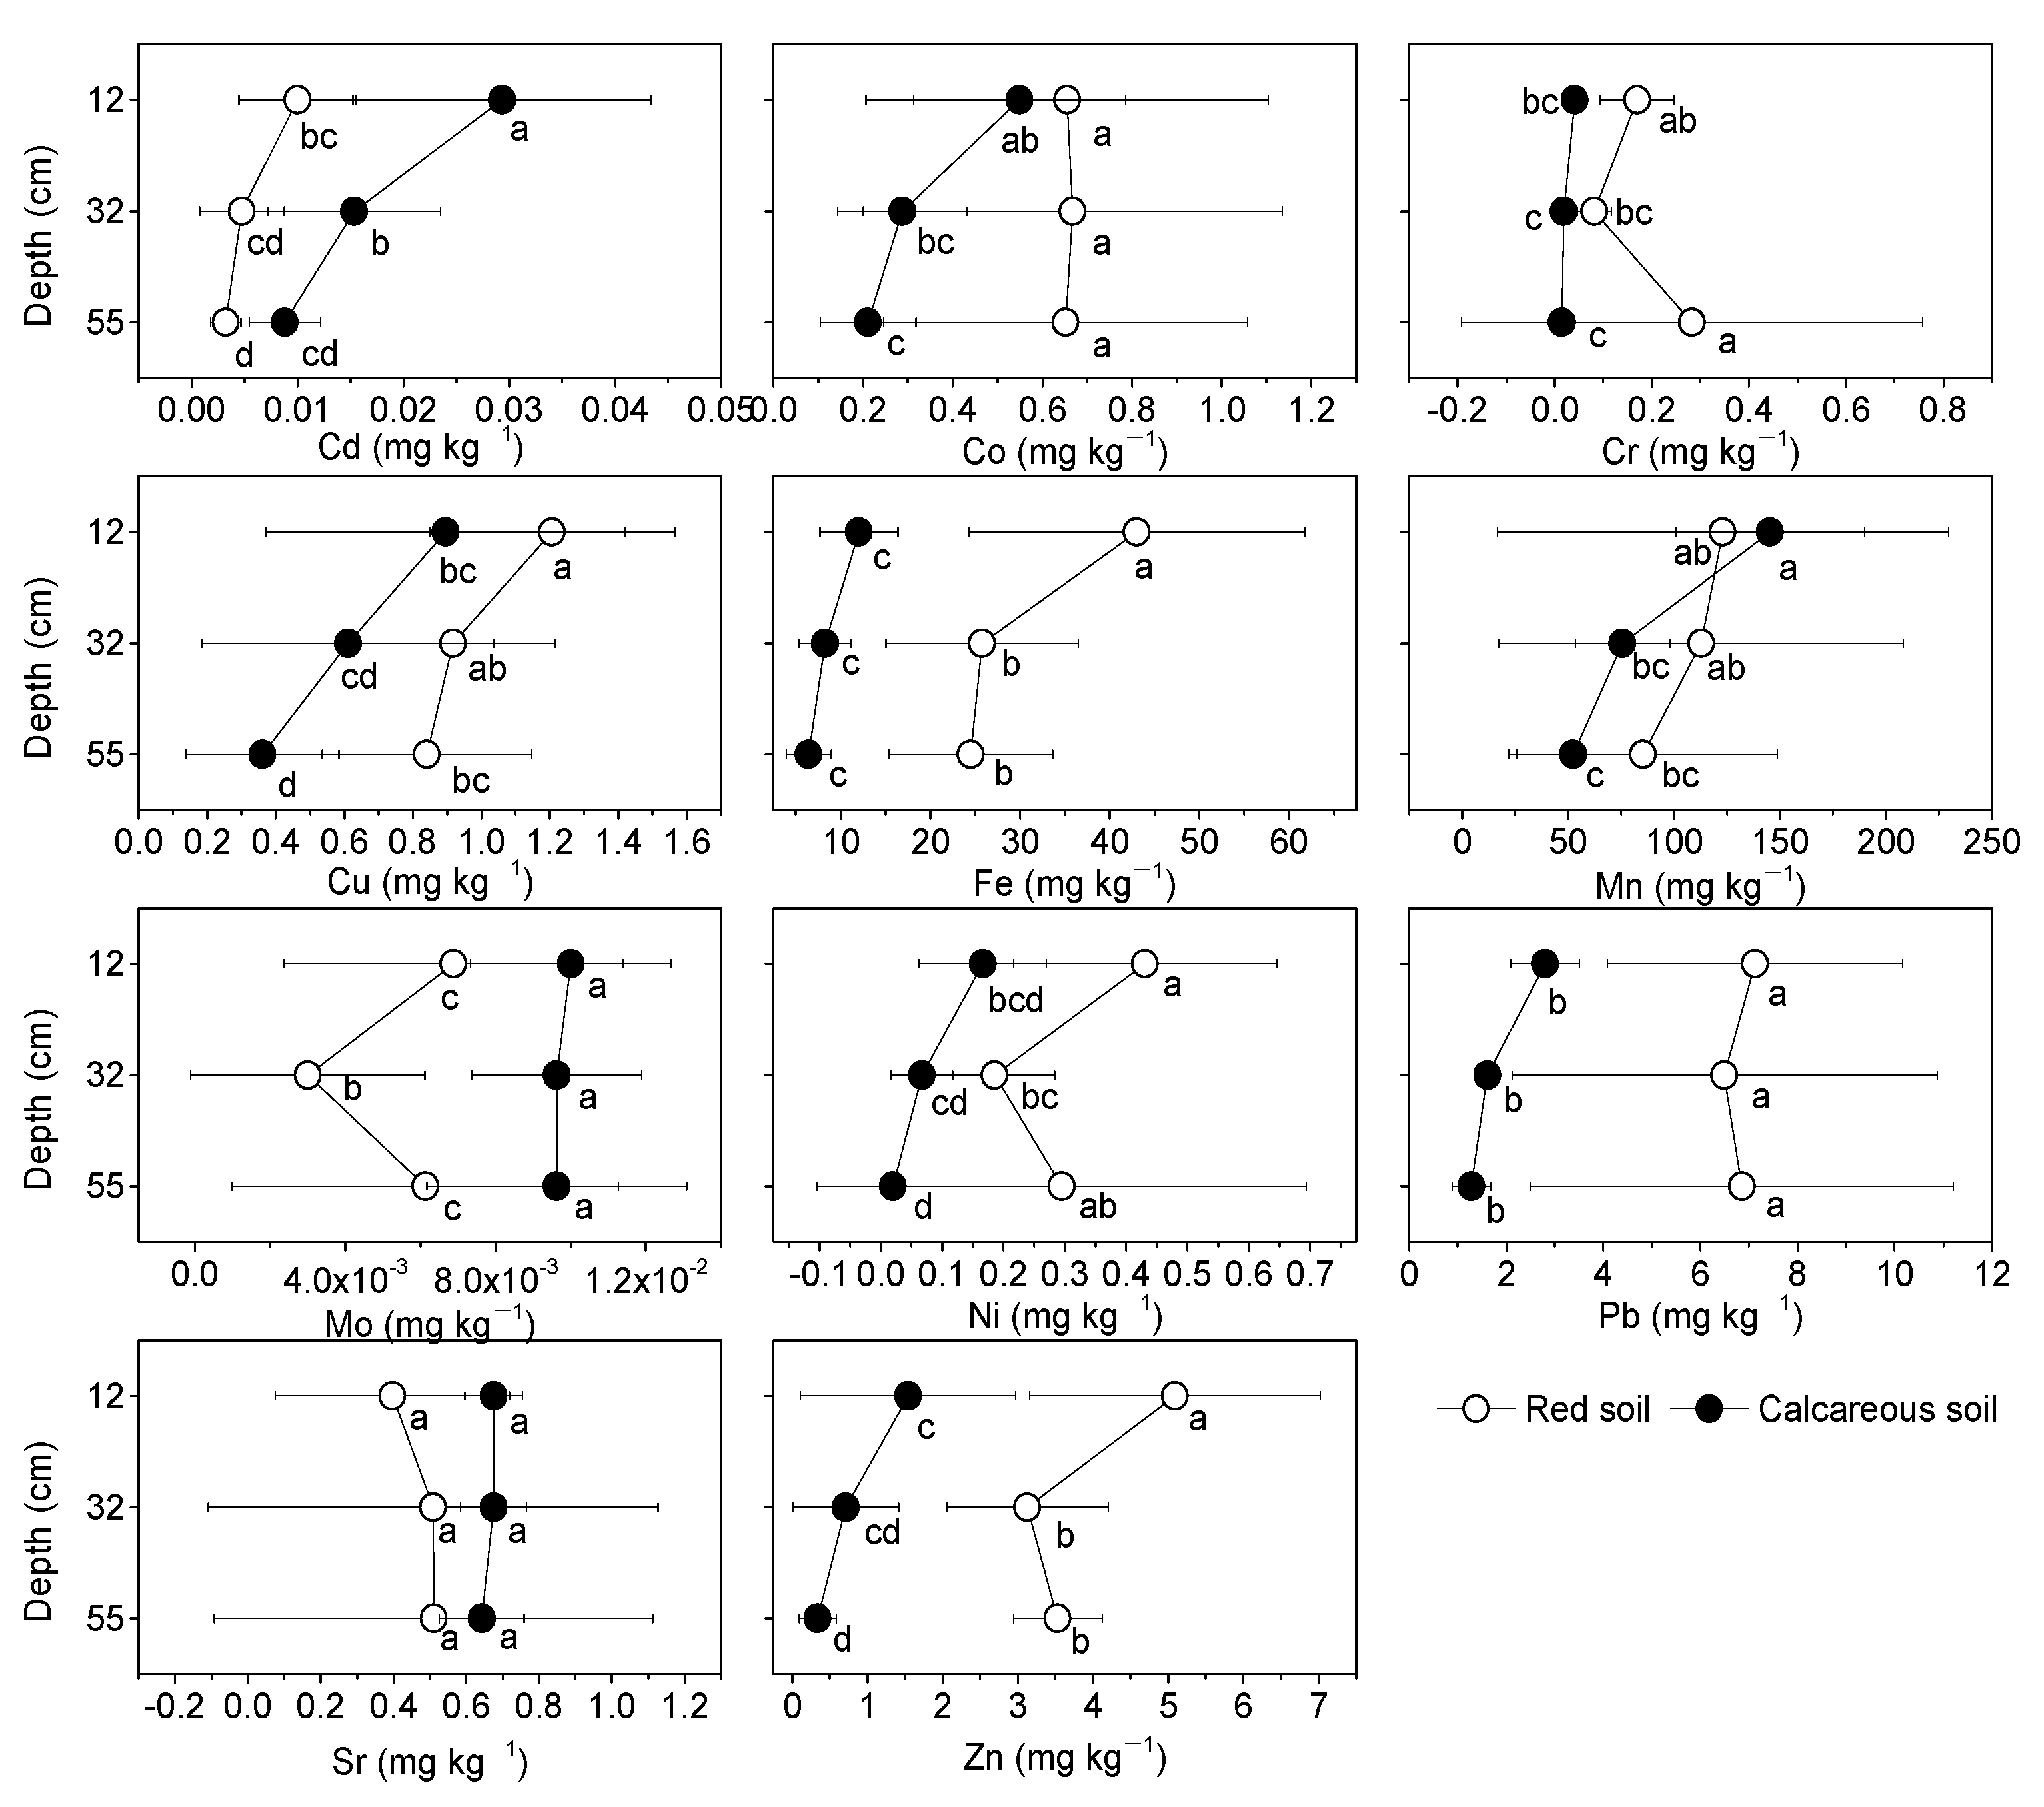
3.3. Distribution of Heavy Metals

The CT of each trace element varied from the surface to the bottom of the soil. In calcareous soil, except for Cr and Sr, other elements gradually increased or remained stable with respect to depth. In the red soil, Mo decreased as depth increased, while the others were not much different. Mo in the middle layer was slightly lower (Figure 1). This reflects the elemental source of the underlying bedrock [6,8]. The CT of Mo, Pb, and Sr in calcareous soil was lower than those in red soil, while the other eight elements showed the opposite trend. This finding implies the unique characteristics of the enrichment of trace metals in karstic soil under the same climatic conditions [6]. The content of Fe and Mn was the highest, reaching the order of 103–104 mg kg−1, followed by Zn, Cr, Pb, Ni, Sr, Cu, Co, As (10–70 mg kg−1), and Cd and Mo (<10 mg kg−1). We compared the concentrations of calcareous subsoil with the upper continental crust (UCC) [27]. Heavy metals that exceeded the UCC followed this sequence (ratio of calcareous subsoil to UCC): As(8.7) > Mo(7.5) > Cd(5.39) > Zn(4.7) > Cr(4.5) > Pb(2.5) > Co(2.2) > Ni(2.0) > Cu(1.1) whereas Sr was just ten percent of UCC. This reflects the high geochemical background presence of trace metals in karstic soil [6,8].
Figure 2 shows the CA of heavy metals in calcareous soils. All of them decreased at increased soil depths, which is consistent with the Aca content distribution. In red soil, Cr, Mo, Ni, Pb, and Zn increased in the bottom layer, and other elements also showed the same trend with calcareous soil. The CA of Cd, Mo, and Sr in calcareous soil was higher than that in red soil, and the others showed the opposite trend. This showed that the calcareous soil had lower CT of Mo and Sr but higher CA of Mo and Sr, with the CT and CA of Mo especially exhibiting a significant difference between calcareous and red soils (Figure 1 and Figure 2). However, calcareous soil had higher CT and lower CA for the other nine heavy metals except for Cd. Similarly, it has been reported that the karstic soil with high levels of background geochemicals was significantly enriched with heavy metals whose bioavailability was generally low [7,14].
The CA of heavy metals in calcareous soil decreased with soil depth. This was probably related to root distribution and microbial activity in the subsoil [14]. Roots and microorganisms can release CO2 to the soil through respiration and secrete organic acids to change soil pH [28]. A decrease in soil pH could cause the release of elements from Fe–Mn oxides and the carbonated fraction [29,30,31].

3.4. AR of Carbonate and Clastic Area

The AR can more clearly illustrate the activation effect of the two soils on the elements [32]. In this study, the AR of heavy metals in calcareous soil was low, between 0.02–8.08% (Table 3). The AR of the red soil was higher, ranging from 0.08–14.59% (Table 3). The AR of Pb was the highest at about 8–15% and for the other elements less than 7%. Elements such as Zn, Ni, Cu, Pb, Cd, and Hg migrated moderately and weakly in oxidizing environments while they were inert in weak reducing environments. Cr showed little migration in most environments [6]. The AR of Co, Cr, Cu, Ni, Pb, and Zn was higher in red soil whereas the AR of Cd, Mo, and Sr were higher in calcareous soil (Table 3). Wen et al. [7] reported that available Cd extractability in limestone soil was the lowest in all soils; thus, the exceedance rate of Cd in rice grain was zero according to the FQS [17]. In the study area, the CT of Cd in calcareous soils was slightly higher than the RSV [16] (Table 3). However, it probably was not hazardous to crops because its CA was much lower than the FQS. Noticeably, although the CT of Pb was lower than the RSV, the CA was about 10 times higher than the FQS. Furthermore, the CT of Zn in calcareous soil was higher than the RSV (Table 3), which might pose quality and safety risks to agricultural products.

4. Discussion

4.1. Accumulation of Total Metal Elements in Calcareous Soils

The elemental Q values in the two kinds of soil are givenin Table 4. The elemental accumulations and losses in the clastic area were relatively stable (Q: 0.2–12.1) compared to those in calcareous soils (Q: 0.04–52.69). The Q values of Fe and Mn in carbonate subsoil were as high as 51.54 and 51.86, indicating that the accumulation of Fe and Mn was significant and the degree of ferritization was extremely high in the carbonate area [6]. The majority of heavy metals were highly accumulatedin calcareous soil (Q > 1), except for a loss of Ca, Sr, and Cd (Q < 1). During the weathering of the carbonate rocks, Ca and Mg were almost totally leached with anaverage of 97–99% [6]. Sr and Ca had similar geochemical behaviors and were also leached. Under the same hot and rainy climate, the concentrations of majority trace metals in the karstic soils were generally higher than those in the red soils whereas it was the opposite in carbonate and clastic bedrocks (Table 4) with the exception of Cd, Mo, Sr, and Zn. The accumulation of total metal elements in calcareous soils was mainly controlled by secondary enrichment. Cd and Zn contents of soils and bedrock were both higher in calcareous soils (Table 4), which showed the inherent relationship between their content in overlying soils and source rocks and ultimately reflected the geogenic origin of the heavy metals [6,33,34].
The weathering and soil-forming process for carbonate rocks can be divided into “leaching–accumulating” and “weathering” stages [6]. Generally, the proportion of insoluble residues in relatively pure limestone or dolomite is less than 5% [2,35,36]. In the first stage, due to the sharp decrease in volume during the dissolution of carbonate rocks, the concentrations of heavy metals in insoluble residues of small volume increased dramatically. These showed a typical secondary enrichment characteristic. In the second stage, the chemical weathering of the residue soils was similar to the weathering process of non-carbonate rocks [2,37] where metal elements were generally lost [6,38].

4.2. Principal Controlling Factors for Heavy Metals:Soil pH and Ca Fraction

The two-dimensional RDA ordination diagrams show that the arrow lines of the pH and Ca fraction were the longest (Figure 3), indicating that these indexes play a major role in controlling the distribution of the CT and CA of metal elements, followed by C:N and AP. Conversely, other environmental indexes exhibited a weak influence on the metal elements. Noticeably, the majority of CT were positively correlated with pH and Ca fractions, but the majority of CA were negatively correlated with the two. This was consistent with the Pearson correlation coefficient and the results of the significance test (Tables S2 and S3).
The pH and Ca fractions were the primary factors influencing the heavy metals, which is consistent with previous studies [6,7,14,15]. Except for the secondary enrichment mentioned above, the concentrations of Al2O3, Fe2O3, Mn, and clay content (Al2O3/SiO2) in soils from carbonate substrates were closely related to the accumulation of metal elements in soils [6]. The sorption of metals on the surface of Fe minerals (such as hematite and goethite), Al minerals (such as gibbsite), or Mn minerals (such as birnessite) increases gradually with the increase of pH [39,40,41]. Calcareous soils developed by carbonate bedrock are characterized by high pH due to high Ca concentrations [42,43]. Moreover, Ca in calcareous soil would be substituted by Cu, Fe, Mn, Ni, and Zn during the strong chemical leaching and isomorphism processes [14]. Subsequently, it would be adsorbed easily by clay minerals during weathering, which is conducive to the enrichment of heavy metals in calcareous soils [14,32].
Among Ca fractions, ReCa had the highest correlation coefficient with the CT of metals. These selected metal elements were inert and are relatively stable in the environment [6]. For example, geogenic Cd and Pb in karstic soil was mostly distributed in the residual fractions and exhibited low mobility, and Pb mainly existed in the crystal structures of primary and secondary minerals and had considerably low mobility [7]. Thus, ReCa and most of the heavy metals were fixed together in the residue fraction.
The water-soluble, exchangeable, and carbonate fractions have been recognized as labile or potentially bioavailable fractions [44]. When soil pH increases, there will be more sorption sites on the surface of soil minerals, changing metal elements into more stable fractions and then decreasing their mobility [7,45]. Moreover, when the active Ca content in the soil solution is high it can compete with heavy metals for organic ligands, thereby affecting the plant availability of these elements, especially when the soil pH is close to neutral or alkaline. In this case, Ca shows stronger ion competitiveness [6,32]. Therefore, the correlation coefficient between Aca and the available element was the highest in this study.

4.3. Other Controlling Factors for Heavy Metals: AP, C:N, Cation Exchange Capacity (CEC), and Soil Texture

Although the arrow lines of AP and C:N were also long (Figure 3), AP and C:N were not the principal controlling factors. Actually, Ca and pH are the key factors affecting SOC, TN, and AP concentrations [43]. Calcareous soils had higher SOC and TN and lower AP concentrations compared to the adjacent red soil (Table 1), which is consistent with an earlier investigation on soils of the Karst Graben area in Yunnan province [43]. Soil pH can affect the forms and transformation of C, N, and P elements in the soil by changing the geochemical environment and microbial abundance, community, and activity [43]. Similarly, Ca affects the C, N, and P by participating in microbial metabolism, mineralization, and decomposition of organic matter [46]. For example, Ca can combine with humusto form Ca humate, which is difficult to mineralize and decompose [47], thereby lowering the active organic matter. Thus, AP, C:N, and heavy metals showed close correlation (same or opposite) because they are both controlled by pH and Ca.
Additionally, it has been widely accepted that the CEC and clay contents in calcareous soils in the karst region of southwestern China are significantly higher than those in other zonal soils at the same latitude [7,42,47]. In this study area, CEC and clay content (<2 μm) in calcareous soils were 1.2 and 1.5 times higher than those in red soils [47]. In the case of high pH, cationic metals can generate multinuclear polymers or form precipitate on gibbsite surfaces [39,48]. They also can compete with heavy metals for organic ligands [6,32]. A greater number of clay minerals indicates more sorption sites on the surface of soil minerals, decreasing the mobility of heavy metals [7,45]. Thus, CEC and clay minerals chiefly affected the available heavy metals.
It is worth noting that not all heavy metals follow the rule that calcareous soils have higher CT and lower CA of heavy metals, such as Pb, Mo, Cd, and Sr (Figure 1 and Figure 2). However, the mechanism of action underpinning this is currently unclear and needs further investigation. In aspects of land utilization and management, the state of Pb and Zn should be given more attention in karst areas. In clastic areas, the focus should be on the acidification of the soil as a result of the application of fertilizers (e.g., nitrogen and phosphate) to avoid heavy metal contamination.

5. Conclusions

In this study, calcareous soil in carbonate areas was found to exhibit unique characteristics with respect to environmental factors and heavy metals compared to adjacent red soil in clastic areas under the same climatic conditions. The calcareous soil had greater TOC, TN, AN, AK, and Ca compared to the red soil, but with lower AP and C:N. The Ca fraction was dominated by Aca in both types of soil. For 11 heavy metals, the calcareous soil normally had higher CT of the majority of heavy metals, except Mo, Pb, and Sr, and lower CA, except for Cd, Mo, and Sr. The accumulation of total metal elements in calcareous soils derived from carbonate rock was mainly due to the fact that so much of the bedrock mass is removed via weathering and leaching. Moreover, RDA showed that high pH value and Ca content in calcareous soils were primary factors influencing both the CT and CA of the metal elements, especially ReCa to CT and Aca to CA. Additionally, higher soil CEC and clay minerals also improved the immobility of heavy metals. The results probably indicate that even if karstic soil has a high geochemical background presence of heavy metals, its risk to the quality and safety of agricultural products is still low. Lastly, the complex mechanisms of interaction between Pb, Mo, Cd, Sr, and the physicochemical properties of soil need further study. Further investigation is also needed to extend the metal transfer study in rock–soil systems to rock–soil–plant and human systems with a focus on the ecological risks posed by heavy metals.

Supplementary Materials

The following are available online at https://www.mdpi.com/article/10.3390/f12050609/s1. Table S1: Location and information on selected soil profiles in the field, Table S2: Pearson correlation coefficient between soil environmental factors and total content of heavy metals, Table S3: Pearson correlation coefficient between soil environmental factors and available content of heavy metals.

Author Contributions

Conceptualization, T.Z.; writing—original draft preparation, F.H.; investigation, F.H. and X.W.; writing—review and editing, Z.L. and J.C. All authors have read and agreed to the published version of the manuscript.

Funding

This research was funded by the National and Guangxi Natural Science Foundation of China (Grant Nos. 41772385, 2016GXNSFAA380034), the Guangxi Key Science and Technology Innovation Base on Karst Dynamics (KDL and Guangxi 202011), and the Special Fund for Basic Scientific Research of Institute of Karst Geology, CAGS (Grant No. 2020004).

Data Availability Statement

The data presented in this study are available on request from the corresponding author.

Acknowledgments

We would like to thank the anonymous referees for their valuable comments and suggestions.

Conflicts of Interest

The authors declare no conflict of interest.

References

  1. Yuan, D. Modern karstology and global change study. Earth Sci. Front. 1997, 4, 17–25. [Google Scholar]
  2. Wang, S.; Ji, H. Preliminary study of carbonate rock weathering pedogenesis. Sci. China Ser. D 1999, 29, 441–449. [Google Scholar] [CrossRef]
  3. Jin, Z.; Yu, K.; Pan, Y.; Zhao, D.; Lu, X. Global Distribution of Phanerozoic Carbonates and Controlling Factors. Geoscience 2013, 27, 637–643. (In Chinese) [Google Scholar]
  4. Jiang, Z.; Qin, X.; Cao, J.; Jiang, X.; Luo, W. Calculation of atmospheric CO2 sink formed in karst progresses of the karst divided regions in China. Carsol. Sin. 2011, 30, 363–367. (In Chinese) [Google Scholar]
  5. Yuan, D. Karst of China; China Geological Publishing House: Beijing, China, 1991; p. 224. [Google Scholar]
  6. Yang, Q.; Yang, Z.; Filippelli, G.M.; Ji, J.; Ji, W.; Liu, X.; Wang, L.; Yu, T.; Wu, T.; Zhuo, X.; et al. Distribution and secondary enrichment of heavy metal elements in karstic soils with high geochemical background in Guangxi, China. Chem. Geol. 2021, 567, 120081. [Google Scholar] [CrossRef]
  7. Wen, Y.; Li, W.; Yang, Z.; Zhuo, X.; Ji, J. Evaluation of various approaches to predict cadmium bioavailability to rice grown insoils with high geochemical background in the karst region, Southwestern China. Environ. Pollut. 2020, 258, 113645. [Google Scholar] [CrossRef]
  8. Wen, Y.; Li, W.; Yang, Z.; Zhang, Q.; Ji, J. Enrichment and source identification of Cd and other heavy metals in soils with high geochemical background in the karst region, Southwestern China. Chemosphere 2020, 245, 125620. [Google Scholar] [CrossRef]
  9. Chen, H.; Teng, Y.; Lu, S.; Wang, Y.; Wang, J. Contamination features and health risk of soil heavy metals in China. Sci. Total Environ. 2015, 512–513, 143–153. [Google Scholar] [CrossRef]
  10. Yamasaki, S.I.; Takeda, A.; Nunohara, K.; Tsuchiya, N. Red soils derived from limestone contain higher amounts of trace elements than those derived from various other parent materials. Soil Sci. Plant Nutr. 2013, 59, 692–699. [Google Scholar] [CrossRef] [Green Version]
  11. Halamić, J.; Peh, Z.; Miko, S.; Galović, L.; Šorša, A. Geochemical Atlas of Croatia: Environmental implications and geodynamical thread. J. Geochem. Explor. 2012, 115, 36–46. [Google Scholar] [CrossRef]
  12. Zhang, C.; Lalor, G. Multivariate relationships and spatial distribution of geochemical features of soils in Jamaica. Chem. Speciat. Bioavailab. 2002, 14, 57–65. [Google Scholar] [CrossRef] [Green Version]
  13. Miko, S.; Peh, Z.; Bukovec, D.; Prohić, E.; Kastmüller, Ž. Geochemical baseline mapping and lead pollution assessment of soils on the karst in Western Croatia. Nat. Croat. 2000, 9, 41–59. [Google Scholar]
  14. Yang, H.; Lu, M.; Cao, J. Trace elements of the soil–plant systems in subtropical karst and clasolite areas in Guilin, Guangxi, China. Environ. Earth. Sci. 2015, 73, 6259–6269. [Google Scholar] [CrossRef]
  15. Gan, Y.; Miao, Y.; Wang, L.; Yang, G.; Li, Y.; Wang, W.; Dai, J. Source contribution analysis and collaborative assessment of heavy metals in vegetable-growing soils. J. Agric. Food Chem. 2018, 66, 10943–10951. [Google Scholar] [CrossRef]
  16. Ministry of Ecology and Environment of China. Soil Environmental Quality Risk Control Standard for Soil Contamination of Agricultural Land (GB15618-2018); China Environmental Science Press: Beijing, China, 2018. (In Chinese) [Google Scholar]
  17. Minstry of Health of China (MHC). National Food Safety Standard: Maximum Levels of Contaminants in Food (GB2762-2017); China Quality and Standards Publishing: Beijing, China, 2017. (In Chinese) [Google Scholar]
  18. Food and Agriculture Organization of the United Nations. World Reference Base for Soil Resources 2014. International Soil Classification System for Naming Soils and Creating Legends for Soil Maps; FAO: Rome, Italy, 2015. [Google Scholar]
  19. Huang, F.; Cao, J.; Zhu, T.; Fan, M.; Ren, M. CO2 Transfer Characteristics of Calcareous Humid Subtropical Forest Soils and Associated Contributions to Carbon Source and Sink in Guilin, Southwest China. Forests 2020, 11, 219. [Google Scholar] [CrossRef] [Green Version]
  20. Lu, R. Soil Agricultural Chemical Analysis Method; Agricultural Science and Technology Press of China: Beijing, China, 2000. (In Chinese) [Google Scholar]
  21. Lu, M.; Cao, J.; He, X. The Comparative Study of Biogeocheistry between Limestone Soil and Red Soil in Maocun, Guilin. Guangxi Sci. 2006, 13, 58–64. (In Chinese) [Google Scholar]
  22. Dahlqvist, R.; Benedetti, M.F.; Andersson, K.; Turner, D.; Larsson, T.; Stolpe, B.; Ingri, J. Association of calcium with colloidal particles and speciation of calcium in the Kalix and Amazon rivers. Geochim. Cosmochim. Acta 2004, 68, 4059–4075. [Google Scholar] [CrossRef] [Green Version]
  23. Hong, S.; Zheng, Z.; Chen, J. Environmental geochemical characteristics of some microelements in the yellow brown soil of Hubei province. Acta Pedol. Sin. 2001, 38, 89–95. [Google Scholar]
  24. Xie, D.; Yang, Y.; Su, C.; Meng, X. Contrasts of geochemical characteristics and environmental quality between soils of carbonate and clastic matrix. Guizhou Agric. Sci. 2015, 43, 128–132. (In Chinese) [Google Scholar]
  25. Leps, J.; Smilauer, P. Multivariate Analysis of Ecological Data using CANOCO; Cambridge University Press: Cambridge, UK, 2003. [Google Scholar]
  26. Chen, J.R.; Cao, J.H.; Liang, Y.; Yang, H. Relationship of the humus components and the calcium form with the development of limestone soil. Carsol. Sin. 2012, 31, 7–11. (In Chinese) [Google Scholar]
  27. Rudnick, R.; Gao, S. Composition of the Continental Crust. Treatise Geochem. 2014. [Google Scholar] [CrossRef]
  28. Lian, B.; Chen, Y.; Zhu, L.; Yang, R. Effect of Microbial Weathering on Carbonate Rocks. Earth Sci. Front. 2008, 15, 90–99. (In Chinese) [Google Scholar] [CrossRef]
  29. Wang, J.; Wang, P.M.; Gu, Y.; Kopittke, P.M.; Zhao, F.J.; Wang, P. Iron-Manganese (Oxyhydro) oxides, Rather than Oxidation ofSulfides, Determine Mobilization of Cd during Soil Drainage in Paddy Soil Systems. Environ. Sci. Technol. 2019, 53, 2500–2508. [Google Scholar] [CrossRef]
  30. He, S.; Lu, Q.; Li, W.; Ren, Z.; Zhou, Z.; Feng, X.; Zhang, Y.; Li, Y. Factors controlling cadmium and lead activities in different parent material-derived soils from the Pearl River Basin. Chemosphere 2017, 182, 509–516. [Google Scholar] [CrossRef] [PubMed]
  31. Quezada-Hinojosa, R.P.; Föllmi, K.B.; Verrecchia, E.; Adatte, T.; Matera, V. Speciation and multivariable analyses of geogenic cadmium in soils at Le Gurnigel, Swiss Jura Mountains. Catena 2015, 125, 10–32. [Google Scholar] [CrossRef]
  32. Li, X.; Pan, S. The characteristics of translocation accumulation and distribution about trace elements in the soils of both Guangdong and Hainan provinces Tropical. Geography 1991, 11, 62–70. (In Chinese) [Google Scholar]
  33. Scaccabarozzi, D.; Castillo, L.; Aromatisi, A.; Milne, L.; Muoz-Rojas, M. Soil, site, and management factors affecting cadmium concentrations in cacao-growing soils. Agronomy 2020, 10, 806. [Google Scholar] [CrossRef]
  34. Khan, S.; Rehman, R.; Khan, R.; Khan, R.; Shah, R. Soil and vegetables enrichment with heavy metals from geological sources in Gilgit, northern Pakistan. Ecotoxicol. Environ. Saf. 2010, 73, 1820–1827. [Google Scholar] [CrossRef] [PubMed]
  35. Ji, H.; Wang, S.; Ouyang, Z.; Zhang, S.; Sun, C.; Liu, X.; Zhou, D. Geochemistry of red residua underlying dolomites in karst terrains of Yunnan-Guizhou Plateau: II. The mobility of rare earth elements during weathering. Chem. Geol. 2004, 203, 29–50. [Google Scholar] [CrossRef]
  36. Sun, C.X.; Wang, S.J.; Liu, X.M.; Feng, Z.G. Geological characteristics and formation mechanism of rock-soil interface in limestone weathering crust at huaxi, Guizhou Province. Acta Mineral. Sin. 2002, 22, 126–132. (In Chinese) [Google Scholar]
  37. Ji, H.; Ouyang, Z.; Wang, S.; Zhou, D. Element geochemistry of weathering profile of dolomitite and its implications for the average chemical composition of the upper-continental crust. Sci. China Ser. D. 2000, 43, 23–35. [Google Scholar] [CrossRef]
  38. Feng, J. Trace elements in ferromanganese concretions, gibbsite spots, and the surrounding terra rossa overlying dolomite: Their mobilization, redistribution and fractionation. J. Geochem. Explor. 2010, 108, 99–111. [Google Scholar] [CrossRef]
  39. Weerasooriya, R.; Wijesekara, H.; Bandara, A. Surface complexation modeling of cadmium adsorption on gibbsite. Colloids Surf. A 2002, 207, 13–24. [Google Scholar] [CrossRef]
  40. Swedlund, P.J.; Webster, J.G.; Miskelly, G.M. Goethite adsorption of Cu(II), Pb(II), Cd(II), and Zn(II) in the presence of sulfate: Properties of the ternary complex. Geochim. Cosmochim. Acta 2008, 73, 1548–1562. [Google Scholar] [CrossRef]
  41. Wang, Y.; Tan, W.F.; Feng, X.H.; Qiu, G.H.; Liu, F. Adsorption of heavy metals on the surface of birnessiterelationship with its Mn average oxidation state and adsorption sites. Environ. Sci. 2011, 32, 3128–3136. (In Chinese) [Google Scholar]
  42. Zhang, Y.; Vriesc, W.; Thomasd, B.; Hao, X.; Shi, X. Impacts of long-term nitrogen fertilization on acid buffering rates andmechanisms of a slightly calcareous clay soil. Geofis. Int. 2017, 305, 92–99. [Google Scholar]
  43. Yang, H.; Zhang, P.; Zhu, T.; Li, Q.; Cao, J. The Characteristics of Soil C, N, and P Stoichiometric Ratios as Affected by Geological Background in a Karst Graben Area, Southwest China. Forests 2019, 10, 601. [Google Scholar] [CrossRef] [Green Version]
  44. Liu, Y.; Xiao, T.; Perkins, R.; Zhu, J.; Ning, Z. Geogenic cadmium pollution and potential health risks, with emphasis on black shale. J. Geochem. Explor. 2017, 176, 42–49. [Google Scholar] [CrossRef] [Green Version]
  45. Loganathan, P.; Vigneswaran, S.; Kandasamy, J.; Najdu, R. Cadmium Sorption and Desorption in Soils: A Review. Crit. Rev. Environ. Sci. Technol. 2012, 42, 489–533. [Google Scholar] [CrossRef]
  46. Silver, W.; Miya, R. Global patterns in root decomposition: Comparisons of climate and litter quality effects. Oecologia 2001, 129, 407–419. [Google Scholar] [CrossRef]
  47. Zhu, T.; Zeng, S.; Qin, H.; Zhou, K.; Yang, H.; Lan, F.; Huang, F.; Cao, J.; Müller, C. Low nitrate retention capacity in calcareous soil under woodland in the karst region of southwestern China. Soil Biol. Biochem. 2016, 97, 99–101. [Google Scholar] [CrossRef]
  48. Zhou, S.; Ma, Y.; Xu, M.; Luo, L.; Zhang, S. Application of X-ray absorption fine structure spectroscopy to soil science. Acta Pedol. Sin. 2008, 43, 155–164. (In Chinese) [Google Scholar]
Figure 1. The distribution of the total content (CT) of heavy metals in the soil profile, includingcadmium (Cd), cobalt (Co),chromium (Cr),copper (Cu), iron (Fe), manganese (Mn), molybdenum (Mo), nickel (Ni), plumbum (Pb), strontium (Sr), and zinc (Zn). Identical lowercase letters indicate no significant differences among all soil layers in calcareous and red soils at p = 0.05, N = 12.
Forests 12 00609 g001
Figure 2. The distribution of the available content (CA) of heavy metals in the soil profile. Identical lowercase letters indicate the same as Figure 1.
Forests 12 00609 g002
Figure 3. Two-dimensional RDA ordination diagrams of soil environmental factors and CT (a) and CA (b) of heavy metals.
Forests 12 00609 g003
Table 1. Soil environmental factors, including pH value, soil organic carbon (SOC), total nitrogen (TN), available nitrogen (AN), available phosphorus (AP), available potassium (AK) content, and C:N in calcareous soil and red soil layers.
Soil Depth (cm)pH ValueSOC (%)TN (%)AN (mg kg−1)AP (mg kg−1)AK (mg kg−1)C:N
Calcareous soil0–256.04 ± 0.34 a2.66 ± 1.01 a0.33 ± 0.19 a123.29 ± 56.18 a6.22 ± 4.60 ab50.22 ± 28.71 a8.92 ± 1.05 b
25–406.10 ± 0.32 a1.79 ± 0.67 b0.23 ± 0.09 ab88.99 ± 21.83 ab3.64 ± 1.10 b25.66 ± 9.72 b7.54 ± 0.77 c
40–705.86 ± 0.25 a1.22 ± 0.13 c0.17 ± 0.02 b78.30 ± 23.44 b2.63 ± 1.31 b23.36 ± 6.62 b7.07 ± 0.47 c
mean6.00 ± 0.31 A1.89 ± 0.91 A0.24 ± 0.13 A97.67 ± 41.12 A4.16 ± 3.01 A33.08 ± 21.15 A7.84 ± 1.09 B
Red soil0–254.39 ± 0.49 c2.14 ± 0.70 b0.17 ± 0.05 b89.00 ± 28.10 ab9.56 ± 5.01 a29.11 ± 4.24 b12.68 ± 0.51 a
25–404.78 ± 0.42 bc0.99 ± 0.21 c0.11 ± 0.03 b81.43 ± 24.28 b5.75 ± 3.32 ab18.80 ± 3.90 b9.36 ± 1.26 b
40–705.11 ± 0.62 b0.86 ± 0.35 c0.10 ± 0.04 b70.26 ± 37.48 b7.09 ± 4.88 ab19.56 ± 3.35 b8.02 ± 1.34 bc
mean4.76 ± 0.58 B1.33 ± 0.74 A0.13 ± 0.05 A80.12 ± 30.65 A7.47 ± 4.37 A22.49 ± 6.04 A10.02 ± 2.27 A
Data are means ± SD; identical lowercase letters indicate no significant differences among all soil layers in calcareous and red soils at p = 0.05, N = 12; identical uppercase letters indicate no significant differences in average values between calcareous and red soils at p = 0.05, N = 36, the same as below.
Table 2. Acid soluble (Aca), reducible (Rca), oxidable (Oca), residual (ReCa), and total (Tca) fractions of the calcium content in calcareous soil and red soil layers.
Soil Depth(cm)Aca (mg kg−1)Rca (mg kg−1)Oca (mg kg−1)ReCa (mg kg−1)Tca (mg kg−1)
Calcareous soil0–253234 ± 1730 a1636 ± 1462 a233.5 ± 54.56 a275.2 ± 54.85 a5291 ± 3427 a
25–402923 ± 1698 a1291 ± 1153 a221.9 ± 112.2 a284.3 ± 82.60 a4720 ± 3249 a
40–702458 ± 950.2 a962.5 ± 730.3 a229.4 ± 90.10 a285.8 ± 84.44 a3935 ± 1939 a
mean2872 ± 1459 A1228 ± 1125 A227.9 ± 85.64 A281.8 ± 73.96 A4649 ± 812 A
Red soil0–25395.1 ± 293.7 b52.33 ± 23.97 b198.1 ± 125.1 a81.29 ± 15.74 b726.8 ± 335.1 b
25–40356.3 ± 399.0 b139.2 ± 119.2 b108.2 ± 32.85 b73.04 ± 28.76 b676.7 ± 574.7 b
40–70339.7 ± 345.6 b84.67 ± 76.04 b49.50 ± 16.90 b105.7 ± 49.73 b579.6 ± 464.5 b
mean363.7 ± 346.1 B92.06 ± 73.08 B118.6 ± 58.27 A86.68 ± 31.41 B661.1 ± 119.9 B
Data are means ± SD; identical lowercase and uppercase letters indicate the same as Table 1.
Table 3. The available (CA) and total contents (CT),activation rate (AR) of heavy metals in the surface soil, risk screening values (RSV) for agricultural soil contamination, and the national food quality standard (FQS).
CdCoCrCuMoNiPbSrZn
Calcareous soilCA (mg kg−1)0.02930.54860.04080.89560.0080.16642.7970.6751.541
CT (mg kg−1)0.48538.38204.731.081.52679.3334.6330.22301.9
AR1 (%)6.041.430.022.880.510.218.082.230.51
Red soilCA (mg kg−1)0.01000.6550.16941.20630.00690.43087.12260.39735.088
CT (mg kg−1)0.335614.9585.2718.618.79024.7248.8333.73175.1
AR2 (%)2.984.380.26.480.081.7414.591.182.91
AR1:AR22.030.330.100.446.380.120.551.890.18
RSV a (mg kg−1)0.4-15050-7090-200
FQS (mg kg−1)0.2-1.0--1.00.2--
a The RSV varied from the pH value and 5.5 < pH ≤ 6.5 in the table. If the pollutant content in the soil of agricultural land is equal to or lower than the RSV value, quality and safety risks to producearelow and it can be ignored. If the value exceeds the RSV, it probably affects agricultural products and efforts for the coordinated monitoring of the soil environment and agricultural products should be strengthened [16].
Table 4. The Q value (Q1, Q2) and elemental content of surface soils (CT1, CT2) and bedrocks (CR1, CR2). Subscript 1 indicates soil or rock in the carbonate area, 2 indicates soil or rock in the clastic area.
CaFeMnCdCoCrCuMoNiPbSrZn
Q10.0451.5451.860.7529.863.5110.856.1252.692.400.682.33
Q20.190.581.090.810.302.242.5412.13.710.220.992.95
CT1:CT27.281.203.121.442.571.41.670.532.370.750.901.68
CR1 (mg kg−1)142,200121734.860.641.29118.52.871.351.8017.8146.25134.5
CR2 (mg kg−1)390089,5005300.4149.75132.57.331.2810.78262.535.5063.25
CR1:CR236.460.010.071.560.030.890.391.050.170.071.302.13
Publisher’s Note: MDPI stays neutral with regard to jurisdictional claims in published maps and institutional affiliations.

