Article

Response of Runoff Yield to Land Use Changes in the Small Watershed of Core Area for 2022 Winter Olympic Games in Zhangjiakou City Based on SWAT Model

Research Center for Engineering Ecology and Nonlinear Science, North China Electric Power University, Beijing 102206, China
*
Author to whom correspondence should be addressed.
Forests 2022, 13(6), 853; https://doi.org/10.3390/f13060853
Submission received: 14 April 2022 / Revised: 26 May 2022 / Accepted: 27 May 2022 / Published: 30 May 2022
(This article belongs to the Section Forest Ecology and Management)

Abstract

:
Based on an improved high-precision land use map, the SWAT model of the small watershed of the core area for the 2022 Winter Olympic Games in Zhangjiakou City was established. The model was set up, calibrated, and validated with data from 2017 to 2019. In comparison with the measured flow discharge, all the coefficient of determination values of the simulated results at the upstream, midstream, and downstream (outlet) points were larger than 0.80 in both calibration and validation periods, and the relevant Nash–Sutcliffe efficiency coefficient values were above 0.62. With the model, the response of runoff yield in the small watershed to the land use change before (2015) and after (2019) Olympic construction was simulated and analyzed. The runoff yield change was only −5.1% from 2015 to 2019, which was not statistically significant (p = 0.87 > 0.05). Through simulation of two extreme scenarios, two runoff yield change coefficients were introduced to explore the effects of land use change on runoff yield. The results revealed that the neutralization effects of the land use change from grassland to forest (with strong water conservation capacity) and residential and bare land (with poor water conservation capacity) were the main reasons for the insignificant change of runoff yield. The results of this research may provide some inspiration to the application of SWAT model in small watershed and some guidance to the vegetation restoration practices for water conservation. These results can promote understanding on the response of runoff yield to the land use changes towards two extreme directions of forest land and residential and barren land, and provide some guidance for the vegetation restoration practices in the small watersheds hosting major events.

1. Introduction

Ecosystems provide human beings with necessary raw materials for production and living and also serve as the basis for the life system on Earth [1]. In terrestrial ecosystems, the hydrological cycle can reflect ecosystem health status since it is important to ecosystem productivity and plays a decisive role in nutrient cycling [2]. For the hydrological cycle of terrestrial ecosystems, especially the spatial and temporal distribution of water resources, land use change is one of the most important factors that can affect the regional ecosystem services and pose ecological risk [3,4].
The hydrological processes of an ecosystem are closely correlated to the spatial and temporal patterns of land use [5,6]. As such, regional land use transformation between different types of land such as arable, forest, shrub, residential, and barren land often induce significant changes in hydrological characteristics. For example, forest-cutting in a watershed dominated by the land use of forest will increase the frequency and intensity of downstream floods, as the reduction of interception from the forest canopy leads to serious, uneven redistribution of precipitation [7]. In forest regions, higher leaf area index, deeper roots, lower albedo, and higher surface roughness all contribute to the increase of evapotranspiration and soil infiltration and thus the reduction of runoff and its total yield [8]. Therefore, vegetation destruction, including forest-cutting, may impair the functions of the local ecosystem and hydrological cycle [9].
In order to study hydrological characteristics and their evolution, many distributed hydrological physical models have been developed and are widely used [10]. Among them, the Soil and Water Assessment Tool (SWAT) developed by Dr. Jeff Arnold in the Agricultural Research Center of the US Department of Agriculture greatly simplifies the calculation of hydrological processes by introducing the concept of hydrological response units (HRU) instead of grid calculation [11]. This is also why the SWAT model has been widely used in long-term simulations of large-scale watersheds [12,13]. For example, Wang et al. used the SWAT model to simulate the Yellow River source basin from 1975 to 2012 and analyzed the applicability of the model to the long-term sequence of the Yellow River source basin [14]. To investigate the impacts of rainfall on local flood disasters, Mo et al. simulated the Jiahe River Basin in Ningxia for five years by SWAT model and demonstrated the applicability of SWAT on long-term runoff simulation [15]. Sertel et al. found that land use change, especially urban development, affected the hydrological processes of Buyukchemsey River Basin in Istanbul with a 40-year model study [16]. With the development of remote sensing technology and the improvement of various basic databases, the SWAT model has also been widely used and rapidly developed in more research fields such as water quality and quantity prediction, pollutant migration and transformation analysis, etc. [17].
On 31 July 2015, the International Olympic Committee announced that Beijing and neighboring city Zhangjiakou in Hebei province had successfully applied for hosting the 2022 Winter Olympic Games [18]. In order to apply for and hold such major international events, some cities in China and other countries have put great effort into projects such as large-scale greening and engineering construction in the past years, which has brought great changes to land use. The impacts these changes will bring to regional runoff yield and methods for mitigating their effects are problems of research value. In this research, the SWAT model was applied to the 118 km2 small watershed of the core area for the 2022 Winter Olympic Games in Zhangjiakou City to clarify the response of runoff yield to the comprehensive changes in land use from grassland towards two extreme directions of forest land and residential and barren land. On this basis, the present study also attempted to summarize the effects of Olympic constructions on runoff conservation, which may be of practical significance to the ecological restoration project in similar watersheds.

2. Materials and Methods

2.1. Study Area

The Zhangjiakou competition area of the 2022 Winter Olympic Games is located in Chongli district and will host snow events including two major events, six subitems, and 51 minor events. Since 2016, large-scale construction has been carried out in the core area of the Zhangjiakou competition area, such as afforestation, stadiums, snow trails, etc. The small watershed of the core area of the Zhangjiakou competition area (115.33–115.52° E, 40.87–40.98° N), which is located in the upper area of the Taizicheng River, was therefore selected as the study area for this research (Figure 1).
This area belongs to the continental monsoon climate of a cold temperate zone with an average annual precipitation of 426.8 mm and temperature of 7.5 °C. According to the local meteorological data, the precipitation is mainly concentrated from June to September, accounting for 80% of the annual total. The study area is a relatively closed, small watershed with an area of 118 km2. The altitude range of the study area is 1334–2164 m, and the outlet of the small watershed is located at 40.91° N, 115.33° E near Mazhangzi Village. Based on the water resources evaluation data of Hebei Province and Zhangjiakou City, the average annual runoff depth in the study area is 35 mm with a variation coefficient (Cv) of 0.6 [19,20].

2.2. Data

2.2.1. DEM and Sub-Basin Division
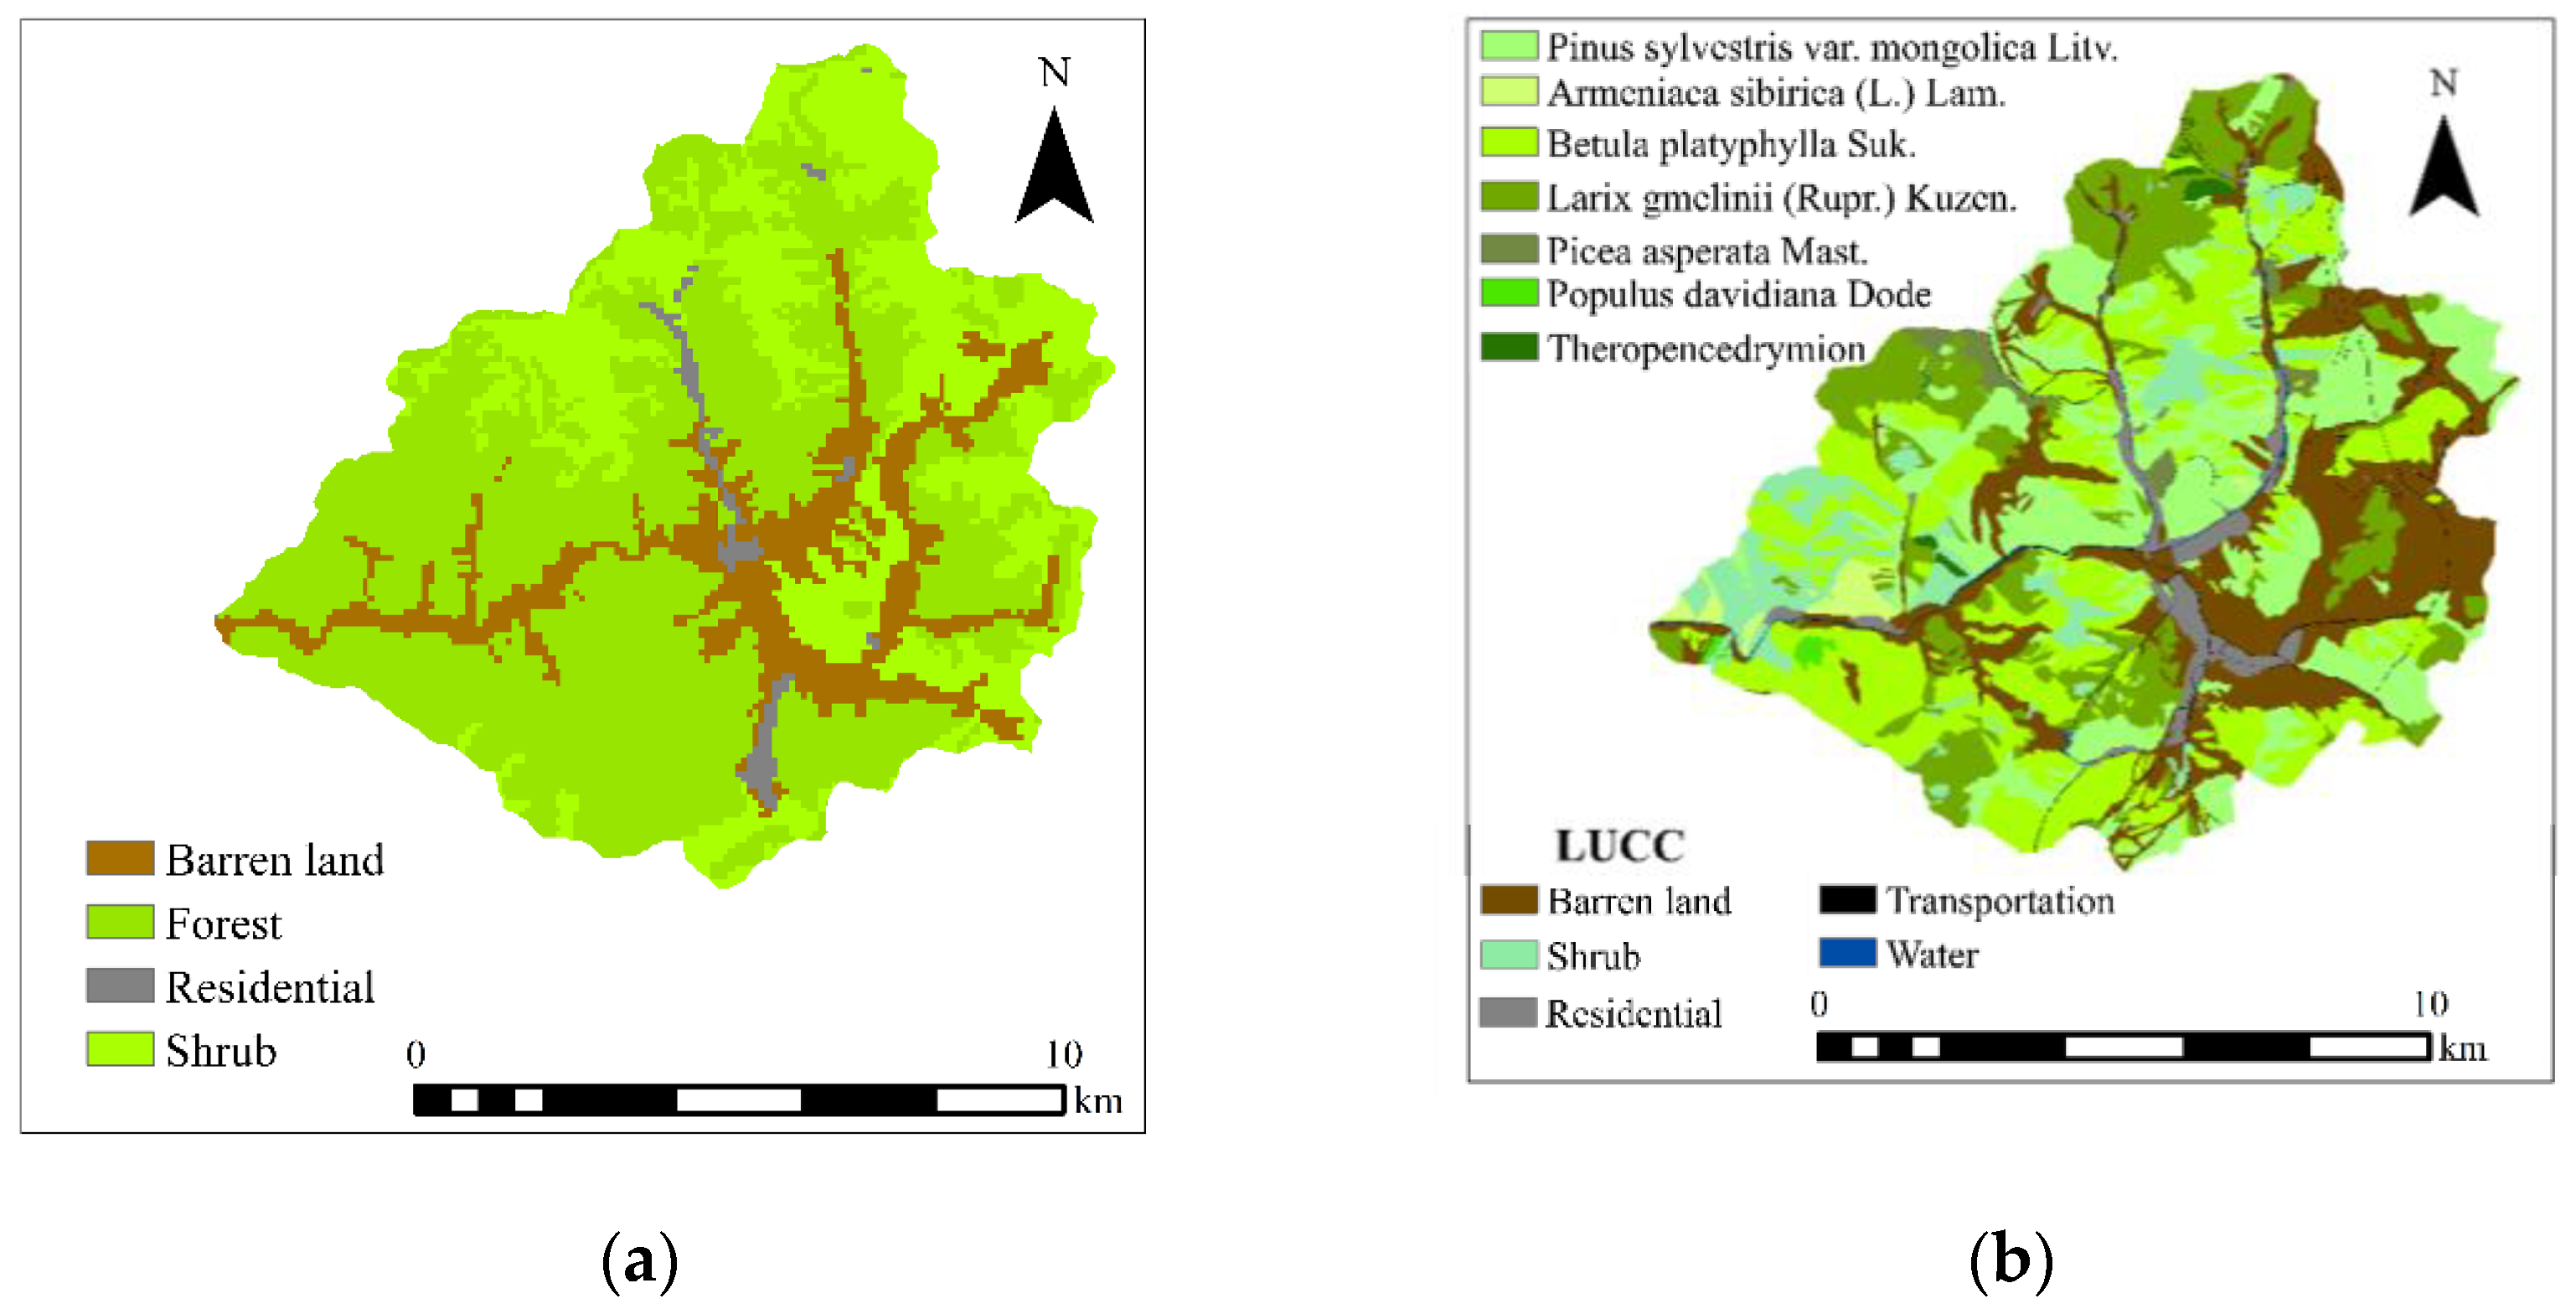
The Digital Elevation Map (DEM) utilized in the study was obtained from the data platform of Geospatial Data Cloud, Computer Network Information Center, Chinese Academy of Sciences [21]. This data set was processed from Aster GDEM version 1 (V1) with a spatial resolution of 30 × 30 m. Its projection format is UTM/WGS84. Based on the DEM, the small watershed studied was divided into 95 sub-basins (Figure 1). In the division processes, the catchment threshold of the river network division was defined as 0.6 km2 since the study area is a small watershed.

2.2.2. Land Use Map

In order to investigate the response of runoff yield to land use changes in the core area of the 2022 Winter Olympic Games in Zhangjiakou City, the land use map before (2015) and after (2019) large-scale Olympic constructions were utilized in this research. The land use map in 2015 was provided by Zhangjiakou Municipal Government with a resolution of 100 × 100 m (Figure 2a). The land use map in 2019 was drawn based on satellite images and a field survey. The satellite images are sourced from the CCRSDA (China Centre for Resources Satellite Data and Application). The field survey for different landscape patches was carried out with handle GPS. By combining the satellite images and field survey results, a vector map of regional land cover was then drawn, in which the vegetation cover type could be identified in terms of tree species. At last, the vector map was converted into the land use map in 2019 matching the requirements of the SWAT model by projection transformation (Figure 2b).
Corresponding to the land use map in Figure 2a,b, the area proportions of different land use types in 2015 and 2019 were shown in Table 1.
To analyze the land use changes more intuitively, the area proportions of different land use types in 2015 and 2019 were plotted and compared in Figure 3. In the figure, the land use types of different tree species in 2019 were uniformly classified into forest. In addition, 0.46 km2 of water area unidentified in 2015 due to lower resolution only accounted for 0.39% of the total area. It can be seen that land use changed significantly from 2015 to 2019. The most significant change was that the shrub land decreased by 23.56 km2 (accounting for 20.00% of the total study area) of the total area from 31.89 km2 (27.06%) in 2015 to 8.33 km2 (7.07%) in 2019. Of this, 12.53 km2 (10.63%) of shrub land were transformed into forest land, while the other 8.65 km2 (7.34%) and 1.92 km2 (1.63%) became barren and residential land respectively. Obviously, large-scale afforestation was carried out to improve the ecological environment and landscape in the study area. The area transformed into barren and residential land was mainly used for the construction of snow trails and Olympic venues, correspondingly.

2.2.3. Soil Data

The soil data was extracted from the China Soil Map Based Harmonized World Soil Database (HWSD) (v1.1) provided by the National Tibetan Plateau Data Center [22]. HWSD was established by the Food and Agriculture Organization of the United Nations (FAO) and the International Institute for Applied Systems Analysis, Vienna (IIASA) [23]. In HWSD, the data source in China is the 1:1,000,000 soil data from the 2nd national land survey provided by Institute of Soil Science, Chinese Academy of Sciences. Some of the soil physical and chemical parameters were calculated by Soil Plant Atmosphere Water (SPAW), developed by Washington State University, and reorganized into the soil database according to the requirements of the SWAT model.

2.2.4. Meteorological and Hydrological Data
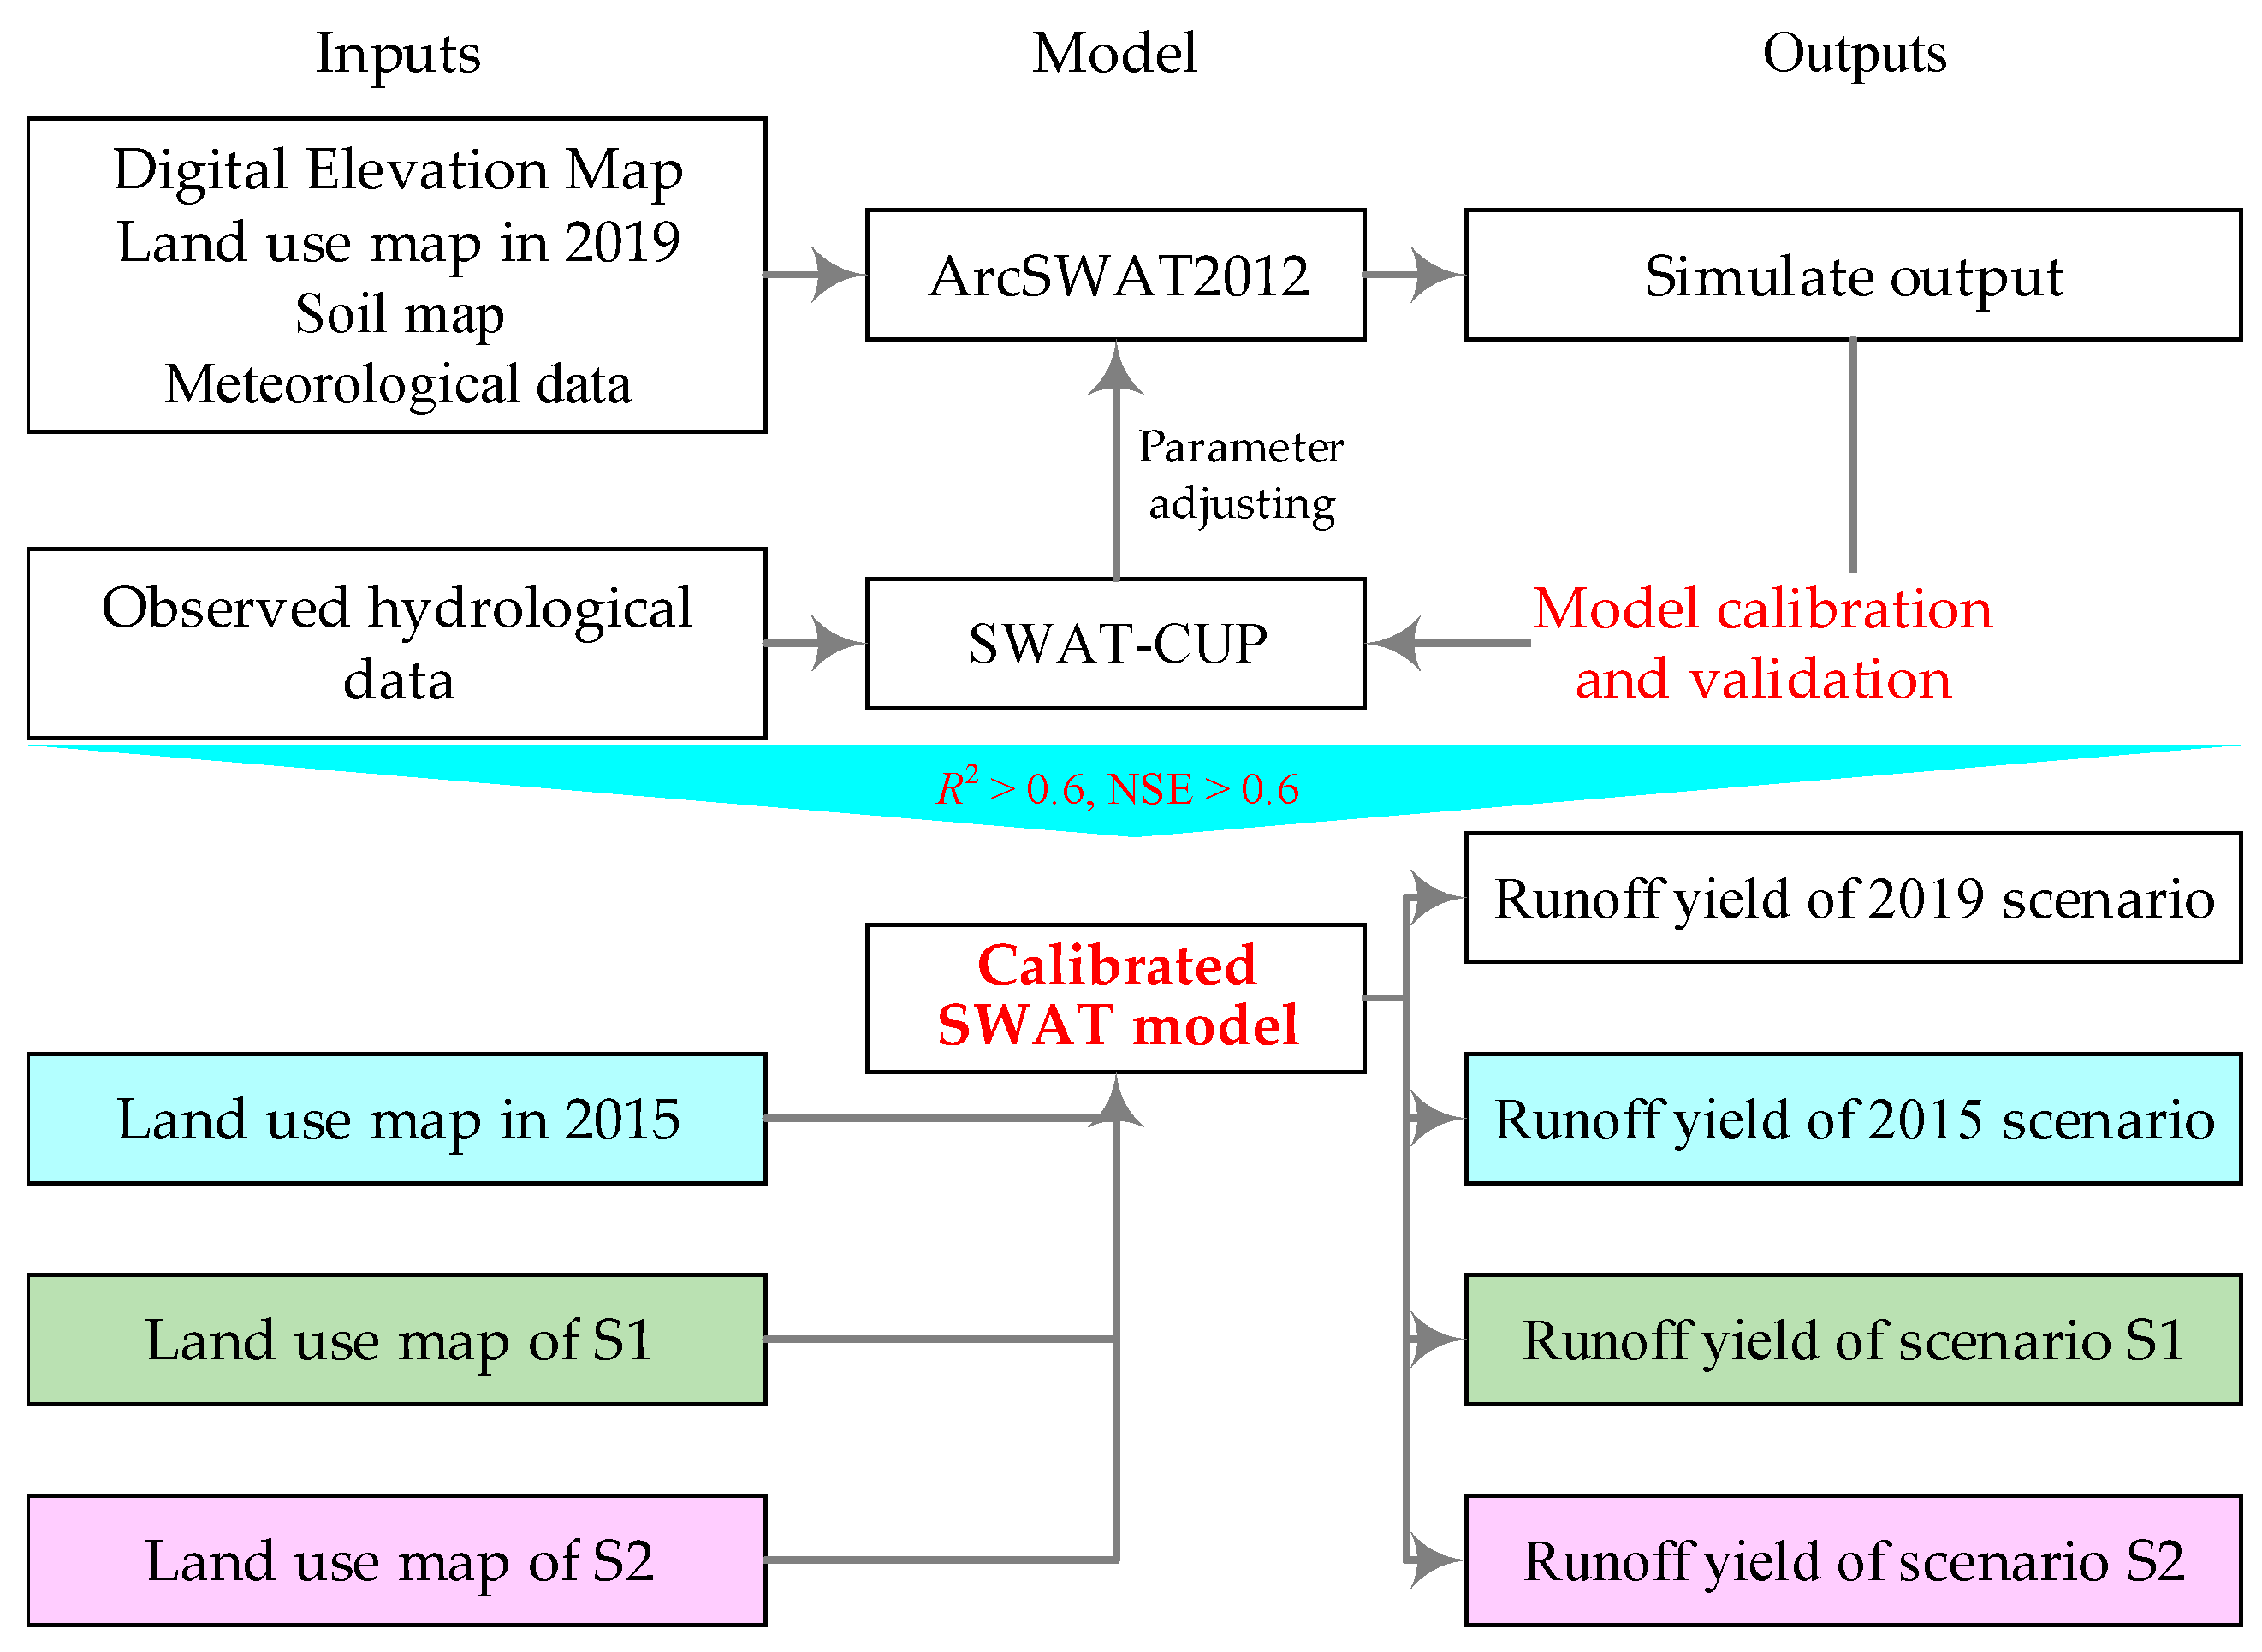
The meteorological data required in this research included the daily average values of wind speed, humidity, temperature, atmospheric pressure, solar radiation, the daily maximum and minimum temperature, and the daily precipitation, etc. from 1 January 2017 to 31 December 2019. The data from 2017 and 2018 were downloaded from the China Meteorological Assimilation Driving Datasets for the SWAT model (CMADS, http://www.cmads.org/ (accessed on 11 November 2020)), where the daily data of four virtual stations around the studied small watershed were selected. The daily data from 2019 came from the Meteorological Station of Chongli District and were firstly inverted to the above four stations according to the geospatial statistical law. Then, these data were interpolated to a grid scale matching the requirements of SWAT model. The longitude, latitude, and altitude of these stations are shown in Table 2.
For the hydrological data, the runoff data at some key points in the river network was necessary to calibrate and validate the model. In this research, three monitoring points were set in the upstream, midstream, and downstream area of the small watershed where the flow discharge (Q, m3/s) was observed by the combination of on-site manual monitoring and on-line automatic monitoring. The upstream and midstream monitoring points were respectively located at the outlets of #6 and #52 sub-basins, while the downstream monitoring point at the outlet of #73 sub-basin also represented the total outlet of the study area (Figure 1). At all these three points, the flow discharge was manually monitored monthly by Flow Tracker 2 (FT2, SonTek, San Diego, CA, USA) with mid-section method. At the upstream point, a Parshall flume and an open-channel Ultrasonic Flowmeter for (ZNBY-CSB, Beijing Zhong Neng Bo Yu Sensing Technology Co., Ltd., Beijing, China) were set to automatically monitor the flow discharge minute-by-minute. Since the #6 sub-basin where the upstream monitoring point was located was in a near-natural state and there was little human interference, the monitored data at this point was therefore of significance to model establishment. However, it should be noted that the monitored data at the point was only used to assist validation due to its discontinuity induced by freezing period. Besides, the parameter of flow discharge was involved to reflect runoff yield in further analyses.

2.3. Methodology

As mentioned in Section 2.2.3, the soil moisture calculation module in SPAW was used to calculate the soil parameters including Texture (TEXTURE), Available Water (SOL_AWC), Sat. Hydraulic Con. (SOL_K) and Matric Bulk Density (SOL_BD), which were necessary to establish the soil database of SWAT.
Then, ArcSWAT2012 on ArcGIS platform was utilized to complete the establishment of the SWAT model and the numerical simulation of the runoff yield in the study area [24,25,26]. According to the research objectives, the hydrological process sub-model in SWAT that aimed to simulate the runoff yield and concentration processes was at the core of this research.
In the model calibration and validation phases, parameter sensitivity analysis was performed by SWAT-CUP to improve the simulation accuracy of the model (https://swat.tamu.edu/software/swat-cup (accessed on 26 June 2019)). In SWAT-CUP, the SUFI-2 algorithm can effectively solve the issues of complicated parameter calibration and poor convergence effect of the SCE (shuffled complex evolution) algorithm in the SWAT model. It can also visualize the calibrated parameter range by the 95PPU (95 percent prediction uncertainty) diagram of simulated and measured values, so as to seek the optimal combination of different parameters for best simulation effects [27]. Finally, the coefficient of determination (R2) and Nash–Sutcliffe efficiency coefficient (NSE) were taken as the performance metrics to evaluate the accuracy and rationality of the model. A flowchart of the establishment and operation processes for the SWAT model in this study is shown in Figure 4.

3. Results

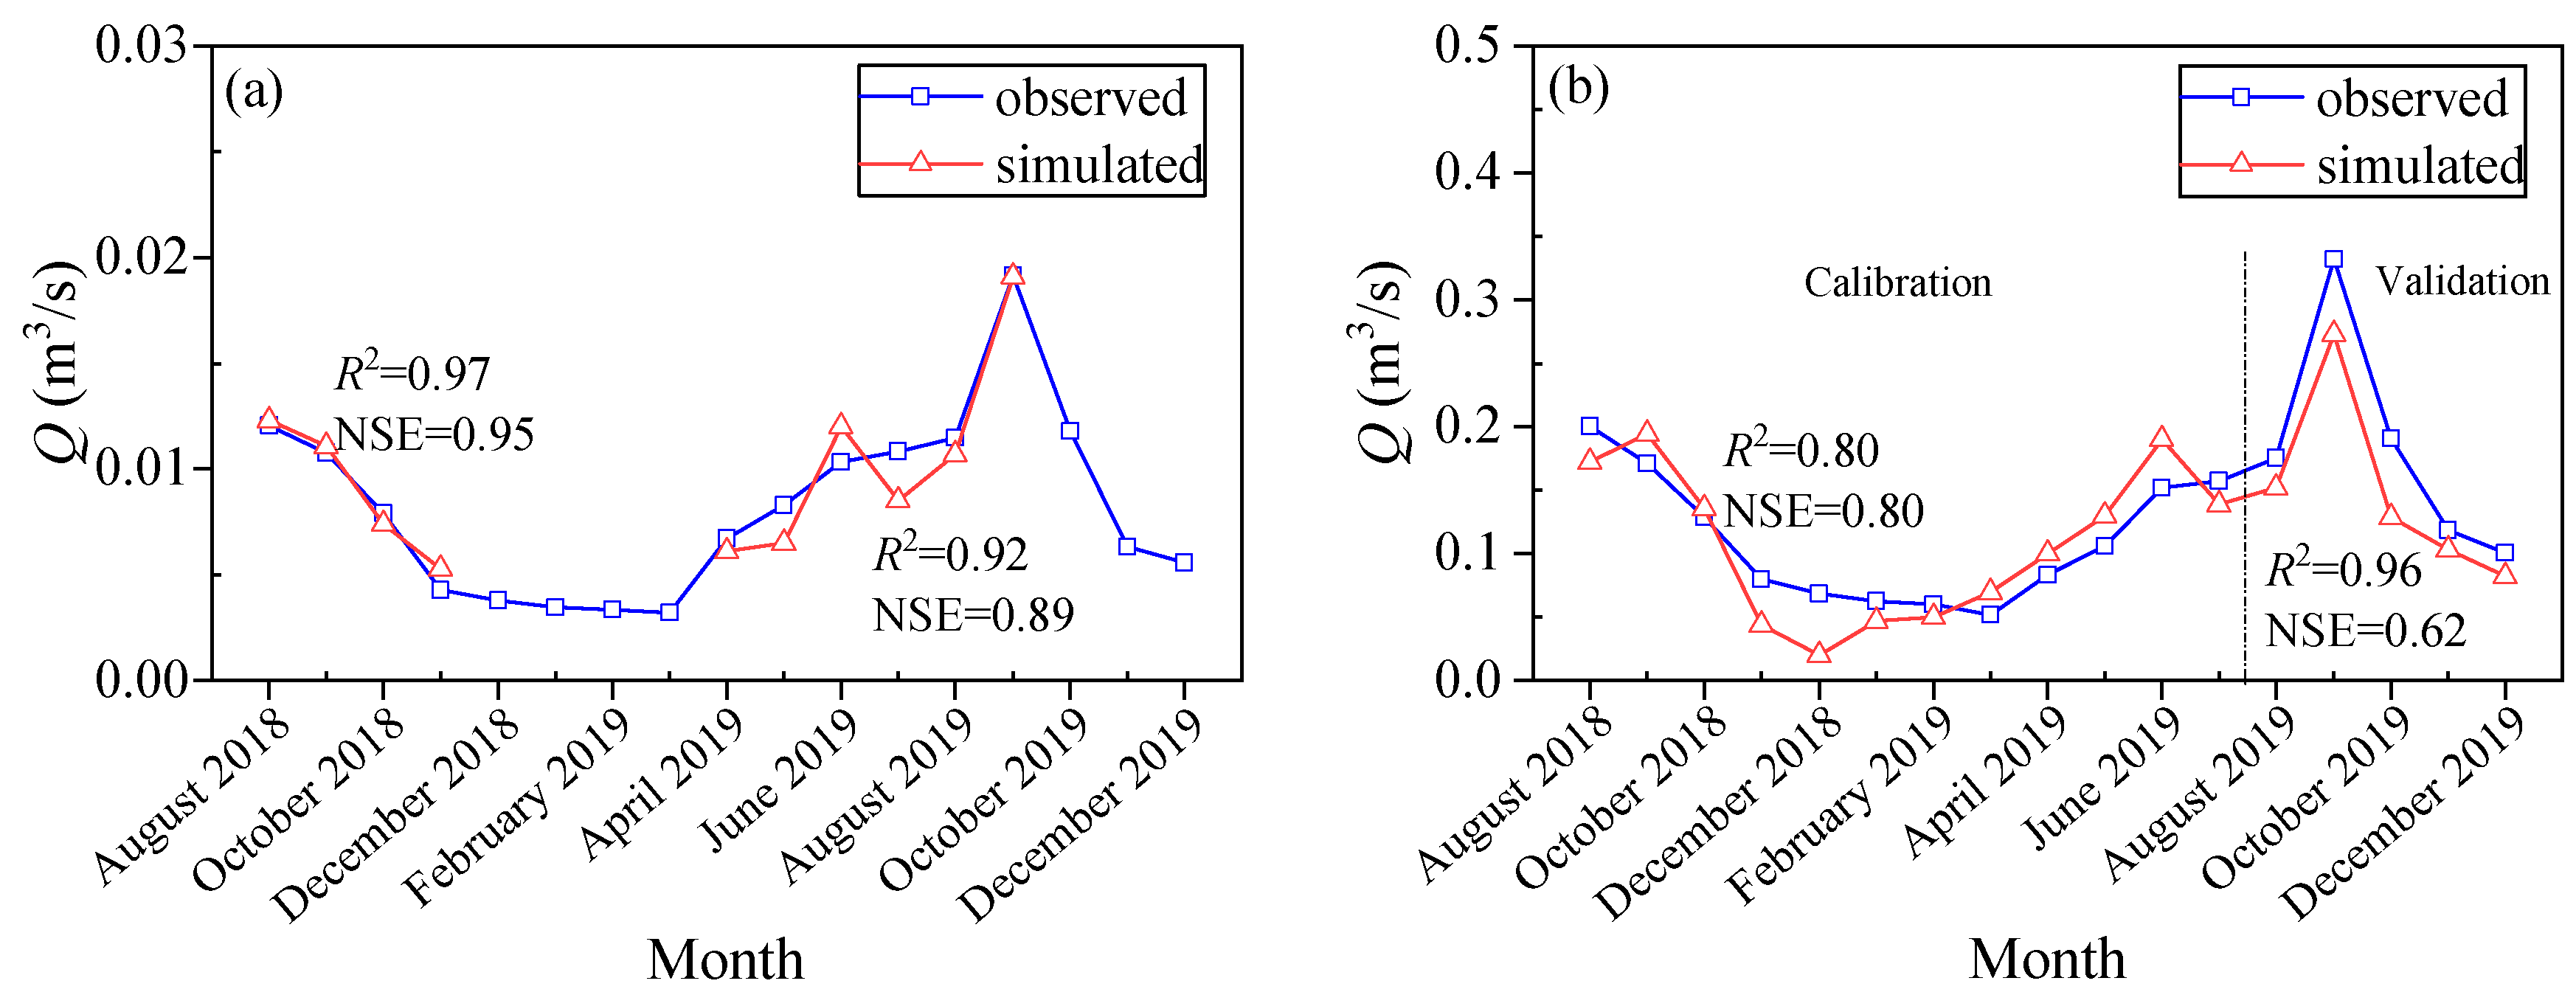
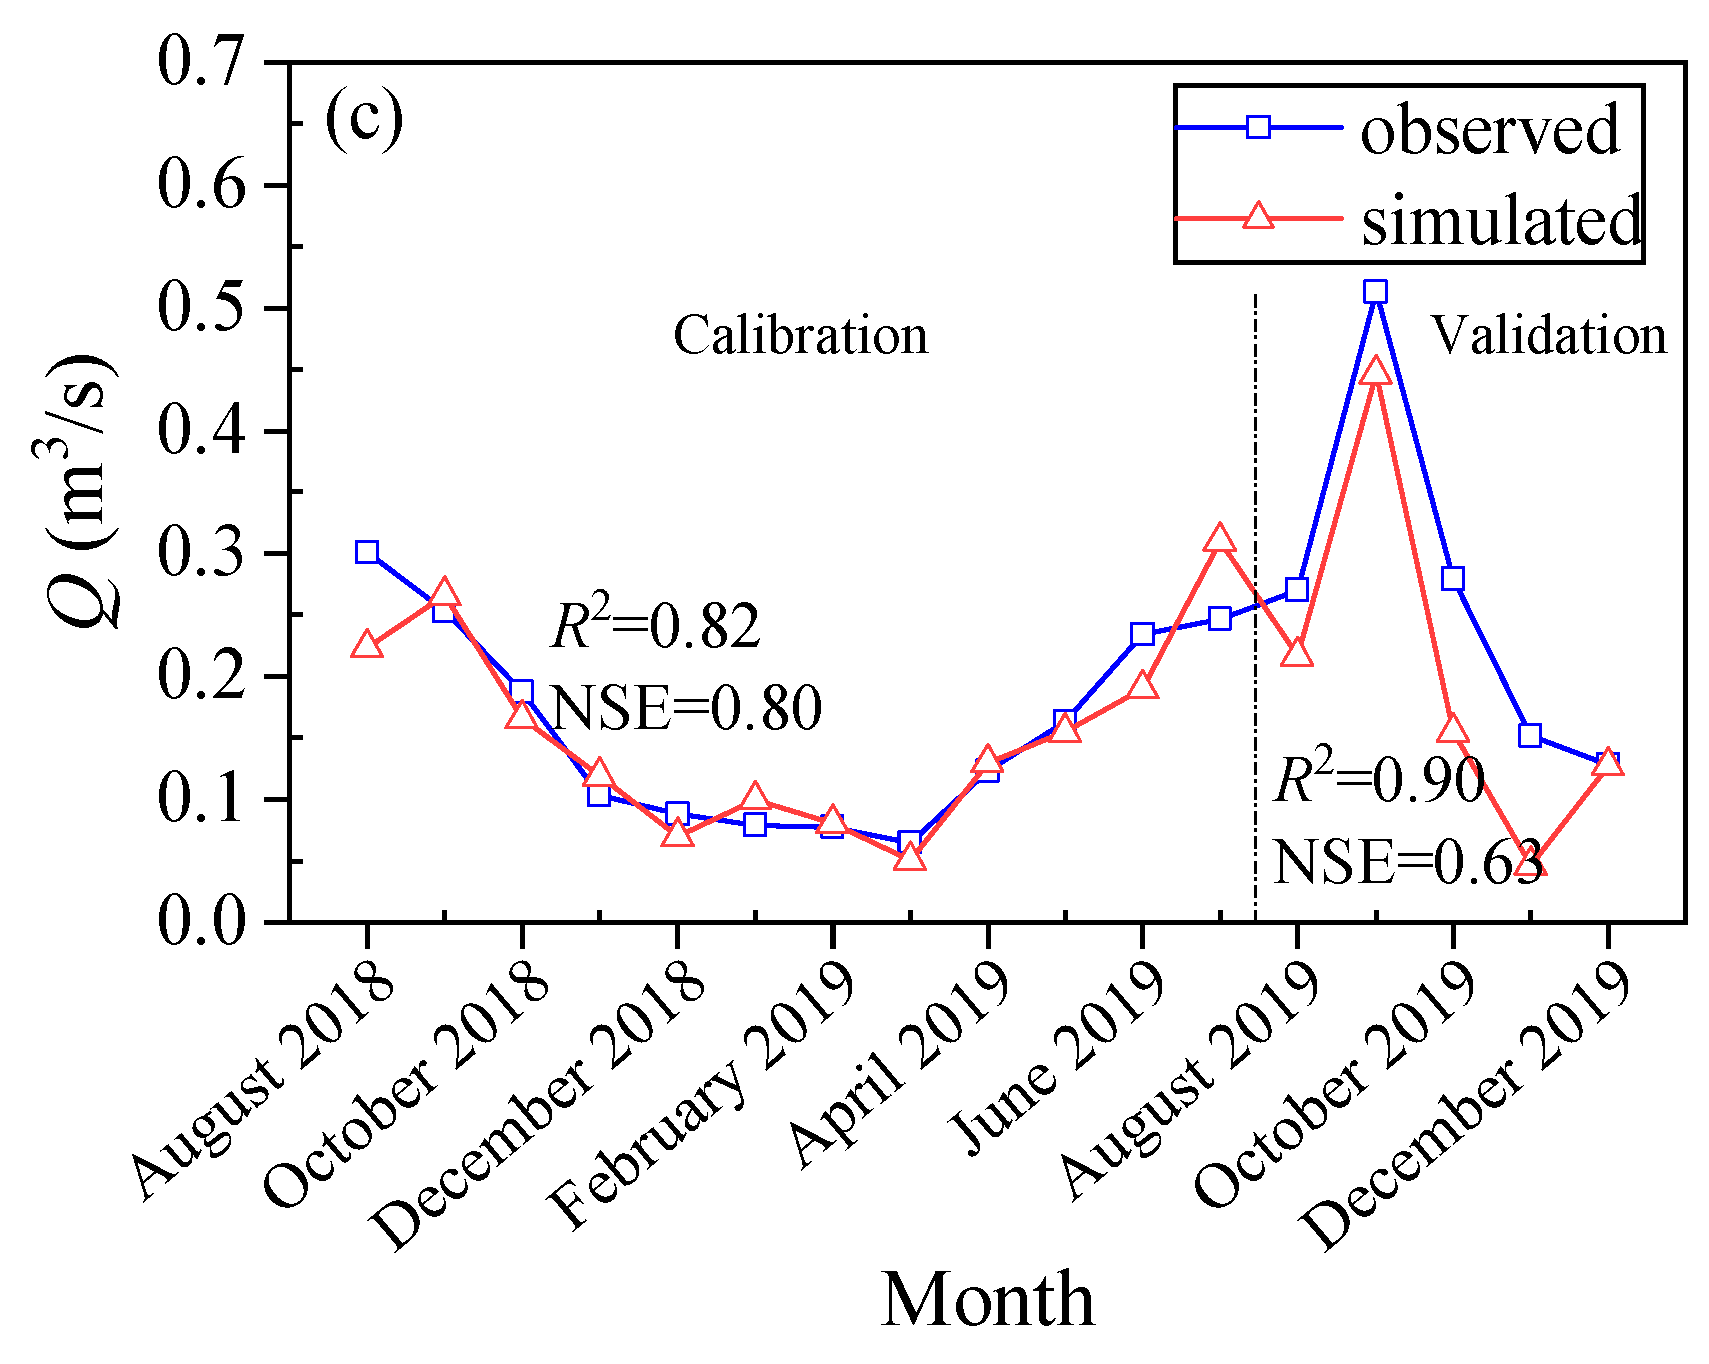
3.1. Calibration and Validation Results of SWAT Model

Based on the basic data, a SWAT model for the small watershed studied was established, set up, calibrated, and validated. A natural year before the calibration and validation periods (1 January to 31 December in 2017) was taken as the set-up period for the established model (NYSKIP, number of years to skip output printing/summarization). For the midstream and downstream (outlet) monitoring points, the whole monitoring period was divided into a calibration period (1 August to 31 July in 2018) and a validation period (1 August to 31 December in 2019). In the calibration period, the model was calibrated by SWAT-CUP. It should be noticed that the monitored data of the upstream monitoring point only participated in the validation, but not in the calibration, due to the discontinuity induced by the freezing period (December 2018–March 2019). The calibration and validation results of the upstream, midstream, and downstream (outlet) monitoring points are shown in Figure 5a–c, respectively.
For both the calibration and validation periods of the model, R2 and NSE were calculated to evaluate the accuracy and rationality of the model. If both R2 > 0.50 and NSE > 0.50 held simultaneously at all three monitoring points in the calibrated period, the model was considered as reasonable [27]. Of course, the calibration results of the model are better if R2 and NSE are larger. The results showed high effectivity of the model calibration (R2 > 0.80 and NSE > 0.80) for both the midstream and downstream (outlet) points. For the model validation, it can be found that the model presented high rationality and efficiency (R2 > 0.90, NSE > 0.62) for determining between the validation period of the midstream and downstream (outlet) points and the periods before and after the freezing period (effective monitoring period) of the upstream point. Then, the calibrated and validated SWAT model for the studied small watershed was involved to analyze the response of runoff yield to land use before and after large-scale Olympic construction.

3.2. The Response of Runoff Yield to Land Use Changes

In order to investigate the response of the runoff yield in the study area to land use changes before and after large-scale Olympic construction, the land use map from 2015 was imported into the established SWAT model with the remaining data and parameters unchanged. The simulation results of flow discharge at the outlet of the study area were then plotted in Figure 6 to reflect the runoff yield and was compared with the results from 2019.
As shown in the figure, the temporal variation tendencies of the flow discharge at the outlet of the study area were similar for the land use scenarios from 2015 and 2019. Furthermore, the flow discharge and therefore runoff yield change from 2015 to 2019 was not obvious, as the average variation ratio was only 5.1%. According to the calculation, the average simulated flow discharge values were 0.1947 and 0.1848 m3/s, corresponding to 2015 and 2019 land use scenarios. A difference significance test also revealed that there was no significant difference (p = 0.87 > 0.05) between the simulated results before (2015) and after (2019) large-scale Olympic construction.

4. Discussion

Previous studies have shown that hydrological parameters such as runoff yield are sensitive to land use change, especially the change of vegetation cover [28,29,30,31]. Why has the runoff yield of the study area changed little while the land use has changed significantly from 2015 to 2019? As presented in Section 2.2.2, the most significant change in land use was that 20.00% of the total area (23.56 km2) of the shrub land changed into other land use types. In these changed areas, the area changed from shrub land to forest land was 12.53 km2, accounting for 10.63% of the total study area, while 11.03 km2 (9.36%) of the total study area changed into residential and barren land (snow track). This special land use change pattern must be responsible for the insignificant runoff yield change since the other land use changes were negligible. In the changed area of shrub land, 53.18% changed into forest with high water conservation capacity while 46.82% changed into residential and barren land with low water conservation capacity. Therefore, the neutralization of the effects of these two land use directions on water conservation capacity may be the basic cause of the insignificant runoff yield change phenomenon. In addition, it can be found that the scenario from 2019 had lower peak flow in wet season and higher steady flow in dry season in comparison with that of 2015, which meant that the large-scale afforestation brought beneficial effects for regional water conservation, such as increasing base flow and reducing flood peak.
In order to verify the conjecture of the reason for insignificant runoff yield change before and after large-scale Olympic construction, two extreme land use change scenarios were added for further simulation and analyses. In one, all the changed shrub land (23.56 km2) from 2015 to 2019 was assumed to have turned into forest land (S1), and the other one assumed that the change direction was to bare land (S2). The areas of different land use types for S1 and S2 were shown in Table 3.
The simulation results of flow discharge under the land use scenarios S1 and S2 were presented in Figure 7 and compared with the results in 2015. It can be seen that the variation curve of the flow discharge in 2015 was basically between the curves of S1 and S2, although their variation trends were similar. It can be calculated from Table 4 that the change rates of average annual runoff of S1 and S2 relative to that of 2015 were 31.12% and 25.06%, respectively.
If it is assumed that the change in runoff yield has quantitative relationships responsive to changes in land use, two runoff yield change coefficients corresponding to the land use changes from shrub land to forest land and barren land can be defined as a_FRST and a_BARR. These two coefficients represent the runoff yield change per unit area induced by land use change. According to the simulation results presented in Table 4, the following equations (Equations (1) and (2)) were easily established.
a_FRST × 23.56 km2 = 4.2290 × 10⁶ m3 − 6.1401 × 10⁶ m3
b_BARR × 23.56 km2 = 7.6790 × 10⁶ m3 − 6.1401 × 10⁶ m3
The values of these runoff yield change coefficients were therefore calculated as a_FRST = −8.1116 × 10⁴ m3/km2, b_BARR = 6.5321 × 10⁴ m3/km2. That is to say, the average annual runoff at the outlet of the study area would be reduced by 8.1116 × 10⁴ m3 if 1 km2 shrub land changed into forest land and would be increased by 6.5321 × 10⁴ m3 if the same area changed into barren land. This is consistent with the viewpoint of water conservation capacity of barren, shrub, and forest land in the literature [32,33]. Through a systematic study at 117 plots of forest and grassland, Nosetto et al. found that the forest area always evaporated more water (+80% on average) than grassland due to its cooler surface temperature and pointed out that more attention should be paid to this issue [30]. Santos et al. further pointed out that an increase in evaporation and a decrease of streamflow would be led by the replacement of pasture, range-grasses, and agriculture by forest [31]. In this study, the decrease of runoff yield of the watershed under the S1 scenario must be attributed to the increase of forest area, which reduced the rainfall inflow into the main channel by increasing transpiration rate and interception. Oppositely, as evapotranspiration decreases and soil infiltration increases, the conversion of forests to agricultural and urban uses was also found inducing an increase of streamflow by Santos et al. [31]. Githui et al. concluded that the removal of vegetation cover, especially forests, would increase the average runoff by reducing the evapotranspiration (interception and transpiration) [34]. As such, the decrease of vegetation cover in S2 scenario should be the main reason of the decrease of evapotranspiration and the increase of runoff yield, especially if the land use changed from shrub land to bare land.
Therefore, the changes of land use towards the two extreme directions of forest and bare land will inevitably lead to the offset of their hydrological impacts. Using the obtained values of a_FRST and b_BARR, the runoff yield change of the study area before (2015) and after (2019) large-scale Olympic construction can therefore be calculated based on the land use change data. That calculated result was as below.
a_FRST × 12.53 km2 + b_BARR × 11.03 km2 = −2.9589 × 10⁵ m3
Meanwhile, another value of the runoff yield change (−3.1221 × 10⁵ m3) from 2015 to 2019 can also be calculated with the simulation results presented in Section 3.2. It can be found that the deviation of the runoff yield change calculated by a_FRST and a_BARR was very small in comparison with that calculated by direct simulation with the model. The deviation was 1.6317 × 10⁴ m3 with a relative deviation rate of 5.23%, which further demonstrated the rationality not only of the runoff yield change coefficients a_FRST and a_BARR, but also the conjectured reason for insignificant runoff yield change before and after large-scale Olympic construction in Section 3.2. In the studied small watershed, the effects of land use changes from shrub land to forest land, barren, and residential land were indeed neutralized and induced an insignificant runoff yield change under significant land use changes.
Under the context of global warming, the impact mechanism of land use change on hydrological cycle is obviously more complex if the time scale is larger [35]. However, more in-depth research in this direction is of great significance to regional ecosystem health assessments, as well as afforestation and reforestation practices in response to climate change [36,37]. Regardless, the results of this study may provide some guidance to forest management and land use planning in similar major engineering construction areas from the perspective of protection and development.

5. Conclusions

In this study, the response of runoff yield to land use changes in the small watershed of the core area for the 2022 Winter Olympic Games in Zhangjiakou city was investigated with the SWAT model established based on the improved high-precision land use map. The main conclusions were as follows.
(1)
According to the calibration and validation results at the upstream, midstream, and downstream (outlet) points (R2 > 0.80, NSE > 0.62), the established SWAT model presented stable and reliable performance and was applicable to the studied small watershed.
(2)
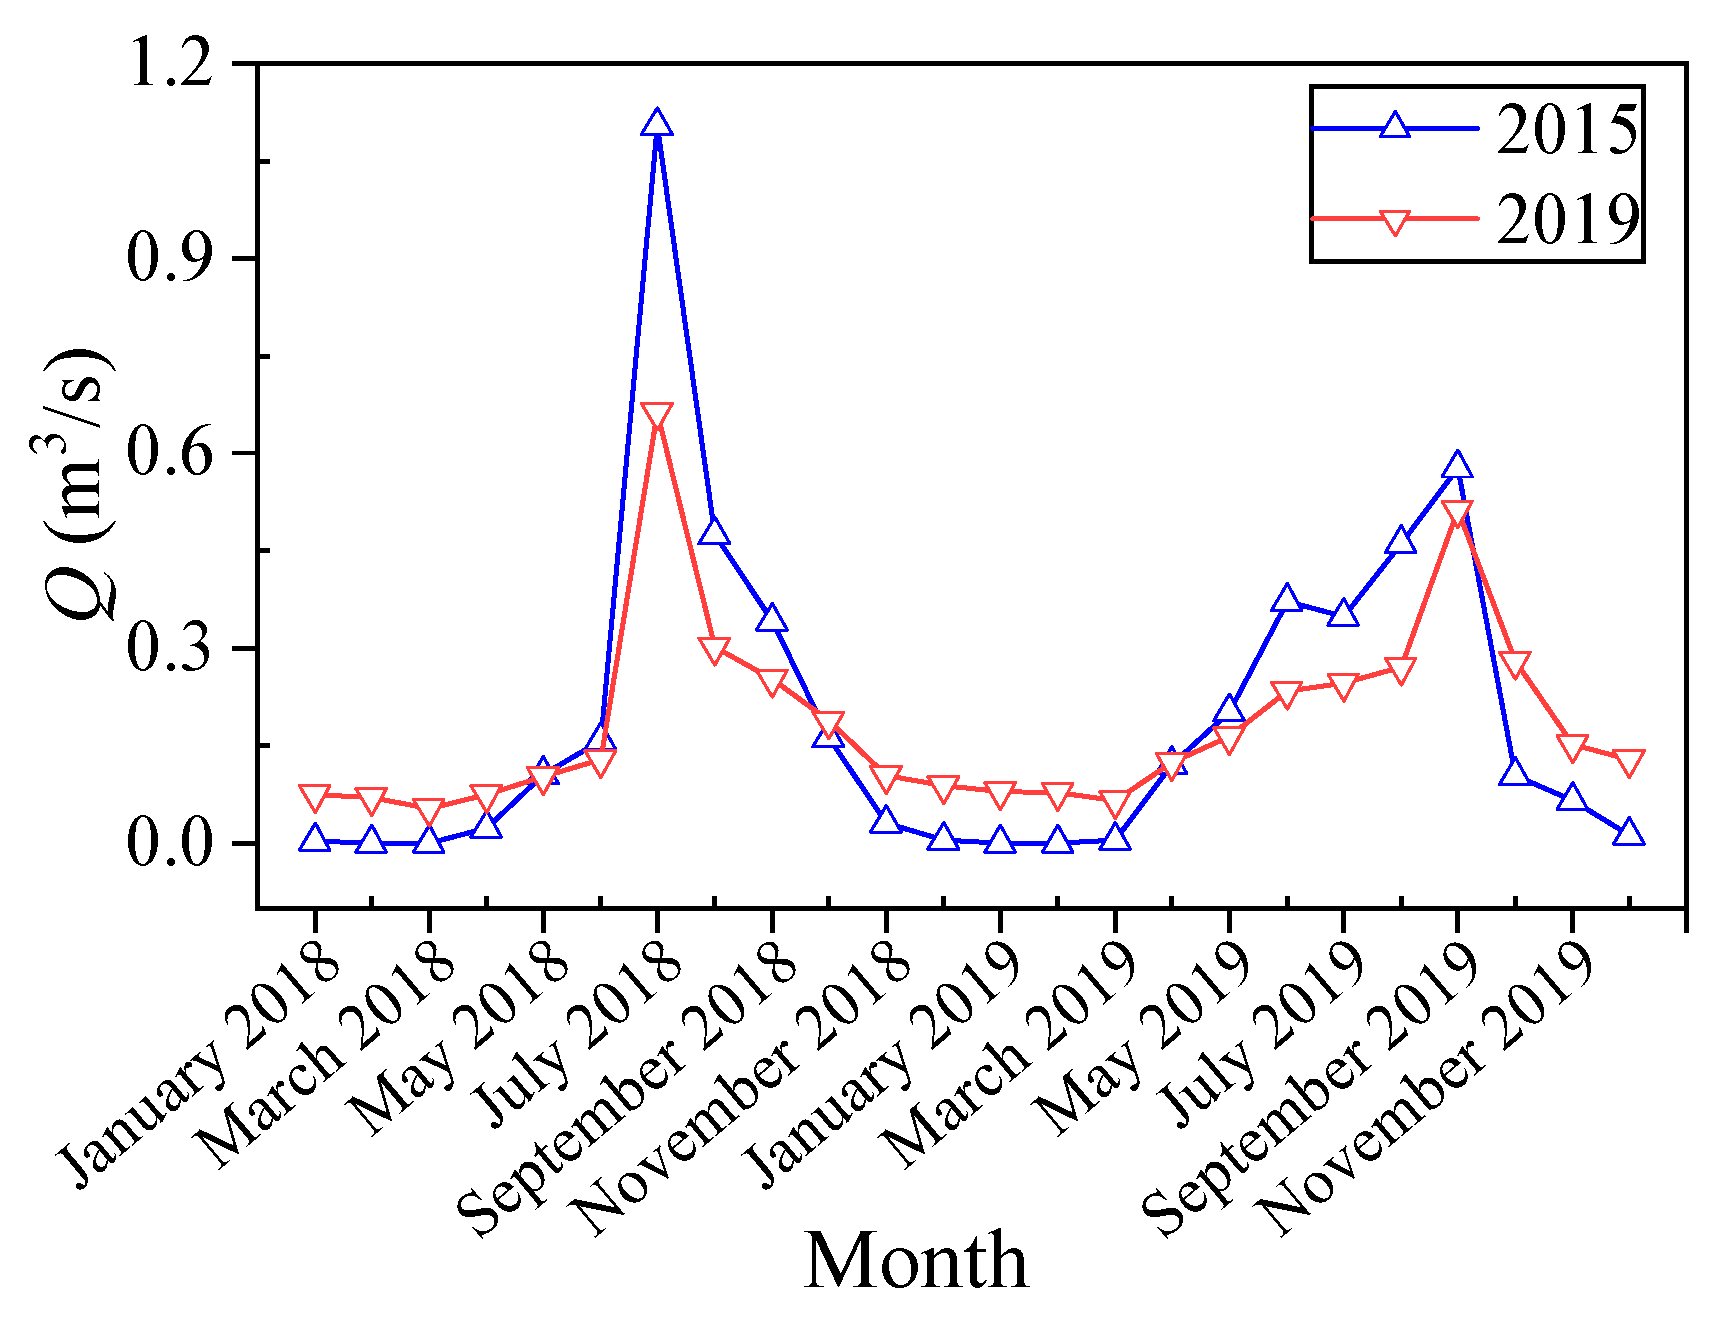
The large-scale Olympic constructions in the studied small watershed brought only −5.1% of the statistically insignificant changes in runoff yield (p = 0.87 > 0.05) and therefore coordinated the relationship between protection and development from the perspective of water resources.
(3)
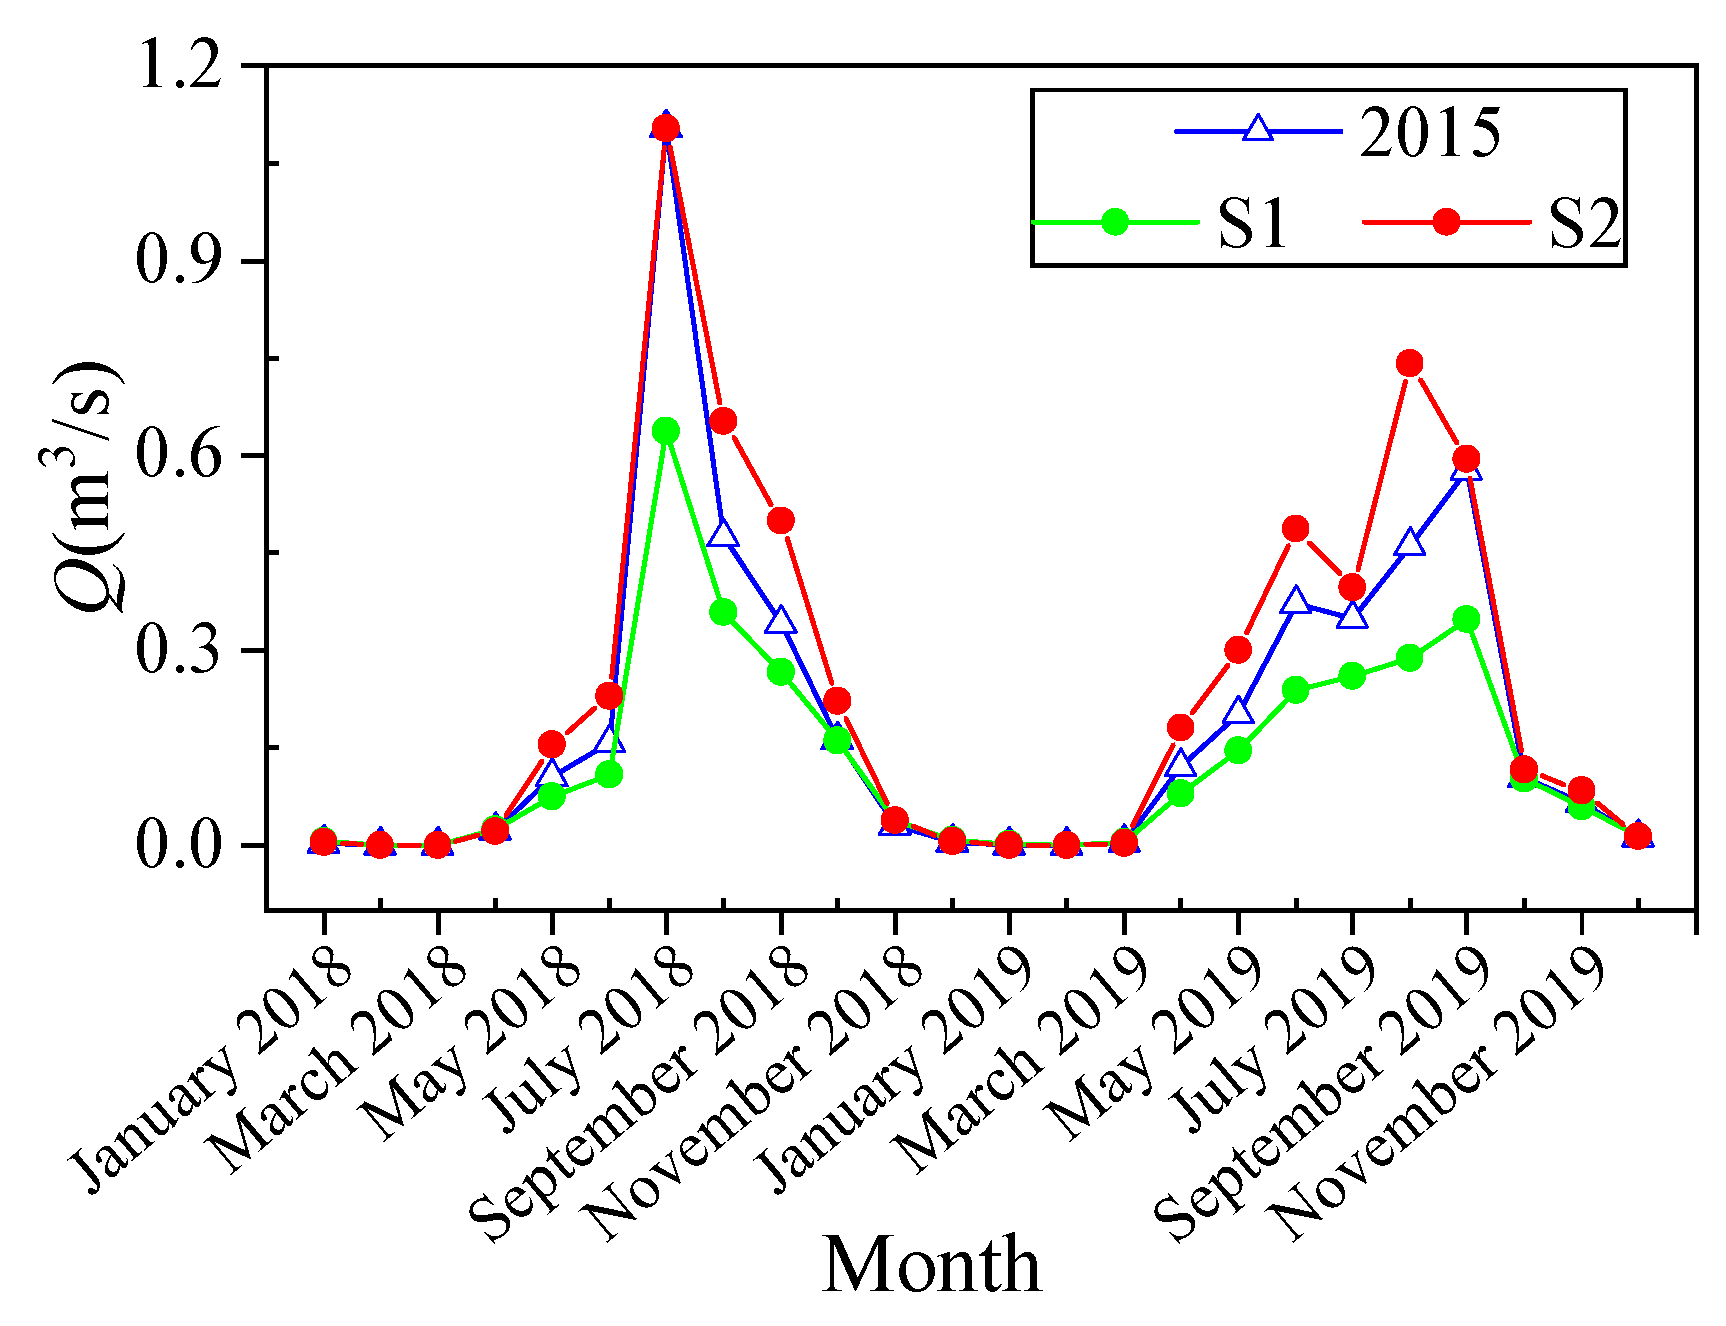
By adding two extreme land use change scenarios, the neutralization effects of the land use changes from grassland to forest (with strong water conservation capacity) and residential and bare land (with poor water conservation capacity) demonstrated the main reason for the insignificant runoff yield change.
(4)
For the study area, two runoff yield change coefficients corresponding to the land use changes from shrub land to forest land and barren land were obtained as a_FRST = −8.1116 × 10⁴ m3/km2, b_BARR = 6.5321 × 10⁴ m3/km2.
The methods and results in this study may contribute to the comprehensive understanding of and more in-depth research on the effects of significant land use changes on the runoff yield in small watersheds. This study may also provide some guidance for vegetation planning and management to alleviate such hydrological responses, especially in small watersheds hosting major events. However, since the impacts of land use changes on other hydrological and ecological processes besides runoff yield were not involved in this study, further studies about these effects in small watersheds are necessary to assess potential regional ecological risks, such as migration and transformation of nutrients, stability of vegetation community, etc.

Author Contributions

Conceptualization, Z.W.; methodology, Z.W. and J.L.; validation, Z.W. and W.T.; formal analysis, S.Z., C.C., J.L. and X.L.; investigation, C.C., S.Z., J.L. and X.L.; data curation, Z.W. and X.L.; writing—original draft preparation, C.C., S.Z., Z.W. and J.L.; writing—review and editing, Z.W., W.T., T.H. and S.Z.; visualization, Z.W. and W.T.; project administration, Z.W.; funding acquisition, Z.W. and W.T. All authors have read and agreed to the published version of the manuscript.

Funding

This research was funded by the Chinese Major Science and Technology Program for Water Pollution Control and Treatment (No. 2017ZX07101002), and the Fundamental Research Funds for the Central Universities, (No. 2021MS047).

Data Availability Statement

The public data are freely available on the website or platform indicated, such as DEM and soil data. The other data can be provided upon request to the corresponding author.

Conflicts of Interest

The authors declare no conflict of interest.

References

  1. Eugenio, F.; Roberto, P. Forest and water: The value of native temperate forests in supplying water for human consumption: A comment. Ecol. Econ. 2008, 67, 153–156. [Google Scholar]
  2. Liu, S.R.; Sun, P.S.; Wen, Y.G. Comparative analysis of hydrological functions of major forest ecosystems in China. Chin. J. Plant Ecol. 2003, 27, 16–22. (In Chinese) [Google Scholar]
  3. Riwaz, K.A.; Mohanasundaram, S.; Sangam, S. Impacts of land-use changes on the groundwater recharge in the Ho Chi Minh City, Vietnam. Environ. Res. 2020, 185, 109440. [Google Scholar]
  4. Coulthard, T.J.; Macklin, M.G. How sensitive are river systems to climate and land-use changes? A model-based evaluation. J. Quat. Sci. 2001, 16, 347–351. [Google Scholar] [CrossRef]
  5. Gebremicael, T.G.; Mohamed, Y.A.; Betrie, G.D.; van der Zaag, P.; Teferi, E. Trend Analysis of runoff and sediment fluxes in the Upper Blue Nile Basin: A combined analysis of statistical tests, physically-based models and landuse maps. J. Hydrol. 2013, 482, 57–68. [Google Scholar] [CrossRef]
  6. Sajikumar, N.; Remya, R.S. Impact of land cover and land use change on runoff characteristics. J. Environ. Manag. 2015, 161, 460–468. [Google Scholar] [CrossRef]
  7. Wang, Y.N.; Wang, X.J.; Gao, X.W.; Li, Z.F. Canopy precipitation redistribution of typical forest vegetation in Baichazigou Watershed, Daqing Mountains of Inner Mongolia. J. Inn. Mong. For. Sci. Technol. 2017, 43, 6–9. (In Chinese) [Google Scholar]
  8. Geofrey, G.; Bernd, D.; Kristian, N.; Constanze, L.; Roderick, L.; Jackson, G.M.; Joy, A.O. Impact of climate and land use/land cover change on the water resources of a tropical inland valley catchment in Uganda, East Africa. Climate 2020, 8, 83. [Google Scholar]
  9. Lu, S.W.; Mao, F.L.; Ji, F.; Yu, X.X.; Rao, L.Y. The water resource conservation of forest ecosystem in China. Res. Soil Water Conserv. 2005, 12, 223–226. (In Chinese) [Google Scholar]
  10. Mou, L.T.; Philip, W.G.; Yang, X.Y.; James, H. A review of SWAT applications, performance and future needs for simulation of hydro-climatic extremes. Adv. Water Resour. 2020, 143, 103662. [Google Scholar]
  11. Yuan, L.; Sinshaw, T.; Forshay, K.J. Review of watershed-scale water quality and nonpoint source pollution models. Geosciences 2020, 10, 25. [Google Scholar] [CrossRef] [PubMed] [Green Version]
  12. Maria, R.F.; Francisca, C.A.; Maria, J.M.; Rui, R.; Maria, T.F. Long-term human-generated alterations of Tagus River: Effects of hydrological regulation and land-use changes in distinct river zones. Catena 2020, 188, 104466. [Google Scholar]
  13. Meng, X.Y.; Ji, X.N.; Liu, Z.H. Energy balance-based SWAT model to simulate the mountain snowmelt and runoff—Taking the application in Juntanghu Watershed (China) as an example. J. Mt. Sci. Engl. 2015, 12, 368–381. [Google Scholar] [CrossRef]
  14. Wang, M.Y.; Xie, H.W.; Zhao, J.; Wu, Y.P. The runoff simulation of the Yellow River Source Basin based on the SWAT model. J. Qinghai Univ. 2019, 37, 39–46. (In Chinese) [Google Scholar]
  15. Mo, C.; Zhang, M.; Ruan, Y.; Qin, J.; Wang, Y.; Sun, G.; Xing, Z. Accuracy analysis of IMERG satellite rainfall data and its application in long-term runoff simulation. Water 2020, 12, 2177. [Google Scholar] [CrossRef]
  16. Sertel, E.; Imamoglu, M.Z.; Cuceloglu, G.; Erturk, A. Impacts of land cover/use changes on hydrological processes in a rapidly urbanizing mid-latitude water supply catchment. Water 2019, 11, 1075. [Google Scholar] [CrossRef] [Green Version]
  17. Valentina, K.; Mike, W. Advances in water resources assessment with SWAT-an overview. Hydrol. Sci. J. 2015, 60, 771–783. [Google Scholar]
  18. Wang, M.; Shao, Y.; Jiang, Q.; Xiao, L.; Yan, H.; Gao, X.; Wang, L.; Liu, P. Impacts of climate change and human activity on the runoff changes in the Guishui River Basin. Land 2020, 9, 291. [Google Scholar] [CrossRef]
  19. Hebei Water Resources Department. Evaluation of Water Resources in Hebei Province; Hebei Water Resources Department: Shijiazhuang, China, 2006. (In Chinese)
  20. Zhangjiakou Water Resources Survey Bureau. Hydrology and Water Resources Manual of Zhangjiakou City, Hebei Province; Zhangjiakou Water Resources Survey Bureau: Zhangjiakou, China, 1998. (In Chinese) [Google Scholar]
  21. Geospatial Data Cloud Site, Computer Network Information Center, Chinese Academy of Sciences. Available online: http://www.gscloud.cn/sources (accessed on 27 November 2019).
  22. National Tibetan Plateau Data Center. Available online: http://data.tpdc.ac.cn/zh-hans/data (accessed on 17 September 2019).
  23. FAO; IIASA; ISRIC; ISSCAS; JRC. Harmonized World Soil Database (Version 1.2); FAO: Rome, Italy; IIASA: Laxenburg, Austria, 2012. [Google Scholar]
  24. Teklay, A.; Dile, Y.T.; Setegn, S.G.; Demissie, S.S.; Asfaw, D.H. Evaluation of static and dynamic land use data for watershed hydrologic process simulation: A case study in Gummara watershed, Ethiopia. Catena 2019, 172, 65–75. [Google Scholar] [CrossRef]
  25. Massetti, L.; Grassi, C.; Orlandini, S.; Napoli, M. Modelling hydrological processes in agricultural areas with complex topography. Agronomy 2020, 10, 750. [Google Scholar] [CrossRef]
  26. Aghsaei, H.; Dinan, N.M.; Moridi, A.; Asadolahi, Z.; Delavar, M.; Fohrer, N.; Wagner, P.D. Effects of dynamic land use/land cover change on water resources and sediment yield in the Anzali wetland catchment, Gilan, Iran. Sci. Total Environ. 2020, 712, 136449. [Google Scholar] [CrossRef] [PubMed]
  27. Abbaspour, K.C. SWAT-CUP 2012: SWAT Calibration and Uncertainty Programs—A User Manual; EAWAG: Zurich, Switzerland, 2014. [Google Scholar]
  28. Jin, X.; Jin, Y.; Mao, X. Land use/cover change effects on river basin hydrological processes based on a modified soil and water assessment tool: A case study of the Heihe river basin in northwest China’s arid region. Sustainability 2019, 11, 1072. [Google Scholar] [CrossRef] [Green Version]
  29. Kristian, N.; Bernd, D.; Mariele, E.; Britta, H.; Stefanie, S.; Frank, T. The impact of land use/land cover change (LULCC) on water resources in a tropical catchment in Tanzania under different climate change scenarios. Sustainability 2019, 11, 7083. [Google Scholar]
  30. Nosetto, M.D.; Jobbagy, E.G.; Paruelo, J.M. Land-use change and water losses: The case of grassland afforestation across a soil textural gradient in central Argentina. Glob. Chang. Biol. 2005, 11, 1101–1117. [Google Scholar] [CrossRef]
  31. Franciane, M.S.; Rodrigo, P.O.; José, A.D. Effects of land use changes on streamflow and sediment yield in Atibaia River Basin-SP, Brazil. Water 2020, 12, 1711. [Google Scholar]
  32. Öztürk, M.; Copty, N.K.; Saysel, A.K. Modeling the impact of land use change on the hydrology of a rural watershed. J. Hydrol. 2013, 497, 97–109. [Google Scholar] [CrossRef]
  33. Woldesenbet, T.A.; Elagib, N.A.; Ribbe, L.; Heinrich, J. Hydrological responses to land use/cover changes in the source region of the Upper Blue Nile Basin, Ethiopia. Sci. Total Environ. 2017, 575, 724–741. [Google Scholar] [CrossRef]
  34. Githui, F.; Mutua, F.; Bauwens, W. Estimating the impacts of land-cover change on runoff using the soil and water assessment tool (SWAT): Case study of Nzoia catchment, Kenya. Hydrol. Sci. J. 2009, 54, 899–908. [Google Scholar] [CrossRef]
  35. Xu, Z.; Man, X.; Cai, T.; Shang, Y. How potential evapotranspiration regulates the response of canopy transpiration to soil moisture and leaf area index of the Boreal Larch Forest in China. Forests 2022, 13, 571. [Google Scholar] [CrossRef]
  36. Li, C.; Fang, H. Assessment of climate change impacts on the streamflow for the Mun River in the Mekong Basin, Southeast Asia: Using SWAT model. Catena 2021, 201, 105199. [Google Scholar] [CrossRef]
  37. Pirro, E.D.; Sallustio, L.; Castellar, J.A.C.; Sgrigna, G.; Marchetti, M.; Lasserre, B. Facing multiple environmental challenges through maximizing the co-benefits of nature-based solutions at a national scale in Italy. Forests 2022, 13, 548. [Google Scholar] [CrossRef]
Figure 1. The study area and relevant DEM, sub-basins, and monitoring points.
Forests 13 00853 g001
Figure 2. The land use map of the study area in (a) 2015 and (b) 2019.
Forests 13 00853 g002
Figure 3. Land use changes of the study area from 2015 to 2019.
Forests 13 00853 g003
Figure 4. The flowchart of the SWAT model in the study.
Forests 13 00853 g004
Figure 5. Calibration and validation results based on land use scenario in 2019; (a) upstream point, (b) midstream point, (c) downstream (outlet) point.
Forests 13 00853 g005aForests 13 00853 g005b
Figure 6. The simulated flow discharge at the downstream (outlet) point under the land use scenarios of 2015 and 2019.
Forests 13 00853 g006
Figure 7. The simulated flow discharge at the downstream (outlet) point under the land use scenarios of S1, S2, and 2015.
Forests 13 00853 g007
Table 1. The area proportion of each land use type in 2015 and 2019 corresponding to Figure 2a,b.
20152019
Land Use TypeArea (km2)%Wat. AreaLand Use TypeArea (km2)%Wat. AreaLand Use TypeArea (km2)%Wat. Area
Barren land16.7014.17Barren land24.1220.47Populus davidiana Dode0.370.31
Forest67.2557.07Armeniaca sibirica (L.) Lam.1.541.31Theropencedrymion0.520.44
Shrub31.8927.06Betula platyphylla Suk.30.5625.93Shrub8.337.07
Residential2.001.70Larix gmelinii (Rupr.) Kuzen.19.1616.26Residential3.923.33
Picea asperata Mast.1.641.39Transportation1.231.04
Pinus sylvestris var. mongolica Litv.25.9922.06Water0.460.39
Table 2. The geographic information of the meteorological stations.
No.Longitude (°)Latitude (°)Altitude (m)Source
1115.2812540.781251557CMADS
2115.5312540.781251171CMADS
3115.2812541.031251514CMADS
4115.5312541.031251443CMADS
5115.2824740.961671249Chongli District
Table 3. The areas of different land use types for S1 and S2.
ScenariosS1S2
Land Use TypesArea
(km2)
Area Proportion (%)Area
(km2)
Area Proportion (%)
Barren land16.7014.1740.2634.17
Forest90.8177.0667.2557.07
Shrub8.337.078.337.07
Residential2.001.702.001.70
Table 4. The average flow discharge and average annual run off under the scenarios of S1, S2, 2015, and 2019.
ScenarioAverage Q (m3/s)Annual Runoff (m3)Change Rate (%)
S10.13414.2290 × 106−31.12
S20.24357.5497 × 10625.06
20150.19476.1401 × 106\
20190.18485.8279 × 106−5.1
Publisher’s Note: MDPI stays neutral with regard to jurisdictional claims in published maps and institutional affiliations.

