Article

Assessment of Drought Events in Southwest China in 2009/2010 Using Sun-Induced Chlorophyll Fluorescence

1
College of Urban and Environmental Sciences, Northwest University, Xi’an 710127, China
2
Institute of Qinling Mountains, Northwest University, Xi’an 710127, China
3
Yellow River Institute of Shaanxi Province, Xi’an 710127, China
4
The Research Center of Soil and Water Conservation and Ecological Environment, Chinese Academy of Sciences and Ministry of Education, Yangling 712100, China
*
Author to whom correspondence should be addressed.
Forests 2023, 14(1), 49; https://doi.org/10.3390/f14010049
Submission received: 27 November 2022 / Revised: 19 December 2022 / Accepted: 20 December 2022 / Published: 27 December 2022
(This article belongs to the Section Forest Inventory, Modeling and Remote Sensing)

Abstract

:
With the increasing trend of global warming, drought events frequently occur, which have an impact on human life and the environment. In this study, an extreme drought event in Southwest China in 2009/2010 was used as an example to explore the potential of using satellite observations of sun-induced chlorophyll fluorescence (SIF) for drought monitoring. The results indicated that the SIF observations show more proper responses to drought than EVI, which underestimated the losses by approximately 50%. The SIF reduction in this drought event (19% in March 2010 and 11% in May 2010) was more obvious than that of the enhanced vegetation index (EVI) (4% and 5%). The drought severity index (DSI) overestimates the drought during most dry months. SIF can be a reliable tool for monitoring drought in a timely and accurate manner. In addition, the significant correlation coefficient with SIF and ET (reaching 0.8 at the beginning and end of the drought stage), indicates the ability of SIF to reveal the interaction of carbon and water during drought, which provides us with ideas for future research on the terrestrial carbon–water cycle.

1. Introduction

With the trend of global warming, the probability of extreme weather events is increasing, and droughts and severe drought events are increasingly occurring [1]. According to the Intergovernmental Panel on Climate Change (IPCC) Sixth Assessment Report Working Group I report [2], in the first 20 years of the 21st century (2001–2020), the global average temperature was 0.99 °C higher than the 1850–1900 average, and the global average temperature during 2011–2020 was 1.09 °C higher than the 1850–1900 average. Among them, the land temperature increase rate is 1.59 °C. The report pointed out that as the global temperature rises, extremely high-temperature weather events are rapidly increasing in intensity and frequency. As climate warming intensifies, combined events of drought and heat waves may become more frequent [2]. Drought is considered to be one of the most severe economic disasters in the world [1]. Drought will affect the global carbon cycle and water cycle [3,4]. Globally, as temperatures continue to rise, extreme drought events and heat waves have reduced gross primary production (GPP), leading to a decrease in terrestrial carbon uptake [5,6,7].
Traditional vegetation indices (VIs), such as the normalized difference vegetation index (NDVI) and the enhanced vegetation index (EVI), have been used by many researchers in the past few decades to assess vegetation conditions under thermal and water stress. However, traditional VIs are associated with underlying photosynthesis and only reflect changes in pigment content, not changes in instantaneous photosynthetic rate [8,9,10]. Therefore, traditional VIs may be weak in monitoring rapid changes in photosynthesis in response to environmental stress. For example, some studies have shown that the reaction of NDVI to precipitation changes usually lags approximately 10–60 days, limiting its applicability in early drought detection [11].
Recently, emerging sun-induced chlorophyll fluorescence (SIF) as a direct proxy of photosynthesis has provided a new method for assessing drought and heat waves. In the past decade, the emergence of SIF has greatly improved the ability of researchers to monitor photosynthesis in large areas of vegetation [6,12,13,14,15]. Sun-induced chlorophyll fluorescence is the red and far-red light (650–800 nm) released by the photosynthetic center after chlorophyll A absorbs shortwave light under natural light [11]. After drought stress, the chlorophyll content of vegetation generally decreases, and reflectance spectra and fluorescence measurements can capture these signals. Thus, SIF can be directly expressed as an actual photosynthesis process. The fluorescence signal is normally reflected earlier than the decline of chlorophyll, so it is easier to monitor the occurrence of early drought stress [6,16,17]. In recent years, satellite-borne solar-induced chlorophyll fluorescence has become a novel data source to monitor regional vegetation growth conditions and environmental stresses [11,17,18]. In farmland, Song’s study found that NDVI and EVI responded one month later than SIF when vegetation experienced drought [18]. Many studies have also confirmed the sensitive response of SIF to changes in environmental factors [5,6,16,17]. Li found that SIF had a stronger correlation with vapor pressure deficit (VPD) (R2 = 0.75) than EVI (R2 = 0.36) during drought [5]. SIF has also been confirmed to be related to soil moisture and evapotranspiration (ET) [17,19,20,21]. Pagan’s study found that SIF-derived evaporation stress shows a high correlation with the quill-tower estimates of the analyzed land surface model (LSM), indicating that SIF can be used to capture heterogeneous responses of vegetation without numerous parameterizations, leading to observed and accurate representations of evaporation stress [19]. Wang [22] compared the extreme drought events in Yunnan Province in 2009/2010 with the heatwave in Southern China in 2013, and the results showed that SIFyield was more sensitive to VPD and SWC than the EVI, revealing the potential of SIF satellite observation’s ability to accurately and timely monitor drought and heatwaves. In the Indian Indo-Gangetic Plains (IGP) region, Song [18] has found that SIF can capture the effects of SIF on heat stress in a large area of crops and assess the yield loss of wheat.
Extreme drought events frequently occur in Southwest China due to its complex terrain and high vegetation coverage. Since 2009, there have been four consecutive years of severe drought in some regions, with the overall characteristics of long duration, a wide range of impacts, and an extreme degree of drought, causing economic losses [7,8,9,10]. Therefore, it is necessary to strengthen drought monitoring in this area. Especially in the early stage of drought, the identification of drought can be taken as early as possible to reduce economic losses [1,9,10]. In addition, the vegetation type in the southwest is based on subtropical vegetation, and the vegetation density in the region is large [23]. The relationship between vegetation and ET and its influencing mechanism have rarely been mentioned in previous studies, which is critical for understanding the carbon–water interaction during drought in Southwest China. In this study, we aim to explore SIF’s ability to assess the 2009/2010 drought event and reveal the impact of vegetation on ET by using SIF to improve the understanding of the ecosystem carbon–water cycle. We primarily focus on the following questions: (1) Can SIF capture the drought adequately? (2) How did ET respond to the changes in the physiological state of vegetation detected by SIF in the 2009/2010 drought event?

2. Materials and Methods

2.1. Study Area

The targeted area is Yunnan, Guizhou, and Guangxi provinces in Southwest China (Figure 1a), with 806,900 km2. Southwest China is characterized by complex terrain structures, mainly plateaus, basins, and mountainous regions. The annual average temperature is between 0~24 °C and the annual precipitation of more than 900 mm [23,24]. The southwest area is prone to drought events in the fall and winter. The ecosystem is very fragile and vulnerable to human activities and climate change [25,26,27]. Regional vegetation types are mainly forest, cropland, and grassland (Figure 1b). The vegetation coverage rate in this region is very high, with more than 60% of the area being forested.

2.2. Meteorological Data

The monthly temperature (Tmpt) and precipitation (P) data with a 1 km resolution in China from 1981 to 2019 come from the National Earth System Science Data Center. Unit of precipitation is mm. Data can be obtained from the National Earth System Science Data Center, National Science and Technology Infrastructure of China (http://www.geodata.cn) (accessed on 25 December 2022).

2.3. Soil Moisture

Soil moisture data from 2000 to 2019 were collected from the European Space Agency’s Climate Change Initiative (ESA CCI) (https://www.esa-soilmoisture-cci.org) (accessed on 25 December 2022) with a spatial resolution of 0.25° and a temporal resolution of 1 day. For ESA CCI, satellites can cover the thin (0.5–5 cm) surface soil layer.

2.4. Evapotranspiration (ET) and Transpiration (T)

The ET and T datasets from 2000 to 2015 used in this study combine the Priestly–Taylor Jet Propulsion Laboratory (PT-JPL) model and multisource observation data to provide relatively accurate ET data [28]. The dataset is provided by the National Ecosystem Science Data Center, National Science and Technology Infrastructure of China. (http://www.nesdc.org.cn) (accessed on 25 December 2022).

2.5. Satellite SIF and Vegetation Indices

In this study, GOSIF [29], a global fluorescence dataset redeveloped based on OCO-2 original fluorescence data, was used to track the response of vegetation to drought stress in Southwest China. Due to the spatial–temporal sparsity of the original SIF data of OCO-2, it is not suitable for global terrestrial photosynthesis monitoring [30]. Li [29] used decision tree model to develop the global SIF data of OCO-2 data with high spatial–temporal resolution (0.05°, 8 days) from 2000 to 2020. These data have a reasonable seasonal period and can capture seasonal characteristics similar to those of SIF. The advantage is that it has higher spatial resolution and a longer period and can be used to study long-term trends of SIF on a global scale.
The EVI datasets are collected from the Moderate Resolution Imaging Spectroradiometer (MODIS). The MODIS EVI data were acquired from NASA (https://ladsweb.modaps.eosdis.nasa.gov) (accessed on 25 December 2022). It has 36 spectral bands of moderate resolution (0.25 µm~1 µm) and makes observations of the Earth’s surface every 1–2 days. The EVI datasets are quality filtered for clouds by excluding pixels contaminated by clouds and aerosols based on the quality flag.

2.6. Drought Severity Index (DSI)

The drought stress index (DSI) is a new drought assessment method that combines evapotranspiration (ET), potential evapotranspiration (PET), and NDVI. Among them, NDVI reflects the photosynthesis and growth state of crops, characterized by high quality and easy acquisition. It can reflect the phenological characteristics and growth rules of crops and has significant advantages in extracting large-scale vegetation information [31,32]. ET/PET represents the water stress status of vegetation and comprehensively reflects the drought situation (http://www.ntsg.umt.edu/project) (accessed on 25 December 2022).

2.7. Land Cover Data

The land cover data are derived from the National Earth System Science Data Center. The land use data products with a national area of 1 km are finally obtained by combining and transforming them into vector gates (area maximization method).

2.8. Data Preprocessing

To reduce the potential error caused by the spatial–temporal resolution mismatch, the bilinear interpolation method was used to unify the resampling of all variables to a 0.25° × 0.25° grid and the 8-day data were aggregated into monthly data. In addition, we used temperature and soil moisture data from 2000 to 2019. For ET data, the data product was only updated to 2015. Therefore, we used ET data from 2000 to 2015 to analyze the dynamic changes in drought in 2009/2010. We also used EVI and GOSIF data from 2000 to 2019 to explore the impact of drought on vegetation growth. As DSI data were not updated, we only used DSI data from 2000 to 2011 to analyze the drought situation in Southwest China. Since this study is used for a large area of drought monitoring, for the land use data, the large spatial resolution may result in a lack of accuracy, so we keep the spatial resolution of the land cover data at 1 km.
To better study how variables change during drought to avoid seasonal cycles, we calculated the pixel-by-pixel normalized anomalies for all variables as a departure from the multiyear mean and normalized by the standard deviation (SD) from 2000 to 2019:
X i , j , t = X i , j , t X ¯ i , j std X i , j , t
where X′(i,j,t) is the standardized anomaly of pixel (i,j) at time t, X(i,j,t) is the original value of pixel (i,j) at time t, X ¯ i , j is the mean value of pixel (i,j) from 2000 to 2019, and std (X(i,j,t)) is the standard deviation of pixel (i,j) from 2000 to 2019. For ET, the mean value and standard deviation are calculated from 2000 to 2015, and the DSI is calculated from 2007 to 2011.
The inter-annual variations and seasonal cycles of meteorological indices, vegetation indices, and remote sensing indices (including temperature, precipitation, soil moisture, evapotranspiration, EVI, SIF, and DSI) were calculated using the regional mean values from July 2009 to June 2010 in the three provinces of Southwest China. In the analysis of spatial pattern of drought, Equation (1) was used to calculate the monthly anomaly (represented by the _anm suffix) of each image pixel by pixel to characterize the spatial change in drought. Correlation analysis was quantified by Pearson correlation coefficient. The linear relationship was fitted by the least square method, and the coefficient of determination (R2) indicated that it was statistically significant at the p level.

3. Results

3.1. Spatial–Temporal Dynamics of Drought in 2009/2010

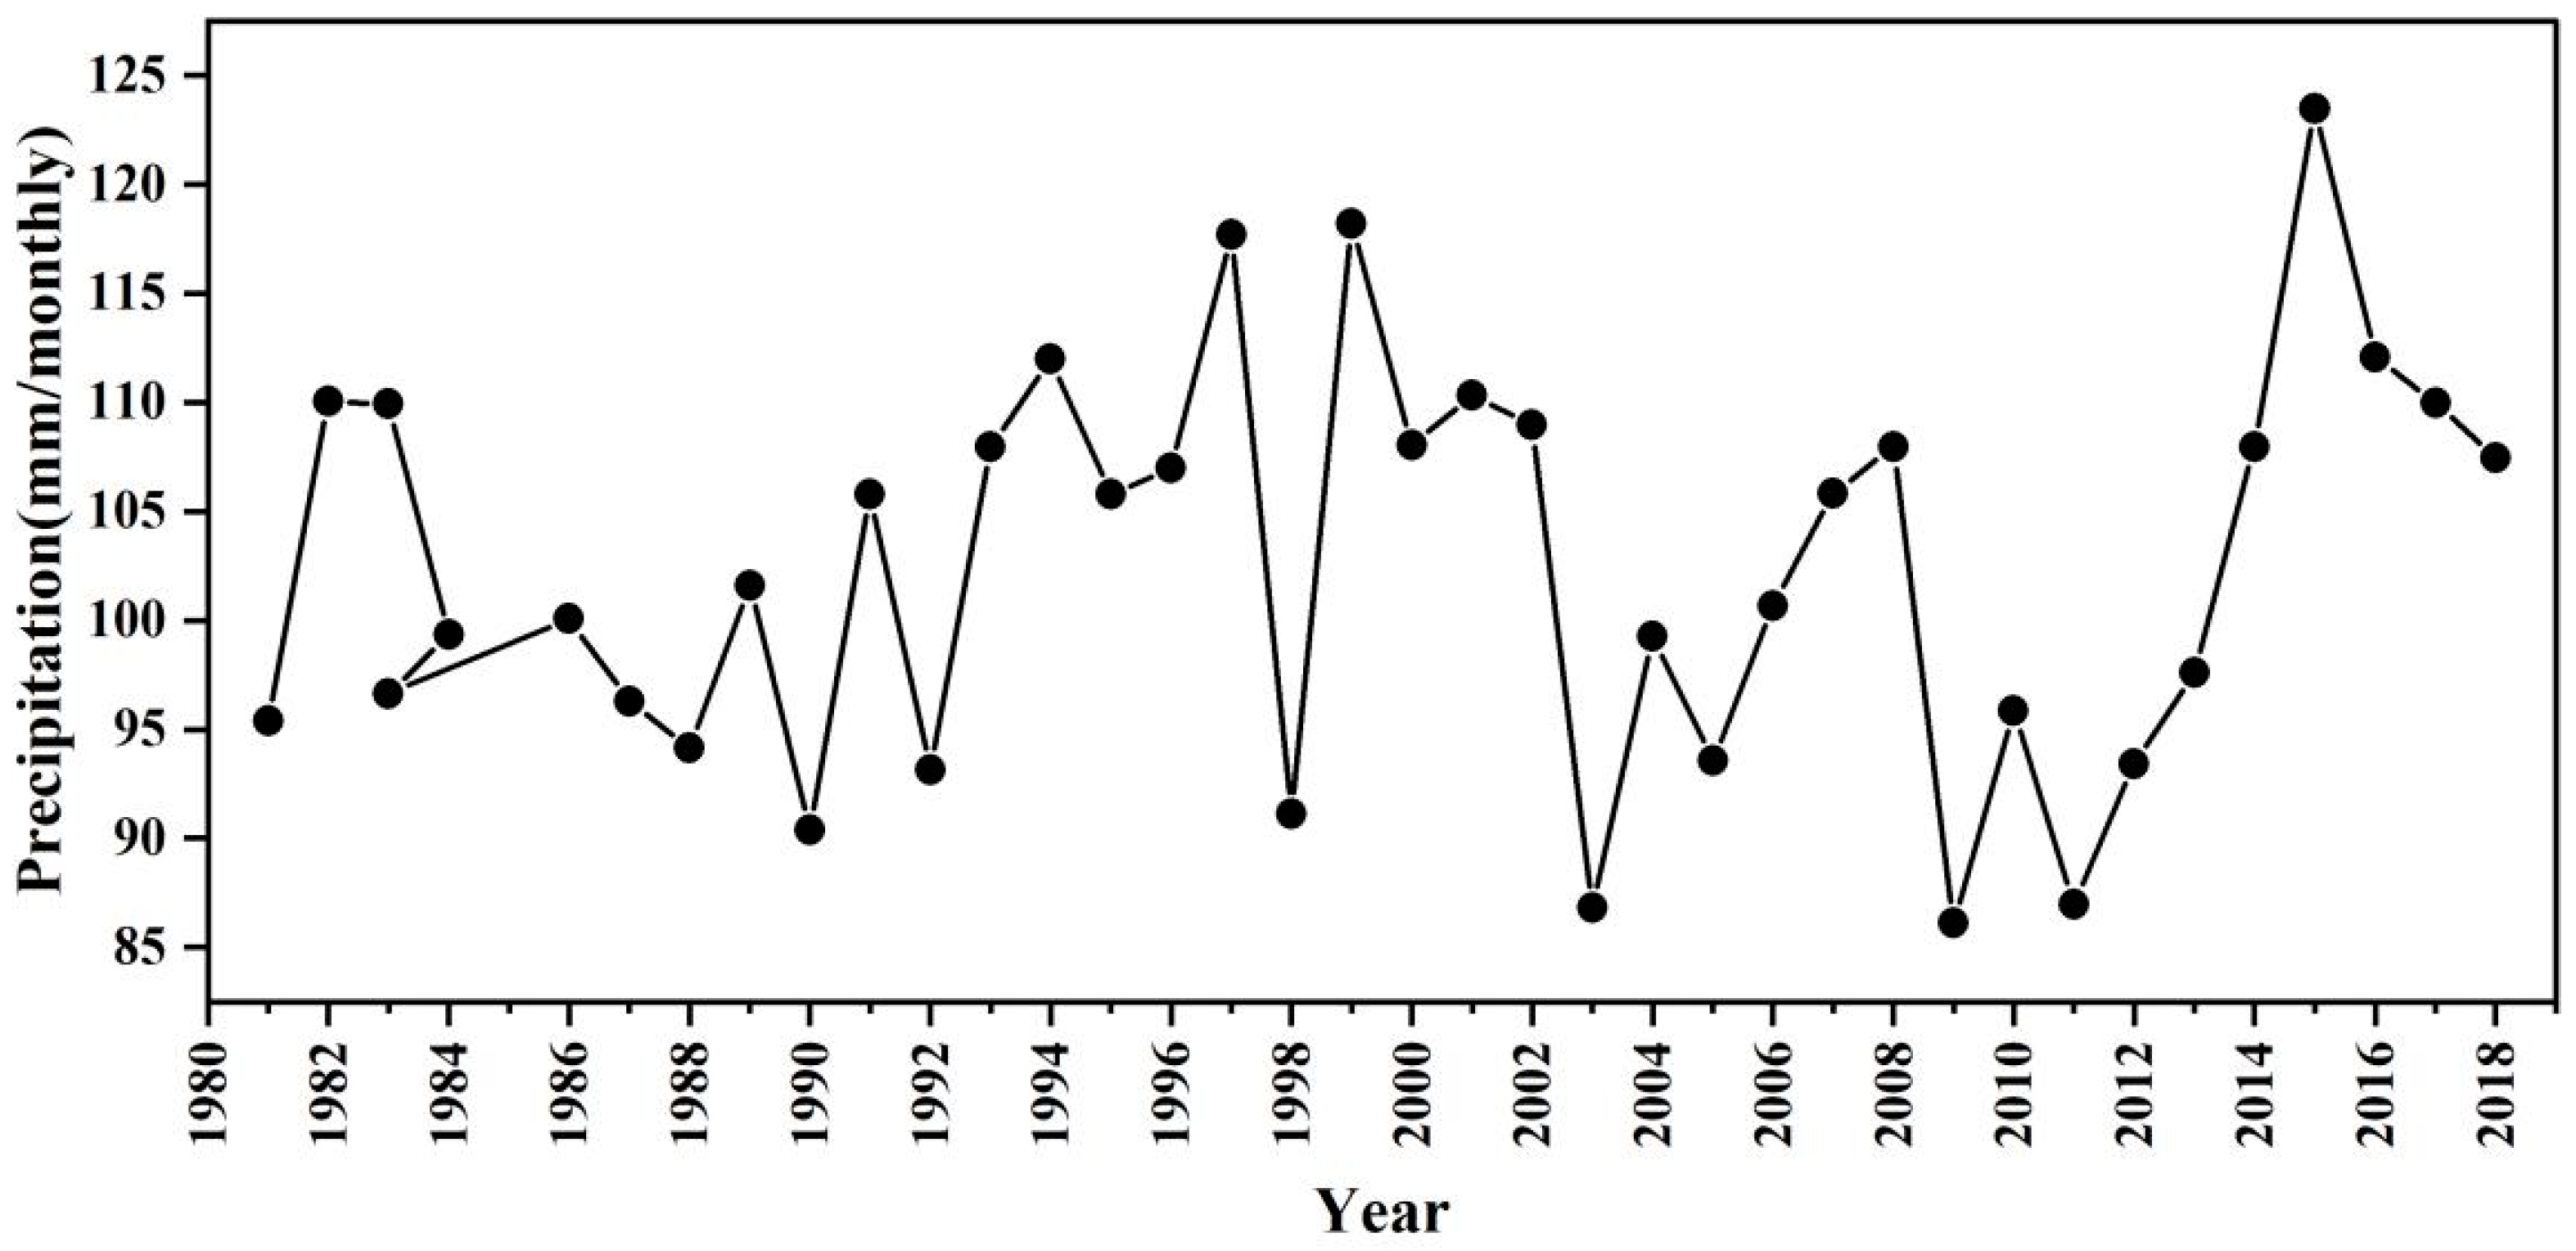
Figure 2 shows that the precipitation of the three provinces from July to June of the year 2009/2010 was lower than that in the other years. Thus, the drought event from July 2009 to June 2010 was taken as a study case.
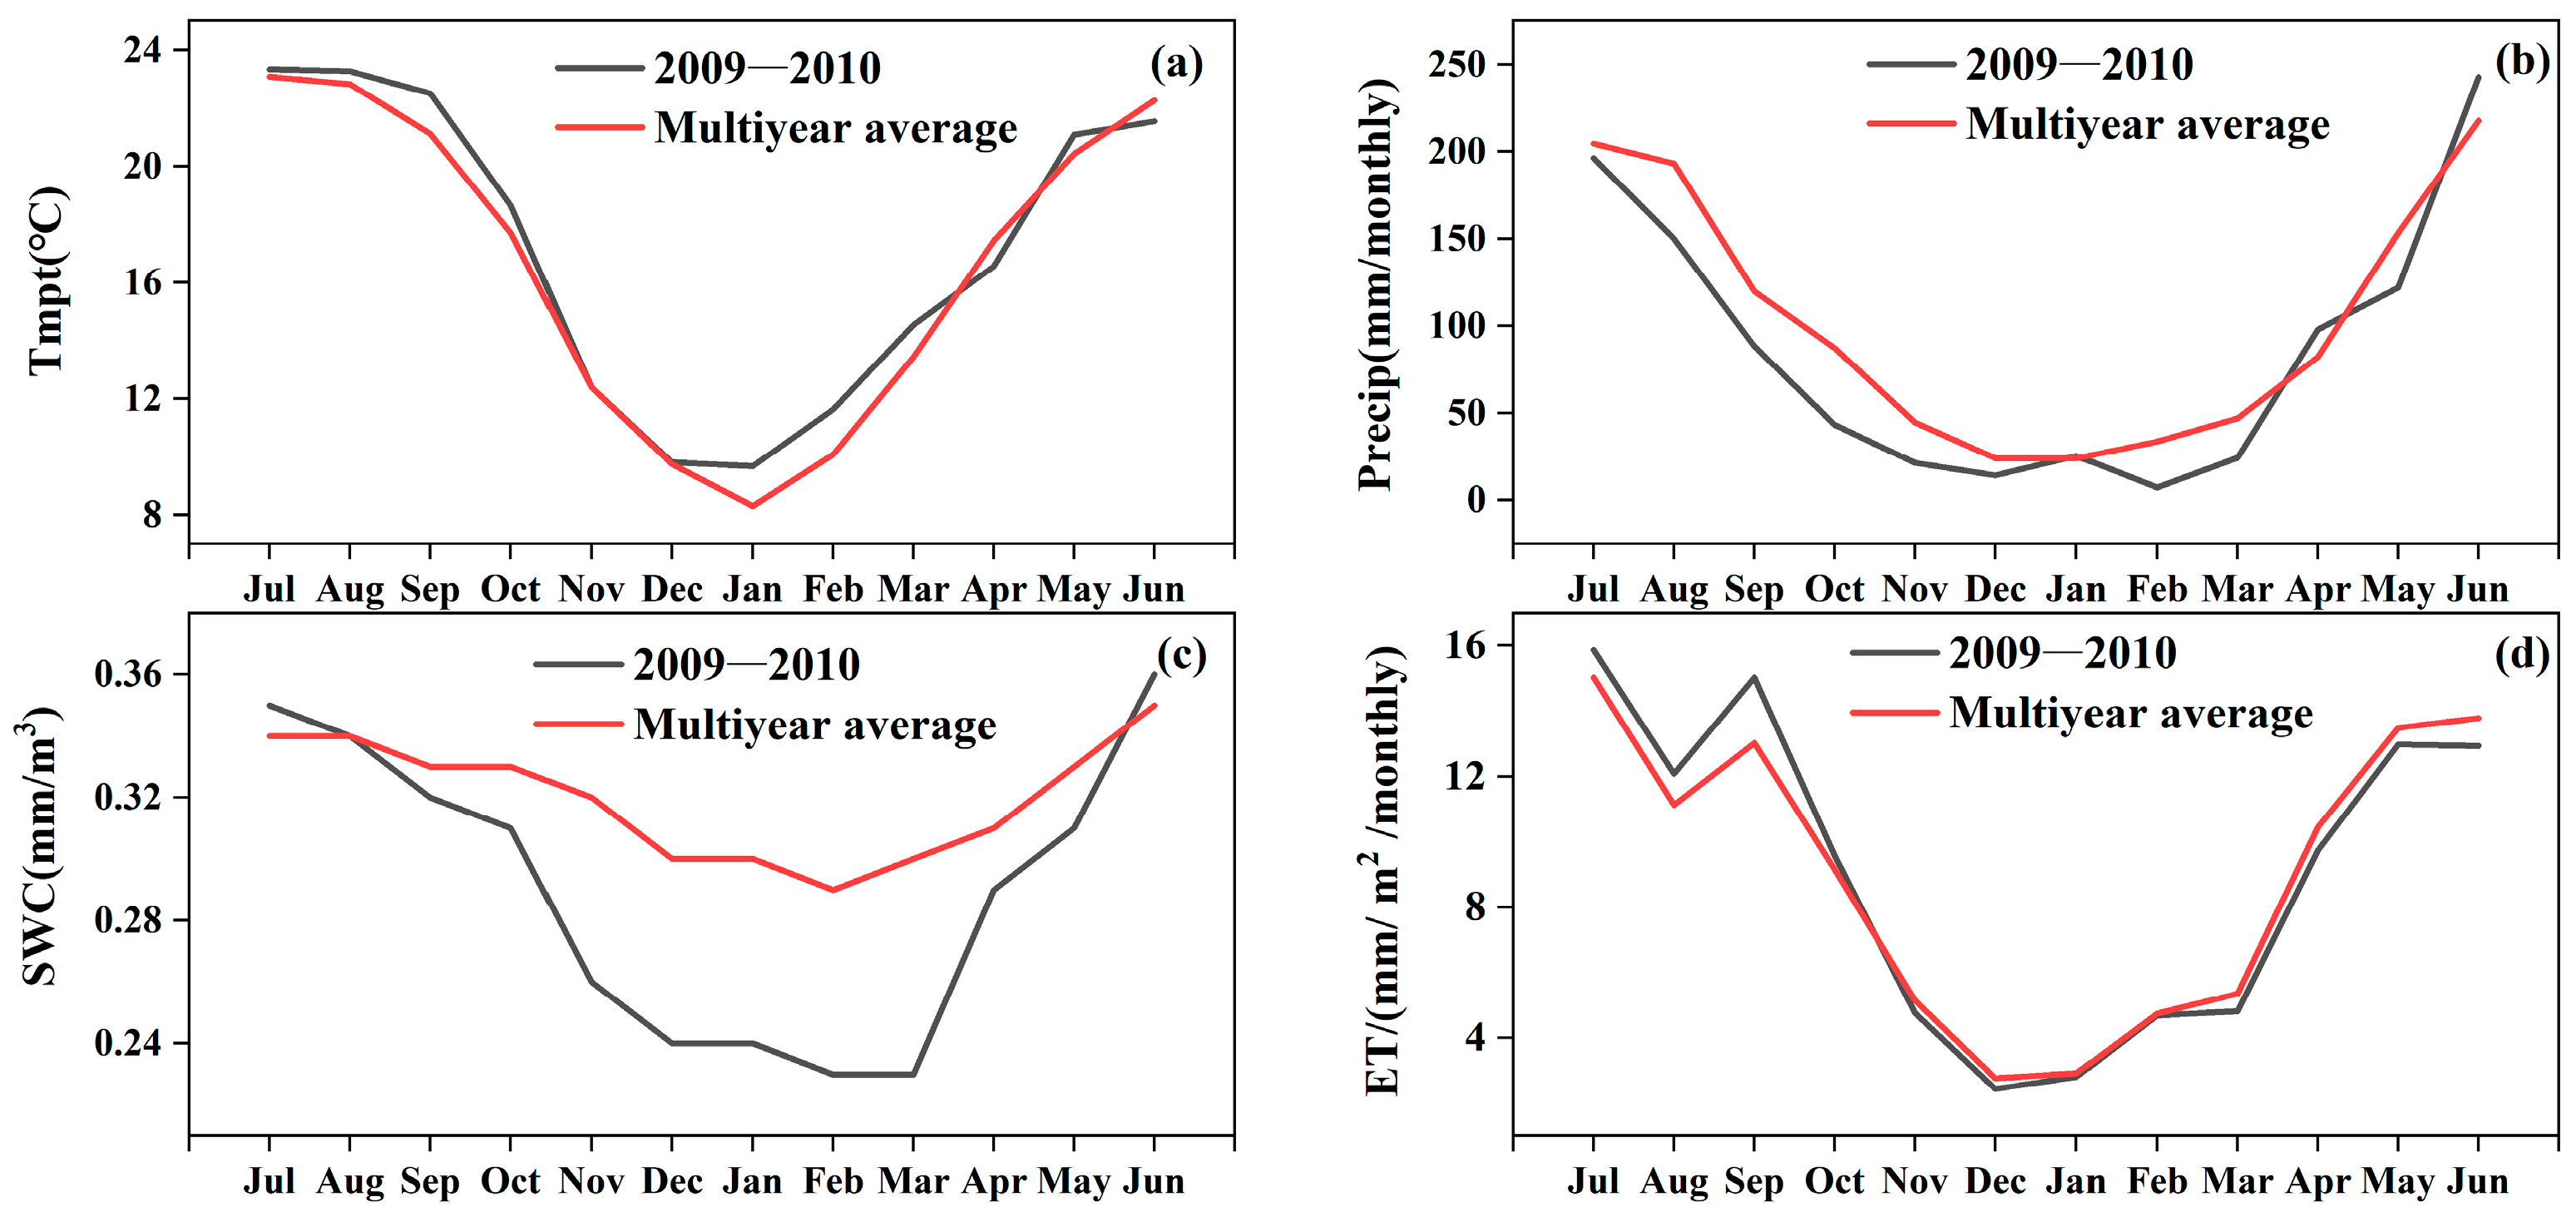
During the drought, the temperature is higher than the average in most months (Figure 3a). Persistent negative precipitation anomalies from autumn 2009 to spring 2010 with the most significant reduction of 40% compared to the multiyear average from September to November 2009 (Figure 3b). The increase in temperature and the precipitation reductions led to the depletion of soil moisture (Figure 3c). ET was higher than the multiyear average during the initial period of the drought and gradually became equal to or lower than the multiyear average (Figure 3d).
This drought in Southwest China is characterized by the continuous depletion of soil water induced by a long period of precipitation below the multiyear average from autumn 2009 to spring 2010. From July 2009 to August 2009, the temperature (precipitation) was slightly higher (lower) than the multiyear average, indicating that the drought started in July and intensified in the following three months. In winter 2009, the temperature decreased slightly, the precipitation increased in January 2010, and the drought alleviated. However, the soil moisture was still lower than the multiyear average, and the ET was the same as the multiyear average in the winter of 2009 and spring of 2010. In spring 2010, the temperature rose again, rainfall fell below the multiyear average, and drought conditions intensified again. In June 2010, the temperature dropped below the multiyear average, and the precipitation gradually rose above the average. The changes in temperature and precipitation led to the recovery of soil moisture and the decrease in ET, indicating that the drought had been gradually relieved. The interannual change in these variables indicated that the drought event started in July 2009 and then steadily intensified with time. After a slight alleviation in May 2010, the drought continuously strengthened with time, and then gradually faded in June 2010.
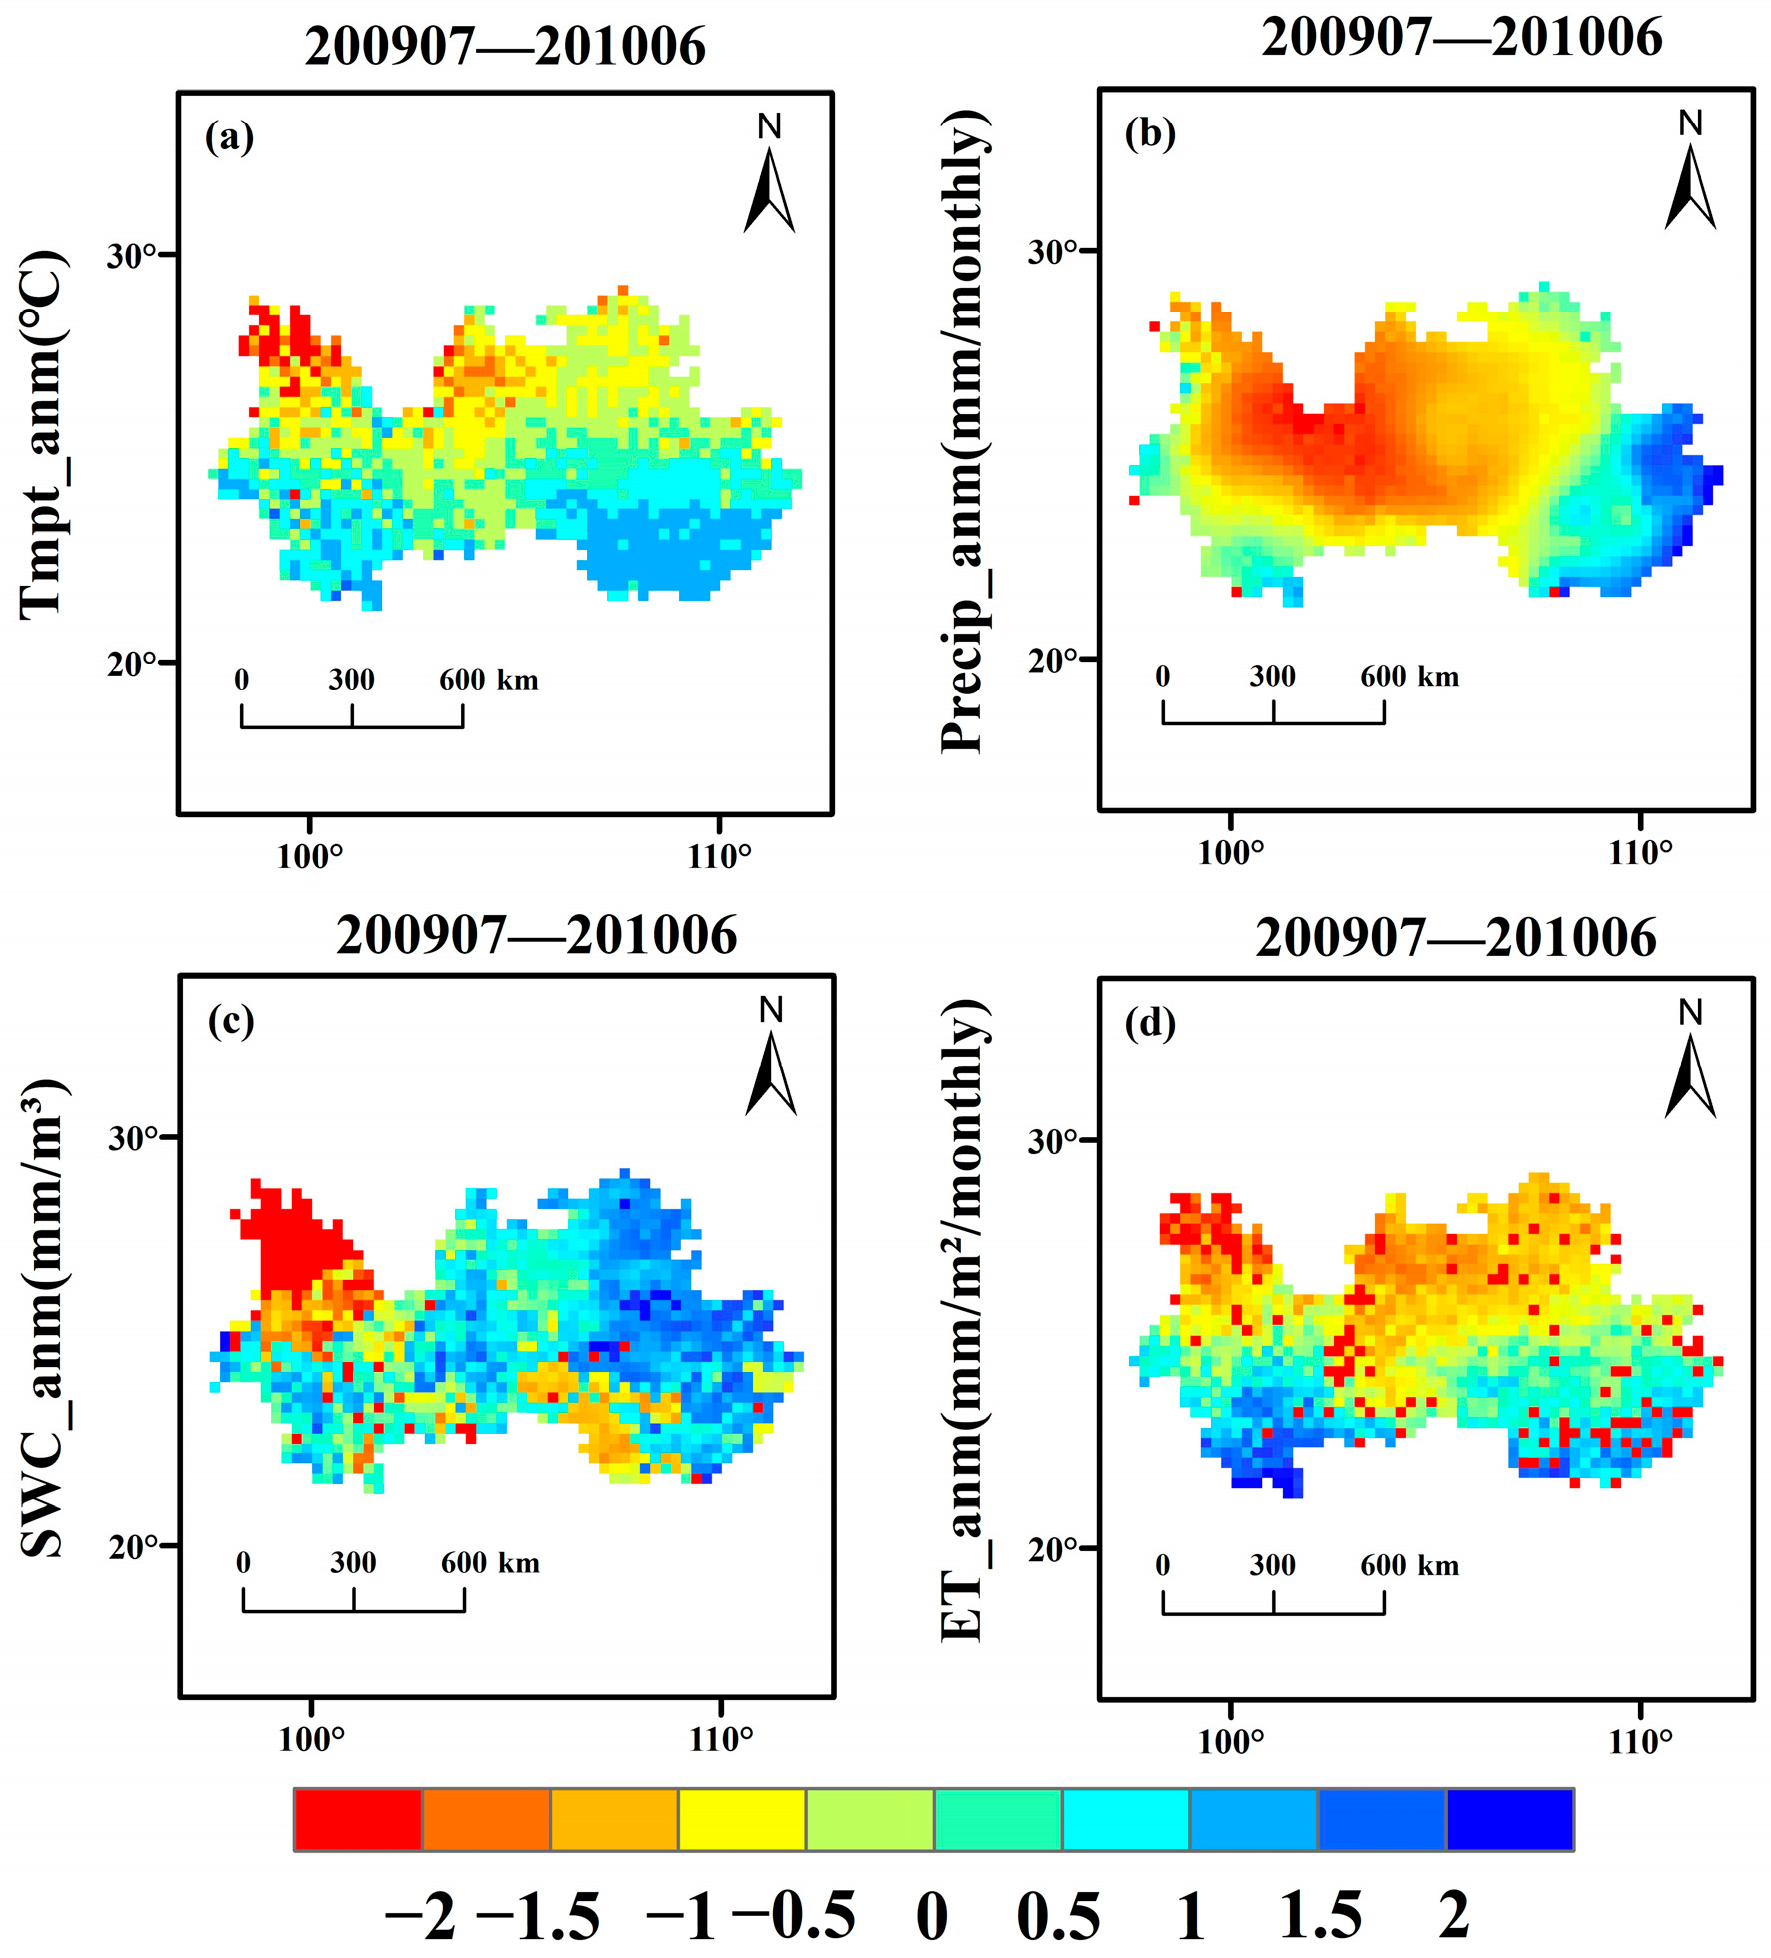
In 2009/2010, the area of drought disasters reached 80%, and the precipitation was lower than the average level (<−0.5 SD) and above the multiyear average temperature (>0.5 SD) (Figure 3a and Figure 4a). With increasing temperature and decreasing precipitation, 60% of the area showed negative anomalies (<−0.5 SD) (Figure 4d). In addition, Western Yunnan has SWC anomalies lower than the multiyear average (<−0.5 SD) for ESA data, respectively (Figure 4c). Figure 4a reveals that the positive temperature anomalies mainly appeared in the southern part, indicating that in the southern part of Guangxi Province, most parts of Yunnan Province have above-normal temperatures. The precipitation in most parts of Yunnan Province and Western Guangxi Province, and Guizhou Province showed negative anomalies. This drought event spread to a wide range, which had a specific impact on the growth of local vegetation. The spatial distribution (Figure 4) and interannual variation (Figure 3) showed that the deficit lasted for approximately 12 months in Southwest China.

3.2. Spatial–Temporal Dynamics of the EVI, SIF, and DSI

The interannual changes in remote sensing indicators, including EVI, SIF, and DSI from July 2009 to June 2010 were analyzed.
In July 2009, precipitation at this time showed a decreasing trend compared to the multiyear average, but the EVI and DSI were still higher than the multiyear average (Figure 5). SIF showed a descending response in the early stages of drought (Figure 5b). In September 2009, the EVI was nearly the same as the multiyear average. As the drought evolved over the area, the EVI began to show a slight reaction in November 2009. However, SIF showed a slight reduction at the beginning of the drought, and the overall change in SIF was more consistent with the precipitation deficit than the EVI. Meanwhile, although the deficit suffers moderately, the DSI showed a much lower value than the multiyear average in most months, indicating that the DSI overestimates the severity of the drought. According to meteorological data, the drought peaks in February 2010, with a temperature increase of 20% relative to the multiyear average (1.6 °C), the most considerable precipitation reduction of 70% (27 mm), and an SWC decrease of 23% (0.065 m3/m3) compared to the multiyear average (Figure 3a–c). At this time, the decrease in SIF was more marked by drought (approximately 19%). Relatively, the decrease in EVI (4%) in this drought event was slight. Timely responses of SIF to drought with reductions of 11% in May, and EVI showed lower decreases of 5%. The shortage became severe, and the three variables were lower in magnitude than the multiyear averages. In July 2010, temperature and precipitation returned to the standard multiyear level, and the three indices also gradually recovered.
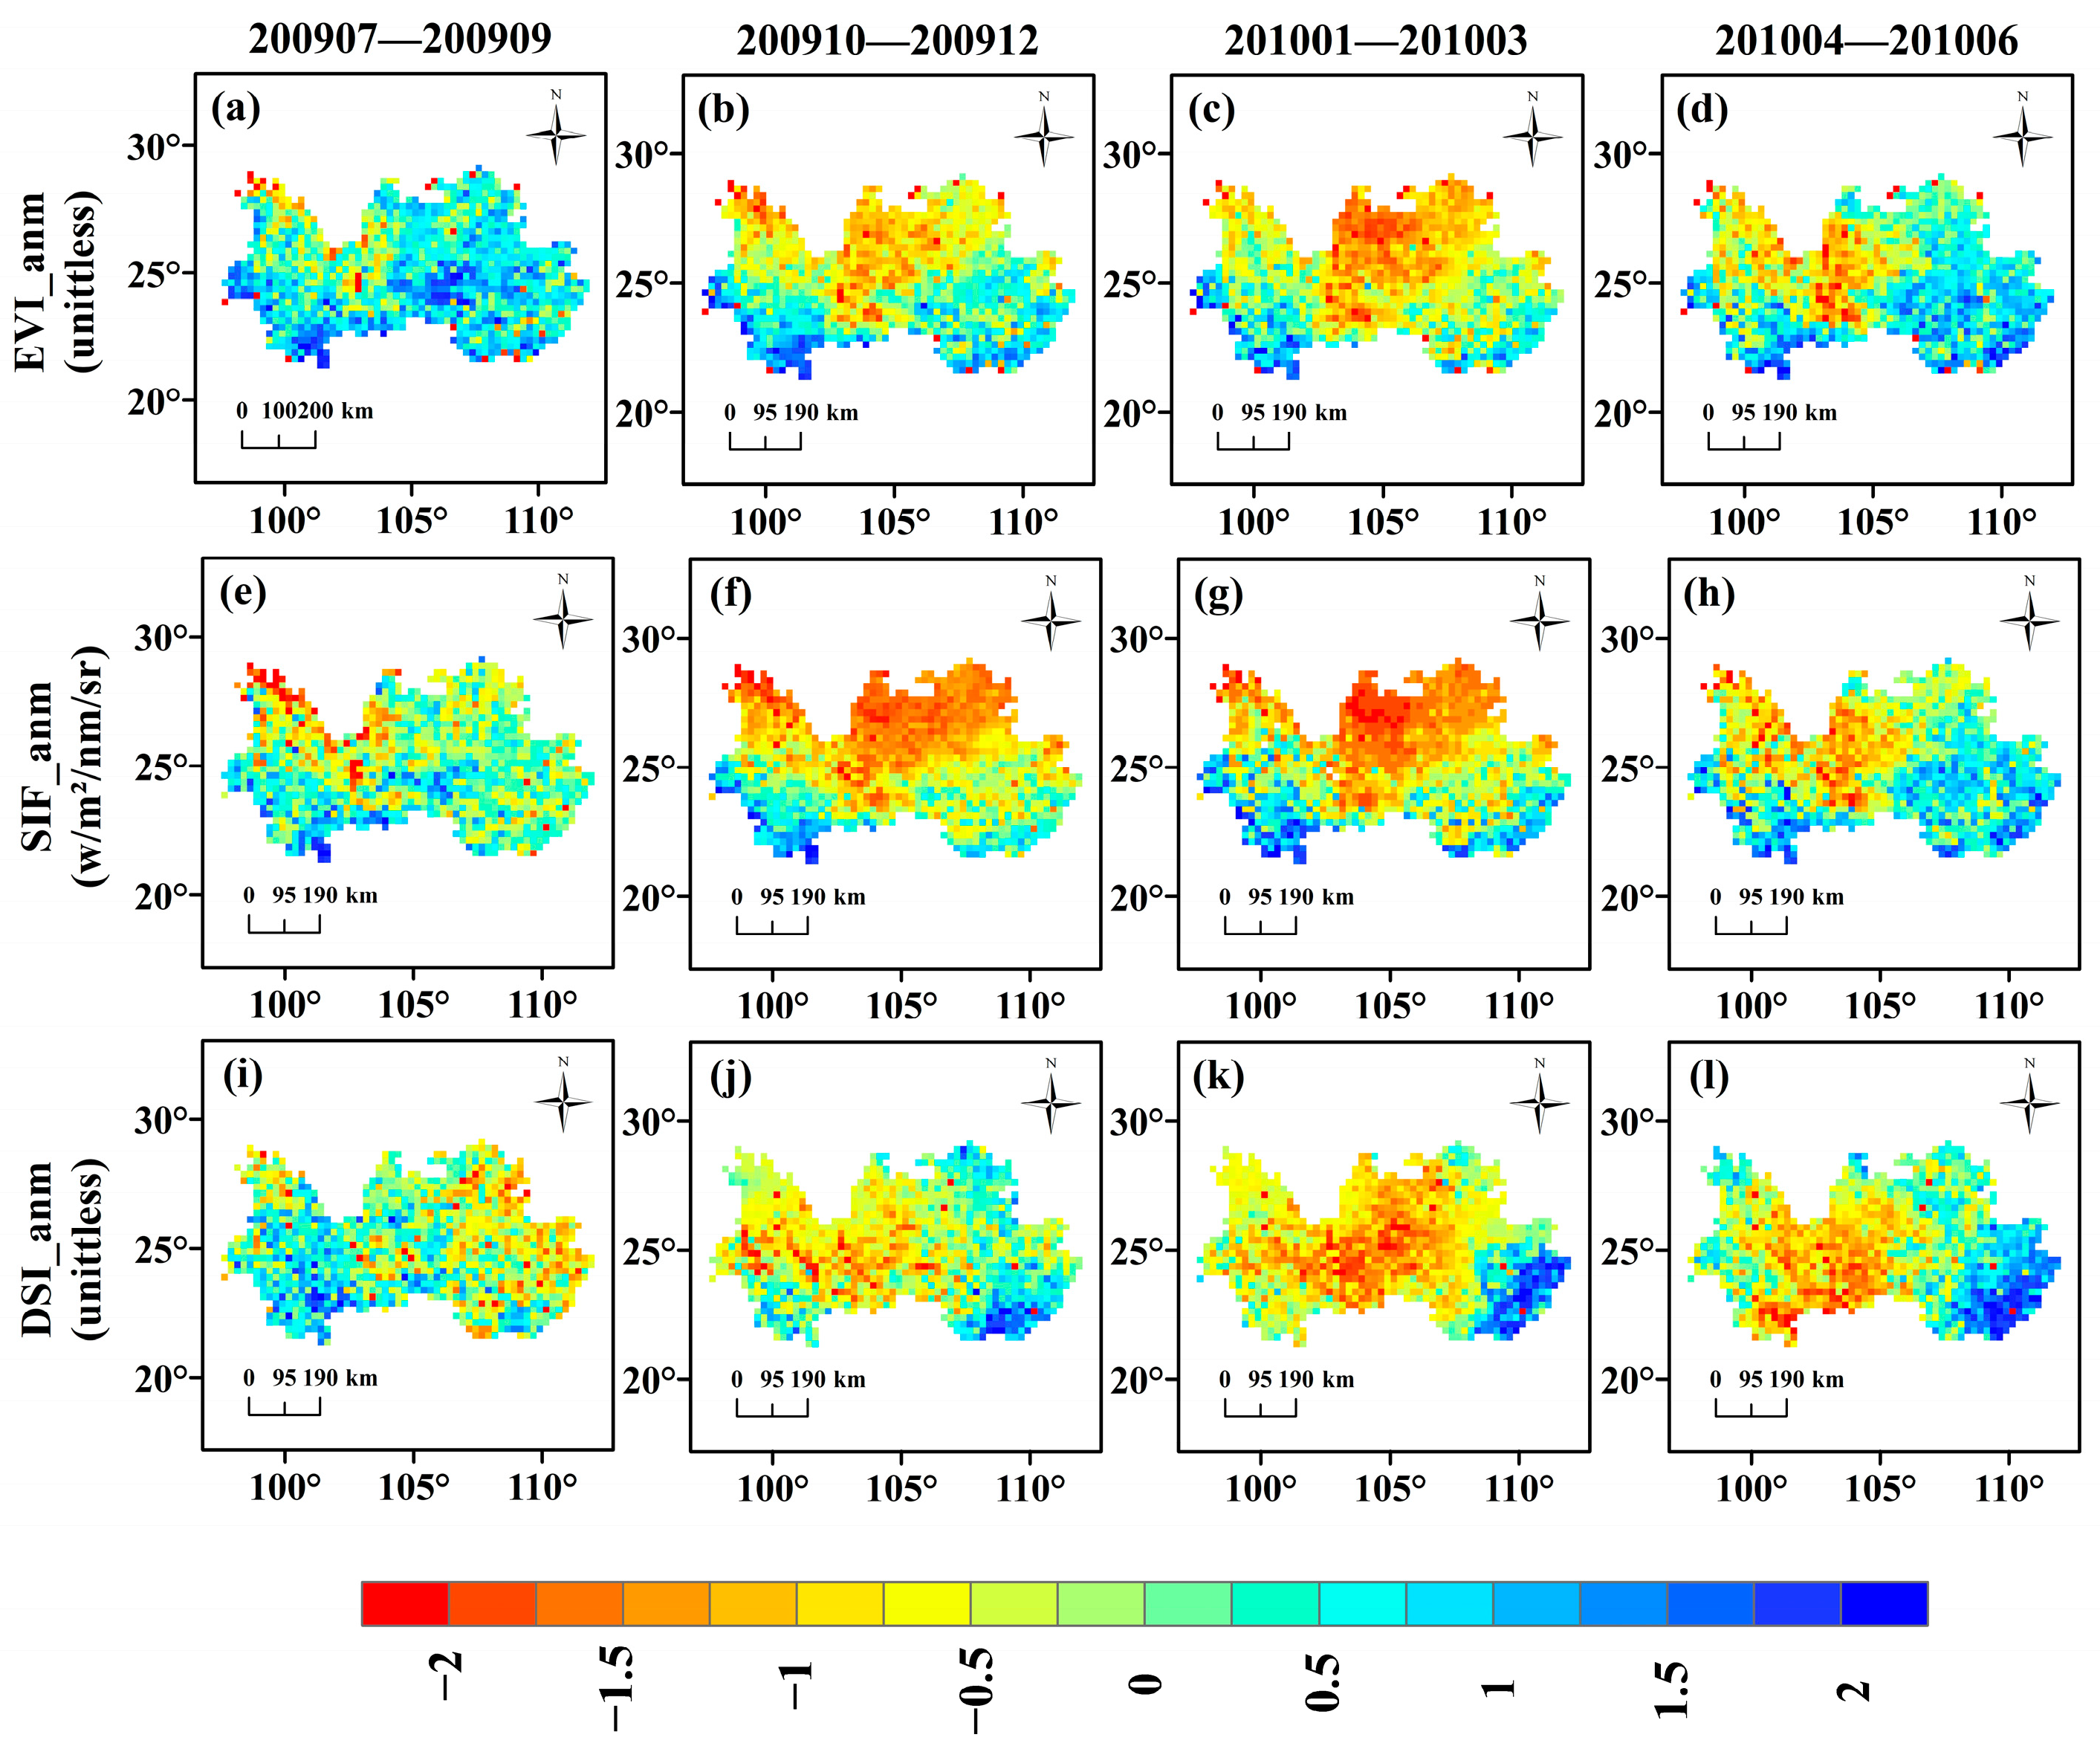
From July to September 2009, the Northern Yunnan Province showed negative EVI and SIF anomalies while the DSI still showed positive responses (Figure 6). In addition, at the beginning of the drought, negative anomalies are found in approximately 30% of this area which is more sensitive than the EVI and DSI. From October to December, the EVI and SIF anomalies in the central and northern parts of the study area are basically consistent with the temperature and precipitation anomalies. At this time, more than 40% of the vegetation in the Yunnan Province suffered moderate (<−0.5 SD) loss, and as shown by SIF, more than 10% of the vegetation suffered severe (<−1 SD) loss (Figure 6f). Only 15% and 10% of the area suffers from EVI and DSI losses (<−0.5 SD) (Figure 6f,g). As the drought expands and strengthens in Southwest China, the proportions of moderate and severe SIF losses are 60% and 20%, respectively. However, only 20% and 40% of regions experience moderate EVI and DSI loss (<−0.5 SD). At the end of this drought event, most areas suffer from severe drought, as indicated by three indices from April to June 2010. In contrast, the negative anomalies are less widespread for EVI and DSI than for SIF. Therefore, the spatial distribution shows that the SIF is a better indicator than the EVI and DSI to capture the process of drought evolution in Southwest China in 2009/2010.

3.3. Relationships between SIF Anomalies and Drought Indicators

Correlation analysis between SIF and meteorological indicators (P, ET, SWC), which derived three maps of correlation coefficients (Figure 7). The SIF anomalies show a strong positive correlation with P anomalies in Southwest China (R2 = 0.74, p < 0.05) (Figure 7b), suggesting that precipitation deficit may directly lead to negative SIF in this drought event. Therefore, the relationships between SWC and SIF anomalies are shown in Figure 7b. It shows that SIF was positively related to the of SWC (R2 = 0.38, p < 0.05) (Figure 7b) and ET (R2 = 0.74, p < 0.05) (Figure 7a).
The spatial consistency result reveals that the spatial patterns of SIF and ET anomalies are similar. Because of the time lag between SWC and agricultural drought, the spatial consistency between SIF and SWC anomalies is weak during the dry months. In winter 2009, the SIF anomalies were consistent with the anomalies revealed by P and ET. At the beginning and the end of the drought, the anomalies of SIF had a significant positive correlation with ET anomalies, indicating that SIF is likely to affect ET.

4. Discussion

4.1. Potential of SIF in Early Drought Monitoring

In this study, the application potential of satellite SIF in agricultural drought monitoring was discussed. SIF has the ability to capture temporal dynamics and map the spatial scale of drought. Compared with its reflectivity in February 2010, SIF value was 19 percent lower, while the EVI was 4 percent lower (Figure 5). In addition, SIF is lower than the multiyear average at the beginning of the drought, implying that SIF can respond to heat and water stress fast [33,34]. Our research shows that vegetation photosynthesis is affected during the early stages of drought (Figure 3 and Figure 5).
Timely and accurate monitoring of drought is of great significance to agricultural production and grain harvest [35]. Precipitation begins to decline in July when soil moisture is slightly behind precipitation. SIF can monitor water stress in a timely manner and shows a downward trend in the early stage. Traditional, green-based VIs have limitations in drought monitoring. The EVI increased slightly at the beginning of the drought, but photosynthetic capacity decreased in the early drought period (Figure 5b and Figure 6e). Signs of this vegetation reduction to drought are consistent with the tropical Amazon and temperate Europe [20,35,36,37,38,39]. Traditional VIs have described only underlying photosynthesis and dose not directly related to the actual photosynthetic synthesis process [5,40]. The more significant response of SIF to early drought is physiological and structural changes in vegetation caused by thermal and water stress. Under short-term water stress, the emission of fluorescence will drop immediately. For example, previous studies on canopy-level measurements have shown that fluorescence decreases under drought conditions, while NDVI remains unchanged [41,42].
In the IGP, Song [18] found that SIF showed a significant response to heat stress in the early stages of the heat wave. On the other hand, approximately one month later, the VI began to decrease. Wang’s research shows that SIF observations have great potential for accurate and timely monitoring of the development of droughts and heatwaves [22]. The rapid response of SIF in the early stages of drought can help us take measures to drought events promptly. Timely monitoring of water and heat stress allows us to prepare for the changes in terrestrial ecosystems, so SIF may enhance our ability to control or adapt to the systems [17,43,44,45].

4.2. Response of SWC to the Drought

In this study, the correlation between SIF anomalies and different meteorological indicators on the spatial–temporal scale, and SWC shows that the correlation is not as significant as the others (Figure 8). Soil moisture is an important link between the soil–vegetation–atmosphere on Earth [7]. Vegetation absorbs water through roots and then releases it from leaf stomata to the atmosphere through transpiration. In addition, the response of SIF to drought and water shortage also depends on the development stage of vegetation [46,47,48,49]. In rain-fed farmland, Qiu showed that SIF was negatively correlated with soil moisture during vegetation regreening, but SIF was sensitive to changes in SSM during vegetation senescence [50]. Decreasing soil moisture content and increased SIF could be due to the low soil moisture content resulting from vegetation triggering a light protection mechanism, causing the vegetation to absorb photosynthetically active radiation energy to increase the proportion of chlorophyll fluorescence release, to avoid chloroplasts absorbing light energy more than the digestive ability of photosynthesis, and to minimize the potential damage that bright light can cause [51]. According to Li’s study, for some high latitudes, the PAR is low, and the vegetation type is mostly grassland and coniferous forest, so the SIF signal is low [51,52]. When the chlorophyll content of vegetation is continuously changing, it may affect the multiple scattering and reabsorption of SIF received by the sensor deep in the canopy. The situation may impact the long-term observation [52,53,54].

4.3. Carbon–Water Interaction during the 2009/2010 Drought in Southwest China

Existing studies have explored the effects of drought and heat waves on vegetation growth. It has been proposed that the variability of the carbon balance in subtropical ecosystems is closely related to changes in water availability [55]. Li’s study found that precipitation played a major role in the impact of drought events in Southwest China in 2009/2010 on the carbon balance [26]. Wang’s study indicated that droughts and heat waves would continue to pose a significant influence on terrestrial ecosystems. High temperatures will increase VPD and further limit terrestrial carbon uptake [22,56]. Moreover, our study found that the spatial patterns of SIF were consistent with both T and ET during the dry months. ET is a key step and process in the global water cycle, and it is crucial for understanding how anthropogenic and climate changes have impacts on the terrestrial water cycle [57]. We found that ET across the study area shows negative anomalies because of SIF reduction. Among them, the change in ET is caused by T [58]. Therefore, the effect of SIF change on ET and its effect on T have excellent spatial consistency. The photosynthetic characteristics of plants reflect the carbon assimilation ability of plants. The high photosynthetic rate makes plants absorb CO2 at a higher rate, which increases the accumulation of organic matter but causes them to lose water due to transpiration [59,60]. Stomatal conductance is an essential indicator of carbon–water exchange capacity. The plant photosynthetic rate is positively correlated with CO2 absorption and water conductivity. That is, a higher photosynthetic rate means higher stomatal conductance, and the leaf’s hydraulic conductivity and transpiration rate also increase [61]. A comprehensive study of the carbon–water cycle mechanism, change trends, and regulation of terrestrial ecosystems is a strategic need to tackle global warming and protect freshwater resources.

4.4. Enhance Understanding of the Mechanisms of Drought

Climate change affects the structure and function of terrestrial ecosystems, and the carbon–water cycle [62,63]. Drought has a negative impact on agriculture, water resources, and human economic society. We must strengthen the understanding of drought mechanisms. In our study, we used multisource remote sensing data to assess the 2009/2010 drought event in Southwest China, SIF has great advantages in drought detection and evaluation, but the spatial resolution is too rough. It is challenging to analyze the effects of different vegetation types on drought responses. Although we used the GOSIF product in this study, which has a higher spatial resolution than GOME-2 SIF, it is difficult to analyze how different vegetation types follow the drought according to the vegetation coverage in the southwest. Recently, the OCO-2 [64] and TanSat [65] satellites have provided finer spatial resolution of SIF. However, due to the long revisit time of polar-orbiting satellites, the spatial–temporal continuity of these datasets is poor, and regional and short-term studies are lacking. In the future, the emergence of products with more refined temporal–spatial resolution will promote research on the response of different vegetation types to drought in the southwest.
The core of the material and energy cycle of the surface system is the water cycle and the carbon cycle in the terrestrial ecosystem [66]. The primary material and energy exchange forms among the terrestrial ecosystem’s atmosphere, biosphere, and geosphere are the fluxes of CO2, heat, and water vapor. Only by profoundly discussing the physiological process mechanism and environmental control principle of the terrestrial ecosystem can we further explore the carbon sink function and evaporation and dispersion process of the ecosystem and lay a theoretical foundation for dealing with the impact of climate change [67]. Plant functional traits are the fundamental factors that affect the carbon and water cycle, material and energy cycle in the biogeochemical process, and then affect the service function of the ecosystem [58]. The material and energy exchanges between vegetation and the atmosphere depend on the diverse vegetation types that have a close connection with surface reflectivity and roughness, and also ET, further affecting global climate change [58,59,60,61,67]. SIF can characterize the physiological condition of vegetation, and SIF products with better spatial resolution in the future can help us disentangle the impact of different vegetation types on ET and increase our understanding of carbon–water coupling mechanisms on a smaller scale under drought conditions.

5. Conclusions

Severe drought in Southwest China in 2009/2010 accompanied significant negative precipitation anomalies and positive temperature anomalies. Satellite SIF shows more reliable responses to drought than traditional VIs, which underestimated the losses by approximately 50%. DSI coupled NDVI with ET/PET overestimated the drought during most of the dry months. In March and May 2010, the SIF declined 19% and 11%, respectively, which were more significant than EVI (4% and 5%). The correlation coefficient between SIF and ET was significant (reaching 0.8 at the beginning and end stages). Our research mainly draws the following conclusions: (1) the early and proper response of SIF suggests that SIF is valuable and feasible for regional drought monitoring and assessment. (2) The change in a physiological state captured by SIF is positively correlated with the change in ET mainly caused by T, revealing the interaction of carbon and water during drought, and providing ideas for future research on the terrestrial carbon–water cycle. More long-term records and high spatial resolution observations are needed to accurately assess the effects of drought on the structure and function of various vegetation types in complex ecosystems, as well as the effects of different vegetation types on ET.

Author Contributions

Conceptualization, Y.H. and W.L.; methodology, Y.H. and L.J.; writing—original draft preparation, L.J.; writing—review and editing, Y.Z.; Y.L. All authors have read and agreed to the published version of the manuscript.

Funding

This research was jointly supported by the National Science and Technology Basic Resource Investigation Program (Grant No. 2017FY100904), the China Postdoctoral Science Foundation (Grant No. 2018M633602), Postdoctoral Research Fund of Shaanxi Province (Grant No. 2017BSHEDZZ144), and the Natural Science Basic Research Plan in Shaanxi Province of China (Grant No. 2021JQ-449).

Data Availability Statement

The original contributions presented in the study are included in the article, further inquiries can be directed to the corresponding authors.

Conflicts of Interest

The authors declare no conflict of interest.

References

  1. Trenberth, K.E.; Dai, A.; Van Der Schrier, G.; Jones, P.D.; Barichivich, J.; Briffa, K.R.; Sheffield, J. Global warming and changes in drought. Nat. Clim. Chang. 2014, 4, 17. [Google Scholar] [CrossRef]
  2. Masson-Delmotte, V.; Zhai, P.; Pirani, A.; Connors, S.L.; Péan, C.; Berger, S.; Caud, N.; Chen, Y.; Goldfarb, L.; Gomis, M.; et al. (Eds.) IPCC, 2021: Climate Change 2021: The Physical Science Basis. Contribution of Working Group I to the Sixth Assessment Report of the Intergovernmental Panel on Climate Change; Cambridge University Press: Cambridge, UK, 2021. [Google Scholar]
  3. Su, B.; Huang, J.; Fischer, T.; Wang, Y.; Kundzewicz, Z.W.; Zhai, J.; Sun, H.; Wang, A.; Zeng, X.; Wang, G. Drought losses in China might double between the 1.5 °C and 2.0 °C warming. Proc. Natl. Acad. Sci. USA 2018, 115, 10600–10605. [Google Scholar] [CrossRef] [PubMed] [Green Version]
  4. Qiu, B.; Xue, Y.; Fisher, J.B.; Guo, W.; Berry, J.A.; Zhang, Y. Satellite chlorophyll fluorescence and soil moisture observations lead to advances in the predictive understanding of global terrestrial. Glob. Biogeochem. Cycles 2018, 32, 360–375. [Google Scholar] [CrossRef]
  5. Lee, J.E.; Frankenberg, C. Forest productivity and water stress in Amazonia: Observations from GOSAT chlorophyll fluorescence. Proc. R. Soc. B Biol. 2013, 280, 20130171. [Google Scholar] [CrossRef] [PubMed] [Green Version]
  6. Yoshida, Y.; Joiner, J.; Tucker, C.; Berry, J.; Lee, J.E.; Walker, G.; Reichle, R.; Koster, R.; Lyapustin, A.; Wang, Y. The 2010 Russian drought impact on satellite measurements of sun-induced chlorophyll fluorescence: Insights from modeling and comparisons with parameters derived from satellite reflectances. Remote Sens. Environ. 2015, 166, 163–177. [Google Scholar] [CrossRef]
  7. Katul, G.G.; Palmroth, S.; Oren, R.A.M. Leaf stomatal responses to vapor pressure deficit undercurrent and CO2-enriched atmosphere explained by the economics of gas exchange. Plant. Cell. Environ. 2009, 32, 968–979. [Google Scholar] [CrossRef]
  8. Al-Khatib, K.; Paulsen, G.M. Photosynthesis and productivity during high temperature stress of wheat genotypes from major world regions. Crop. Sci. 1990, 30, 1127–1132. [Google Scholar] [CrossRef]
  9. Rossini, M.; Nedbal, L.; Guanter, L.; Ač, A.; Alonso, L.; Burkart, A.; Cogliati, R.; Colombo, A.; Damm, M.; Drusch, J.; et al. Red and far-red sun-induced chlorophyll fluorescence as a measure of plant photosynthesis. Geophys. Res. Lett. 2015, 42, 1632–1639. [Google Scholar] [CrossRef] [Green Version]
  10. Dobrowski, S.Z.; Pushnik, J.C.; Zarco-Tejada, P.J.; Ustin, S.L. Simple reflectance indices track heat and water stress-induced changes in steady-state chlorophyll fluorescence at the canopy scale. Remote Sens. Environ. 2005, 97, 403–414. [Google Scholar] [CrossRef]
  11. Ji, L.; Peters, A.J. Assessing vegetation response to drought in the Northern Great Plains using vegetation and drought indices. Remote Sens. Environ. 2003, 87, 85–98. [Google Scholar] [CrossRef]
  12. Köhler, P.; Guanter, L.; Joiner, J. A linear method for the retrieval of sun-induced chlorophyll fluorescence from GOME-2 and SCIAMACHY data. Atmos. Measur. Techniq. 2015, 8, 2589–2608. [Google Scholar] [CrossRef] [Green Version]
  13. Frankenberg, C.; O’Dell, C.; Berry, J.; Guanter, L.; Joiner, J.; Köhler, P.; Pollock, R.; Taylor, T.E. Prospects for chlorophyll fluorescence remote sensing from the Orbiting Carbon Observatory-2. J. Remote Sens. Environ. 2014, 147, 1–12. [Google Scholar] [CrossRef] [Green Version]
  14. Mohammed, G.H.; Colombo, R.; Middleton, E.M.; Rascher, U.; van der Tol, C.; Nedbal, L.; Goulas, Y.; Pérez-Priego, O.; Damm, A.; Meroni, M. Remote sensing of solar-induced chlorophyll fluorescence (SIF) in vegetation: 50 years of progress. Remote Sens. Environ. 2019, 231, 111177. [Google Scholar] [CrossRef] [PubMed]
  15. Ryu, Y.; Berry, J.A.; Baldocchi, D.D. What is global photosynthesis? History, uncertainties and opportunities. Remote Sens. Environ. 2019, 223, 95–114. [Google Scholar] [CrossRef]
  16. Guan, K.; Berry, J.A.; Zhang, Y.; Joiner, J.; Guanter, L.; Badgley, G.; Lobell, D.B. Improving the monitoring of crop productivity using spaceborne sun-induced fluorescence. Glob. Chang. Biol. 2016, 22, 716–726. [Google Scholar] [CrossRef]
  17. Sun, Y.; Fu, R.; Dickinson, R.; Joiner, J.; Frankenberg, C.; Gu, L.-H.; Xia, Y.-L.; Fernando, N. Drought onset mechanisms revealed by satellite sun-induced chlorophyll fluorescence: Insights from two contrasting extreme events. Geophys. Res. Biogeosci. 2015, 120, 2. [Google Scholar]
  18. Song, L.; Guanter, L.; Guan, K.; You, L.; Huete, A.; Ju, W.; Zhang, Y. Satellite sun-induced chlorophyll fluorescence detects the early response of winter wheat to heat stress in the Indian Indo-Gangetic Plains. Glob. Chang. Biol. 2018, 24, 4023–4037. [Google Scholar] [CrossRef] [Green Version]
  19. Pagán, B.R.; Martens, B.; Maes, W.H.; Miralles, D.G. Satellite observed solar-induced fluorescence to monitor global plant stress. In Proceedings of the First International Electronic conference on the Hydrological Cycle, online, 12–16 November 2017; Multidisciplinary Digital Publishing Institute: Basel, Switzerland, 2017. [Google Scholar]
  20. Liu, L.-Z.; Yang, X.; Zhou, H.-K.; Liu, S.-S.; Zhou, L.; Li, X.-H.; Yang, J.-H.; Han, X.-Y.; Wu, J.-J. Evaluating the utility of solar-induced chlorophyll fluorescence for drought monitoring by comparison with NDVI derived from the wheat canopy. Sci. Total Environ. 2018, 625, 1208–1217. [Google Scholar] [CrossRef]
  21. Liu, L.-Z.; Yang, X.; Zhou, H.-K.; Liu, S.-S.; Zhou, L.; Li, X.-H.; Yang, J.-H.; Wu, J.-J. Relationship of root zone soil moisture with solar-induced chlorophyll fluorescence and vegetation indices in winter wheat: A comparative study based on continuous ground-measurements. Ecol. Ind. 2018, 90, 9–17. [Google Scholar] [CrossRef]
  22. Wang, X.-Y.; Qiu, B.; Li, W.-K.; Zhang, Q. Impacts of drought and heatwave on the terrestrial ecosystem in China as revealed by satellite solar-induced chlorophyll fluorescence. Sci. Total Environ. 2019, 693, 133627. [Google Scholar] [CrossRef]
  23. Liu, C.; Liu, Y.; Guo, K.; Wang, S.; Liu, H.; Zhao, H.; Qiao, X.; Hou, D.; Li, S. Aboveground carbon stock, allocation and sequestration potential during vegetation recovery in the karst region of southwestern China: A case study at a watershed scale. Agric. Ecosyst. Environ. 2016, 235, 91–100. [Google Scholar] [CrossRef]
  24. Cheng, Q.-P.; Gao, L.; Zhong, F.-L.; Zuo, X.-A.; Ma, M.-M. Spatiotemporal variations of drought in the Yunnan- Guizhou Plateau, southwest China, during 1960–2013 and their association with large-scale circulations and historical records. Ecol. Indic. 2020, 112, 106041. [Google Scholar] [CrossRef]
  25. Ma, S.-Y.; Zhang, S.-Q.; Wang, N.-L.; Huang, C.; Wang, X. Prolonged duration and increased severity of agricultural droughts during 1978 to 2016 detected by ESA CCI SM in the humid Yunnan Province, Southwest China. Catena 2021, 198, 105036. [Google Scholar] [CrossRef]
  26. Li, X.-Y.; Li, Y.; Chen, A.-P.; Gao, M.-D.; Slette, I.J.; Piao, S.-L. The impact of the 2009/2010 drought on vegetation growth and terrestrial carbon balance in Southwest China. Agric. For. Meteorol. 2019, 269–270, 239–248. [Google Scholar] [CrossRef]
  27. Fang, Y.-K.; Wang, L.; Su, T.; Lan, Q.-Y. Spring drought as a possible cause for the disappearance of native Metasequoia in Yunnan Province, China: Evidence from seed germination and seedling growth. Glob. Ecol. Cons. 2020, 22, e00912. [Google Scholar]
  28. Niu, Z.-N.; He, H.-L. A spatial-temporal continuous dataset of the transpiration to evapotranspiration ratio in China from 1981–2015. Sci Data. 2020, 7, 369. [Google Scholar] [CrossRef]
  29. Li, X.; Xiao, J. A global 0.05-degree product of solar-induced chlorophyll fluorescence derived from OCO-2, MODIS, and reanalysis data. Remote Sens. 2019, 11, 517. [Google Scholar] [CrossRef] [Green Version]
  30. Li, X.; Xiao, J.; He, B. Chlorophyll fluorescence observed by OCO-2 is strongly related to gross primary productivity estimated from flux towers in temperate forests. Remote Sens. Environ. 2018, 204, 659–671. [Google Scholar] [CrossRef]
  31. Mu, Q.-Z.; Zhao, M.-S.; Kimball, J.S.; McDowell, N.G.; Running, S.W. A remotely sensed global terrestrial drought severity index. Bull. Am. Meteorol. Soc. 2013, 94, 83–98. [Google Scholar] [CrossRef] [Green Version]
  32. Mcvicar, T.R.; Jupp, D.B. The current and potential operational uses of remote sensing to aid decisions on Drought Exceptional Circumstances in Australia. Rev. Agri. Syst. 1998, 57, 399–468. [Google Scholar] [CrossRef]
  33. Li, X.; Xiao, J.; Kimball, J.S.; Reichle, R.H.; Scott, R.L.; Litvak, M.E.; Bohrer, G.; Frankenberg, C. Synergistic use of SMAP and OCO-2 data in assessing the responses of ecosystem productivity to the 2018 U.S. drought. Remote Sens. Environ. 2020, 251, 112062. [Google Scholar] [CrossRef]
  34. Chen, X.; Mo, X.; Zhang, Y.; Sun, Z.; Liu, Y.; Hu, S.; Liu, S. Drought detection and assessment with solar-induced chlorophyll fluorescence in summer maize growth period over North China plain. Ecol. Indic. 2019, 104, 347–356. [Google Scholar] [CrossRef]
  35. Yang, J.; Tian, H.; Pan, S.; Chen, G.; Zhang, B.; Dangal, S. Amazon drought and forest response: Largely reduced forest photosynthesis but slightly increased canopy greenness during the extreme drought of 2015/2016. Glob. Chang. Biol. 2018, 24, 1919–1934. [Google Scholar] [CrossRef] [PubMed]
  36. Ciais, P.; Reichstein, M.; Viovy, N.; Granier, A.; Ogée, J.; Allard, V.; Aubinet, M.; Buchmann, N.; Bernhofer, C.; Carrara, A. Europe-wide reduction in primary productivity caused by the heat and drought in 2003. Nature 2005, 437, 529. [Google Scholar] [CrossRef]
  37. Reichstein, M.; Ciais, P.; Papale, D. Reduction of ecosystem productivity and respiration during the European summer 2003 climate anomaly: A joint flux tower, remote sensing and modelling analysis. Glob. Chang. Biol. 2007, 13, 634–651. [Google Scholar] [CrossRef]
  38. Saatchi, S.; Asefi-Najafabady, S.; Malhi, Y.; Aragao, L.E.O.C.; Anderson, L.O.; Myneni, R.B.; Nemani, R. Persistent effects of a severe drought on Amazonian forest canopy. Proc. Natl. Acad. Sci. USA 2013, 110, 565–570. [Google Scholar] [CrossRef] [Green Version]
  39. Doughty, C.E.; Metcalfe, D.B.; Girardin, C.A.; Amézquita, F.F.; Cabrera, D.G.; Huasco, W.H.; Silva-Espejo, J.E.; Araujo-Murakami, A.; da Costa, M.C.; Rocha, W.; et al. Drought impact on forest carbon dynamics and fluxes in Amazonia. Nature 2015, 519, 78–82. [Google Scholar] [CrossRef] [Green Version]
  40. Meroni, M.; Rossini, M.; Picchi, V.; Panigada, C.; Cogliati, S.; Nali, C.; Colombo, R. Assessing steady-state fluorescence and PRI from hyperspectral proximal sensing as early indicators of plant stress: The case of ozone exposure. Sensors 2008, 8, 1740–1754. [Google Scholar] [CrossRef] [Green Version]
  41. Daumard, F.; Champagne, S.; Fournier, A.; Goulas, Y.; Ounis, A.; Hancock, J.F.; Moya, I. Afield platform for continuous measurement of canopy fluorescence. IEEE Trans. Geosci. Remote. 2010, 48, 3358–3368. [Google Scholar] [CrossRef]
  42. Xie, F.; Fan, H. Deriving drought indices from MODIS vegetation indices (NDVI/EVI) and Land Surface Temperature (LST): Is data reconstruction necessary. Int. J. Appl. Earth Obs. Geoinf. 2021, 101, 102352. [Google Scholar] [CrossRef]
  43. Song, X.P.; Hansen, M.C.; Stehman, S.V.; Potapov, P.V.; Tyukavina, A.; Vermote, E.F.; Townshend, J.R. Global land change from 1982 to 2016. Nature 2018, 560, 639–643. [Google Scholar] [CrossRef] [PubMed]
  44. Wagle, P.; Xiao, X.; Torn, M.S.; Cook, D.R.; Matamala, R.; Fischer, M.L.; Jin, C.; Dong, J.; Biradar, C. Sensitivity of vegetation indices and gross primary production of tallgrass prairie to severe drought. Remote. Sens. Environ. 2014, 152, 1–14. [Google Scholar] [CrossRef]
  45. Klein, T.; Yakir, D.; Buchmann, N.; Grünzweig, J.M. Towards an advanced assessment of the hydrological vulnerability of forests to climate change-induced drought. New. Phytol. 2014, 201, 712–716. [Google Scholar] [CrossRef] [PubMed]
  46. Martínez-Vilalta, J.; Poyatos, R.; Aguadé, D.; Retana, J.; Mencuccini, M. A new look at water transport regulation in plants. New. Phytol. 2014, 204, 105–115. [Google Scholar] [CrossRef] [Green Version]
  47. Ginestar, C.; Castel, J. Responses of young clementine citrus trees to water stress during different phenological periods. Hortic. Sci. 1996, 71, 551–560. [Google Scholar] [CrossRef]
  48. Liu, C.; Zhang, X.-H. The analysis on sensitivity of crops to water forcing in each growth stage. Sci. Meteorol. Sin. 1999, 19, 136–141. [Google Scholar]
  49. Song, L.-S.; Li, Y.; Ren, Y.-H.; Wu, X.-C.; Guo, B.; Tang, X.-G.; Shi, W.-Y.; Ma, M.-G.; Han, X.-J.; Zhao, L. Divergent vegetation responses to extreme spring and summer droughts in Southwestern China. Agric. For. Meteorol. 2019, 279, 107703. [Google Scholar] [CrossRef]
  50. Shen, Q. Relationship of surface soil moisture with solar-induced chlorophyll fluorescence and normalized difference vegetation index in different phenological stages: A case study of Northeast China. Environ. Res. Lett. 2021, 16, 024039. [Google Scholar] [CrossRef]
  51. Anderson, M.C.; Hain, C.; Otkin, J.; Zhan, X.; Mo, K.; Svoboda, M.; Wardlow, B.D.; Pimstein, A. An intercomparison of drought indicators based on thermal remote sensing and NLDAS-2 Simulations with U.S. Drought Monitor classifications. J. Hydrometeorol. 2013, 14, 1035–1056. [Google Scholar] [CrossRef]
  52. Li, Z.-H. Multi-scale coupling characteristics and influencing factors of solar-induced chlorophyll fluorescence and photosynthetic rate in vegetation canopy. D. Nanjing Univ. Sch. Geogr. Ocean. Sci. 2020, 10, 27235. [Google Scholar]
  53. Liu, X.-F.; Feng, X.-M.; Philippe, C.; Fu, B.-J.; Hu, B.-Y.; Sun, Z.-L. GRACE satellite-based drought index indicating the increased impact of drought over major basins in China during 2002–2017. Agric. For. Meteorol. 2020, 291, 108057. [Google Scholar] [CrossRef]
  54. Karnieli, A.; Agam, N.; Pinker, R.T.; Anderson, M. Use of NDVI and land surface temperature for drought assessment: Merits and limitations. J. Clim. 2010, 23, 618–633. [Google Scholar] [CrossRef]
  55. Jung, M.; Reichstein, M.; Schwalm, C.R.; Huntingford, C.; Sitch, S.; Ahlström, A.; Arneth, A.; Camps-Valls, G.; Ciais, P.; Friedlingstein, P.; et al. Compensatory water effects link yearly global land CO2 sink changes to temperature. Nature 2017, 541, 516–520. [Google Scholar] [CrossRef] [PubMed] [Green Version]
  56. Novick, K.A.; Ficklin, D.L.; Stoy, P.C.; Williams, C.A.; Bohrer, G.; Oishi, A.C.; Papuga, S.A.; Blanken, P.D.; Noormets, A.; Sulman, B.N. The increasing importance of atmospheric demand for ecosystem water and carbon fluxes. Nat. Clim. Chang. 2016, 6, 10. [Google Scholar] [CrossRef]
  57. Zhang, Y.; Peña-Arancibia, J.L.; McVicar, T.R.; Chiew, F.H.; Vaze, J.; Liu, C.; Lu, X.; Zheng, H.; Wang, Y.; Liu, Y.Y.; et al. Multi-decadal trends in global terrestrial evapotranspiration and its components. Sci. Rep. 2016, 6, 19124. [Google Scholar] [CrossRef] [Green Version]
  58. Jasechko, S.; Sharp, Z.D.; Gibson, J.J.; Birks, S.J.; Yi, Y.; Fawcett, P.J. Terrestrial water fluxes dominated by transpiration. Nature 2013, 496, 347–350. [Google Scholar] [CrossRef]
  59. Sutanto, S.J.; Wenninger, J.; Coenders-Gerrits AM, J.; Uhlenbrook, S. Partitioning of evaporation into transpiration, soil evaporation and interception: A comparison between isotope measurements and a HYDRUS-1D model. Hydrol. Earth. Syst. Sci. 2012, 16, 2605–2616. [Google Scholar] [CrossRef] [Green Version]
  60. Martens, B.; Miralles, D.G.; Lievens, H.; Van Der Schalie, R.; De Jeu, R.A.; Fernández-Prieto, D.; Beck, H.; Dorigo, W.A.; Verhoest, N. Gleam v3: Satellite-based land evaporation and root-zone soil moisture. Geosci. Model. Dev. 2017, 10, 1903–1925. [Google Scholar] [CrossRef] [Green Version]
  61. Sterling, S.M.; Ducharne, A.; Polcher, J. The impact of global land- cover change on the terrestrial water cycle. Nat. Clim. Chang. 2012, 3, 385–390. [Google Scholar] [CrossRef]
  62. Frank, D.; Reichstein, M.; Bahn, M.; Thonicke, K.; Frank, D.; Mahecha, M.D.; Smith, P.; van der Velde, M.; Vicca, S.; Babst, F.; et al. Effects of climate extremes on the terrestrial carbon cycle: Concepts, processes and potential future impacts. Glob. Chang. Biol. 2015, 21, 2861–2880. [Google Scholar] [CrossRef] [Green Version]
  63. Reichstein, M.; Bahn, M.; Ciais, P.; Frank, D.; Mahecha, M.D.; Seneviratne, S.I.; Zscheischler, J.; Beer, C.; Buchmann, N.; Frank, D.C.; et al. Climate extremes and the carbon cycle. Nature 2013, 500, 287–295. [Google Scholar] [CrossRef] [PubMed]
  64. Sun, Y.; Frankenberg, C.; Wood, J.D.; Schimel, D.S.; Jung, M.; Guanter, L.; Drewry, D.T.; Verma, M.; Porcar-Castell, A.; Griffis, T.J. OCO-2 advances photosynthesis observation from space via solar-induced chlorophyll fluorescence. Science 2017, 358, eaam5747. [Google Scholar] [CrossRef] [PubMed] [Green Version]
  65. Du, S.; Liu, L.; Liu, X.; Zhang, X.; Zhang, X.-Y.; Bi, Y.; Zhang, L. Retrieval of global terrestrial solar-induced chlorophyll fluorescence from TanSat satellite. Sci. Bull. 2018, 63, 1502–1512. [Google Scholar] [CrossRef] [Green Version]
  66. Cheng, L.; Zhang, L.; Wang, Y.-P.; Canadell, G.; Chiew, F.H.S.; Bering, J.; Zhang, Y. Recent increase in terrestrial carbon uptake at little cost to the water cycle. Nat. Commun. 2017, 8, 110. [Google Scholar] [CrossRef] [PubMed]
  67. Cao, J.; Zhou, L.; Yang, H.; Lu, Q.; Kang, Z. Comparison of carbon transfer between forest soils in karst and clasolite areas and the karst carbon sink effect in Maocun village of Guilin. Quaternary Sci. 2011, 31, 431–437. [Google Scholar]
Figure 1. (a) Location of the study area. (b) Land use types.
Forests 14 00049 g001
Figure 2. Average precipitation from 1981 to 2019.
Forests 14 00049 g002
Figure 3. Regional mean interannual variation in (a) temperature (b) precipitation (c) soil moisture and (d) ET in three provinces from July 2009 to June 2010. (The red line shows the monthly average from July 2009 to June 2010, and the black line indicates the multiyear monthly average from 2000 to 2019 (ET is from 2000 to 2015)).
Forests 14 00049 g003
Figure 4. The spatial distributions of the anomalies of (a) temperature, (b) precipitation, (c) soil moisture, and (d) ET in three provinces in the southwest from July 2009 to June 2010.
Forests 14 00049 g004
Figure 5. Regional mean interannual variation in (a) EVI, (b) SIF and (c) DSI in three provinces in the southwest from July 2009 to June 2010. (The red line shows the monthly average from July 2009 to June 2010, and the black line shows the multiyear monthly average from 2000 to 2019 (DSI is from 2000 to 2011)).
Forests 14 00049 g005
Figure 6. The spatial distributions of the anomalies of (ad) EVI, (eh) SIF, and (il) DSI over three provinces in July–September (first column), October–December (second column), January–March (third column), and April–June (fourth column) in 2009–2010.
Forests 14 00049 g006
Figure 7. Relationships between SIF anomalies and drought indicators: (a) monthly SIF anomalies and P anomalies, (b) monthly SIF anomalies and ET anomalies, (c) monthly SIF anomalies and SWC anomalies. The correlation coefficients (R2) and p values are provided in each figure.
Forests 14 00049 g007
Figure 8. Spatial consistency between SIF anomalies and anomalies of temperature, precipitation, SWC, and evapotranspiration in 2009/2010 (*** indicates p level of 0.05).
Forests 14 00049 g008
Disclaimer/Publisher’s Note: The statements, opinions and data contained in all publications are solely those of the individual author(s) and contributor(s) and not of MDPI and/or the editor(s). MDPI and/or the editor(s) disclaim responsibility for any injury to people or property resulting from any ideas, methods, instructions or products referred to in the content.