Abstract
Atmospheric CO2 levels have been increasing, and these changes may result in differential adaptive responses in both genera and species and highlight the need to increase carbon sequestration. Ecophysiological and morphological responses of four early-successional deciduous species were examined under ambient CO2 (aCO2, 400 ppm) and elevated CO2 (eCO2, 800 ppm) treatments. The four species, all of which are used in restoration, were Alnus viridis subsp. crispa (Ait.) Turrill (green alder), A. incana subsp. rugosa (Du Roi) R.T. Clausen (speckled alder), Betula populifolia (Marshall) (gray birch), and B. papyrifera (Marshall) (white birch); all are from the same phylogenetic family, Betulaceae. We examined biochemical efficiencies, gas exchange, chlorophyll fluorescence, chlorophyll concentrations, foliar nitrogen (N), and growth traits. A general linear model, analysis of variance, was used to analyze the functional carbon efficiency and growth differences, if any, among genera, species, and provenances (only for growth traits). The alders had greater biochemical efficiency traits than birches, and alders upregulated these traits, whereas birches mostly downregulated these traits in response to eCO2. In response to eCO2, assimilation either remained the same or was upregulated for alders but downregulated for birches. Stomatal conductance was downregulated for all four species in response to eCO2. Intrinsic water use efficiency was greater for alders than for birches. Alders exhibited a consistent upregulation of stem dry mass and height growth, whereas birches were somewhat lower in height and stem dry mass in response to eCO2. Foliar N played an important role in relation to ecophysiological traits and had significant effects relative to genus (alders > birches) and CO2 (aCO2 > eCO2), and a significant genus × CO2 interaction, with alders downregulating foliar N less than did birches. Covariate analysis examining carbon efficiency traits in relation to foliar N showed clear functional responses. Both species in both genera were consistent in their ecophysiological and morphological responses to CO2 treatments. There was supporting evidence that assimilation was sink-driven, which is related to a plant organ’s ability to continue to grow and incorporate assimilates. The alders used in this study are actinorhizal, and the additional available foliar N, paired with increased stem dry mass sink activity, appeared to be driving upregulation of the carbon efficiencies and growth in response to eCO2. Alders’ greater carbon efficiencies and carbon sequestration in impoverished soils demonstrate that alders, as opposed to birches, should be used to accelerate ecological restoration in a world of increasing atmospheric CO2.
1. Introduction
Atmospheric CO2 levels have been increasing, and these changes may result in differential adaptive responses in both genera and species. Quantifying and understanding plant ecophysiological and morphological responses to CO2 will further our understanding of the various species useful for restoration, reforestation, and carbon sequestration. Growth and survival are determined by a wide range of physiological and morphological responses to environmental factors, including CO2 levels, soil moisture, and nutrient availabilities [,,]. In addition, altered interspecific competitive relationships may impact plant community composition [].
We examined four species from the same phylogenetic family, Betulaceae. Two were alders, namely, speckled alder (Alnus incana subsp. rugosa (Du Roi) R.T. Clausen) and green alder (A. viridis subsp. crispa (Ait.) Turrill). Both species are relatively short-lived, early-successional, deciduous shrubs native to north-eastern North America. Both species are shade intolerant, exhibit rapid early growth, and coppice following harvesting []. Both species are actinorhizal and form symbioses with Frankia alni bacteria, which can fix atmospheric N []. Speckled alder grows in wetter areas [,], and green alder in drier uplands, and both species grow on poor-quality soils []. We also examined two birches, white birch (Betula papyrifera (Marshall)) and gray birch (B. populifolia (Marshall)), both of which are fast-growing, shade intolerant, early successional deciduous species [,]. Gray birch’s natural range is in eastern North America, where it is relatively short-lived, with a longevity of approximately 50 years. It occurs mostly on sandy or gravelly soils, whereas white birch is transcontinental, can live up to 120 years, [] and occurs in a wide range of soil types.
Elevated CO2 (eCO2) often increases assimilation and water use efficiency in the short term, but by variable amounts, with the time depending on species, nutrient, and water availability [,,]. A study investigating water relations in gray birch seedlings under eCO2 (700 ppm) and drought conditions indicated increased tissue elasticity, which allowed plants to maintain positive turgor pressure at lower water potentials []. In an experiment testing leaf water relations of European black alder (Alnus glutinosa (L.) Gaertn.), black alder was found to have high leaf conductance and thus high leaf transpiration on both dry and wet sites, despite differing soil conditions []. This physiological trait was interpreted as being a strategy to maximize productivity where water was not typically limited, but it was noted that it may limit alder growth where groundwater cannot be exploited []. Although little genetic variation information exists in the literature on the four species selected for our study, low genetic differentiation among populations of A. incana (speckled alder) and A. crispa (green alder) in Quebec, Canada, has been suggested by []. This study also found large genetic differences between these species, emphasizing the possible effects of adaptation to differing ecological niches.
Our goal was to examine and compare growth and ecophysiological traits in four North American alder and birch species in response to CO2 treatments. We examined biochemical efficiencies, gas exchange, chlorophyll fluorescence, chlorophyll concentration, foliar N, and growth (height growth of main stem and total stem dry mass) of the four species under ambient CO2 (aCO2, 400 ppm) and eCO2 (800 ppm). We hypothesized that adaptive genetic differences would result in differences in functional carbon efficiencies in response to CO2 treatments, and that these differences would occur at genus, species, and provenance levels (for height growth and total stem dry mass), and aimed to quantify the genetic variation of their responses. To test our hypothesis, we (1) quantified the functional carbon efficiencies and variation attributed to different taxonomic levels (genus, species, and provenance) for various ecophysiological and growth traits for green alder, speckled alder, gray birch, and white birch; (2) examined their ecophysiological and growth responses and possible interactions relative to the CO2 treatments; and (3) used covariate analysis to examine ecophysiological traits in relation to foliar N and tested both CO2 treatments and genera effects within these relationships.
2. Materials and Methods
2.1. Plant Material, Growing Conditions, and Treatment Delivery
Three to five seed sources (provenances) for each of the four hardwood species, namely, green alder, speckled alder, white birch, and gray birch, were used in our study (Table 1). Seed lots were taken from natural populations across three provinces of Canada, mostly from New Brunswick, with some drawn from Nova Scotia and Prince Edward Island. Two to eight seeds were sown in late July of 2020, numbers in accordance to previous germination tests, and grown in hard-sided multi-pot trays of 90 cm3 cell volume at the Atlantic Forestry Center (AFC) in Fredericton, New Brunswick (NB), Canada (45°52′ N, 66°31′ W). Early germinants were culled or moved to empty cells to ensure there was only one seedling per cell. Prior to frozen storage and well into being dormant, the hardwood stems were trimmed to approximately 10 cm, as had become the practice in our restoration experiments, in order to reduce leaf transpiration compared to root water absorption []. Seedlings were removed from trays and placed in bags, which were then boxed for cold storage at −4 to −5 °C in a freezer at AFC.

Table 1.
Seed source and replicates of species and provenances of Betula and Alnus used in the 2021 CO2 experiment. An ‘X’ denotes measurements taken on each seed source of each species.
To prepare the seedlings for the greenhouse experiment, on 18 June, the seedlings were removed from the freezer and stored in a 4 °C refrigerator to properly thaw the plants prior to their planting on 21 June 2021. Seedlings were randomly planted and grown individually in fabric root-control bags that measured 30 cm in diameter and 23 cm in height (Smart Pot PRO 5 Gallon, High Caliper Growing Systems, Oklahoma City, OK, USA) and were filled with screened sand (M.W. Price & Sons, Charter’s Settlement, NB, CA, USA). Bulk soil samples were taken on 31 August 2022, and sent for nutrient and soil texture analysis at the University of New Brunswick in Fredericton. The soil texture properties were, on average, 1.8% clay, 7.8% silt, and 90.4% sand, with no significant nutrient or pH differences between blocks (Table 2). The root-control bags were arranged on a sand-covered gravel surface inside eight custom growth chambers, each measuring 2.3 m wide, 4.25 m long, and 2.1 m in height []. Chambers were covered in UVA-clear 4 mil polyethylene film. Air inside the chambers was delivered and circulated via positive pressure fans, with air conditioner units placed outside each chamber. Plants within the chambers were grown under natural light, with light levels inside the chambers measuring approximately 65% of the ambient levels determined by methods presented by [] (“A simple and efficient method to estimate microsite light availability under a forest canopy”). Watering was regulated using a dripper system of individual spigots in each root bag, which were connected through a common hose system. Sensors within each chamber were connected to a custom-made logging and control system which continuously monitored the sensors within the chambers, including measurements of air temperature and humidity (model HMP 155, Vaisala, Vantaa, Finland, and Model AM2302, Adafruit Industries, New York, NY, USA); soil moisture and temperature (5TM, Decagon Devices, Pullman, WA, USA); and CO2 concentration (Model 840A, Li-COR Inc, Lincoln, NE, USA), which was measured mid-chamber.
Table 2.
Soil nutrient and texture properties (mean ± SE, n = 16).
In each chamber, four replicates of each provenance for each species (Table 1) were distributed randomly. Two CO2 treatments (ambient 400 ppm and elevated 800 ppm) were randomly assigned to four growth chambers, along within a replicate block of each treatment type. The two CO2 treatments comprised ambient treatments (aCO2—No CO2 added, ~400 ppm) and elevated treatments (eCO2—CO2 regulated at ~800 ppm). Elevated-CO2 chambers were regulated through the opening or closing of solenoid valves to control the level of CO2 being delivered via the air stream entering the chamber. Irrigation was maintained at ~15–20% VWC. Irrigation was manually controlled through valves used to deliver water as needed to maintain the desired levels. CO2 treatments began on 21 June 2021, directly after seedlings were planted. Starter fertilizer (Plant-Prod “Forestry Starter” 11:41:8, 287 g/25 L, +250 mL of MgNiFeCa) was supplied to the plants, at half-strength, to all treatments in equal proportions, via the dripper system (30 min = 1 L) on 23 June (15 min), 24th (15 min), 30th (15 min) and 5 July (20 min), 2021. Grower fertilizer (Plant-Prod “Forestry Special” 20:8:20, 625 g/50 L, +1250 mL of MgNiFeCa) was supplied to the plants, at half-strength, to all treatments in equal proportions, via the dripper system (30 min = 1 L) on 9 July (15 min), 6 August (10 min), 27 August (5 min) and 11 October (5 min), 2021.
2.2. Biochemical Efficiencies, Fluorescence, and Gas-Exchange Traits
An LI-6800 portable gas-exchange and fluorescence system (LiCOR, Lincoln, NE, USA) was used to measure assimilation (A) to internal CO2 (A/Ci) in situ, in order to develop curves to determine biochemical efficiencies using graphical presentation and curve-fitting algorithms; their interpretations are described later. Measurements were randomly made on four species from three provenances, using two blocks and two replicates within a block, for two CO2 treatments, between 29 September and 19 October (days 101–121 of treatment), resulting in (4 × 3 × 2 × 2 × 2) 96 A/Ci curves. The instrument was programmed to maintain leaf temperature at 18–22 °C, with an air flow of 600 µmol· s−1, and a saturating photosynthetic photon flux density (PPFD) level of 1000 umol·m−2·s−1. The relative humidity averaged 58%, but was adjusted situationally to maintain a vapor pressure deficit (VPD) of approximately 1.75 kPa in the leaf chamber. Gas exchange (GE) measurements for A/Ci curves were made at 11 different CO2 levels, which were, in order, 400, 330, 260, 190, 120 50, 400, 400, 600, 800, 1200, 1700, and 2200 ppm. Note, 400 ppm was measured three times at the beginning and twice after 50 ppm to ensure the plant had acclimated to such a change. When each leaf was initially placed in the chamber, an ~15 min period was used to stabilize chamber conditions prior to leaf measurements. A settling time of at least 2 min occurred once each CO2 level was reached before measurements were recorded. The A/Ci response curves were fitted using a commercially available Excel-based calculator called “A/Ci curve fitting utility”, version 2007.1, developed by the authors of []. The program uses algorithms to fit estimations for the maximum rate of carboxylation (Vcmax), maximum rate of photosynthetic electron transport (Jmax), and triose phosphate use (TPU). To generate estimations and fit the model, the program utilizes a least-squares fit using the solver add-in by Microsoft Excel.
Additionally, gas exchange (GE) and fluorescence parameters were compared at a common and intermediate CO2 level of 600 ppm, which is the mid-point between CO2 treatments, to examine physiological downregulation. A at 600 ppm CO2 is thus abbreviated as A600. Other GE parameters examined include stomatal conductance at 600 ppm CO2 (Gwv600), and intrinsic water use efficiency at 600 ppm CO2 (iWUE600); the latter of which was calculated as A600 divided by Gwv600. Fluorescence data was also collected from measurements obtained at 600 ppm. Quantum yield of photosystem 2 (ΦPSII) was calculated using light-adapted maximum fluorescence (Fm′) and steady state fluorescence (Ft). Thus, ΦPSII = (Fm′ − Ft)/Fm′. Relative fluorescence (RelFlu) used light-adapted minimum fluorescence (Fo′); thus, RelFlu = (Ft − Fo′)/Fm′.
2.3. Leaf Chlorophyll, Leaf Nitrogen, and Growth Assessment
Leaf chlorophyll and N samples were taken in September 2021 by harvesting two leaves from one individual of each provenance in each chamber. The leaves harvested were mature and taken from the top one-third of each plant. These two leaves were placed into sealed, labeled plastic bags. Once this was completed, all bags were placed into a −80 °C freezer for preservation for later chlorophyll and foliar N analysis. Chlorophyll extractions were randomly made on four species with five provenances (three for speckled alder), based on two blocks and two replicates, given two CO2 treatments (n = 144), which were performed 8 February–14 February. Leaf samples were removed from the −80 °C freezer and kept in a cooler filled with ice to maintain darkness and preserve leaf tissue. Small samples were cut off both leaves mid-blade, as taken from each bag, weighed to the nearest 0.00001 g (AT261 DeltaRange, Mettler Toledo Inc., Columbus, OH, USA), and then placed in a micro centrifuge tube. Note that chlorophyll pigment and N concentrations were the means of the two subsamples taken from each plant. Additionally, empty tubes were included as blanks.
To extract the chlorophyll, 1.5 mL of dimethyl-formamide (DMF) was added to each leaf sample, in addition to the blank tubes, to act as a control when scanned for absorbance. The tubes were then sealed, covered in aluminum foil to prevent light degradation, and placed on an orbital shaker set to 125 rpm (Innova 2000 platform shaker, New Brunswick Scientific, Edison, NJ, USA) for 23 h at room temperature to ensure proper mixing and extraction of chlorophyll. The microplate used for absorbance (Corning COSTAR 3364 Storage Plate, ETC) was first scanned using a spectrophotometer (Ultrospec 2100 pro, Biochrom Ltd., Holliston, MA, USA) at 480, 647, and 664 nm wavelengths for the later correction of absorbance readings. Next, each sample was inverted to ensure proper mixing before 40 μL of liquid was extracted from each tube and added to the same microplate, which was scanned and diluted with 80 μL of DMF. Absorbance readings were again obtained at 480, 647, and 664 nm wavelengths. All blank readings were <0.003 for each wavelength after the plate correction was made. Concentrations (ug·mL−1) of chlorophyll a, chlorophyll b, total chlorophyll (TCC, chlorophyll a + b), and total carotenoids (CAR) were calculated using the previously weighed fresh weight (ug·g−1) of each sample.
Total foliar N was determined for each remaining leaf sample using an elemental analyzer (CNS-2000, LECO Corporation, St. Joseph, MI, USA) service provided by the Laboratory for Forest Soils and Environmental Quality at the University of New Brunswick.
Above-ground biomass was harvested on 16 November 2021 by cutting each plant at 2 cm above soil level. Heights were taken for each plant’s main stem by measuring with a metric tape, as measured to the nearest 0.1 cm, from soil level to the top of the main stem. The initial height of the planted seedling (as previously stated, ~10 cm) was then subtracted from the measured height to account for any deviation in trimmed seedling height. The stems and branches were then stripped of any remaining leaves (which were then discarded), and the stems were placed in labeled paper bags to be dried in ovens at 65 °C for a minimum of 72 h before being weighed using a precision scale capable of measuring to within 0.01 g (accu-4102, Fisher Scientific, Waltham, MA, USA).
2.4. Statistical Analyses
This experiment utilized a randomized block design. The fixed effects in the physiological model were genus, species, and CO2 treatments. Growth chamber (block) and replicate seedlings were random effects. We utilized a general linear model (GLM) to conduct mixed-effects analyses of variance (ANOVA) with nested factors, using Systat version No.13.00.05 (San Jose, CA, USA). The first model was used for biochemical efficiency parameters, gas exchange parameters, chlorophyll fluorescence, chlorophyll pigments, and N concentration:
where Yijkmn denotes the dependent variable of seedlings of the ith growth chamber (block), of the jth genus, of the kth CO2 treatment, of the mth species, and the nth seedling, with µ being the overall mean. Bi refers to the effect of the ith growth chamber (i = 1, 2), Gj is the effect of the jth genus (j = 1, 2), and Ck is the effect of the kth CO2 treatment (k = 1, 2). GCjk is the interaction effect between genus j and CO2 treatment k. Sm(j) is the effect of species m (m = 1, 2) nested in genus j. SCm(j)k is the interactive effect of species m nested in genus j with CO2 treatment k. Lastly, eijkmn is the random error component, incorporating interactions with the growth chamber factor and the variation among seedlings.
Yijkmn = µ + Bi + Gj + Ck + GCjk + Sm(j) + SCm(j)k + eijkmn
For growth traits, the following model was used; the only additional factor was provenance, which was considered a fixed effect, while all others remained the same:
Yijkmno = µ + Bi + Gj + Ck + GCjk + Sm(j) + SCm(j)k + Po(m) + PCo(m)k + eijkmno
Yijklmn denotes the dependent seedling of the ith growth chamber; of the jth genus; of the kth CO2 treatment; of the mth species, or oth provenance; and the nth seedling; with µ being the overall mean. Bi refers to the effect of the ith growth chamber (i = 1, 2), Gj is the effect of the jth genus (j = 1, 2), and Ck is the effect of the kth CO2 treatment (k = 1, 2). GCjk is the interactive effect between genus j and CO2 treatment k. Sm(j) is the effect of species m (m = 1…4) nested in genus j. SCm(j)k is the interactive effect of species m nested in genus j with CO2 treatment k. Po(m) is the effect of provenance o (o = 1…3 or 1…5 depending on species) nested in species m. PCo(m)k is the interactive effect of provenance o nested in species m with CO2 treatment k. Lastly, eijkmno is the random error component, incorporating interactions with the growth chamber factor and the variation among seedlings.
Effects were considered statistically significant at the p = 0.05 level, although all p-values are listed for the reader’s interpretation. Variance component analysis was conducted for the ANOVA tables using the sums of squares following methods outlined in “Variance Component Analysis” in []. The statistical assumptions of residual normality and equal variance were satisfied prior to running either model. The general linear model from Systat version No.13.00.05 (San Jose, CA, USA) was used for these analyses, and if the source of variation for species was significant (p = 0.050), the Tukey mean separation test was used for post hoc analysis.
Covariate analysis was used to evaluate the relationships among species’ mean physiological traits and to test CO2 treatment and genus effects. In these analyses, the dependent variable (e.g., A600) was examined in relation to three sources of variation: (1) covariate (e.g., foliar N), (2) independent effect (e.g., CO2 treatment), and (3) independent effect × covariate (e.g., CO2 treatment × foliar N). The analyses were performed based on the following model:
where Yij is the dependent trait of the ith species of the jth genus treatment. B0 and B1 are average regression coefficients, B0i and B1i the treatment-specific coefficients, Xij the independent variable (e.g., CO2 treatment), and eij the error term. Results were still considered statistically significant at p = 0.050, although individual p-values are provided for all traits so that readers can make their own interpretations of significance, particularly if these results were between p = 0.050 and p = 0.100, which we would consider marginally significant. Simple linear regression was used to examine change in assimilation to change in total stem dry mass from aCO2 to eCO2.
Yij = B0 + B0i + B1Xij + B1iXij + eij
3. Results
3.1. Biochemical Efficiencies and Gas Exchange Parameters
For Vcmax, genus and species were significant, accounting for 32.4 and 10.0% of the total variation, respectively (Table 3). Alders had significantly greater Vcmax than birches, with 29.8 and 21.3 µmol·m−2·s−1, respectively, a 40% difference (Figure 1A). For green alder, speckled alder, gray birch, and white birch, Vcmax values were 28.3, 31.4, 24.3, and 18.4 µmol·m−2·s−1, respectively. In response to eCO2, alders upregulated Vcmax from 28.6 to 31.1 (8.7%) and birches downregulated Vcmax from 22.3 to 20.3 (−9.0%), a near-significant genus × CO2 interaction (p = 0.066). For Jmax, genus, species, and genus × CO2 interaction were significant, accounting for 40.2, 5.3, and 4.1% of total variance, respectively (Table 3). The significant genus × CO2 interaction was due to a rank change in genus response to eCO2. Alders upregulated Jmax from 62.7 to 65.4 (4.3%), and birches downregulated from 48.9 to 38.7 (−20.9%). Despite this, alders had significantly greater Jmax than birches, with 64.0 and 43.8 µmol·m−2·s−1, respectively, a difference of 46% (Figure 1B). For green alder, speckled alder, gray birch, and white birch, the Jmax values were 61.6, 66.5, 48.4, and 39.2 µmol·m−2·s−1, respectively. For TPU, genus, species, and CO2 × genus were significant, accounting for 39.0, 6.4, and 4.4% of total variance, respectively (Table 3). Like Jmax, the significant genus × CO2 interaction was due to alders upregulating and birches downregulating in response to eCO2. Alders had greater TPU than birches, with 4.8 and 3.2 µmol·m−2·s−1, respectively, a 50% difference (Figure 1C). For green alder, speckled alder, gray birch, and white birch, TPU values were 4.6, 5.0, 3.6, and 2.8 µmol·m−2·s−1, respectively.
Table 3.
Biochemical efficiency trait ANOVAs, including source of variation, degrees of freedom (df), mean square values (MS), variance components (VC), p-values, and coefficient of determination (R2). All p-values < 0.05 are in bold print.
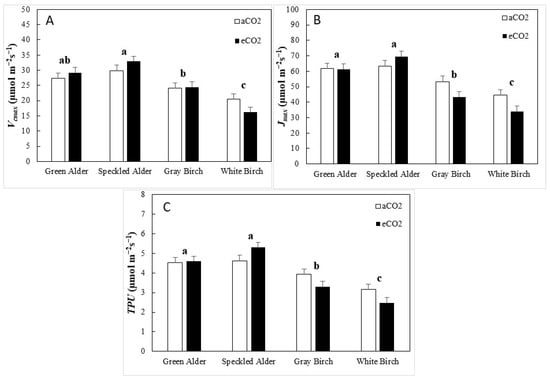
Figure 1.
Biochemical efficiency traits (mean ± SE, n = 96), including, (A)maximum rate of carboxylation (Vcmax), (B) maximum rate of electron transport (Jmax), and (C) triose phosphate utilization (TPU), by species and CO2 treatment type (aCO2 = ambient CO2, eCO2 = elevated CO2). A post hoc Tukey’s mean separation test was performed on species (p = 0.050) for each analysis where species was significant (Table 3). Species with the same letter are not significantly different.
For A600, variations in CO2, genus, species, and genus × CO2 interaction were significant, accounting for 3.5, 41.2, 3.4 and 5.9% of total variation, respectively (Table 4). The interaction between genus and CO2 was significant because alders remained statistically the same under eCO2 (+3%), whereas birches downregulated from 10.3 to 7.3 µmol·m−2·s−1 (−29%). Alders had significantly greater A600 than birches at 13.3 and 8.8 µmol·m−2·s−1, respectively, a 51% difference (Figure 2A). For green alder, speckled alder, gray birch, and white birch, A600 values were 12.8, 13.7, 9.6, and 8.0 µmol·m−2·s−1, respectively. For Gwv600, only CO2 was significant (Table 4). This was due to all species downregulating Gwv600, which decreased on average by 0.096 µmol·m−2·s−1 (−22.9%) under eCO2 (Figure 2B). The Gwv600 for green alder, speckled alder, gray birch, and white birch were 0.347, 0.365, 0.354, and 0.379 µmol·m−2·s−1, respectively. For iWUE600, only genus was significant (Table 4). Alders had a significantly greater iWUE600, with an average of 41.6, whereas birches were 25.8, a 41% difference (Figure 2C). The iWUE600 for green alder, speckled alder, gray birch, and white birch were 41.5. 41.7, 29.9, and 21.6, respectively.
Table 4.
Gas-exchange trait ANOVAs including source of variation, degrees of freedom (df), mean square values (MS), variance components (VC), p-values, and coefficient of determination (R2). All p-values <0.05 are in bold print.
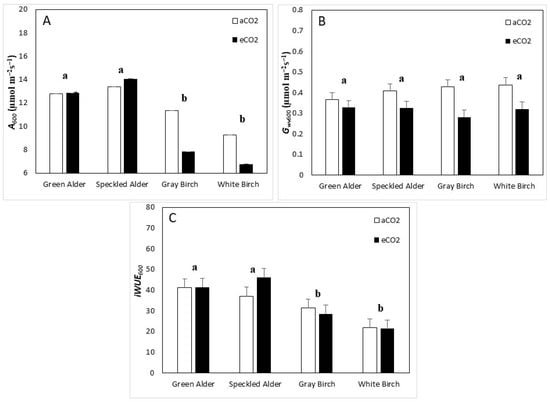
Figure 2.
Gas-exchange traits (mean ± SE, n = 96), including, (A) assimilation at 600 ppm (A600), (B) stomatal conductance at 600 ppm (Gwv600), and (C) intrinsic water-use efficiency at 600 ppm (iWUE600), by species and CO2 treatment type (aCO2 = ambient CO2, eCO2 = elevated CO2). A post hoc Tukey’s mean separation test was performed on species (p = 0.05) for each analysis where species was significant (Table 4). Species with the same letter are not significantly different.
For quantum yield of PSII (ΦPSII), variations in genus, species, CO2, and genus and CO2 interaction were significant, accounting for 42.9, 4.1, 2.4, and 4.8% of the total variation, respectively (Table 5). Alders upregulated/remained the same from aCO2 to eCO2 from 0.34 to 0.35 (+3%), whereas birches downregulated from 0.26 to 0.19 (−26%) (Figure 3A). Alders had a significantly greater ΦPSII than birches at 0.34, as compared to birches at 0.23, a 51% difference. For lower steady-state fluorescence (RelFlu), variation in both genus and species were significant, accounting for 23.7 and 11.5% of the total variation, respectively (Table 5). Birches had greater average RelFlu, at 0.382, compared to alders at 0.319, a 20% difference. As for green alder, speckled alder, gray birch, and white birch, they had RelFlu values of 0.34, 0.30, 0.36, and 0.41, respectively (Figure 3B).
Table 5.
Fluorescence trait ANOVAs, including source of variation, degrees of freedom (df), mean square values (MS), variance components (VC), p-values, and coefficient of determination (R2). All p-values <0.05 are in bold print.
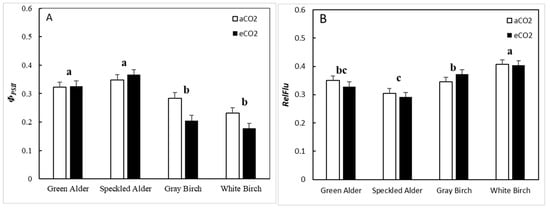
Figure 3.
Fluorescence traits (mean ± SE, n = 96), including, (A) quantum yield of photosystem II (ΦPSII), and (B) steady-state fluorescence (RelFlu), by species and CO2 treatment type (aCO2 = ambient CO2, eCO2 = elevated CO2). A post hoc Tukey’s mean separation test was performed on species (p = 0.05) for each analysis where species was significant (Table 5). Species with the same letter are not significantly different.
3.2. Foliar Chlorophyll Traits and Foliar Nitrogen Analysis
The ANOVA results for CHLa and CHLb were the same as those for total chlorophyll concentration (TCC); thus, only TCC results are presented here. For TCC, variations in genus, species, and CO2 were significant, accounting for 10.4, 7.3, and 5.5% of total variation, respectively (Table 6). Alders had a significantly greater TCC, at 3.1 mg/g, compared to birches at 2.4 mg/g, a 27.3% difference (Figure 4A). The average TCC of green alder, speckled alder, gray birch, and white birch were 2.9, 3.3, 2,8, and 2.1 mg/g, respectively. Total chlorophyll concentration downregulated in response to eCO2 by 0.34 (−11%), on average.
Table 6.
Foliar pigment and nitrogen concentration traits ANOVAs, including the source of variation, degrees of freedom (df), mean square values (MS), variance components (VC), p-values, and coefficient of determination (R2). All p-values < 0.05 are in bold print.
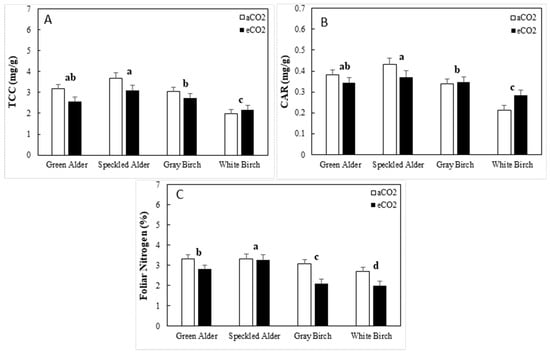
Figure 4.
Foliar pigment and nitrogen concentration traits (mean ± SE, n = 144) including, (A) total foliar chlorophyll concentration (TCC), (B) foliar carotenoids (CAR), and (C) foliar nitrogen concentration by species and CO2 treatment type (aCO2 = ambient CO2, eCO2 = elevated CO2). A post hoc Tukey’s mean separation test was performed on species (p = 0.05) for each analysis where species was significant (Table 6). Species with the same letter are not significantly different.
For carotenoid concentration (CAR), genus, species, and the genus × CO2 interaction were significant, accounting for 12.7, 6.3, and 3.0% of total variation, respectively (Table 6). The interaction was due to alders downregulating CAR by 0.06 mg/g (−14.8%), and birches remaining statistically the same (gray birch) or upregulating (white birch), on average, by 0.03 mg/g (+11.2%). Alders had significantly greater CAR, at 0.381, compared to birches at 0.292, a 30.5% difference. The CAR values of green alder, speckled alder, gray birch, and white birch were 0.36, 0.40, 0.34, and 0.25 mg/g, respectively (Figure 4B).
For foliar N, genus, species, CO2, genus × CO2 and species × CO2 were significant, accounting for 31.1, 3.3, 19.2, 4.7, and 2.2% of total variation, respectively (Table 6). The genus × CO2 interaction was a result of alders remaining statistically the same under eCO2, whereas birches downregulated N from 2.9 to 2.1% (−28.3%). Alders had a significantly greater N than birches, at 3.2% compared to 2.5%, a 30.4% difference. The N values of green alder, speckled alder, gray birch, and white birch were 3.1, 3.3, 2.6, and 2.4%, respectively (Figure 4C). The species × CO2 interaction was because green alder downregulated under eCO2, from 3.2% to 2.8% (−16%), and speckled alder from 3.31% to 3.27 (−1%). Gray birch and white birch downregulated from 3.1 to 2.1% (−32%) and 2.7 to 2.0%, respectively (−26%).
3.3. Main Stem Height Growth and Total Stem Dry Mass
For main stem height growth, species and genus × CO2 interaction were significant, accounting for 25.3 and 11.7% of total variation, respectively (Table 7). The CO2 × genus interaction was a result of alders’ upregulated height growth under eCO2; on average, this was by 19.22 cm (+31.2%), whereas birches downregulated by 14.6 cm on average (−18.8%). The height growth of green alder, speckled alder, gray birch, and white birch were 89.3, 53.3, 72.3, and 67.9 cm, respectively (Figure 5A).
Table 7.
Growth traits ANOVAs, including the source of variation, degrees of freedom (df), mean square values (MS), variance components (VC), p-values, and coefficient of determination (R2). All p-values < 0.05 are in bold print.
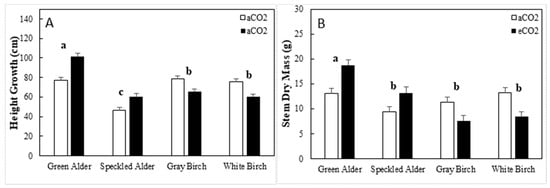
Figure 5.
Growth traits (mean ± SE, n = 319) including, (A) height growth, and (B) stem dry mass by species and CO2 treatment type (aCO2 = ambient CO2, eCO2 = elevated CO2). A post hoc Tukey’s mean separation test was performed on species (p = 0.05) for each analysis where species was significant (Table 7). Species with the same letter are not significantly different.
For total stem dry mass, genus, species, and genus × CO2 interaction were significant, accounting for 5.3, 5.0, and 9.4% of total variation, respectively (Table 7). The genus × CO2 interaction was due to alders upregulating total stem dry mass by 4.8 g (+42.9%) and birches downregulating by 4.3 g (−34.9%). The average total stem dry mass of alders was 33% higher than that of birches, at 13.6 and 10.2 g, respectively. The total stem dry mass of green alder, speckled alder, gray birch, and white birch were 15.9, 11.3, 9.5, and 10.8 g, respectively (Figure 5B).
3.4. Covariate Analysis
Covariate analysis of Vcmax in relation to N, testing the CO2 effect, had no significant CO2 × N interaction (p = 0.746). Further analysis showed a significant CO2 effect (p = 0.028), and N response (p = 0.003), resulting in two separate parallel lines for which, in both, Vcmax had a positive correlation with N. This correlation was greater under eCO2 than under aCO2 (Figure 6A). Covariate analysis of A600 in relation to N, testing the CO2 effect, had no significant CO2 × N interaction (p = 0.859). Further analysis showed a significant CO2 effect (p = 0.009) and N response (p < 0.001), resulting in two separate parallel lines for which, in both, A600 had a positive correlation with N. This correlation was greater under eCO2 than under aCO2 (Figure 6B). Covariate analysis of iWUE600 in relation to N, testing CO2 effect, had no significant CO2 × N interaction (p = 0.188) (Figure 6C). Further analysis showed a significant CO2 effect (p = 0.005) and N response (p = 0.001), resulting in two separate parallel lines in which iWUE600 had a positive correlation with N. This correlation was greater under eCO2 than under aCO2 (Figure 6C). Covariate analysis of TCC in relation to N, testing the CO2 effect, had a significant CO2 × N interaction (p = 0.049) as well as significant CO2 (p = 0.047) and N (p = 0.013), resulting in two lines with different slopes (Figure 6D). The slope under eCO2 was less than that under eCO2, indicating a lower increase in TCC with increases in foliar N, compared to aCO2.
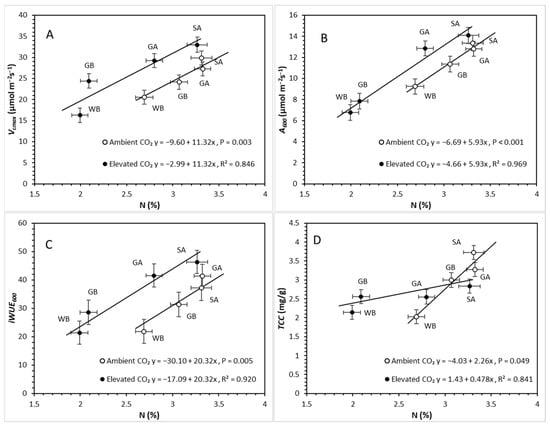
Figure 6.
Relationships between (A) maximum rate of carboxylation (Vcmax) (mean ± SE), (B) assimilation at 600 ppm (A600) (mean ± SE), (C) intrinsic water use efficiency (iWUE600) (mean ± SE), and (D) total chlorophyll concentration (TCC) (mean ± SE) and foliar nitrogen concentration (N) (mean ± SE), testing CO2 treatment as an independent effect across species (GA = green alder, SA = speckled alder, GB = gray birch, WB = white birch) under ambient and elevated CO2 concentrations.
Covariate analysis of Vcmax in relation to N, testing genus effect, had no significant genus × N interaction (p = 0.777) or genus effect (p = 0.108), but did have a significant N response (p = 0.034), resulting in a single line which indicated a positive correlation between Vcmax and foliar N. An increase in N is associated with an increase in Vcmax (Figure 7A). Covariate analysis of A600 in relation to N, testing genus effect, had no significant genus × N interaction (p = 0.130), but did demonstrate a significant genus effect (p = 0.033) and a significant N response (p = 0.007), indicating that alders had a higher baseline assimilation rate, although the same positive correlation with N (Figure 7B). Covariate analysis of iWUE in relation to N, testing genus effect, had no significant genus × N interaction (p = 0.689) or significant N response (p = 0.494), but did have a significant genus effect, resulting in separate parallel lines with no slope (p = 0.002), indicating a lack of correlation with N, but genus differences in which alders had greater iWUE600 (Figure 7C). Covariate analysis of TCC in relation to N, testing genus effect, had no significant genus × N interaction (p = 0.368) or genus effect (p = 0.644), but did have a significant N response (p = 0.043), resulting in a single response line, which indicated a positive increase in TCC as N increases (Figure 7D).
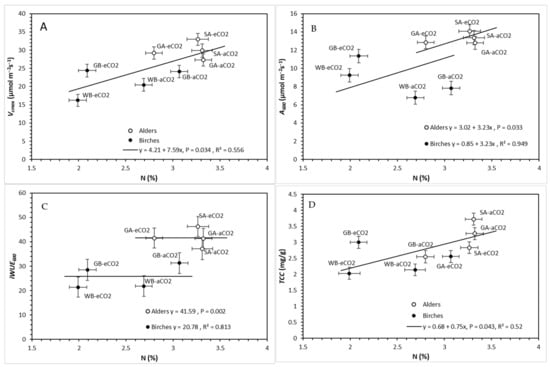
Figure 7.
Relationships between (A) maximum rate of carboxylation (Vcmax) (mean ± SE), (B) assimilation at 600 ppm (A600) (mean ± SE), (C) intrinsic water use efficiency (iWUE600) (mean ± SE), and (D) total chlorophyll concentration (TCC) (mean ± SE) and foliar nitrogen concentration (N) (mean ± SE), testing genus as an independent effect under ambient and elevated CO2 concentrations (aCO2 = ambient CO2, eCO2 = elevated CO2). Species in figures are abbreviated as GA = green alder, SA = speckled alder, GB = gray birch, and WB = white birch.
The simple linear regression of change in A600 between aCO2 and eCO2 treatments (ΔA600) in relation to change in total stem dry mass between a CO2 and eCO2 treatments (ΔStem dry mass) (Figure 8) had a strong coefficient of determination, R2 = 0.842, but was marginally significant (p = 0.082,). The alders clearly had greater positive change in assimilation and biomass stimulation compared to the birches; thus, the line was made into a dashed line to indicate marginal significance, which ranged between p = 0.050 and p = 0.100.
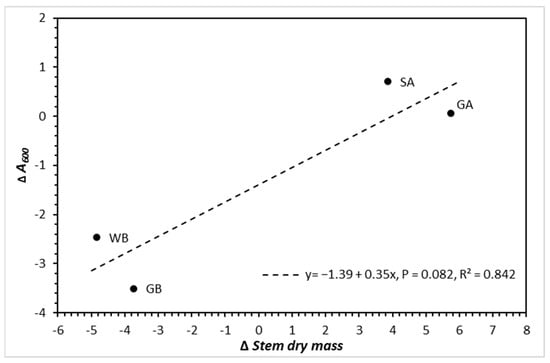
Figure 8.
Delta assimilation (change in assimilation from ambient CO2 to elevated CO2) in relation to delta dry mass (change in dry mass from ambient CO2 to elevated CO2) by species (abbreviated as—GA = green alder, SA = speckled alder, GB = gray birch, and WB = white birch). Note that the line is dashed, as it was between p = 0.050 and p = 0.100.
4. Discussion
Consistent genus and species patterns for biochemical efficiency and some gas exchange (GE) responses to eCO2 were found. Genus was most often the most influential factor, accounting for 23.9–41.2% of the total variation for maximum rate of carboxylation (Vcmax), maximum rate of electron transport (Jmax), triose phosphate utilization (TPU), assimilation at 600 ppm (A600), and intrinsic water use efficiency at 600 ppm (iWUE600). Under eCO2, these traits either remained the same or were upregulated in alders, whereas birches either downregulated or showed no change. Previous study [] observed downregulation of Vcmax and Jmax in white birch in response to eCO2 and increased temperature, while [] found increased stem dry mass growth in speckled alder and green alder in response to eCO2, indicating greater photosynthetic efficiency. Stomatal conductance (Gwv600) is the only variable for which genus was not a significant factor and for which CO2 had the largest effect, accounting for 15.4% of total variation, and downregulated for all species. Reduction in stomatal conductance is a common phenomenon in response to eCO2, and thus it contributes to increased iWUE [,,,]. Alders had greater iWUE600 than the birches, and this was driven by a greater A600 and equal Gwv600 among genus and species.
Assimilation and assimilation-related traits have been found to downregulate over time in response to eCO2 [,,]. Greater atmospheric CO2 can lead to declines in photosynthetic capacities, carboxylation efficiencies, electron transport, and chlorophyll concentrations [,], all of which we report here. The mechanism behind this can be a buildup of non-structural carbohydrates in the leaves, resulting from a lack of sink activity [,], and resulting in TPU limitation, which is a reduction in carbon exportation from the Calvin–Benson cycle []. We also see evidence of sink-driven photosynthesis by examining the changes in assimilation to changes in total stem dry mass from aCO2 to eCO2. This phenomenon has also been demonstrated by others [,,].
The greater quantum yield of photosystem II (ΦPSII) and lower steady-state fluorescence (RelFlu) in alders indicated a greater fluorescence quenching due to photosynthesis compared to that in birches. The variance attributed to the genus × CO2 interaction was 4.8%, and was driven by upregulation of ΦPSII under eCO2 for alders but downregulation of ΦPSII in birches, similar to biochemical efficiency traits; however, there are few works in the literature describing this trait or these genus × CO2 interactions. The effects of eCO2 on ΦPSII in the current literature appear to be variable and dependent on the plants being used, with some publications finding decreases, and some finding instances of little to no difference [,,]. Another possibility is that the downregulation of ΦPSII is driven by nutrient limitation, primarily foliar N or phosphorus (P). Unfortunately, we did not measure leaf P concentrations. It has been suggested that some plants under eCO2 have an increased sensitivity to P limitation, causing assimilation downregulation (Adr), as well as downregulation of ΦPSII, quantum efficiency (Fv’/Fm’), and electron transport rate [,]. Additionally, a meta-analysis of P limitation on growth traits and gas exchange responses showed that P, when present in limited quantities, does inhibit A stimulation by eCO2 and lowers WUE when in conjunction with eCO2 [], but we did not find this. Foliar N was measured and downregulated for all species under eCO2 and had a significant genus × CO2 interaction, which was a result of alders not downregulating N as much as did birches and was likely the main factor in birch assimilation downregulation. A N decrease is known to be a limiting factor, as it is a vital nutrient for the composition of the photosynthetic apparatus [,,]. Relative fluorescence was driven only by genus and species effects in a direction contrary to the ΦPSII and biochemical efficiencies. This result reflects the light energy that was not quenched by photosynthesis and was lost to fluorescence, and again, little exists in the literature on this trait under elevated CO2, especially for the species used in our experiment.
Both a limited sink-effect and foliar N limitations were likely driving the greater downregulation in birches. Alders often grow multiple main shoots, as opposed to birches, which typically grow a single stem. This provides additional sink activity for alders, a capacity which aligns with our total stem dry mass results. The positive linear regression of change in A600 to change in total stem dry mass supports the sink-driven photosynthetic regulation. Maximum rate of carboxylation also has a positive relationship to foliar N, and genus was not a significant factor; however, there was a strong genera segregation along the same response line driven by alders having greater N concentration and Vcmax. Genus was significant in the A600 analysis, indicating greater overall A600 and N values for alders compared to birches. Genus and species differences can often occur for assimilation efficiencies and growth traits, especially when examining fertilized and non-fertilized treatment effects [,,]. Both alder species used in this study are actinorhizal and form symbiotic relationships with Frankia alni bacteria [], which allows the species to fix atmospheric N through the formation of root nodules. Other studies indicate that N fertilization given to plants under eCO2 can restore biochemical efficiencies [,]. As birches do not form this symbiosis, foliar N concentrations were lower, and, thus, so were the assimilation and biochemical efficiencies. This linear relationship between Vcmax and foliar N concentration and testing CO2 treatments has been found before in Pinus radiata [], sitka spruce [], and soybeans []. The biochemical efficiency responses to eCO2 are consistent with height growth and total stem dry mass; alders showed increased height growth and total stem dry mass in response to eCO2, whereas these values for birches were slightly reduced.
Assimilation at 600 ppm had a positive relationship to foliar N under both aCO2 and eCO2, which drove the positive iWUE600 to foliar N relationship, along with the Gwv600 decrease in response to eCO2. A study involving red alder (Alnus rubra Bong.) found a similar effect when analyzing iWUE (A/g), wherein increased iWUE was a product of increased A for a given stomatal conductance []. This would explain why iWUE600 values were lower for birches, given that N, and thus A600, had greater downregulation under eCO2. Ref. [] found that low N concentrations lowered dry matter in Canna edulis Ker-Gawler, and subsequently lowered iWUE. This was proposed to be a function of lower assimilation. Does this mean that iWUE is always driven by A rather than Gwv under eCO2? Not necessarily, and a search of the current literature finds inconsistent responses. Downregulation of Gwv in response to eCO2 appears to be common [,], but other studies have found little to no change [,,].
Total chlorophyll content and CAR decreased for alders and gray birch and were not consistent among species. Thus, TCC and CAR do not appear to be main factors driving alder upregulation. As both alder species used in this study are actinorhizal, it appears that foliar N is likely not limiting alder photosynthetic capacity, as previously discussed. Our foliar N analysis shows that downregulation of TCC and CAR appears to be related to N downregulation, but not necessarily completely in balance. This relationship is confirmed through the covariate analysis of TCC and N, with genus as a covariate (Figure 7D). Genus itself was not significant, but instead, genus was segregated on the same covariate line. Under eCO2, the decreases in foliar N for green alder and speckled alder were 15.5% and 7.9%, respectively, whereas the decreases were 29.9% and 26.6% for gray birch and white birch. Foliar N had a greater effect on TCC under aCO2 than under eCO2, which is indicated by a more gradual slope between TCC and N (Figure 6D). Lower TCC under eCO2 is often seen in the literature [,,,,], and usually found alongside a decrease in foliar N, which is interpreted as a reallocation of N away from the photosynthetic apparatus [,]. The greater foliar N and the symbiotic relationship with Frankia alni bacteria explains why alders exhibited less N downregulation than did birches under eCO2, although this does not explain why TCC and CAR did not downregulate as much for birches, as their foliar N downregulated more.
For first-year height growth, genus only accounted for 0.1% of the total variation, which means that, despite the many physiological differences we found between genera, height growth between genera were very similar. Species accounted for half of the defined sources of variation: 25%. This means that the height growth variation between species within genus was highly variable. Provenances (seed sources) accounted for 4.2% of the total variation, and this was marginally significant (p = 0.087). In contrast, for total stem dry mass, genus accounted for 5.3% of the total variation, and this was highly significant; this is due to the multiple-stem trait of alders, compared to birches, which in most cases only have one stem. Species within a genus for total stem dry mass accounted for 5 times less variation (5%) than height growth, and provenance accounted for less than 2% of the total variation for total stem dry mass. It should be noted that most of the seed sources were from various parts of the New Brunswick province, with a few originating from the neighboring provinces of Nova Scotia and Prince Edward Island. It is important to consider that these results are only for first-year growth, and warrant some caution. Why does genus account for between 23–42% of total variation for gas-exchange-related traits and, for chlorophyll content, between 10–13% of total variation, but height growth and total stem dry mass genus variation only account for 0.1–5% of the variation? The answer is in the second-year dry mass results. For coppice regrowth, genus accounted for 34% of height growth variation and an astounding 74% of total stem dry mass variation in the second year []. It appears that the physiological traits are working towards the later, second-year dry mass trait results. In addition, the results found in first- and second-year growth on barren restoration sites [] found small differences among genus and species in the first year, but up to approximately 13 times greater dry mass for alders, as compared to birches, in the second year.
5. Conclusions
Alders and birches are early successional deciduous species from the same phylogenetic family, Betulaceae. Alders had greater biochemical efficiencies, assimilation, intrinsic water use efficiency, photochemical yield, chlorophyll pigments, and foliar N than birches. Alders had a greater positive response to eCO2 than did birches for these traits. This was reflected in total stem dry mass results in response to eCO2. Alders are actinorhizal and form symbioses with Frankia alni bacteria, which allows the genera to fix atmospheric N through the formation of root nodules in exchange for photosynthates. This relationship allowed alders to take advantage of eCO2, mitigate assimilation downregulation, and sequester more carbon, unlike the birches. Covariate analysis examining carbon assimilation traits in relation to foliar N showed clear positive physiological functional responses to foliar N. Both species in each genus behaved similarly. With atmospheric CO2 continuing to increase, restoration planting with alders secures greater carbon sequestration and would accelerate the reclamation of impoverished sites.
Author Contributions
J.E.M. designed and co-analyzed the experiment and co-authored the manuscript. A.B. managed the experiment, co-analyzed the data, and co-authored the manuscript. All authors have read and agreed to the published version of the manuscript.
Funding
This research received Canadian Department of National Defense (DND) Environmental Services Branch (ESB) funding and was supported by the Department of Natural Resources Canada.
Data Availability Statement
Contact corresponding author regarding data.
Acknowledgments
We gratefully acknowledge the useful edits and comments received from John Kershaw, Alex Mosseler, Myriam Barbeau, and Jasen Golding. We are also grateful for the support from Noah Pond, Deanna McCullum, and Meagan Betts from DND ESB. In addition, we are grateful to the following for the technical help in the establishment and management of the experiment: Dominic Galea, Shawn Palmer, John Malcom, Will Bradley, Megan Hall, and Josh Kilburn.
Conflicts of Interest
The authors declare no conflicts of interest.
References
- da Costa, A.C.L.; Galbraith, D.; Almeida, S.; Takeshi, B.; Portela, T.; da Costa, M.; de Athaydes, S.J.J.; Braga, A.P.; de Gonçalves Paulo, H.L.; de Oliveira, A.A.R.; et al. Effect of 7 yr of experimental drought on vegetation dynamics and biomass storage of an eastern Amazonian rainforest. New Phytol. 2010, 187, 579–591. [Google Scholar] [CrossRef] [PubMed]
- Dirnböck, T.; Foldal, C.; Djukic, I.; Kobler, J.; Haas, E.; Kiese, R.; Kitzler, B. Historic nitrogen deposition determines future climate change effects on nitrogen retention in temperate forests. Clim. Chang. 2017, 144, 221–235. [Google Scholar] [CrossRef]
- Major, J.E.; Mosseler, A.; Malcolm, J.W. Assimilation Efficiencies and Gas Exchange Responses of Four Salix Species in Elevated CO2 under Soil Moisture Stress and Fertilization Treatments. Forests 2022, 13, 776. [Google Scholar] [CrossRef]
- van Breugel, M.; van Breugel, P.; Jansen, P.A.; Martínez-Ramos, M.; Bongers, F. The relative importance of above- versus belowground competition for tree growth during early succession of a tropical moist forest. Plant Ecol. 2012, 213, 25–34. [Google Scholar] [CrossRef]
- Farrar, J.L.; Canadian Forest Service. Trees in Canada; Fitzhenry & Whiteside Ltd.: Ottawa, ON, Canada, 1995. [Google Scholar]
- Schwencke, J.; Caru, M. Advances in Actinorhizal Symbiosis: Host Plant- Frankia Interactions, Biology, and Applications in Arid Land Reclamation. A Review. Arid Land Res. Manag. 2010, 15, 285–327. [Google Scholar] [CrossRef]
- Alnus viridis subsp. crispa. In Fire Effects Information System; US Forest Service: Washington, DC, USA, 2014. Available online: https://www.fs.usda.gov/database/feis/plants/shrub/alnvirc/all.html (accessed on 23 March 2022).
- Alnus incana. In Fire Effects Information System; US Forest Service: Washington, DC, USA, 2014. Available online: https://www.fs.usda.gov/database/feis/plants/tree/alninc/all.html (accessed on 17 March 2022).
- Betula papyrifera. In Fire Effects Information System; US Forest Service: Washington, DC, USA, 2014. Available online: https://www.fs.usda.gov/database/feis/plants/tree/betpap/all.html (accessed on 7 November 2022).
- Betula populifolia. In Fire Effects Information System; US Forest Service: Washington, DC, USA, 2014. Available online: https://www.fs.usda.gov/database/feis/plants/tree/betpop/all.html (accessed on 23 March 2022).
- Medlyn, B.E.; Barton, C.V.M.; Broadmeadow, M.S.J.; Ceulemans, R.; De Angelis, P.; Forstreuter, M.; Freeman, M.; Jackson, S.B.; Kellomäki, S.; Laitat, E.; et al. Stomatal conductance of forest species after long-term exposure to elevated CO2 concentration: A synthesis. New Phytol. 2001, 149, 247–264. [Google Scholar] [CrossRef]
- Duan, H.; Huang, G.; Zhou, S.; Tissue, D.T. Dry mass production, allocation patterns and water use efficiency of two conifers with different water use strategies under elevated [CO2], warming and drought conditions. Eur. J. For. Res. 2018, 137, 605–618. [Google Scholar] [CrossRef]
- Morse, S.R.; Wayne, P.; Miao, S.L.; Bazzaz, F.A. Elevated CO2 and drought alter tissue water relations of birch (Betula populifolia Marsh.) seedlings. Oecologia 1993, 95, 599–602. [Google Scholar] [CrossRef]
- Eschenbach, C.; Kappen, L. Leaf water relations of black alder [Alnus glutinosa (L.) gaertn.] growing at neighbouring sites with different water regimes. Trees-Struct. Funct. 1999, 14, 28–38. [Google Scholar] [CrossRef]
- Bousquet, J.; Cheliak, W.M.; Lalonde, M. Allozyme variation within and among mature populations of speckled alder (Alnus rugosa) and relationships with Green Alder (A. crispa). Am. J. Bot. 1988, 75, 1678–1686. [Google Scholar] [CrossRef]
- Galea, G.; Major, J.E. First-Year Mortality of Four Early-Successional Species on Severely Degraded Sites in Eastern Canada as Influenced by a Factorial of Site Preparation Treatments. Natural Resources Canada, Canadian Forest Service–Atlantic Forestry Centre, Fredericton, New Brunswick. Forests 2024, 15, 143. [Google Scholar] [CrossRef]
- Parent, S.; Messier, C. A simple and efficient method to estimate microsite light availability under a forest canopy. Can. J. For. Res. 1996, 26, 151–154. [Google Scholar] [CrossRef]
- Sharkey, T.D.; Bernacchi, C.J.; Farquhar, G.D.; Singsaas, E.L. In Practice: Fitting photosynthetic carbon dioxide response curves for C3 leaves. Plant Cell Environ. 2007, 30, 1035–1040. [Google Scholar] [CrossRef] [PubMed]
- Hicks, C.R. Fundamental Concepts in Design of Experiments, 3rd ed.; Hold, Reinhart and Winston: New York, NY, USA, 1982. [Google Scholar]
- Wang, L.; Zheng, J.; Wang, G.; Dang, Q. Increased leaf area compensated photosynthetic downregulation in response to elevated CO2 and warming in white birch. Can. J. For. Res. 2022, 52, 1176–1185. [Google Scholar] [CrossRef]
- Pourhassan, N.; Wichard, T.; Roy, S.; Bellenger, J.-P. Impact of elevated CO2 on metal homeostasis and the actinorhizal symbiosis in early successional alder shrubs. Environ. Exp. Bot. 2015, 109, 168–176. [Google Scholar] [CrossRef]
- Ainsworth, E.A.; Rogers, A. The response of photosynthesis and stomatal conductance to rising [CO2]: Mechanisms and environmental interactions. Plant Cell Environ. 2007, 30, 258–270. [Google Scholar] [CrossRef]
- Eamus, D. The interaction of rising CO₂ and temperatures with water use efficiency. Plant Cell Environ. 1991, 14, 843–852. [Google Scholar] [CrossRef]
- Crous, K.Y.; Ellsworth, D.S. Canopy position affects photosynthetic adjustments to long-term elevated CO2 concentration (FACE) in aging needles in a mature Pinus taeda forest. Tree Physiol. 2004, 24, 961–970. [Google Scholar]
- Ainsworth, E.A.; Long, S.P. What have we learned from 15 years of free-air CO2 enrichment (face)? A meta-analytic review of the responses of photosynthesis, canopy properties and plant production to rising CO2. New Phytol. 2005, 165, 351–371. [Google Scholar] [CrossRef]
- Eguchi, N.; Karatsu, K.; Ueda, T.; Funada, R.; Takagi, K.; Hiura, T.; Sasa, K.; Koike, T. Photosynthetic responses of birch and alder saplings grown in free air CO2 enrichment system in northern Japan. Trees 2008, 22, 437–447. [Google Scholar] [CrossRef]
- Quebbeman, J.A.; Ramirez, J.A. Optimal allocation of leaf-level nitrogen: Implications for covariation of Vcmax and Jcmax and photosynthetic downregulation. J. Geophys. Res. Biogeosci. 2016, 121, 2464–2475. [Google Scholar] [CrossRef]
- Crous, K.; Zaragoza-Castells, J.; Low, M.; Ellsworth, D.; Tissue, D.; Tjoelker, M.; Barton, C.; Gimeno, T.; Atkin, O. Seasonal acclimation of leaf respiration in Eucalyptus saligna trees: Impacts of elevated atmospheric CO2 and summer drought. Glob. Change Biol. 2010, 17, 1460–1576. [Google Scholar] [CrossRef]
- Sugiura, D.; Betsuyaku, E.; Terashima, I. Interspecific differences in how sink–source imbalance causes photosynthetic downregulation among three legume species. Ann. Bot. 2019, 123, 715–726. [Google Scholar] [CrossRef] [PubMed]
- Yang, J.T.; Preiser, A.L.; Li, Z.; Weise, S.E.; Sharkey, T.D. Triose phosphate use limitation of photosynthesis: Short-term and long-term effects. Planta 2016, 243, 687–698. [Google Scholar] [CrossRef]
- Arp, W.J. Effects of source-sink relations on photosynthetic acclimation to elevated CO2. Plant Cell Environ. 1991, 14, 869–875. [Google Scholar] [CrossRef]
- Centritto, M. Source-sink relations affect growth but not the allocation pattern of birch (Betula pendula Roth) seedlings under elevated [CO2]. Plant Biosyst. 2000, 134, 31–37. [Google Scholar] [CrossRef]
- Major, J.E.; Mosseler, A.; Malcolm, J.W. Genetic variation among pines and spruces in assimilation efficiencies and photosynthetic regulation under elevated CO2. Trees 2018, 32, 215–229. [Google Scholar] [CrossRef]
- Singh, S.K.; Reddy, V.R. Combined effects of phosphorus nutrition and elevated carbon dioxide concentration on chlorophyll fluorescence, photosynthesis, and nutrient efficiency of cotton. J. Plant Nutr. Soil Sci. 2014, 177, 892–902. [Google Scholar] [CrossRef]
- Barickman, T.C.; Adhikari, B.; Sehgal, A.; Walne, C.H.; Reddy, K.R.; Gao, W. Drought and Elevated CO2 Impacts Photosynthesis and Biochemicals of Basil (Ocimum basilicum L.). Stresses 2021, 1, 16. [Google Scholar] [CrossRef]
- Li, Y.; Li, X.; Li, Y.; Zhuang, S.; Feng, Y.; Lin, E.; Han, X. Does a large ear type wheat variety benefit more from elevated CO2 than that from small multiple ear-type in the quantum efficiency of psii photochemistry? Front. Plant Sci. 2021, 12, 697823. [Google Scholar] [CrossRef]
- Singh, S.K.; Reddy, V.R. Response of carbon assimilation and chlorophyll fluorescence to soybean leaf phosphorus across CO2: Alternative electron sink, nutrient efficiency, and critical concentration. J. Photochem. Photobiol. B Biol. 2015, 151, 276–284. [Google Scholar] [CrossRef]
- Jiang, M.; Caldararu, S.; Zhang, H.; Fleischer, K.; Crous, K.Y.; Yang, J.; De Kauwe, M.G.; Ellsworth, D.S.; Reich, P.B.; Tissue, D.T.; et al. Low phosphorus supply constrains plant responses to elevated CO2: A meta-analysis. Glob. Chang. Biol. 2020, 26, 5856–5873. [Google Scholar] [CrossRef] [PubMed]
- Aranjuelo, I.; Pérez, P.; Hernández, L.; Irigoyen, J.J.; Zita, G.; Martínez-Carrasco, R.; Sánchez-Díaz, M. The response of nodulated alfalfa to water supply, temperature and elevated CO2: Photosynthetic downregulation. Physiol. Plant. 2005, 123, 348–358. [Google Scholar] [CrossRef]
- Crous, K.Y.; Walters, M.B.; Ellsworth, D.S. Elevated CO2 concentration affects leaf photosynthesis—Nitrogen relationships in Pinus teada over nine years in FACE. Tree Physiol. 2008, 28, 607–614. [Google Scholar] [CrossRef] [PubMed]
- Walker, A.P.; Beckerman, A.P.; Gu, L.; Kattge, J.; Cernusak, L.A.; Domingues, T.F.; Scales, J.C.; Wohlfahrt, G.; Wullschleger, S.D.; Woodward, F.I. The relationship of leaf photosynthetic traits—V cmax and J max—to leaf nitrogen, leaf phosphorus, and specific leaf area: A meta-analysis and modeling study. Ecol. Evol. 2014, 4, 3218–3235. [Google Scholar] [CrossRef] [PubMed]
- Haworth, M.; Heath, J.; McElwain, J. Differences in the response sensitivity of stomatal index to atmospheric CO2 among four genera of Cupressaceae confiers. Ann. Bot. 2010, 105, 411–418. [Google Scholar] [CrossRef]
- Ellsworth, D.S.; Reich, P.B.; Nauburg, E.S.; Koch, G.W.; Kubiske, M.E.; Smith, S.D. Photosynthesis, carboxylation and leaf nitrogen responses of 16 species to elevated pCO2 across four free-air CO2 enrichment experiments in forest, grassland and desert. Glob. Chang. Biol. 2004, 10, 2121–2138. [Google Scholar] [CrossRef]
- Oren, R.; Ellsworth, D.S.; Johnsen, K.H.; Phillips, N.; Ewers, B.E.; Maier, C.; Schafer, K.V.; McCarthy, H.; Hendrey, G.; McNulty, S.G.; et al. Soil fertility limits carbon sequestration by forest ecosystems in a CO2-enriched atmosphere. Nature 2001, 411, 469–472. [Google Scholar] [CrossRef]
- Walcroft, A.S.; Whitehead, D.; Silvester, W.B.; Kelliher, F.M. The response of photosynthetic model parameters to temperature and nitrogen concentration in Pinus radiata d. don. Plant Cell Environ. 1997, 20, 1338–1348. [Google Scholar] [CrossRef]
- Centritto, M.; Jarvis, P.G. Long-term effects of elevated carbon dioxide concentration and provenance on four clones of Sitka spruce (Picea sitchensis). II. Photosynthetic capacity and nitrogen use efficiency. Tree Physiol. 1999, 19, 807–814. [Google Scholar] [CrossRef]
- Zheng, Y.; Li, F.; Hao, L.; Yu, J.; Guo, L.; Zhou, H.; Ma, C.; Zhang, X.; Xu, M. Elevated CO2 concentration induces photosynthetic down-regulation with changes in leaf structure, non-structural carbohydrates and nitrogen content of soybean. BMC Plant Biol. 2019, 19, 255. [Google Scholar] [CrossRef]
- Hibbs, D.E.; Chan, S.S.; Castellano, M.; Niu, C. Response of red alder seedlings to co enrichment and water stress. New Phytol. 1995, 129, 569–577. [Google Scholar] [CrossRef]
- Bruck, H.; Jureit, C.; Hermann, C.; Schulz, A.; Sattelmacher, B. Effects of Water and Nitrogen Supply on Water Use Efficiency and Carbon Isotope Discrimination in Edible Canna (Canna edulis Ker-Gawler). Plant Biol. 2001, 3, 326–334. [Google Scholar] [CrossRef]
- Greenep, H.; Turnbull, M.H.; Whitehead, D. Response of photosynthesis in second-generation Pinus radiata trees to long-term exposure to elevated carbon dioxide partial pressure. Tree Physiol. 2003, 23, 569–576. [Google Scholar] [CrossRef] [PubMed]
- Streit, K.; Siegwolf, R.; Hagedorn, F.; Schaub, M.; Buchmann, N. Lack of photosynthetic or stomatal regulation after 9 years of elevated [CO₂] and 4 years of soil warming in two conifer species at the alpine treeline. Plant Cell Environ. 2014, 37, 315–326. [Google Scholar] [CrossRef]
- Creydt, M.; Vuralhan-Eckert, J.; Fromm, J.; Fischer, M. Effects of elevated CO2 concentration on leaves and berries of black elder (Sambucus nigra) using uhplc-esi-qtof-ms/ms and gas exchange measurements. J. Plant Physiol. 2019, 234–235, 71–79. [Google Scholar] [CrossRef]
- Major, J.E.; Mosseler, A. Chlorophyll pigment and needle macronutrient responses and interactions to soil moisture and atmospheric CO2 treatments of eight pine and spruce species. Trees 2021, 35, 2069–2085. [Google Scholar] [CrossRef]
- Gardner, A.; Ellsworth, D.S.; Pritchard, J.; MacKenzie, A.R. Are chlorophyll concentrations and nitrogen across the vertical canopy profile affected by elevated CO2 in mature quercus trees? Trees Struct. Funct. 2022, 36, 1797–1809. [Google Scholar] [CrossRef]
- Brisebois, A.; Major, J.E. Morphological and allometric variation of four coppiced early-successional species, used in land restoration, under CO2 and soil moisture treatments. Natural Resources Canada, Canadian Forest Service–Atlantic Forestry Centre, Fredericton, New Brunswick. Forests, 2024; to be submitted. [Google Scholar]
- Galea, D.; Major, J.E. Ecological restoration in Eastern Canada using four early-successional species on severely degraded sites using a factorial of three site preparation treatments: Growth and biomass over two years. Natural Resources Canada, Canadian Forest Service–Atlantic Forestry Centre, Fredericton, New Brunswick. Forests, 2024; provisionally accepted with revisions. [Google Scholar]
Disclaimer/Publisher’s Note: The statements, opinions and data contained in all publications are solely those of the individual author(s) and contributor(s) and not of MDPI and/or the editor(s). MDPI and/or the editor(s) disclaim responsibility for any injury to people or property resulting from any ideas, methods, instructions or products referred to in the content. |
© 2024 by the authors. Licensee MDPI, Basel, Switzerland. This article is an open access article distributed under the terms and conditions of the Creative Commons Attribution (CC BY) license (https://creativecommons.org/licenses/by/4.0/).