Article

The Effects of Shading on the Photosynthetic Performance of Endangered Plant Horsfieldia hainanensis Seedlings

1
Guangxi Forestry Research Institute, Nanning 530002, China
2
Administration of Shiwandashan National Nature Reserve of Fangchenggang City, Fangchenggang 538000, China
3
Guangxi Fangcheng Golden Camellias National Nature Reserve, Fangchenggang 538000, China
*
Authors to whom correspondence should be addressed.
These authors contributed equally to this work.
Forests 2024, 15(1), 3; https://doi.org/10.3390/f15010003
Submission received: 31 October 2023 / Revised: 12 December 2023 / Accepted: 13 December 2023 / Published: 19 December 2023
(This article belongs to the Special Issue Influence of Environmental Changes on Forest Soil Quality and Health)

Abstract

:
Shading is one of the management practices for preventing the damage or injury of plant seedlings during extreme weather and climate events, such as very high temperatures and heat stress. In this study, we investigated the effects of different shading conditions on the photosynthetic characteristics of the endangered plant Horsfieldia hainanensis in Guangxi, China. The H. hainanensis seedlings in this study underwent five shading treatments, including 20% (L1), 40% (L2), 60% (L3), 80% (L4), and 100% (control) of full sunlight. The net growth of their diameter and height, and photosynthetic gas exchange parameters including their photosynthesis rate (Pn), transpiration rate (Tr), intercellular CO2 concentration (Ci), and water use efficiency (WUE) were measured for the examined seedlings. The OJIP curve and 820 nm light absorption curve, and the osmotic substances and products of membrane lipid peroxidation were employed to assess photosynthetic capacity, identify the factors constraining photosynthetic carbon assimilation, and investigate the mechanisms influencing photosystem II (PSII) and photosystem I (PSI) in the seedlings under shade stress. The results showed that the seedlings in the L2 treatments had the highest net growth and Pn, the best photosynthetic performance, and the best coordination between PSII and PSI. The net photosynthesis (Pn) levels exhibited a declining trend in the following order: L2 > L3 > L4 > L1. In the L1 treatment, non-stomatal factors emerged as the primary determinant affecting the Pn of the seedlings. The performance index (potential) of PSII, representing the conservation of absorbed photon energy to intersystem electron acceptor reduction (PIABS and ΔI/I0) of the seedlings, decreased in the order of L2 > L3 > L4 > L1. The photosystem performance and the coordination between PSII and PSI (Φ(PSI/PSII)) of the seedlings decreased in the order of L2 > L1 > L3 > L4. Under the low and moderate shading stresses (L1–L3), more serious damages occurred in PSII than in PSI, including on the donor side of PSII and in the electron transfer from QB to the acceptor side of PSI. In contrast, more considerable injury occurred in PSI than in PSII under the stress of the heavy shading treatment (L4). Considering the alterations in their leaf osmotic regulatory substances and membrane lipid peroxidation products, our findings indicate that the L2 treatment was the most conducive to the growth of the H. hainanensis seedlings. In contrast, the L1 treatment subjected H. hainanensis seedlings to the most significant stress, resulting in substantial damage to their growth and photosynthetic mechanisms. Our research provides a scientific insight into and a practical guide for the selection of an appropriate light intensity for the conservation and cultivation of endangered plant species, such as H. hainanensis.

1. Introduction

Light is one of the most important environmental factors affecting plant growth and development, regulating plant morphology, and controlling plant physiological and biochemical reactions [1,2,3]. Light intensity can regulate the interactions of the chlorophyll–protein complexes in photosynthesis, and therefore affect the electron transfer between photosystems [4]. However, excessive light energy may damage plant photosystems in plants, leading to reductions in carbon assimilation, and even plant death [4,5]. Thus, the adaptability and sensitivity of plants to different light environments have been a long-term research topic in agriculture and forestry [6,7,8].
Plants can be classified as either shade-tolerant or light-requiring, depending on the physiological traits that determine how much light they need [9,10]. Shade-tolerant species can thrive in the presence of natural competition from other plants. Shade-intolerant species require full sunlight and little or no competition. Intermediate shade-tolerant trees fall somewhere in between these two categories [11,12]. H. hainanensis is a fast-growing evergreen timber tree species and has been widely distributed in southwestern China [13]. The factors contributing to the endangerment of H. hainanensis are complex. This species is primarily restricted by internal factors, such as its own reproductive strategy, and external environmental factors, including light availability. These factors result in a limited number of seedlings and challenges in their development into saplings. Consequently, the natural regeneration of the H. hainanensis population becomes difficult, serving as a crucial factor in its endangerment [14]. Because of serious damage to and disturbance of their habitats, the populations of H. hainanensis have been reduced sharply and this species has been listed as the second-grade endangered plant species in the nation [15]. Several studies have found that the seedling stage is the most vulnerable period for the survival, growth, and development of endangered plants [16,17]. As the main organ of photosynthesis and transpiration, the leaves of endangered plants are extremely sensitive to habitat changes [18]. Although a number of studies have examined changes in the species composition, stand structure and geographical distribution, phenotypic diversity, and chemical composition of H. hainanensis communities under different habitats [16,17], few studies have been conducted to reveal the physiological responses of H. hainanensis to different light intensity environments.
In the present study, H. hainanensis seedlings were exposed to different light–shade environments. The purpose of this study was to investigate the influence of shading on the photosynthetic process of H. hainanensis seedlings. We hypothesized that: (1) the photosynthetic ability of H. hainanensis seedlings could reach its peak only under the optimum shade conditions, (2) excessive light intensity would damage photosynthetic organs, inhibit photosynthetic electron transfer, and cause the carbon assimilation process of plants to decline, and (3) inappropriate light intensity, whether too strong or too weak, can have varying effects on seedling photosystems. To evaluate the above hypotheses, we addressed the following questions: (1) What is the optimum shading intensity for the highest photosynthetic capacity of H. hainanensis seedlings? (2) How do the different shading intensities damage the photosynthetic apparatus of H. hainanensis seedlings? (3) Do the damaged sites in the plant photosystems remain the same under different shading intensities?

2. Materials and Methods

2.1. Study Site

This study was carried out in the Germplasm Conservation Nursery of the Academy of Forestry Sciences of Guangxi, Nanning City, Guangxi Zhuang Autonomous Region, China (N 22°56′, E 108°21′). The annual average temperature was 21.6 °C, with the highest monthly temperature of 39.4 °C in July and the lowest, −1.5 °C, in January. The annual mean rainfall was 1386 mm, with an average relative humidity of 79%. The annual average sunshine duration was 1827 h.

2.2. Plant Materials

The seeds of H. hainanensis were collected from a local seed garden in early May 2020, germinated, and then promptly planted. In June, the H. hainanensis seedlings were transplanted into non-woven seedling containers measuring 20 cm in diameter and 20 cm in height. These containers were filled with rocky mountain soil from the original habitat. Prior to filling, the soil underwent sterilization and air-drying, followed by grinding through a 50-mesh sieve. After transplantation, each seedling was randomly placed in the shaded seedbed, where they received regular daily watering to maintain substrate moisture. Weed removal was performed regularly. The annual seedlings with similar growth potentials were selected for the shading experiments in July 2021.

2.3. Experiment Design

A completely randomized design (CRD) with five shading treatments, which included 0% (as the control), 20% (L1), 40% (L2), 60% (L3), and 80% (L4) of sunlight, was employed in the present study. Each treatment had five replications. Four seedlings were placed in each pot, resulting in a total of 20 seedlings for each treatment level (5 pots × 4 seedlings in each pot). The seedling matrix had a pH of 6.4, organic carbon content of 5.6 g·kg−1, alkali-hydrolyzed nitrogen content of 30.42 mg·kg−1, available phosphorus content of 1.45 mg·kg−1, and available potassium content of 53.85 mg·kg−1. Thus, there were a total of 80 seedlings in the current shading experiment. The shading shed measures 1.5 m in height and 2.0 m in width, with an opening in the east–west direction for ventilation. The 20 seedings in each treatment level were divided into 3 measurement groups. Black shading nets with various light transmittances were used in the shading experiment. Shading was adjusted by adding more layers of the shading nets, and the maximum natural light intensity during the test period was 2000 ± 100.0 μmol·m−2·s−1 when measured with an illuminance meter under full sunlight. All sample seedlings were consistently cared for with timely watering and regular weed removal throughout the entire experiment. Due to the loss of all H. hainanensis seedlings two days after transplantation in the control group, only data from the L1–L4 treatments are presented in the research results. On 1 September 2021, the heights (H) and base diameters (D) of all seedlings were measured after two months of exposure to the different shading treatments. Subsequently, five seedlings were chosen from each treatment based on their average D and H values. In these selected seedlings, three functional leaves from the middle of the shoot were marked and used for the determination of photosynthetic gas exchange parameters, the OJIP curve, and the 820 nm light absorption curve in the H. hainanensis seedlings.

2.4. Measurements

2.4.1. Photosynthetic Gas Exchange Parameters

The measurements were conducted on sunny days between 8:00 and 11:00 am using the Li-6400 portable photosynthetic measurement system (Li-Cor Inc., Lincoln, NE, USA). During the measurements, the light intensity of the Li-Cor 6400 instrument was set to 1000 μmol·m−2·s−1, the CO2 concentration was at 400 μmol·mol−1, and the air temperature and humidity within the leaf chamber were controlled at 25 °C and 45%–65%, respectively. Fully expanded mature leaves from the selected H. hainanensis seedlings were used to measure the net photosynthetic rate (Pn), transpiration intensity (Tr), and intercellular CO2 concentration (Ci). The stomatal conductance (Ls) was calculated using the formula (Ls) = 1 − Ci/Ca, where Ca refers to the atmospheric CO2 concentration. Water use efficiency (WUE) was calculated using the formula (WUE) = Pn/Tr.

2.4.2. Determination of OJIP Curve and 820 nm Light Absorption Curve

The chlorophyll fluorescence induction kinetic curve (OJIP curve) and 820 nm light absorption curve were measured using a continuous excitation fluorescence instrument M-PEA (Hansatech, King’s Lynn, UK). The measurements were carried out on a sunny day between 8:00 and 11:00 a.m. The leaves were initially dark-adapted for 60 min before the measurements. The induction was performed using 5000 μmol·m−2·s−1 red light with a wavelength of 625 nm, and the OJIP curve and the light absorption curve at 820 nm were recorded simultaneously. The fluorescence signal recording started from 10 μs and continued to 2 s, with a total of 128 data points recorded. The relevant parameters were calculated using similar methods [19,20]. The physiological parameters obtained from the recorded fluorescence transient OJIP and the light absorbance at 820 nm are presented in Table 1.

2.4.3. Measurements of Net Seedling Growth

At the start of the experiment on 1 July 2021, and at the end of the experiment on 1 September 2021, vernier calipers and tape measures were used to measure the base diameter and seedling height of the participating seedlings in all treatments [21]. We calculated the net growth of each seedling’s base diameter and height based on the differences between the two measurements taken for each seedling.

2.4.4. Determination of Physiological and Biochemical Indicators Such as Soluble Sugar, Soluble Protein, Proline, and Malondialdehyde Content

After measuring photosynthesis, three leaves were collected from the same position of each seedling. These leaves were mixed and wrapped in tin foil, placed into liquid nitrogen for short-term storage, and then transported to the laboratory for analysis of soluble sugar, soluble protein, proline, and acrylic acid of fresh leaf weight (FW). The dialdehyde content, soluble sugars, soluble proteins, and proline content, which are considered osmotic adjustment substances, were measured using the anthrone method [22], Coomassie brilliant blue method [23] and acid ninhydrin method [24], respectively. Additionally, malondialdehyde, one of the most important products of membrane lipid peroxidation, was determined using the thiobarbituric acid method [25].

2.5. Data Analysis

The experimental data were analyzed using Microsoft Excel 2003 software. Analysis of variance (ANOVA) was employed to statistically assess the overall impact of shading on the net growth of diameter and height, net photosynthetic rate, gas exchange parameters, OJIP curves and 820 nm light absorption curves, osmotic substances, and products of membrane lipid peroxidation. The original data were log-transformed to satisfy the normality and homoscedasticity assumptions of ANOVA. The means of the net growth of diameter and height, net photosynthetic rate, gas exchange parameters, OJIP curves, 820 nm light absorption curves, osmotic substances, and products of membrane lipid peroxidation were compared via Duncan’s new multiple range method. All statistical analyses were conducted using SPSS 20.0.

3. Results

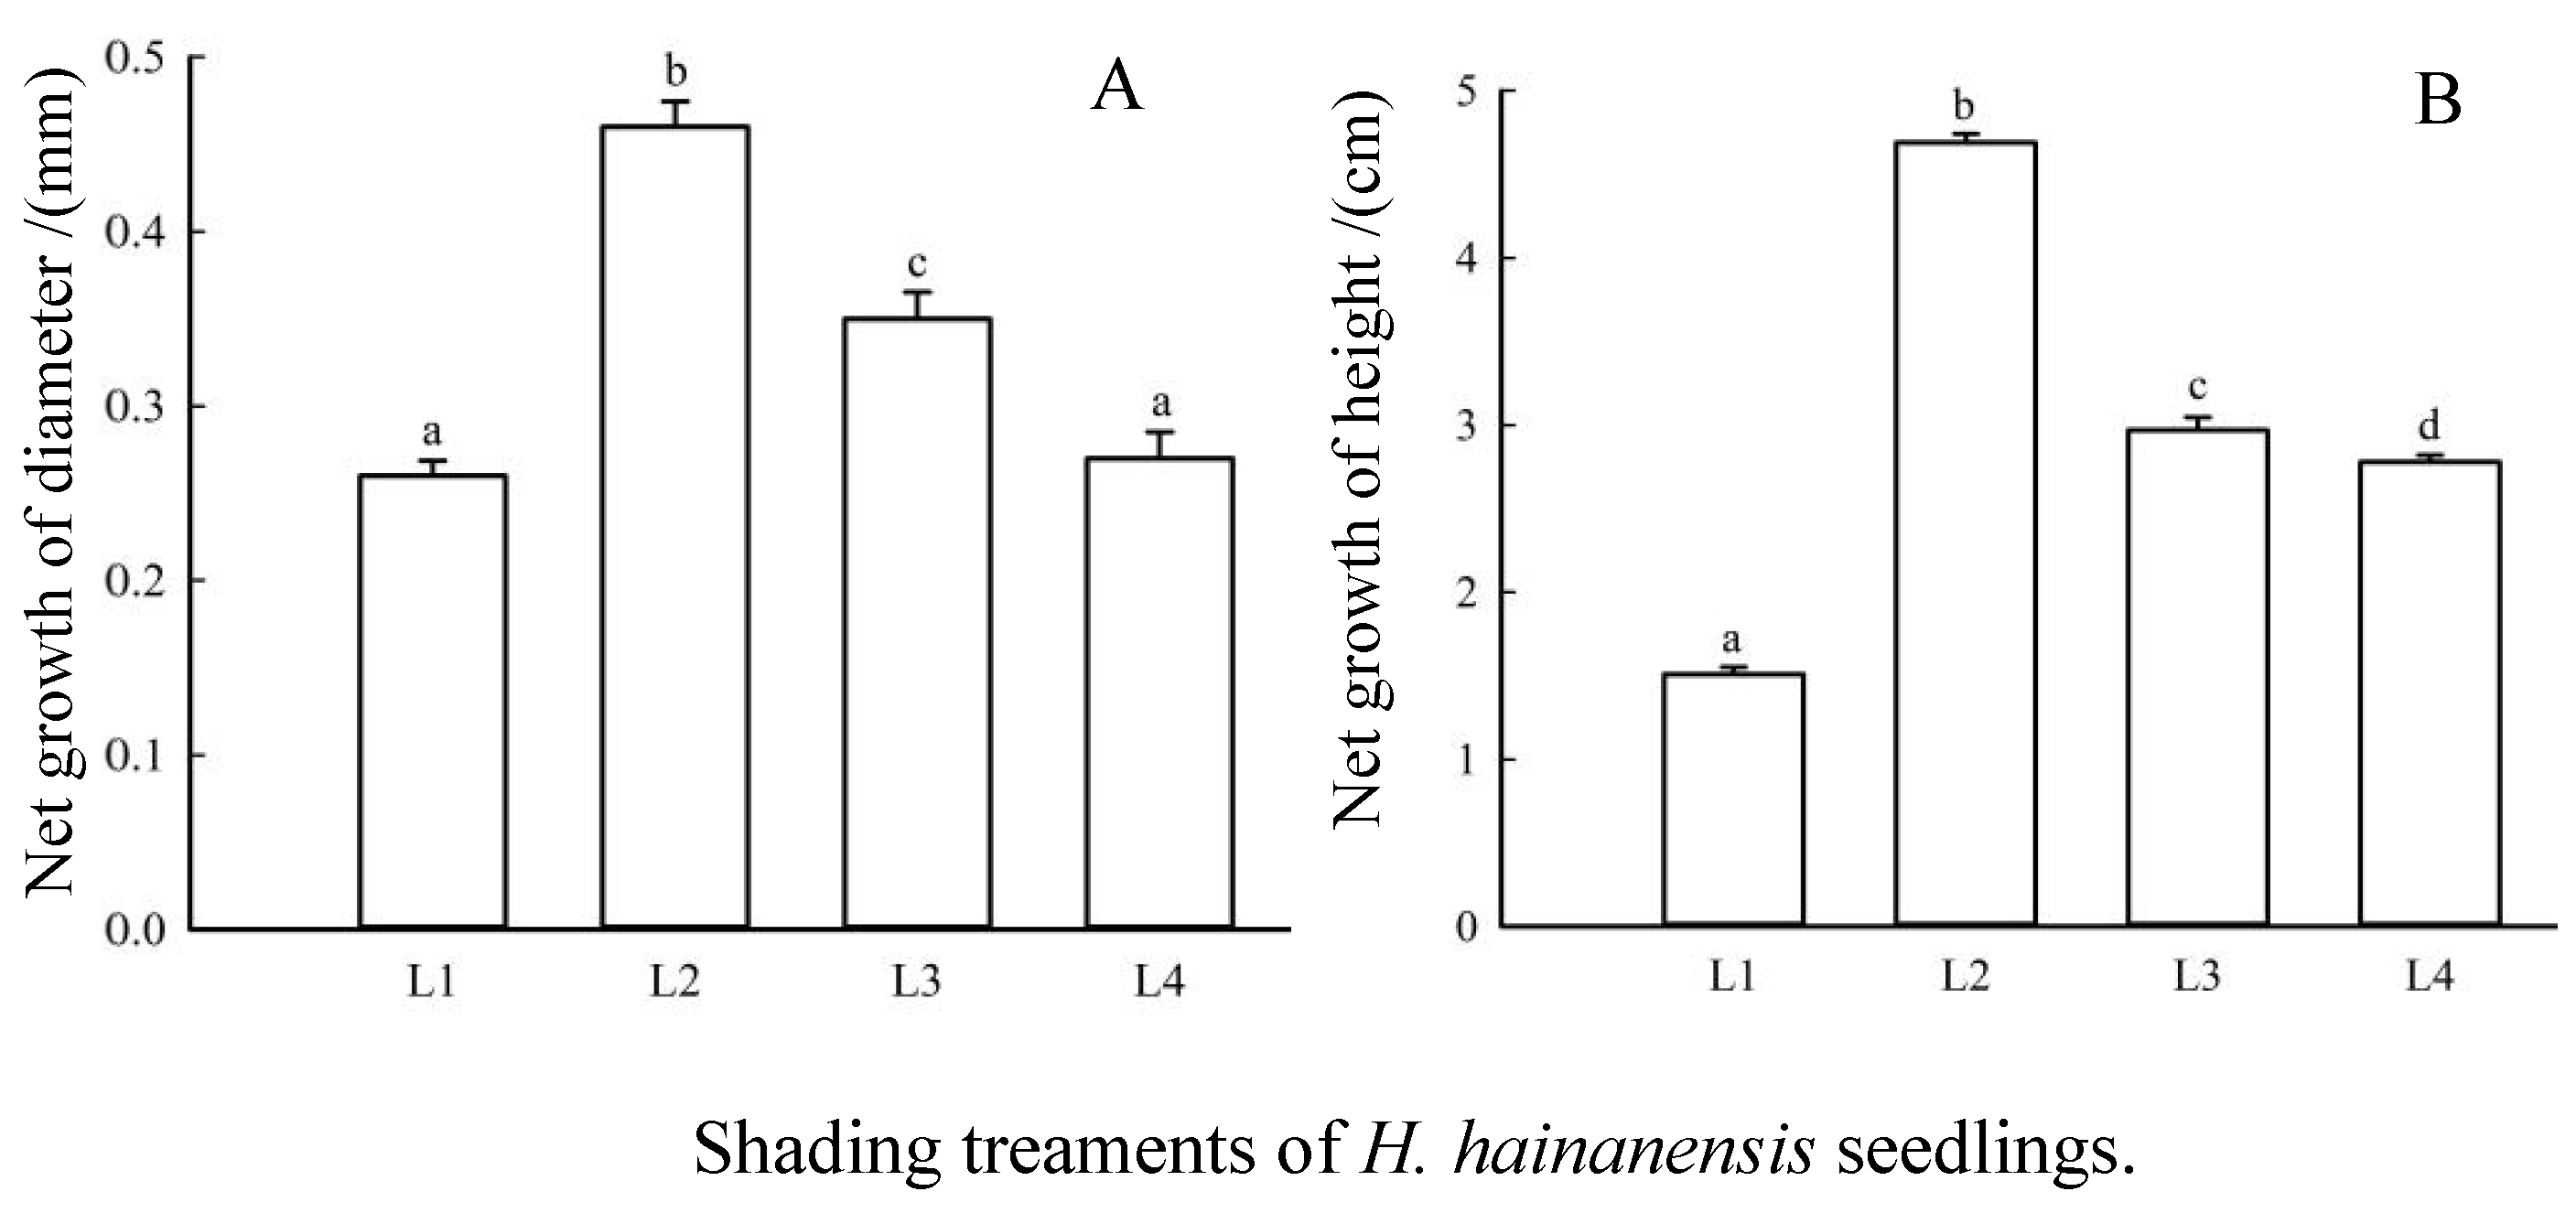
3.1. Effects of Shading on Net Growth of H. hainanensis

With increasing shading intensity, the net increase in the base diameters and tree heights of the H. hainanensis seedlings exhibited a pattern of an initial increase followed by a decrease, ranking as follows: L2 > L3 > L4 > L1. There was no significant difference in the net growth of the seedling ground diameters between the L4 and L1 shading treatments (p > 0.05), but there were significant differences among the other gradients (p < 0.05) (Figure 1A). Furthermore, there were significant differences in the net growth of seedling tree height among the different shading treatments (p < 0.05). Specifically, under the 40% shading treatment (L2), H. hainanensis seedlings displayed the highest net growth in ground diameter and tree height, measuring 0.48 mm and 4.71 cm, respectively (Figure 1B).

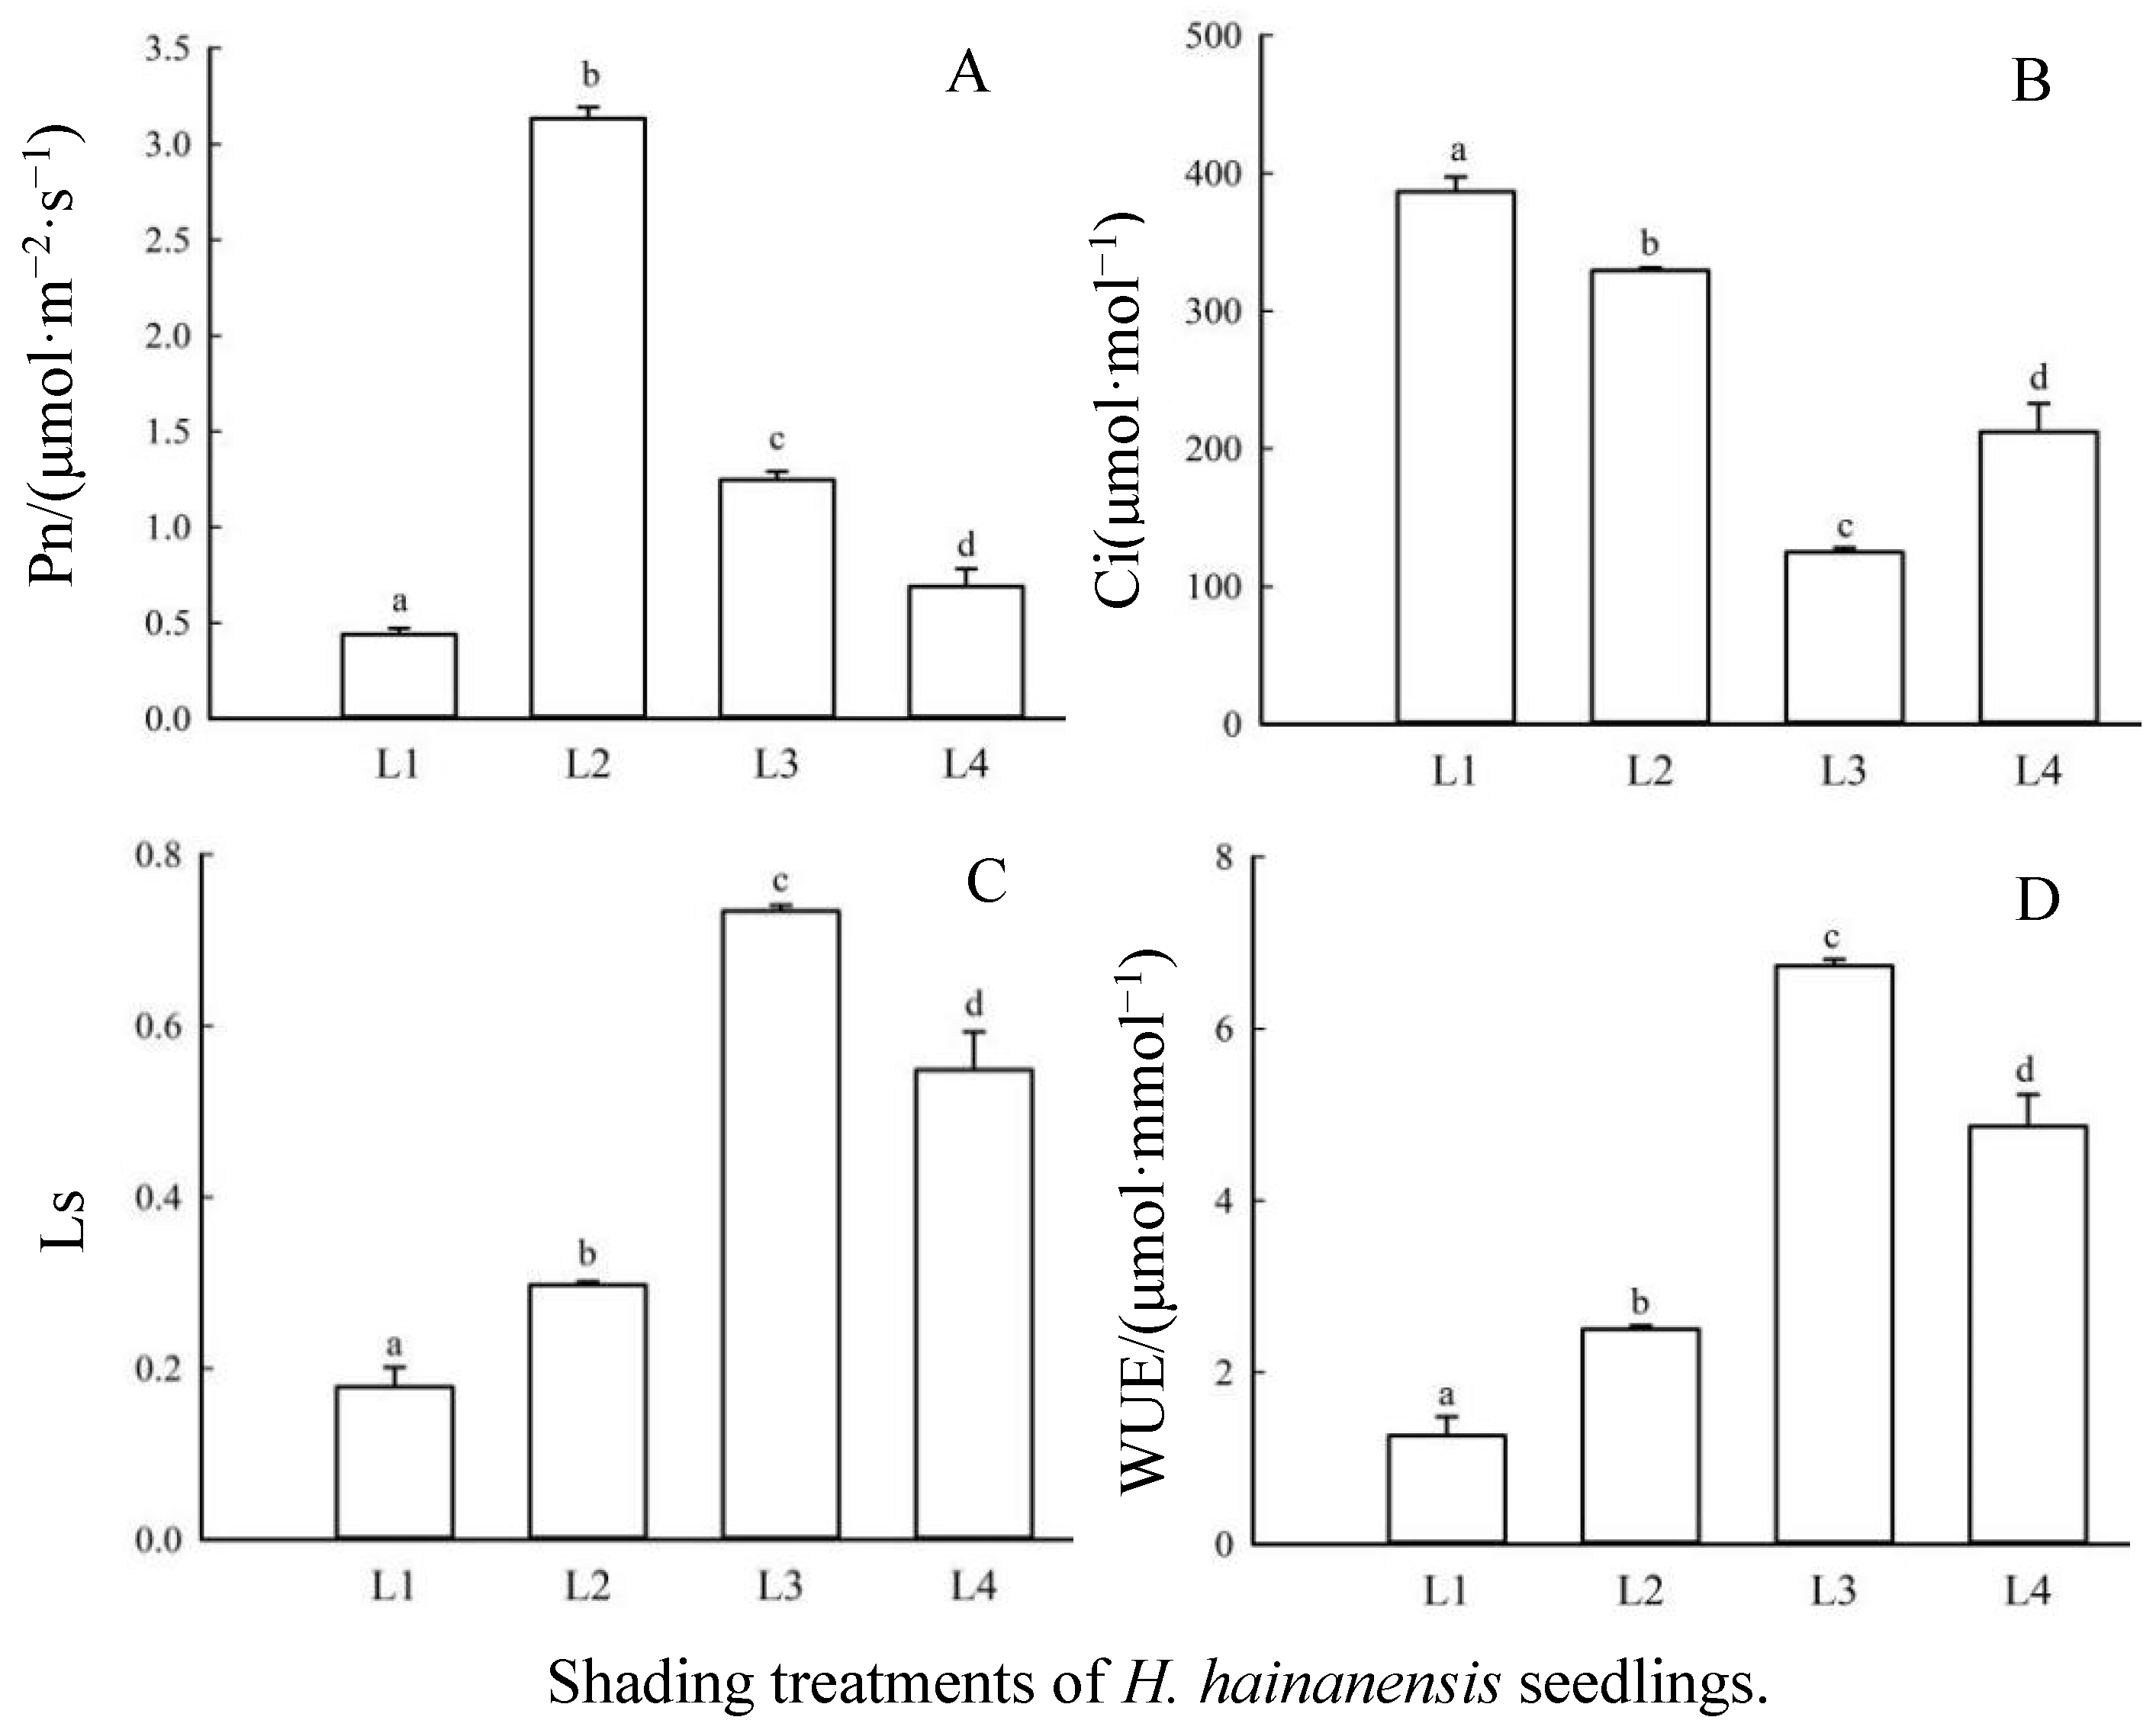
3.2. The Effects of Shading on Photosynthetic Gas Exchange Parameters in Leaves

Significant differences in Pn, Ci, Ls, and WUE were observed in the H. hainanensis seedlings among different shading treatments (p < 0.05, Figure 2A–D). The Pn rate significantly decreased in the following order: L2 > L3 > L4 > L1 (Figure 2A). The highest Pn rate occurred in the L2 treatment (3.13 μmol·m−2·s−1). The Ci of the seedlings varied significantly across the shading treatments, exhibiting a decreasing pattern in an L1 > L2 > L4 > L3 order (Figure 2B). Both Ls and WUE significantly increased with the increase in shading levels. The pattern observed for both Ls and WUE was consistent, with the treatments ranked as L3 > L4 > L2 > L1 (as shown in Figure 2C,D).

3.3. The Effects of Shading Treatments on Leaf Quantum Yield and Energy Distribution Ratio

The changes in the maximum photochemical efficiency (φPo) in the dark-adapted leaves of H. hainanensis seedlings followed the order of L2 = L3 > L4 > L1. The effect of shading on φPo was statistically significant among the various shading treatments (p < 0.05, Table 2). Among the excitons captured by the photosystem II (PSII) reaction center, the ratio of excitons used to promote electron transfer to QA downstream acceptors (Ψo), the light energy captured by the PSII reaction center and used to transfer electrons to QA downstream acceptors (φEo), and the electron transfer efficiency from the secondary quinone acceptor (QB) to the PS I acceptor side (δ(Ro)) exhibited the pattern L2 = L3 > L4 > L1 in the treatments. Significant differences were observed between the L1 and L4 treatments for these three indexes (Ψo, φEo, δ(Ro)) (p < 0.05, Table 2). The changes in φDo decreased in the following order: L1 > L4 > L2 = L3, and significant differences were observed between the L1 and L2 treatments as well as between the L1 and L3 treatments (p < 0.05, Table 2).

3.4. The Effects of Shading on Leaf PSII Donor Side/Acceptor Side

The variable fluorescence (Fk) at the K-step, relative to the amplitude FO–FJ (WK), in the various shading treatments are presented in Table 3. These values followed a pattern of L1 > L4 > L2 > L3, with significantly larger values observed in the L1 treatment compared to the others (p < 0.05). The ratio of the variable fluorescence (FJ) to the amplitude FO–FP (VJ) at the J-step and the maximum rate of QA reduction (Mo) in the leaves of H. hainanensis seedlings under different shading treatments exhibited a decrease in the order of L1 > L3 > L2 > L4. A significant difference was observed between the L1 and L4 treatments (p < 0.05 Table 3). In addition, the size (SM) of the plastoquinone (PQ) pool on the PSII acceptor side showed a decrease in the order of L4 > L2 > L3 > L1. A significantly smaller SM was observed in the L1 treatment compared to the other shading treatments (p < 0.05, as shown in Table 3).

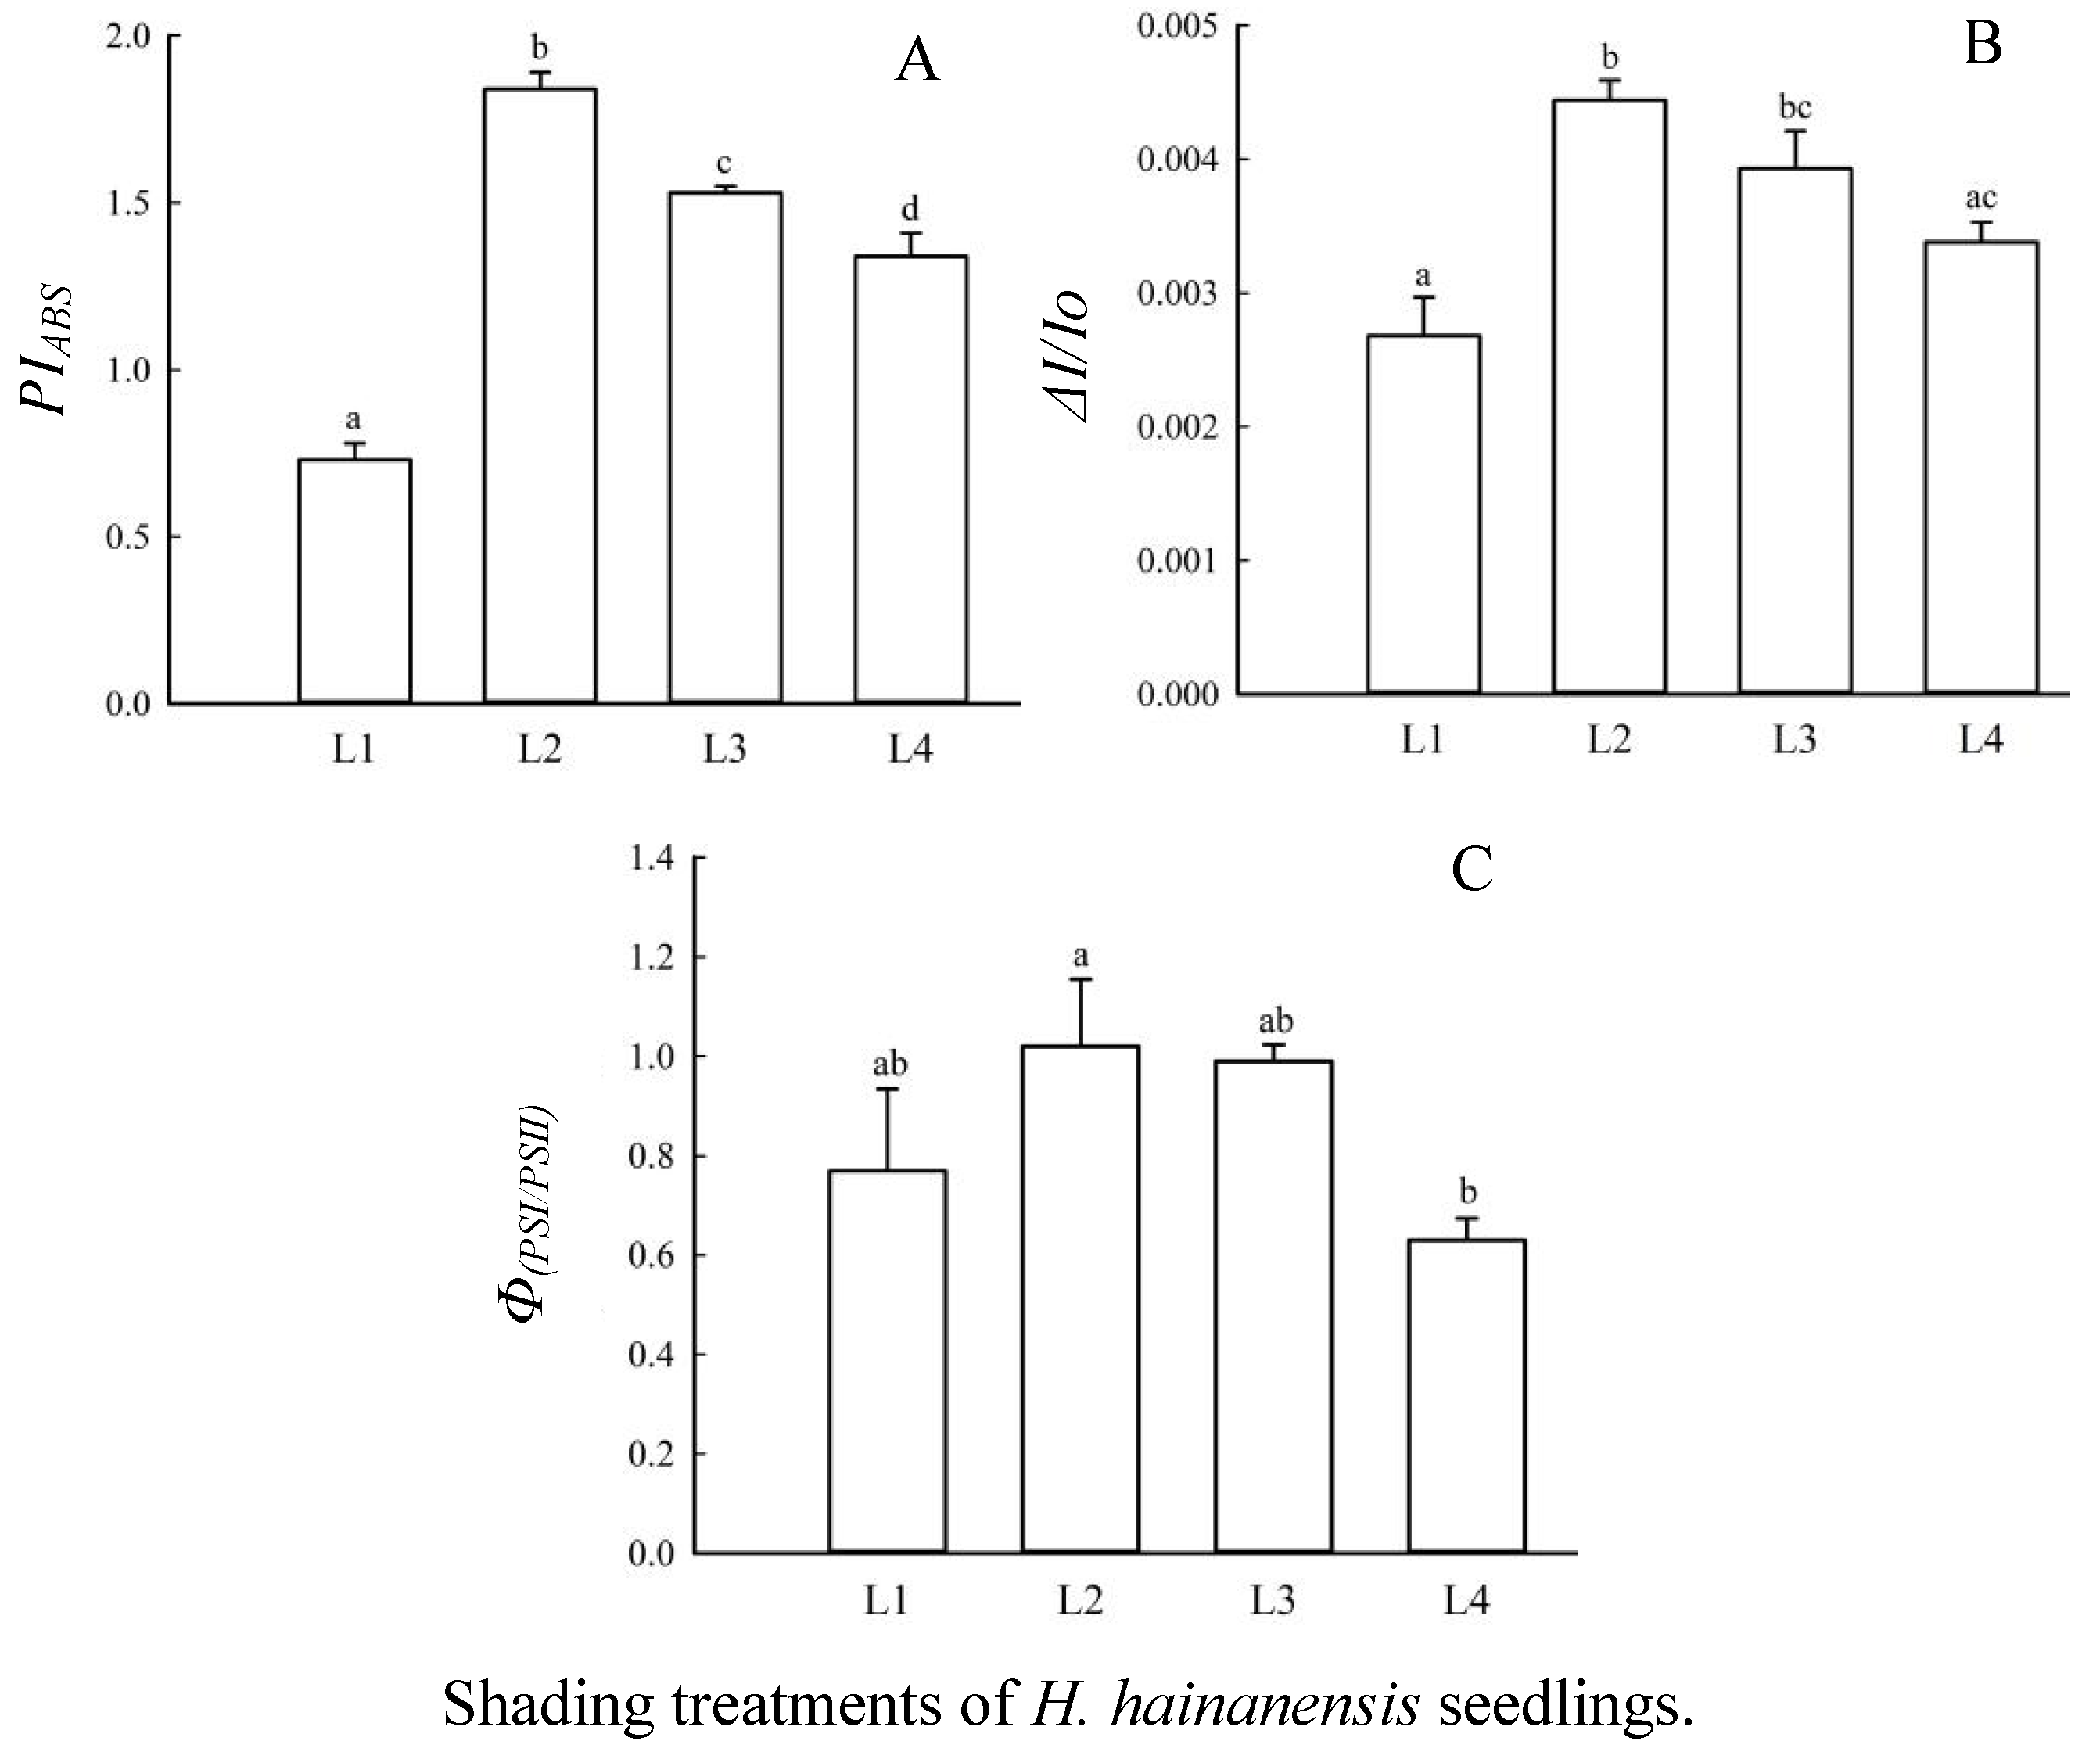
3.5. Effects of Shading on the Overall Performance and Coordination of Leaf PSII/PSI

There were significant differences among the treatments in the performance index (PIABS) based on the light energy absorption of the H. hainanensis seedling leaves (p < 0.05); in this regard, the treatments were ranked L2 > L3 > L4 > L1 (Figure 3A). The relative amplitude (ΔI/Io) of 820 nm light absorption in the leaves of the H. hainanensis seedlings decreased as L2 > L3 > L4 > L1, and the most significant difference in ΔI/Io was found between the L1 and L2 treatments (p < 0.05, Figure 3B). The coordination between the two photosystems (Φ(PSI/PSII)) increased with the degree of shading, exhibiting a trend of initially increasing and then decreasing. The value of Φ(PSI/PSII) decreased as L2 > L3 > L1 > L4, and a significant difference in Φ(PSI/PSII) was found in the L1 and L3 treatments (p < 0.05, Figure 3C).

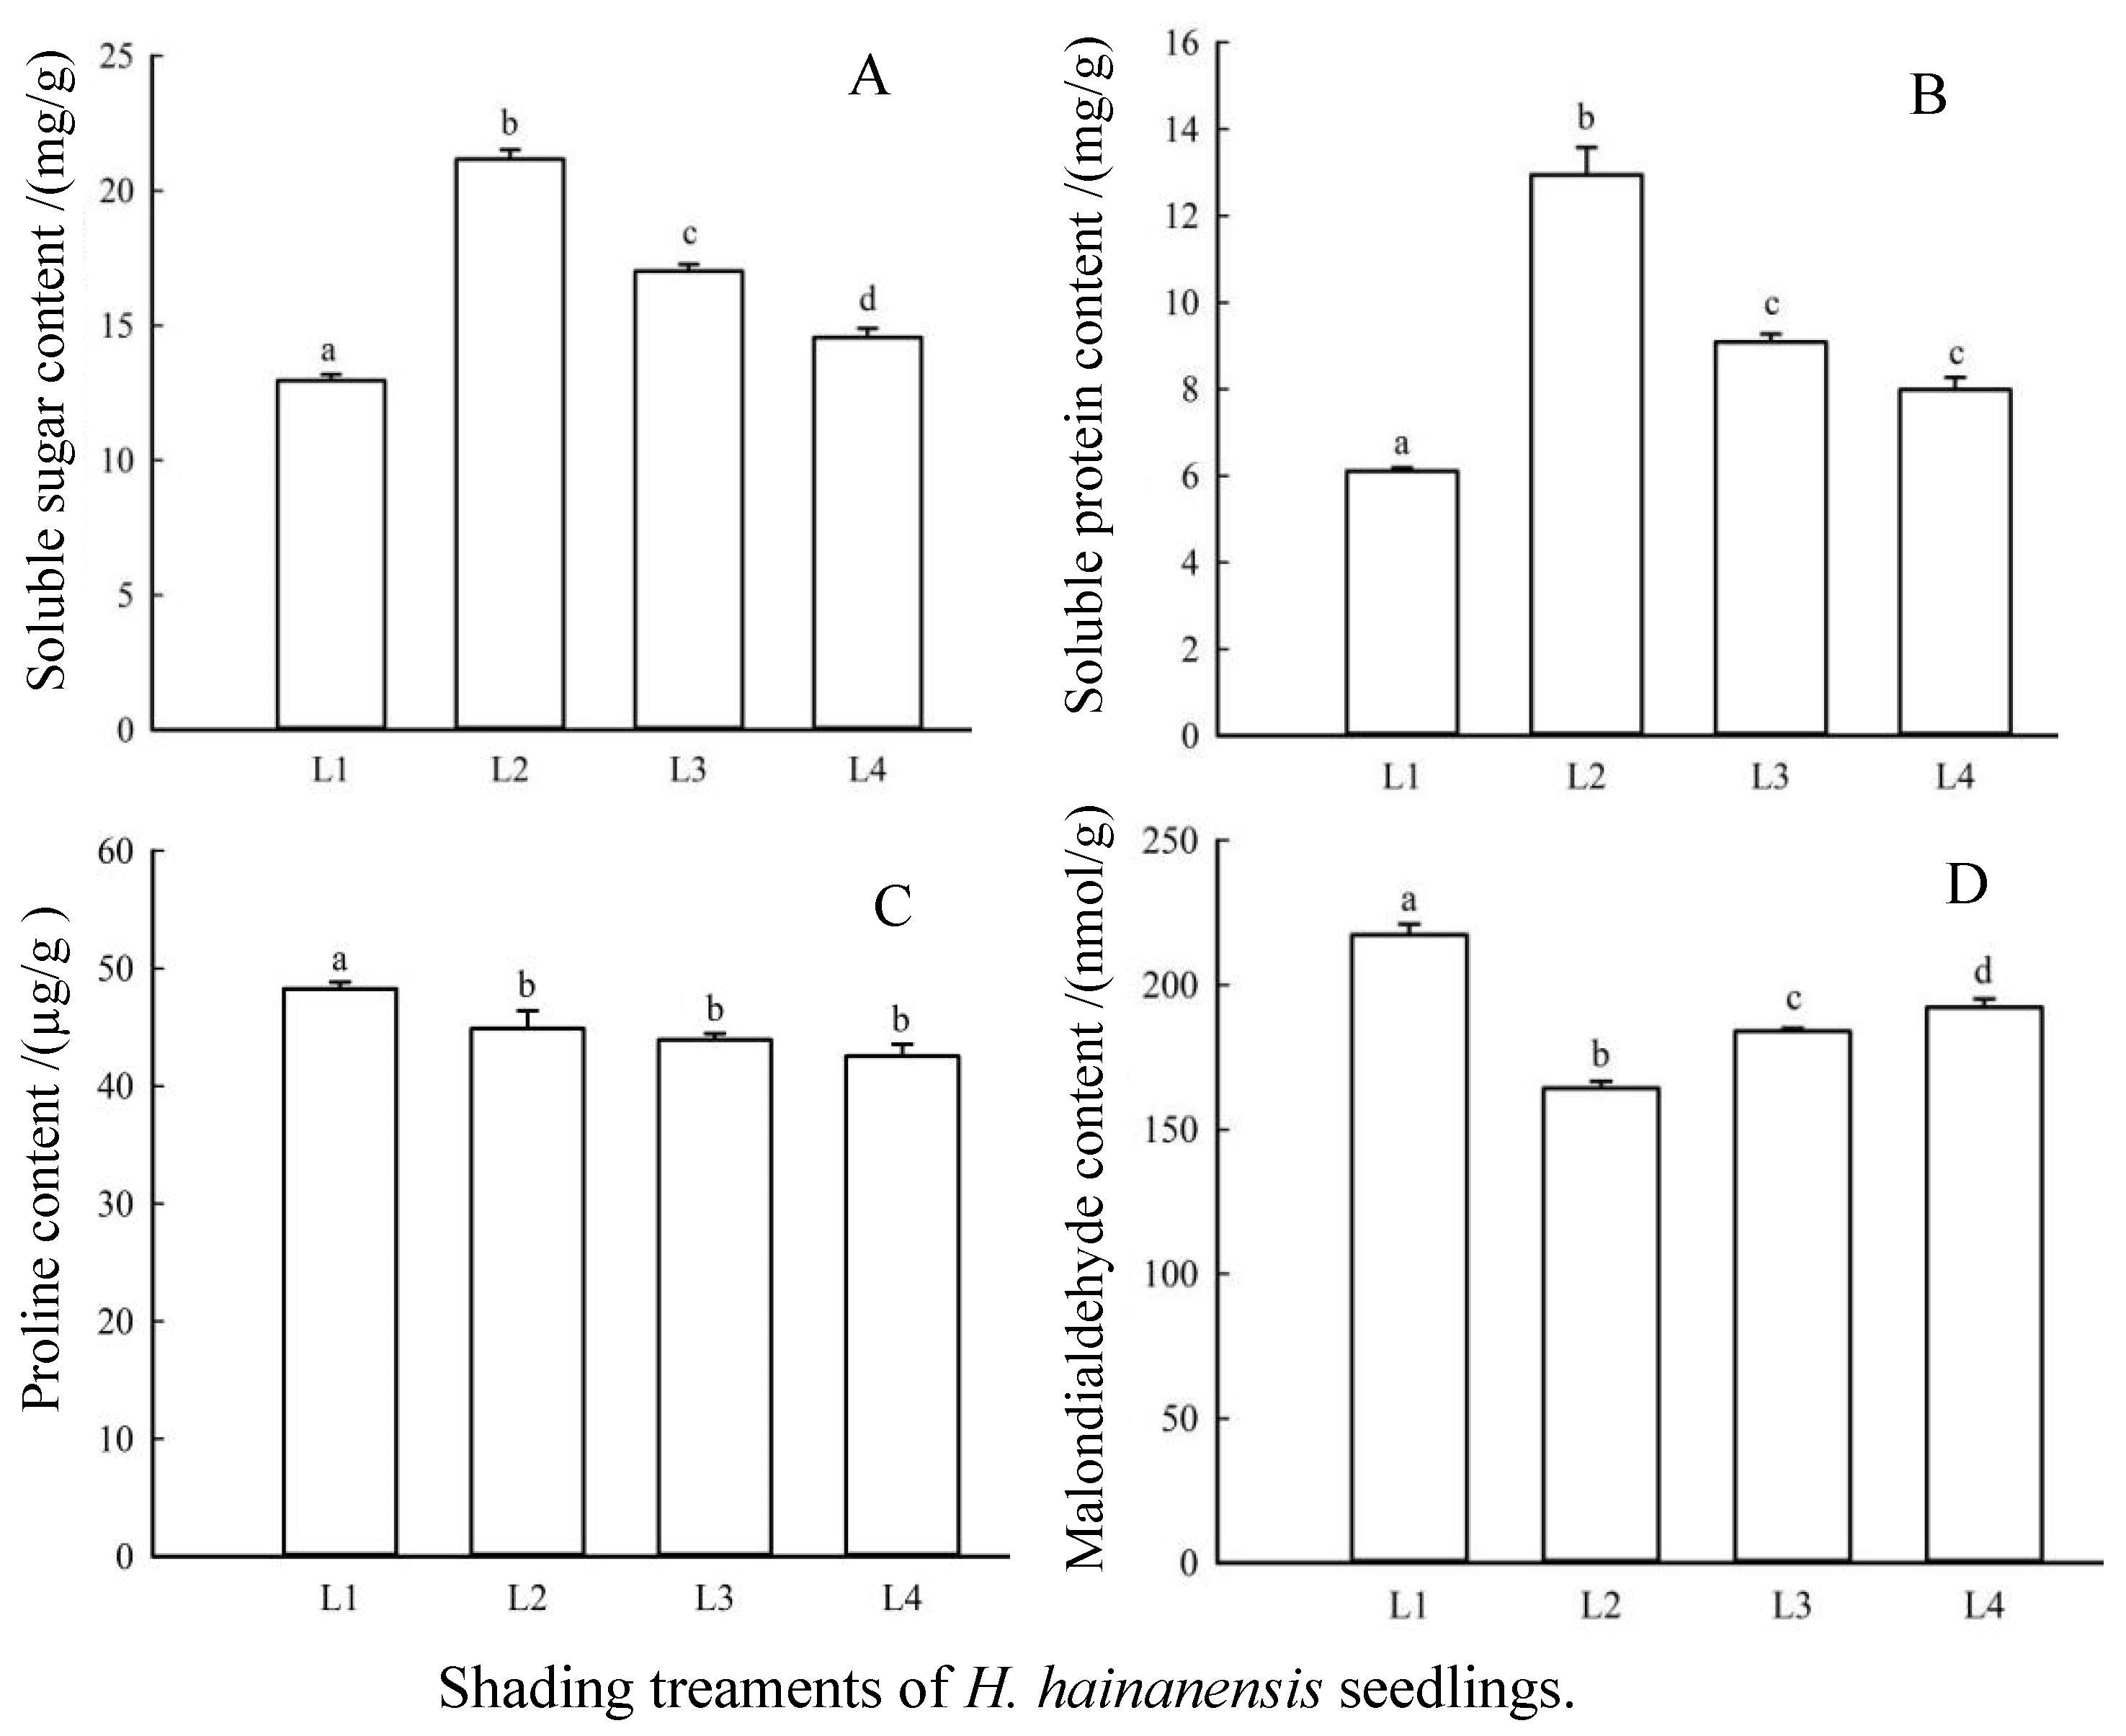
3.6. Effects of Shading on Osmotic Regulatory Substances and Membrane Lipid Peroxidation Products in Leaves of H. hainanensis Seedlings

With increasing shading intensity, the soluble sugar content in H. hainanensis seedling leaves exhibited a trend of initially increasing and then decreasing. Specifically, the trend followed this pattern: L2 > L3 > L4 > L1 (as illustrated in Figure 4A). There were significant differences in the soluble sugar content in the seedling leaves among the various shading treatments (p < 0.05). The soluble protein content followed a similar pattern, increasing initially and then decreasing, with the order being L2 > L3 > L4 > L1. Notably, there was no significant difference between the L3 and L4 treatments (p > 0.05), but significant differences existed between the other treatments (p < 0.05), as shown in Figure 4B. In contrast, the proline content steadily decreased, specifically in the sequence L1 > L2 > L3 > L4, with only the L1 treatment being significantly different from the other three treatments (p < 0.05) (Figure 4C). Finally, the malondialdehyde content initially decreased and then increased, with the pattern being L1 > L4 > L3 > L2. Significant differences were observed among the different treatments (p < 0.05), as depicted in Figure 4D.

4. Discussion

In this study, it was observed that under the 40% shading treatment (L2), the net growth of H. hainanensis seedlings was the most pronounced. This suggested that both excessive light and excessive shading had unfavorable effects on the growth of H. hainanensis seedlings. These findings are consistent with previous research conclusions regarding Baccaurea ramiflora Lour seedlings [26]. Previous studies have demonstrated that a decrease in the net photosynthetic rate (Pn) is associated with a decrease in the intercellular CO2 concentration (Ci) and an increase in the stomatal limitation value (Ls) [27]. These findings suggest that the reduction in Pn is primarily attributable to stomatal limitation. The increase in Ci (intercellular CO2 concentration) and the decrease in Ls (stomatal limitation value) indicated that the decline in Pn (net photosynthetic rate) was primarily attributed to non-stomatal restrictions [28]. The results of our study reveal that the highest Pn in the leaves of H. hainanensis seedlings was observed under the L2 shading treatment. In the present study, the net photosynthetic rate decreased (Pn), intercellular CO2 concentration (Ci) increased, and stomatal limitation value (Ls) decreased in the L1 shading treatment to the greatest extent compared to the other treatments. In contrast, under the L3 and L4 shading treatments, Pn decreased, Ci decreased, and Ls increased. The decline in photosynthetic carbon assimilation capacity under L1 treatments was likely due to non-stomatal factors, while under the L2 and L3 treatments, it was probably due to stomatal limitation. Water use efficiency (WUE) is dependent on both net photosynthesis (Pn) and transpiration (Tr). Light intensity influences the Pn and, consequently, the plant’s WUE. Studies have shown that when light intensity is below the critical value of the light saturation point, there is a positive correlation between the light intensity and WUE. However, when the level of light surpasses the light saturation point, the increase in Pn is smaller than that of Tr, resulting in a decrease in WUE [29]. In this study, WUE decreased significantly under the L1 treatment compared to the other shading treatments (Figure 1). This was due to the damage of leaf photosynthetic mechanism caused by excessive light intensity, in which the decrease in Pn occurred more rapidly than that in Tr [30]. The mechanisms explaining photosynthesis involve the absorption of light energy [31]. It is widely acknowledged that an increase in light intensity leads to a rise in the net photosynthetic rate (Pn) [32]. However, excessive light intensity can hinder the carbon assimilation process, resulting in a reduction of Pn [33]. Consequently, plants do not utilize all absorbed light for photosynthesis. When the absorbed light energy surpasses the photosynthetic capacity, plants dissipate excess energy in the form of heat. Additionally, excessive light intensity can cause damage to plants [34], manifesting in indicators such as tipburn. Furthermore, the photosynthetic capacity of plants is influenced by variety-specific characteristics, including differences in plant architecture, leaf pigment pool, and stomata traits among cultivars [35,36]. For instance, the Pn of green lettuce is typically higher than that of red lettuce [37]. Under the L2 treatment, the Pn was the highest, but the WUE was significantly lower than that in the L3 and L4 treatments, indicating that the increase in Pn was smaller than the increase in the Tr rate. In the L2 shading condition, the light intensity exceeded the light saturation point, and Pn reached its peak, suggesting this shading environment was optimal for plant growth.
Photoinhibition in plants may be associated with the distribution of absorbed light energy by photosystem II (PSII) [38,39]. When plants experience light stress, a portion of PSII reaction centers lose their activity, and heat dissipation (φD0) increases. This increase in heat dissipation serves to protect other PSII reaction centers from light-induced damage [40]. These behaviors, which include a reduction in the efficiency of light energy conversion (φPo), ultimately result in less impact on photosynthesis. However, under severe stress, photosynthetic electron transfer becomes significantly impeded, leading to a substantial reduction in the plant’s photosynthesis rate. In this study, the changes in φPo and φDo under the L1 treatment align with previous research findings. The Ψo, φEo, and δ(Ro) parameters in the electron chain indicated a decreased electron transfer efficiency. This suggests that intense light significantly impacted the photosynthesis of H. hainanensis in the study region. Under the L4 treatment, the changes in φPo and φDo were similar to those observed in the L1 treatment, but the electron transfer was not hindered. Consequently, the photosynthesis of the seedlings was less affected compared to that under the strong light treatment.
The decrease in δ(Ro) not only reflects a reduction in the electron transfer efficiency from QB and other intermediate electron mediators to PSI, but also indicates that the ability of electrons to move from QA to QB is greater than that from QB to the PSI acceptor side [41]. To reiterate, this means that the degree of electron transfer from QB and other intermediate electron mediators to the PSI acceptor side is more hindered than QA transferred to QB. In our study, a significant decrease in δ(Ro) was observed in the L1 treatment, indicating a severe hindrance of electron transfer efficiency from QB to the PSI acceptor side under low shading stress.
The rise of the K-point in the rapid chlorophyll fluorescence OJIP curve has been widely accepted as an indicator of the degree of injury to the PSII donor side (OEC), and Wk is used to reflect the change of the K-point [42,43]. An increase in Wk signifies damage to the PSII donor side. Our results indicated that the L3 treatment had the lowest Wk, suggesting the best performance on the PSII donor side. There were no significant differences in Wk between the L2 and L4 treatments. In this study, a significant increase in Wk was observed only in the L1 treatment, indicating severe injury to the PSII donor side. When comparing the L1 treatment to the L4 treatment, VJ significantly increased, suggesting that excessive shading had a lesser effect on the PSII acceptor side. However, the strong light intensity in the L1 treatment still caused damage to the PSII acceptor side. It is worth noting that studies have shown that when the QA downward electron transfer is inhibited, QA is reduced at the fastest rate, leading to an increase in Mo [44]. In this study, Mo was significantly greater in the L1 treatment compared to the other shading treatments, indicating that strong light inhibits electron transfer from QA. downward. Studies have shown that light-induced damage to leaf structures intensifies the degradation of the D1 protein, resulting in reductions in SM [45]. In the L1 treatment, there was a significant reduction in the electron transporter (SM) on the PSII acceptor side, likely due to the intensified degradation of the D1 protein caused by strong light. The reduction of QB is attributed to its detachment from the protein complex, and this phenomenon did not occur as shading intensity increased [46]. PIABS reflects the comprehensive response of both the donor and acceptor sides of PSII to environmental factors, providing a better assessment of the impact of stress on overall performance of PSII [47,48]. By observing the change in PIABS, it becomes evident that the PSII performance was notably better in the L2 treatment compared to the other shading treatments. The significant decrease in PSI activity may be attributed to severe damage on the PSII acceptor side, which hinders electron transfer to PSI, thereby affecting PSI reduction. The decline in PSI activity may also be due to PS1 damage; as evidenced by a significant decrease in ΔI/Io [49], PSI cannot efficiently facilitate electron transfer to the acceptor side, thereby inhibiting the oxidation of PSI [50]. In the L1 treatment, the hindrance of electron transfer from the PSII acceptor to PSI and the significant reduction in ΔI/Io indicated a more substantial decrease in PSII performance, consistent with the change in PIABS. The decrease in PSI activity was primarily due to strong light damage to the PSI itself. Conversely, in the L4 treatment, the electron transfer from the PSII acceptor side to PSI was not hindered, but the ΔI/Io was still significantly reduced compared to the L2 treatment. This suggests that PSII performance decreased less in the L2 shading condition, and PSI activity was higher. A decrease in photosystem coordination can lead to the accumulation of excess excitation energy or reduced substances, increasing the likelihood of the production of reactive oxygen species. This, in turn, can damage photosynthetic organs and reduce the overall photosynthetic activity [51,52,53]. In this study, photosystem coordination was restored in both L2 and L3 treatments, with better recovery in the L2 treatment. The decline in coordination was slightly more significant in the L4 treatment compared to the L1 treatment. Our results suggest that the photosystems’ coordination in electron transfer was optimal in the L2 treatment, while PSI gradually suffered damage with increasing shading stress. In the L4 treatment, characterized by the weakest light intensity, the PSI sustained the most severe damage, while the PSII performance and electron transfer were less affected by weak light, resulting in a greater decrease in coordination.
In adverse conditions, plant cells employ organic osmotic adjustment substances like soluble sugars, soluble proteins, and proline to maintain their cell water potential and uphold the stability of their cell structure and function [54]. The results of this study indicate that changes in soluble sugar content correlate with fluctuations in the net photosynthetic rate, exhibiting an initial increase followed by a decrease. The L1, L3, and L4 treatments induced varying levels of stress on the plants. Studies have suggested that under plant stress, the soluble sugar content tends to decrease due to reduced photosynthesis, which significantly impairs the leaves’ ability to synthesize carbohydrates, causing a shift in the plant’s metabolic pathway from carbon to nitrogen metabolism [55]. Moreover, relevant research has demonstrated that a plant’s soluble protein content gradually decreases as light intensity weakens [56].
This study, in contrast, discovered that the soluble protein content displayed an initial increase followed by a decrease with the increase in shading intensity, reaching its highest value under the L2 treatment. This observation might be attributed to the shade-tolerant nature of H. hainanensis during the seedling stage [57]. Under excessively intense light conditions, its photosynthesis may not be as efficient as when under appropriate shading, resulting in a lower soluble protein content compared to the L2 treatment. However, with excessive shading in the L3 and L4 treatments, the soluble protein content also progressively decreased as the light intensity weakened, which is in line with changes in the net photosynthesis. Furthermore, in this study, an increase in the shading level corresponded to a gradual reduction in proline content, with only the L1 treatment exhibiting a significantly higher proline content compared to the other three treatments. This suggests that the damage caused by excessive light in the L1 treatment was greater than in the other shading treatments. Malondialdehyde, as a product of membrane lipid peroxidation, is a crucial indicator of plant stress, with higher values indicating more severe stress for the plant [58].
In this study, the malondialdehyde content in the leaves of H. hainanensis seedlings exhibited an initial decrease followed by an increase. It reached its lowest point under the L2 treatment, signifying minimal membrane damage. Under the L3 and L4 treatments, as shading intensity continued to rise, malondialdehyde levels showed an upward trajectory. This indicates that excessive shading can also lead to an increase in membrane lipid peroxidation and, subsequently, an escalation in membrane damage. Conversely, in the L1 treatment, intense light raised the leaf temperature, disrupting the balance of active oxygen, and causing an elevation in the membrane lipid peroxidation. This, in turn, led to an increase in the plant’s malondialdehyde content. The degree of membrane damage caused by intense light was greater than that triggered by excessive shading.

5. Conclusions

In this study, it was observed that the 40% shading treatment (L2) was the most conducive to the growth of H. hainanensis seedlings in terms of base diameter and tree height. Under natural conditions, the L2 shading treatment reached the light saturation point of the Pn rate of H. hainanensis seedlings, resulting in the largest photosynthetic capacity among all shading treatments in this study. The mechanisms leading to the reduction in photosynthetic carbon assimilation ability varied under different light stresses. In the case of the low shading stress (L1 treatment), the primary reason for the decline in photosynthetic carbon assimilation ability was non-stomatal limitation. However, under the heavy shading stresses (L3–L4 treatments), the main reason for the decline in photosynthetic carbon assimilation ability was stomatal limitation. A series of photosynthetic parameters indicated that under L2 treatment, the seedlings exhibited optimal photosynthetic performance and coordination between PSII and PSI. The next best performance was observed in the L3 treatment, while the worst performance in the photosynthetic process was found in the L1 and L4 treatments. It is important to note that the seedlings showed similar results in terms of photosynthetic performance in the L1 and L4 treatments. However, the internal damage mechanisms differed between these two shading treatments. Under the L1 treatment, the damage was more severe in PSII than in PSI, specifically affecting the donor side of PSII and hindering electron transfer to PSI. Conversely, in the L4 treatment, the damage was more pronounced in PSI due to the photoprotective regulation of PSII by decreasing φPo and increasing φDo. These findings suggest that H. hainanensis species may employ distinct strategies to adapt to various shading environments. The variations in their soluble sugars, soluble proteins, proline, and other osmotic adjustment substances, as well as membrane lipid peroxidation products (malondialdehyde), align consistently with alterations in plant net photosynthesis. This alignment suggests that the L2 treatment is the most favorable for the growth of H. hainanensis seedlings. Conversely, the growth and photosynthetic mechanisms of H. hainanensis seedlings suffered the most significant damage in the L1 treatment. In this study, we screened suitable shade conditions for H. hainanensis seedling growth and explored the mechanism behind the decline in photosynthetic performance caused by the excessive shading of seedlings. This provides a theoretical basis for selecting the appropriate light intensity for the protection and cultivation of H. hainanensis.

Author Contributions

R.W. and X.L. conceived and designed the experiments; J.M., R.H. and Y.W. performed the experiments; J.Y. and H.L. analyzed the data; J.M., Y.J. and Y.L. contributed technical advice; R.W., X.L. and N.L. wrote the paper. All authors have read and agreed to the published version of the manuscript.

Funding

This work was financially supported by the National Natural Science Foundation of China (32001229).

Data Availability Statement

The data presented in this article are available on request from the corresponding authors.

Acknowledgments

We are grateful for every reviewers’ helpful comments.

Conflicts of Interest

No potential conflict of interest were reported by the authors.

References

  1. Sofo, A.; Dichio, B.; Montanaro, G.; Xiloyannis, C. Shade effect on photosynthesis and photoinhibition in olive during drought and rewatering. Agric. Water Manag. 2009, 96, 1201–1206. [Google Scholar] [CrossRef]
  2. Ren, H.; Zhang, Q.M.; Lu, H.F.; Liu, H.X.; Guo, Q.F.; Wang, J.; Jian, S.G.; Bao, H.O. Wild plant species with extremely small populations require conser-vation and reintroduction in China. Ambio 2012, 41, 913–917. [Google Scholar] [CrossRef]
  3. Li, L.J.; Gu, W.R.; Li, J.; Li, C.F.; Xie, T.L.; Qu, D.Y.; Meng, Y.; Li, C.F.; Wei, S. Exogenously applied spermidine alleviates photosynthetic inhibition under drought stress in maize (Zea mays L.) seedlings associated with changes in endogenous polyamines and phytohormones. Plant Physiol. Biochem. 2018, 129, 35–55. [Google Scholar] [CrossRef]
  4. Kim, J.H.; Glick, R.E.; Melis, A. Dynamics of photosystem stoichiometry adjustment by light quality in chloroplasts. Plant Physiol. 1993, 102, 181–190. [Google Scholar] [CrossRef]
  5. Vialet-Chabrand, S.; Matthews, J.S.; Simkin, A.J.; Raines, C.A.; Lawson, T. Importance of fluctuations in light on plant photosynthetic acclimation. Plant Physiol. 2017, 173, 2163–2179. [Google Scholar] [CrossRef]
  6. Barber, J.; Andersson, B. Too much of a good thing: Light can be bad for photosynthesis. Trends Biochem. Sci. 1992, 17, 61–66. [Google Scholar] [CrossRef]
  7. Niinemets, Ü. Photosynthesis and resource distribution through plant canopies. Plant Cell Environ. 2007, 30, 1052–1071. [Google Scholar] [CrossRef]
  8. Croce, R.; Amerongen, H. Light harvesting in oxygenic photosynthesis: Structural biology meets spectroscopy. Science 2020, 369, 2058. [Google Scholar] [CrossRef] [PubMed]
  9. He, P.; Wright, I.J.; Zhu, S.; Onoda, Y.; Liu, H.; Li, R.H.; Liu, X.R.; Hua, L.; Oyanoghafo, O.O.; Ye, Q. Leaf mechanical strength and photosynthetic capacity vary independently across 57 subtropical forest species with contrasting light requirements. New Phytol. 2019, 223, 607–618. [Google Scholar] [CrossRef] [PubMed]
  10. Poorter, H.; Niinemets, Ü.; Ntagkas, N.; Siebenkäs, A.; Mäenpää, M.; Matsubara, S.; Pons, T. A meta-analysis of plant re-sponses to light intensity for 70 traits ranging from molecules to whole plant performance. New Phytol. 2019, 223, 1073–1105. [Google Scholar] [CrossRef] [PubMed]
  11. Baltzer, J.L.; Thomas, S.C. Determinants of whole-plant light requirements in Bornean rain forest tree saplings. J. Ecol. 2007, 95, 1208–1221. [Google Scholar] [CrossRef]
  12. Portsmuth, A.; Niinemets, Ü. Structural and physiological plasticity in response to light and nutrients in five temperate decidu-ous woody species of contrasting shade tolerance. Funct. Ecol. 2007, 21, 61–77. [Google Scholar] [CrossRef]
  13. Jiang, Y.H.; Xiang, W.H.; Jiang, Y.; He, Y.H.; Lin, J.Y. Floristic composition, structure and phytogeographic characteristics of Horsfieldia hainanensis community in Guangxi. J. Beijing For. Univ. 2016, 38, 74–82. [Google Scholar] [CrossRef]
  14. Jiang, Y.H.; Liu, X.S.; Xiang, W.H.; Jiang, Y.; He, Y.H. Genetic diversity and structure analysis of the endangered plant species Horsfieldia hainanensis Merr. in China. Biotechnol. Biotechnol. Equip. 2018, 32, 95–101. [Google Scholar] [CrossRef]
  15. Guo, P.; Qi, Y.P.; Cai, Y.T.; Yang, T.Y.; Yang, L.T.; Huang, Z.R.; Chen, L.S. Aluminum effects on photosynthesis, reactive oxygen species and methylglyoxal detoxification in two Citrus species differing in aluminum tolerance. Tree Physiol. 2018, 38, 1548–1565. [Google Scholar] [CrossRef]
  16. Guo, X.R.; Cao, K.F.; Xu, Z.F. Response of photosynthesis and antioxygenic enzymes in seedlings of three tropical forest tree species to different light environments. Chin. J. Appl. Ecol. 2004, 15, 377–381. [Google Scholar] [CrossRef]
  17. Liu, X.; He, Y.; Xiao, Y.; Wang, Y.; Jiang, Y.; Jiang, Y. Soil seed burial and competition with surrounding plants determine the emer-gence and development of seedling of an endangered species Horsfieldia hainanensis Merr. in China. Sci. Rep. 2019, 9, 17970. [Google Scholar] [CrossRef]
  18. Liu, C.; Tian, T.; Li, S.; Wang, F.; Liang, Y. Growth response of Chinese woody plant seedlings to different light intensities. Acta Ecol. Sin. 2018, 38, 518–527. [Google Scholar] [CrossRef]
  19. Strasser, R.J.; Tsimill-Michael, M.; Srivastava, A. Analysis of the chlorophyll a fluorescen cetransient. In Advances in Photosynthesis and Respiration; Papageorgiou, E., Govindjee, G.C., Eds.; KAP Press: Best, The Netherlands, 2004; pp. 1–42. [Google Scholar] [CrossRef]
  20. Li, P.M.; Gao, H.Y.; Strasser, R.J. Application of the fast chlorophyll fluorescence induction dynamics analysis in photosyn-thesis study. J. Plant Physiol. Mol. Biol. 2005, 31, 559–566. [Google Scholar] [CrossRef]
  21. Yang, J.J.; Lei, P.F.; Xiang, W.H.; Ouyang, S.; Hui, X.R. Growth Variations of Tree Saplings in Relation to Species Diversity and Functional Traits in a Tree Diversity Pot Experiment. Forests 2018, 9, 380. [Google Scholar] [CrossRef]
  22. Gonzalez, C.M.; Pignata, M.L. The Influence of Air Pollution on Soluble Proteins, Chlorophyll Degradation, MDA, Sulphur and Heavy Metals in A Transplanted Lichen. Chem. Ecol. 1994, 9, 105–113. [Google Scholar] [CrossRef]
  23. Monreal, J.A.; Jiménez, E.T.; Remesal, E.; Morillo-Velarde, R.; García-Maurino, S.; Echevarría, C. Proline content of sugar beet storage roots: Response to water deficit and nitrogen fertilization at field conditions. Environ. Exp. Bot. 2007, 60, 257–267. [Google Scholar] [CrossRef]
  24. Lassouane, N.; Aïd, F.; Lutts, S. Water stress impact on young seedling growth of Acacia arabica. Acta Physiol. Plant. 2013, 35, 2157–2169. [Google Scholar] [CrossRef]
  25. Choudhury, S.; Panda, S.K. Toxic Effects, Oxidative Stress and Ultrastructural Changes in Moss Taxithelium Nepalense (Schwaegr.) Broth. Under Chromium and Lead Phytotoxicity. Water Air Soil Pollut. 2005, 167, 73–90. [Google Scholar] [CrossRef]
  26. Haung, H.T.; Haung, J.J.; Cheng, J.; Cheng, Y.J.; Guan, D.S. Growth, physiological and biochemical response of Baccaurea ramiflora Lour. Seedlings to different shading environments. Chin. J. Ecol. 2020, 39, 1538–1547. [Google Scholar] [CrossRef]
  27. Zhang, H.; Feng, P.; Yang, W.; Sui, X.; Li, X.; Li, W.; Zhang, R.; Gu, S.; Xu, N. Effects of flooding stress on the photosynthetic apparatus of leaves of two Physocarpus cultivars. J. For. Res. 2018, 29, 1049–1059. [Google Scholar] [CrossRef]
  28. Wang, X.; Yang, X.L.; Ye, Z.P.; Lu, Y.T.; Ma, X.F. Stomatal and non-stomatal limitations to photosynthesis in Sorghum bicolor at diferent temperatures. Plant Physiol. J. 2022, 58, 1245–1253. [Google Scholar] [CrossRef]
  29. Qin, P.; Zeng, S.H.; Liu, F.H.; Liu, X.L.; Zhou, W. Effect of different light intensity on photosynthesis of K326 vigorous florescence. J. Yunnan Univ. 2003, 1, 97–100. [Google Scholar]
  30. Zhang, J.; Liu, J.; Yang, C.; Du, S.; Yang, W. Photosynthetic performance of soybean plants to water deficit under high and low light intensity. S. Afr. J. Bot. 2016, 105, 279–287. [Google Scholar] [CrossRef]
  31. Miao, C.; Yang, S.; Xu, J.; Wang, H.; Zhang, Y.; Cui, J.; Zhang, H.; Jin, H.; Lu, P.; He, L.; et al. Effects of Light Intensity on Growth and Quality of Lettuce and Spinach Cultivars in a Plant Factory. Plants 2023, 12, 3337. [Google Scholar] [CrossRef]
  32. Zhou, J.; Li, P.; Wang, J.; Fu, W. Growth, Photosynthesis, and Nutrient Uptake at Different Light Intensities and Temperatures in Lettuce. HortScience 2019, 54, 1925–1933. [Google Scholar] [CrossRef]
  33. Zhang, R.; Kong, Z.; Chen, S.; Ran, Z.; Ye, M.; Xu, J.; Zhou, C.; Liao, K.; Cao, J.; Yan, X. The Comparative Study for Physiological and Biochemical Mechanisms of Thalassiosira Pseudonana and Chaetoceros Calcitrans in Response to Different Light Intensities. Algal Res. 2017, 27, 89–98. [Google Scholar] [CrossRef]
  34. Ruban, A.V. Nonphotochemical Chlorophyll Fluorescence Quenching: Mechanism and Effectiveness in Protecting Plants from Photodamage. Plant Physiol. 2016, 170, 1903–1916. [Google Scholar] [CrossRef] [PubMed]
  35. Yudina, L.; Sukhova, E.; Gromova, E.; Mudrilov, M.; Zolin, Y.; Popova, A.; Nerush, V.; Pecherina, A.; Grishin, A.A.; Dorokhov, A.A. Effect of Duration of LED Lighting on Growth, Photosynthesis and Respiration in Lettuce. Plants 2023, 12, 442. [Google Scholar] [CrossRef] [PubMed]
  36. Eriksen, R.L.; Knepper, C.; Cahn, M.D.; Mou, B. Screening of Lettuce Germplasm for Agronomic Traits under Low Water Conditions. HortScience 2016, 51, 669–679. [Google Scholar] [CrossRef]
  37. Cammarisano, L.; Körner, O. Response of Cyanic and Acyanic Lettuce Cultivars to an Increased Proportion of Blue Light. Biology 2022, 11, 959. [Google Scholar] [CrossRef] [PubMed]
  38. Song, T.; Zhang, M.; Gao, J.X.; Han, Y.W. Fast chlorophyll fluorescence kinetics and its application in plant physiology re-search. J. Biol. 2011, 28, 81–86. [Google Scholar] [CrossRef]
  39. Tikkanen, M.; Mekala, N.R.; Aro, E.M. Photosystem II photoinhibition-repair cycle protects Photosystem I from irreversible damage. Biochim. Biophys. Acta (BBA)–Bioenerg. 2014, 1837, 210–215. [Google Scholar] [CrossRef]
  40. Cai, S.Q.; Xu, D.Q. Light intensity-dependent reversible down-regulation and irreversible damage of PSII in soybean leaves. Plant Sci. 2002, 163, 847–853. [Google Scholar] [CrossRef]
  41. Zhang, D.; Cheng, C.S.; Li, P.M.; Ma, W.F. Effects of drought on the photosynthetic apparatus in Malus hupehensis leaves explored by simultaneous measurement of prompt fluorescence, delayed fluorescence and modulated light reflection at 820 nm. Plant Physiol. J. 2013, 49, 551–560. [Google Scholar] [CrossRef]
  42. Lidon, F.J.C.; Reboredo, F.H.; Leitão, A.E.; Silva, M.M.A.; Duarte, M.P.; Ramalho, J.C. Impact of UV-B radiation on photosynthesis—An overview. Emir. J. Food Agric. 2012, 24, 546–556. [Google Scholar] [CrossRef]
  43. Jin, L.Q.; Che, X.K.; Zhang, Z.S.; Gao, Y.H. The relationship between the changes in Wk and different damage degree of PSII donor side and acceptor side under high temperature with high light in cucumber. Plant Physiol. J. 2015, 51, 969–976. [Google Scholar] [CrossRef]
  44. Chen, H.X.; Li, W.J.; An, S.Z.; Gao, H.Y. Characterization of PSII photochemistry and thermostability in salt-treated Rumex leaves. J. Plant Physiol. 2004, 161, 257–264. [Google Scholar] [CrossRef] [PubMed]
  45. Strasser, R.J.; Strivastava, A.; Govindgee. Polyphasic chlorophyll a fluorescence transient in plants and cyanobacteria. Photochem. Photobiol. 1995, 61, 32–42. [Google Scholar] [CrossRef]
  46. Zhang, Z.; Jia, Y.J.; Gao, H.Y.; Zhang, L.T.; Li, H.D.; Meng, Q.W. Characterization of PSI recovery after chilling-induced photoinhibition in cucumber (Cucumis sativus L.) leaves. Planta 2011, 234, 883–889. [Google Scholar] [CrossRef]
  47. Van Heerden, P.D.R.; Strasser, R.J.; Krüger, G.H.J. Reduction of dark chilling stress in N2-fixing soybean by nitrate as indi-cated by chlorophyll a fluorescence kinetics. Physiol. Plant. 2004, 121, 239–249. [Google Scholar] [CrossRef]
  48. Liu, M.S.; Huang, X.H.; Wang, R.J.; Xu, H.Y.; Zhu, F. Inhibition of photosynthesis in Melia azedarach and Ligustrum lucid-um induced by manganese toxicity using OJIP chlorophyll a fluorescence transient. Photosynthetica 2021, 59, 148–159. [Google Scholar] [CrossRef]
  49. Strasser, R.J.; Tsimilli-Michael, M.; Qiang, S.; Goltsev, V. Simultaneous in vivo recording of prompt and delayed fluorescence and 820 nm reflection changes during drying and after rehydration of the resurrection plant haberlea rhodopensis. Biochim. Biophys. Acta (BBA)–Bioenerg. 2010, 1797, 1313–1326. [Google Scholar] [CrossRef]
  50. Yan, K.; Zhao, S.J.; Xu, H.L.; Wu, C.W.; Chen, X.B. Effects of salt stress on photosynthetic characters in honeysuckle with different ploidies. Sci. Agric. Sin. 2015, 48, 3275–3286. [Google Scholar] [CrossRef]
  51. Müller, P.; Li, X.P.; Niyogi, K.K. Non-photochemical quenching: A response to excess light energy. Plant Physiol. 2001, 125, 1558–1566. [Google Scholar] [CrossRef]
  52. Li, P.; Song, A.; Li, Z.; Fan, F.; Liang, Y. Silicon ameliorates manganese toxicity by regulating both physiological processes and expression of genes associated with photosynthesis in rice (Oryza sativa L.). Plant Soil 2015, 397, 289–301. [Google Scholar] [CrossRef]
  53. Wan, P.; Xiong, X.Z.; Huang, X.H.; Wu, J.C.; Ou, Y.; Deng, X.M.; Liu, Y. Effects of pesticides stress on the chlorophyll fluo-rescence characteristics and growth of Vernicia fordII seedlings. Sci. Silvae Sin. 2016, 52, 22–29. [Google Scholar] [CrossRef]
  54. Munns, R.; Gilliham, M. Salinity tolerance of crops–what is the cost? New Phytol. 2015, 208, 668–673. [Google Scholar] [CrossRef] [PubMed]
  55. Luo, G.; Li, J.; Guo, S.; Li, Y.; Jin, Z. Photosynthesis, Nitrogen Allocation, Non-Structural Carbohydrate Allocation, and C:N:P Stoichiometry of Ulmus elongata Seedlings Exposed to Different Light Intensities. Life 2022, 12, 1310. [Google Scholar] [CrossRef] [PubMed]
  56. Liu, G.S.; Yun, F.; Shi, H.Z.; Wang, K.; Zhagn, C.H.; Song, J. Effects of Cooperation of Light and Nitrogen on the Content of Nitric Compound, Antioxidant System and Quality of Flue-cured Tobacco. Sci. Agric. Sin. 2010, 43, 3732–3741. [Google Scholar] [CrossRef]
  57. Luo, W.J. Effects of Light and Nitrogen Interaction on Growth and Physiology of Horsfieldia hainanensis Merr. Seedlings. Master’s Thesis, Guangxi University, Nanning, China, 2018. [Google Scholar] [CrossRef]
  58. Yuan, X.K.; Yang, Z.Q.; Li, Y.X.; Han, W. Effects of different levels of water stress on leaf photosynthetic characteristics and antioxidant enzyme activities of greenhouse tomato. Photosynthetica 2016, 54, 28–39. [Google Scholar] [CrossRef]
Figure 1. Effects of different shading treatments on the net growth of diameter (A) and height in seedlings (B). Note: Lowercase letters (a, b, c, d) above the bars indicate significant differences (p < 0.05) among the shading treatments. Bars represent mean values with standard error (±SE) (n = 20).
Forests 15 00003 g001
Figure 2. Effects of shading on photosynthetic gas exchange ((A): the net photosynthetic rate (Pn), (B): transpiration intensity (Tr), (C): the stomatal conductance (Ls), (D): Water use efficiency (WUE)) parameters in leaves. Note: Lowercase letters (a, b, c, d) above the bars indicate significant differences (p < 0.05) among the shading treatments. Bars represent mean values with standard error (±SE) (n = 20).
Forests 15 00003 g002
Figure 3. Effects of different shading treatments on the overall performance ((A): the performance index (PIABS), (B): 820 nm red light absorbance value (ΔI/Io)) and coordination of leaf PSII/PSI (C). Note: Lowercase letters (a, b, c, d) above the bars indicate significant differences (p < 0.05) among the shading treatments. Bars represent the mean values with standard error (±SE) (n = 20).
Forests 15 00003 g003
Figure 4. Effects of different shading treatments on the osmotic substance and products of membrane lipid peroxidation of the leaves ((A): Soluble sugar content, (B): Soluble protein content, (C): Proline content, (D): the malondialdehyde content). Note: Lowercase letters (a, b, c, d) above the bars indicate significant differences (p < 0.05) among the shading treatments. Bars represent the mean values with standard error (±SE) (n = 20).
Forests 15 00003 g004
Table 1. The physiological parameters and absorbance at 820 nm of recorded fluorescence transient OJIP.
Data extracted from recorded fluorescence transient OJIP
FtFluorescence at time t after onset of actinic illumination
F20μsFirst reliable recording of FL fluorescence in 20 μs
F300μsFluorescence intensity at 300 μs
FJ = F2msFluorescence intensity at the J-step (2 ms) of OJIP
FI = F30msFluorescence intensity at the I-step (30 ms) of OJIP
FPMaximal recorded FL fluorescence intensity, peak P of OJIP
tFMTime to reach maximum value in milliseconds (ms)
AreaTotal complementary area between FL fluorescence induction curve and F = FM
Fluorescence parameters derived from the extracted data
FO ≌ F20μsMinimal fluorescence when all RCs are on
FMMaximum FL fluorescence when all RCs are on
FV = FM − FOMaximum variable fluorescence
Wk = (Fk − FO)/(FJ − FO)K-step relative variable fluorescence
VJ = (FJ − FO)/FM − FO)J-step relative variable fluorescence
VI = (FI − FO)/(FM − FO)I-step relative variable fluorescence
MO = 4(F300μs − FO)/(FM − FO)Approximated initial slope (in ms−1) of the fluorescence transient normalized at the maximum variable fluorescence FV
SM = (Area)/(FM − FO)Normalized area relative variable approximate initial slope of FL fluorescence at time t in ms−1
Quantum yields and efficiency/probability
φPo = TRO/ABS = [1 − (FO/FM)]Maximum quantum yield of primary photochemistry at t = 0
ΨO = ETO/TRO = (1 − VJ)Probability of a captured excitation moving an electron into the electron transport chain outside of QA at t = 0
φEo = ETO/ABS = [1 − (FO/FM)] · ΨOQuantum yield of electron transport (at t = 0)
δ(Ro) = (1 − VI)/(1 − VJ)Probability of an electron from the reducing-end electron acceptor at the QB to the reducing-end electron acceptor at the PS I acceptor (RE)
φDo = 1 − φPo = (FO/FM)Quantum yield of energy dissipation (at t = 0)
Performance
PIABS = (RC/ABS) · [φPo/(1 − φPo)] · [ΨO/(1 − ΨO)]The performance index (potential) of PS II absorbing photon energy conservation to intersystem electron acceptor reduction
Calculated data for absorbance at 820 nm
I0 = I0.7First reliable recorded fluorescence at 0.7 ms
IminMinimum fluorescence intensity
ΔI/I0 = (I0 − Imin)/I0820 nm red light absorbance value
Data calculated from the recorded fluorescence transient OJIP and absorbance at 820 nm
Φ(PSI/PSII) = (ΔI/Io)/ΨOCoordination of photosystem II (PSII) and photosystem I (PSI)
Table 2. Effects of different shading treatments on the leaf quantum yield or energy distribution ratio.
Shading
Treatment
φPoΨoφEoδ(Ro)φDo
L10.71 ± 0.04 a0.37 ± 0.05 a0.27 ± 0.03 a0.07 ± 0.01 a0.29 ± 0.04 a
L20.81 ± 0.02 b0.45 ± 0.05 ab0.36 ± 0.03 b0.19 ± 0.02 b0.19 ± 0.02 b
L30.81 ± 0.01 b0.40 ± 0.02 a0.32 ± 0.01 ab0.19 ± 0.02 b0.19 ± 0.01 b
L40.75 ± 0.03 ab0.54 ± 0.03 b0.39 ± 0.02 b0.18 ± 0.01 b0.25 ± 0.03 ab
Note: Different letters indicate significant differences among the different levels of shading treatments (p < 0.05). Data are presented as the mean ± SE (n = 20) values.
Table 3. Effects of different shading treatments on the leaf PSII donor side/acceptor side.
Shading
Treatment
WKVJMoSM
L10.53 ± 0.02 a0.63 ± 0.05 a1.08 ± 0.05 a5.23 ± 0.69 a
L20.43 ± 0.02 b0.55 ± 0.06 ab0.83 ± 0.06 bc11.92 ± 1.51 b
L30.39 ± 0.03 b0.60 ± 0.01 ab0.95 ± 0.02 ab11.01 ± 1.25 b
L40.45 ± 0.02 b0.49 ± 0.01 b0.76 ± 0.04 c12.8 ± 0.74 b
Note: Different letters indicate significant differences among the different levels of shading treatments (p < 0.05). Data are presented as the mean ± SE (n = 20) values.
Disclaimer/Publisher’s Note: The statements, opinions and data contained in all publications are solely those of the individual author(s) and contributor(s) and not of MDPI and/or the editor(s). MDPI and/or the editor(s) disclaim responsibility for any injury to people or property resulting from any ideas, methods, instructions or products referred to in the content.

