Article

Visible Light-Induced Photocatalytic Degradation of Methylene Blue Using Copper-Doped Carbon Dots One-Step Derived from CCA-Wood

1
Institut de Recherche sur les Forêts, Université du Québec en Abitibi-Témiscamingue, Rouyn-Noranda, QC J9X 5E4, Canada
2
State Key Laboratory of Biobased Material and Green Papermaking, Qilu University of Technology, Shandong Academy of Sciences, Jinan 250353, China
3
Lasonde School of Engineering, York University, 105 Bergeron Centre for Engineering Excellence, North York, Toronto, ON M3J 2S5, Canada
4
Centre Technologique des Résidus Industriels en Abitibi Témiscamingue, 433 Boulevard Du Collège, Rouyn-Noranda, QC J9X 0E1, Canada
*
Authors to whom correspondence should be addressed.
Forests 2024, 15(4), 680; https://doi.org/10.3390/f15040680
Submission received: 18 February 2024 / Revised: 21 March 2024 / Accepted: 8 April 2024 / Published: 10 April 2024
(This article belongs to the Special Issue Sustainable Materials in the Forest Products Industry)

Abstract

:
Developing novel eco-friendly broad-spectrum visible light photocatalysts for dye removal is one of the urgent problems for water treatment. Here, copper-doped carbon dots (CDs) were reported to be directly fabricated from chromated copper arsenate (CCA) wood waste for the photocatalytic degradation of the methylene blue dye. The properties of the resulting CDs were thoroughly characterized and analyzed, preceding an investigation into the adsorption kinetics of dye degradation. The kinetic study showed that reactant concentration was the rate-limiting factor. The obtained CDs showed a 151 mg/g photocatalytic degradation capacity. Comparing pure CDs to CDs/TiO2 composites, the former demonstrated higher photodegradation efficiency. This superiority can be attributed to the synergistic action of adsorption and photocatalytic degradation working in tandem. This study prepared Cu doped CDs and elucidated the photocatalysis mechanism of methylene blue degradation by CDs. The photodegradation of organic dyes through CDs derived from waste CCA wood emerges as an eco-friendly, facile, and highly efficient method.

1. Introduction

Water, the source of all life, is the most crucial element in our ecosystem for all animals, plants, insects, and humans. However, various hazardous chemicals endanger natural water resources due to inadequate wastewater treatment [1]. Dye is one of the significant hazards for water pollution and must be decontaminated before discharge into natural water bodies. Studies indicate that about 280,000 tons of dyes are wasted through industrial sewage annually [2]. If this wastewater is not properly treated, it will cause major environmental hazards, including the contamination of water sources and the depletion of soil productivity. Particularly noteworthy is methylene blue (MB), a widely used dye in various industries such as garments [3], textiles [4], ink [5], pharmaceuticals [6], leather [7], and paper industries [8]. The release of MB wastewater into the ecosystem significantly contributes to eutrophication, posing severe health risks, including cancer, eye burns, mutations, skin irritations, and allergic dermatitis [9]. Therefore, MB must be well treated before discharge to the natural environment.
Different treatments have been employed to eliminate MB from wastewater, encompassing ozonation, adsorption, biodegradation, chlorination, electrochemical treatment, filtration, laser-induced plasma, and photocatalysis [10,11,12]. Conventional methods for removing dyes in industrial systems include chemical coagulation, oxidation, activated carbon adsorption, reverse osmosis, etc. Among these, advanced oxidation processes based on photocatalysis systems have attracted more attention from the research community, in which the dyes are converted into non-toxic and simple molecules [8]. Photocatalysis transfers organic wastes into CO2 and H2O by interacting with the gain and loss of electrons [13]. Metal oxide semiconductors are commonly used as photocatalysts because of their large band gap [14]. Two main photochemical reactions at the surface of photocatalysts involve oxidation initiated by positive holes and reduction initiated by negative electrons [15]. However, it is crucial to acknowledge that these photocatalysts are predominantly metal oxides deriving from non-renewable resources.
Carbon dots (CDs) as innovative carbon nanoparticles with a size of less than 10 nm were discovered in 2004 during the impurity removal process of carbon nanotubes [16]. Since then, CDs as 0-dimension quasi-spherical particles have attracted wide attention [15,17,18]. Notably, various renewable and recycled precursors, such as glass, juice, and yeast, have been employed to fabricate CDs, aligning with principles of sustainable development [19,20,21]. Consequently, CDs have diverse applications in bio-imaging, sensors, drug delivery, and photocatalysis [22,23,24,25].
The first study on dye photocatalysis degradation by CDs was reported by Li et al. (2010), where CDs/TiO2 composite could photo-reduce MB while pure CDs showed no photodegradation of the dye [26]. Generally, CDs were hybridized with semiconductors, including ZnS [27], TiO2 [28], and SnO2 [29], to act as photocatalysts. CDs mainly play two roles in the photocatalytic degradation of dyes among the mixed system of CDs and semiconductors [15]. On the one hand, CDs absorb visible light, generating photogenerated electrons and holes. Semiconductors then accept the photogenerated electrons, facilitating the charge carrier separation. On the other hand, CDs act as acceptors of photogenerated electrons from semiconductors under UV irradiation, reducing charge carrier recombination.
There are few reports on the direct photocatalytic degradation of dyes by pure CDs, with some suggesting their limited effectiveness [30]. Besides the CDs-semiconductor composite, CDs are used more to catalyze dye degradation after doping with other atoms [17]. N-doped CDs obtained from grass were used for the dye photodegradation in visible and UV regions [31,32]. N-doped CDs induce reactive oxide species, contributing to methylene blue (MB) degradation. Metal-doped CDs, like Cu-CDs, CuO-CDs, ZnO-CDs, and NiO-CDs, were commonly prepared by mixing metal ion solutions with biomass precursors, promoting their photocatalysis application [20]. However, Cu-CDs are prepared almost entirely from copper ions and biomass, generating a waste solution [33].
Chromate-copper-arsenate (CCA) wood has been widely used around the world. However, arsenic, copper, and chromium in the CCA-wood pose a great risk to the environment and human health. Therefore, it is very important to reuse CCA-wood waste scientifically and effectively. This study uses copper and carbon from waste wood to prepare carbon dots not only to reduce the environmental pollution caused by heavy metals but also to extend the service life of the wood and reduce the carbon footprint. Moreover, mechanism and kinetic studies on Cu-CDs photocatalytic degradation of dyes need further exploration.
Thus, this study focuses on the direct photocatalytic degradation of MB dyes using Cu-CDs obtained directly from CCA-wood waste. The CCA-treated wood waste was repurposed through hydrothermal carbonization to produce CDs, subsequently employed in catalyzing the degradation of MB dyes. Several experimental parameters, such as reactant contents, concentrations of MB, and pH, were investigated to identify the key role in the degradation process. CDs/TiO2 composites were prepared as a control group to explore the obtained CDs’ photocatalytic efficiency and catalytic mechanism. Importantly, detailed studies were conducted on reaction kinetics, adsorption isotherms, and the photocatalytic degradation mechanism of MB in aqueous solutions.

2. Materials and Methods

2.1. Materials

The CCA-treated wood used in this study was supplied by Tred’si (Tred’si North America, Westbury, QC, Canada) (Figure S1). TiO2 was provided by Shanghai Macklin Biochemical Co., Ltd., China. Methylene blue, citric acids, and Na2HPO4 were purchased from Sinopharm Chemical Reagent Co., Ltd., Shanghai, China. All chemicals mentioned were of analytical grade and were used without additional purification. The water employed throughout the study was deionized.

2.2. Preparation of Copper-Doped CDs

The CDs in the study were synthesized using a hydrothermal carbonization method. The specific operation steps are detailed in our previous research [34]. Briefly, 2 g of CCA-wood powder and 80 mL of deionized water were placed in a 100 mL Teflon-lined autoclave, then heated in an oven at 200 °C for 6 h. CDs were finally obtained by centrifugation at 10,000 rpm for 15 min to remove large particles. Its pH value is about 2.78 at 25 °C. The obtained CD solution was over-dried at 100 °C and ground into powder for further characterization and use. CDs/TiO2 composites were prepared based on previous literature [30]. CDs derived from original wood and CCA wood are labeled W-CDs and CCA-CDs, respectively. TiO2 of 0.1 g was added into CD solutions (W-CDs and CCA-CDs) of 5 mL, and the mixture was stirred for 4 h with a magnetic stirrer. CDs/TiO2 composites were obtained by over-drying them at 100 °C.

2.3. Degradation of Methylene Blue

In a glass flask, 30 mg of CDs or CDs/TiO2 composites was introduced into a 30 mL methylene blue (MB) solution with a 10 mg/L concentration. This setup was employed with and without ultraviolet (UV) light treatment, maintaining a constant pH. The mixed solutions were stirred at 170 rpm using a stir plate in a laboratory setting under visible light from LED bulbs. Samples were collected from the reaction vessel at certain intervals for testing. The solution in the reaction vessel continues to be processed under the original conditions. The samples were filtered using a syringe filter of 0.22 μm. The filtered supernatant was subsequently characterized using a UV/vis spectrophotometer by analyzing their absorbance values at the wavelength of 664 nm. Three parallel experiments were conducted during the test, and the average and standard deviation (SD) were taken.
The degradation efficiencies of MB treated with the obtained CDs samples,  R t  (%), were calculated using the following equation:
R t = ( C 0 C t ) / C 0 × 100
The term  C 0  represents the concentrations of MB at the initial time, while  C t  is the concentrations at time t (mg/L).
The effects of MB concentrations, CCA-CDs content, and pH on the degradation of dye have also been studied. The pH of the dye solution was controlled to successive initial values between 2.2 and 9 with the addition of C6H8O7 (0.1 M) or Na2HPO4 (0.2 M). More details are shown in Sections S1.1–S1.3 of the supplementary document.

2.4. Characterizations of CDs and MB Degradation Products

SEM analysis (Hitachi Regulus 8100, Tokyo, Japan) was used to characterize CDs and CDs/TiO2 composites morphology. The detection was carried out with an accelerating voltage of 20 kV. The micromorphology of the obtained CDs was also analyzed by HR-TEM (JEM 2100, JEOL, Tokyo, Japan). CD droplets were deposited onto a carbon-coated copper grid and then dried at room temperature, leaving the nanoparticles on the copper grid. Images were acquired at 200 kV voltage and 105 μA beam current. The zeta potential measurements were conducted using a NanoPlus HD-Zeta/Nano Particle Analyzer (Zetasizer Nano, Malvern, Malvern College, UK). XPS equipment (Thermo Scientific ESCALAB Xi, Waltham, MA, USA) determined the Element analysis of CCA-CDs and the narrow scan XPS spectra were deconvoluted employing the Origin software (Origin 2017, OriginLab, Hampton, MA, USA). Carbon, nitrogen, oxygen, chromium, copper, and arsenic elements in CDs were observed by XPS analysis. Functional groups of the samples were recorded through FTIR, using a Nicolet 6700 with an ATR module (Thermo Fisher Scientific Co., Ltd., Waltham, MA, USA), scanning spectra from 4000 to 400 cm−1 with an average of 32 scans. A UV-vis photo spectrometer (Shimadzu UV-2600, Tokyo, Japan) was used to measure the absorbance value of MB and CDs. The pore characteristics of the obtained CDs were analyzed through N2 adsorption experiments at 77.3 K using an ASAP-2020 gas adsorption analyzer (Micromeritics, Atlanta, GA, USA). Characterization included BET-specific surface area (SBET), external surface (Sext), total pore volume (VT), micropore volume (Vmi), and mesopore volume (Vme). A liquid chromatography-mass spectrometry (LC-MS) instrument (Thermo Scientific, U3000, Waltham, MA, USA) was carried out to identify intermediate compounds during the photocatalytic degradation of MB. A Hypersil GOLD C18 column was used, and the column was held at 18% solvent A (0.1% acetic acid in water) and 72% solvent B (0.1% acetic acid in acetonitrile) at the temperature of 25 °C, with an injection volume of 50 μL and flow rate of 0.25 mL/min.

3. Results and Discussion

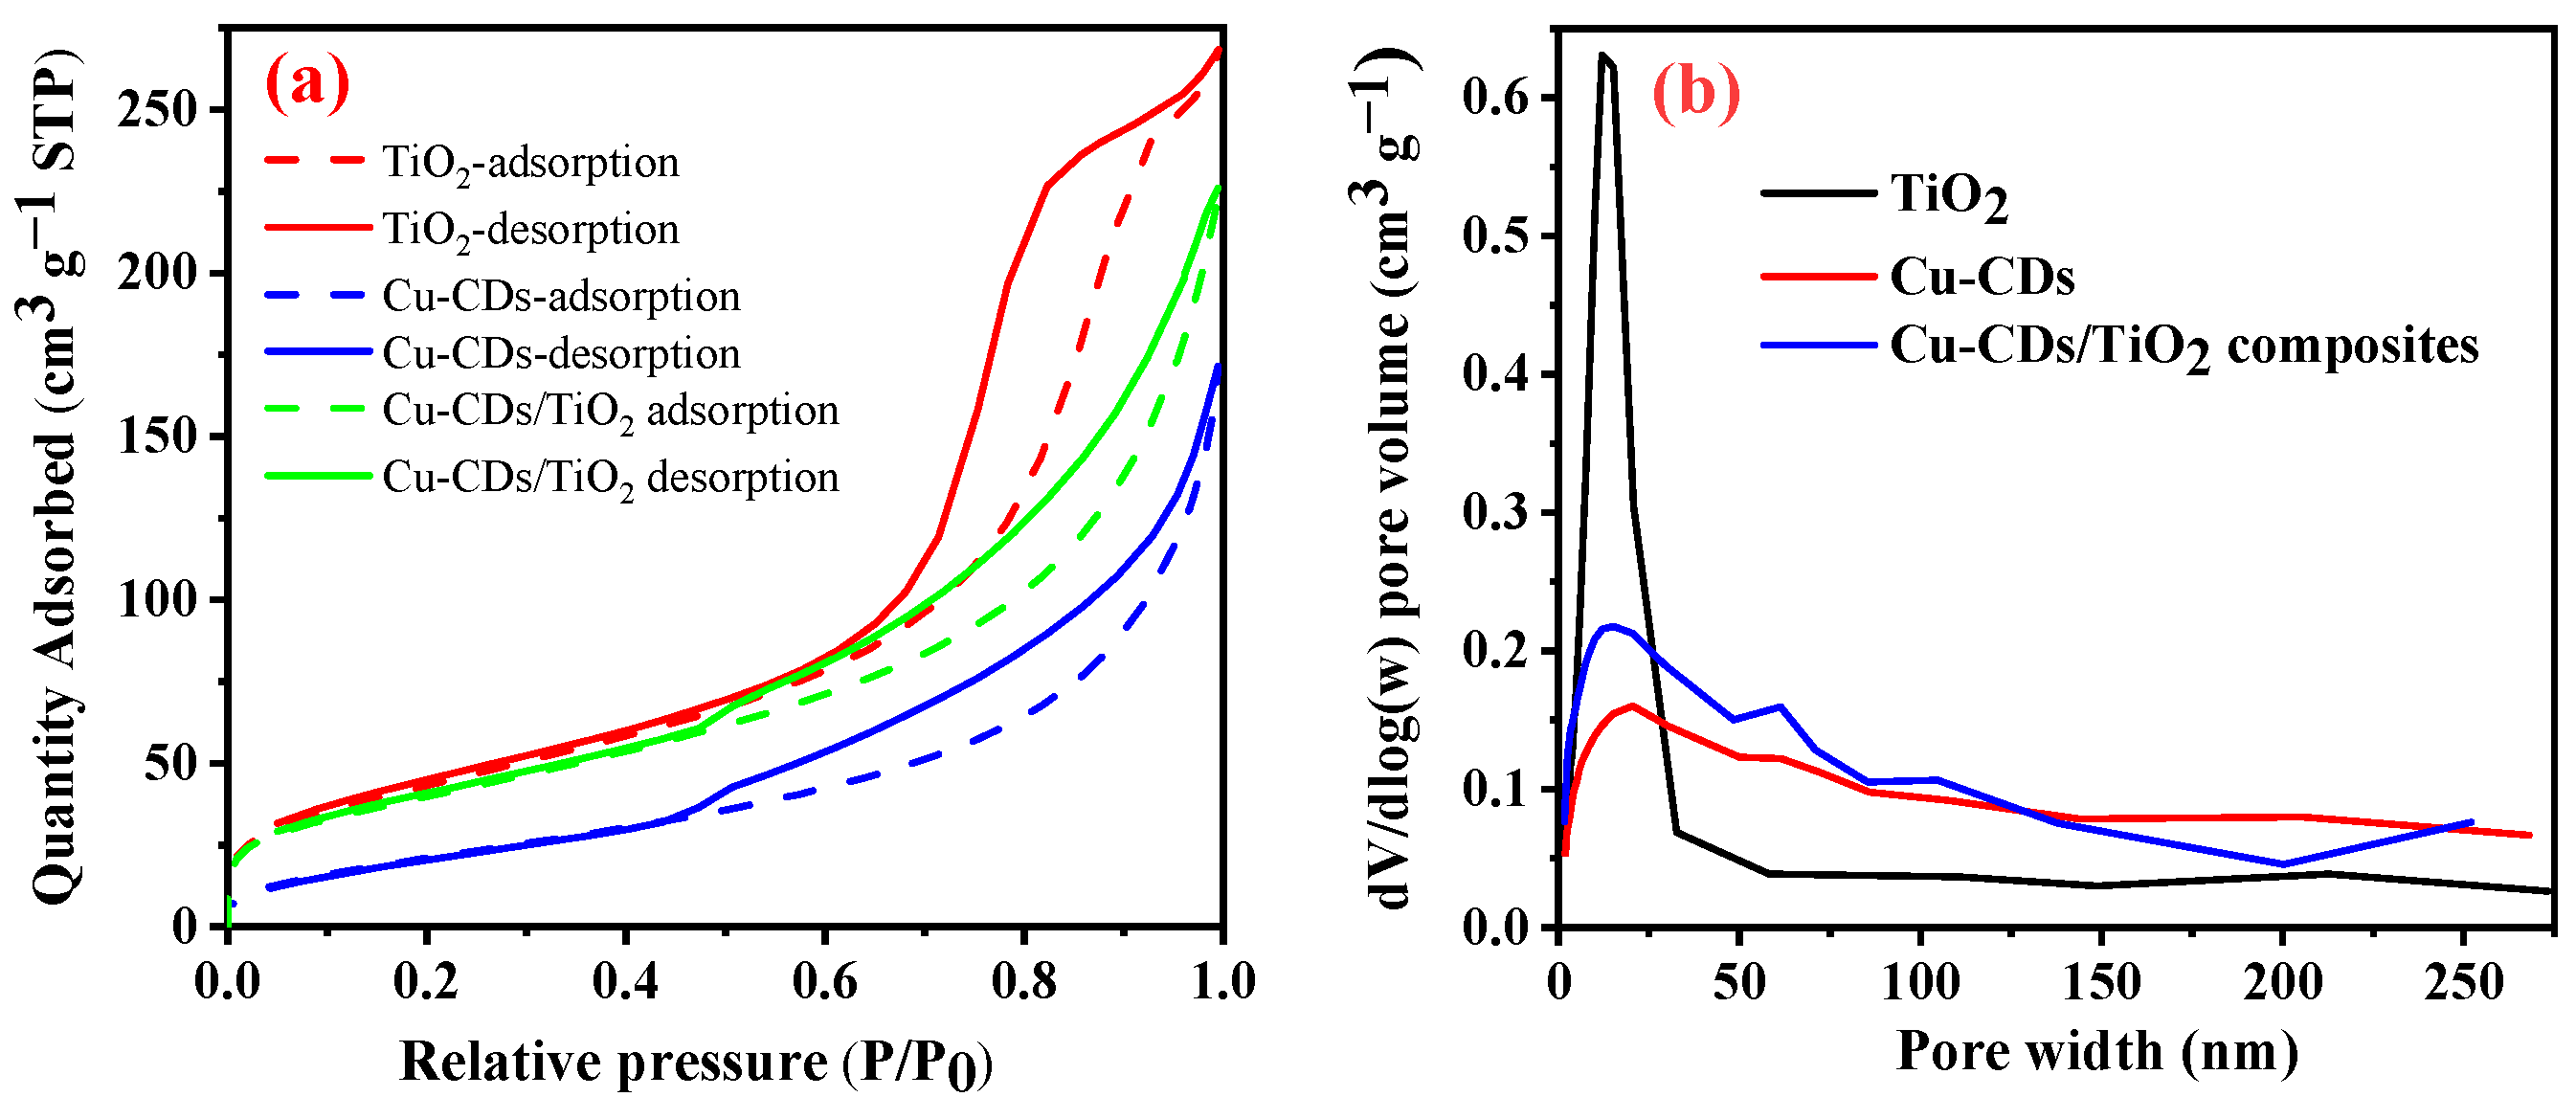
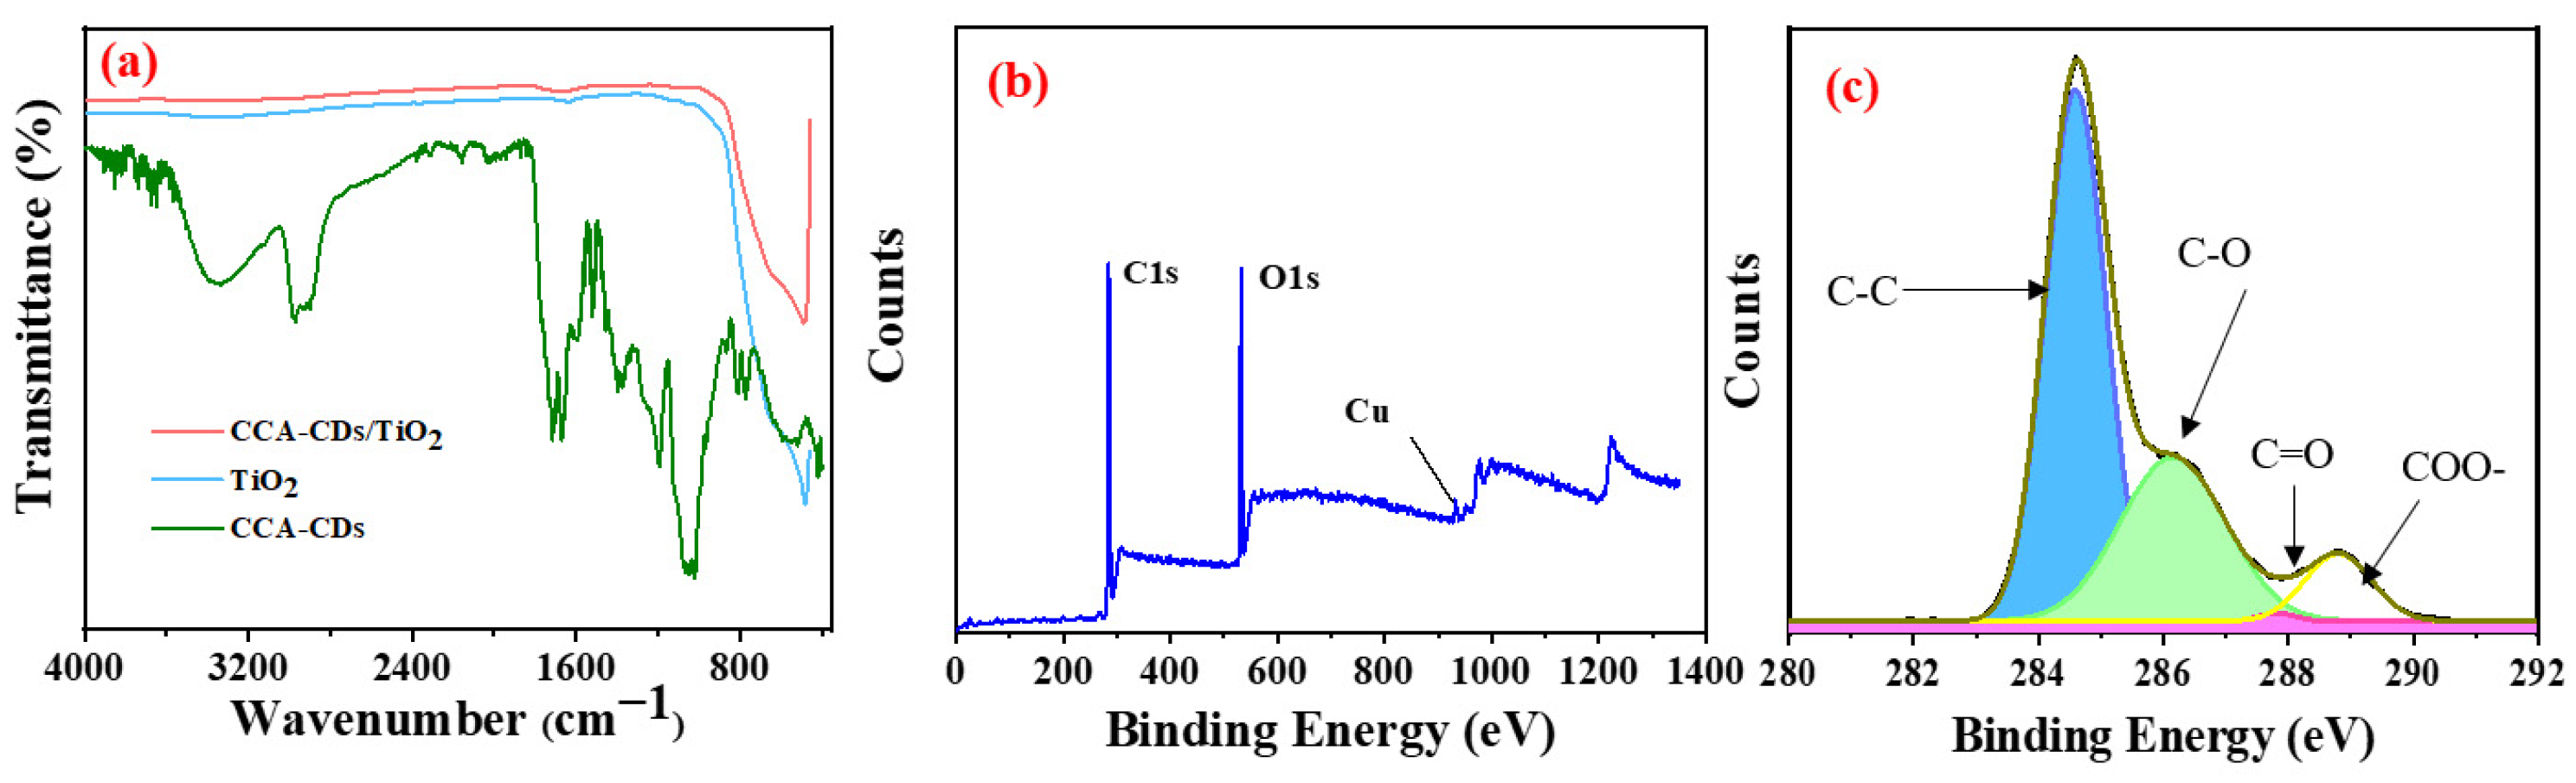
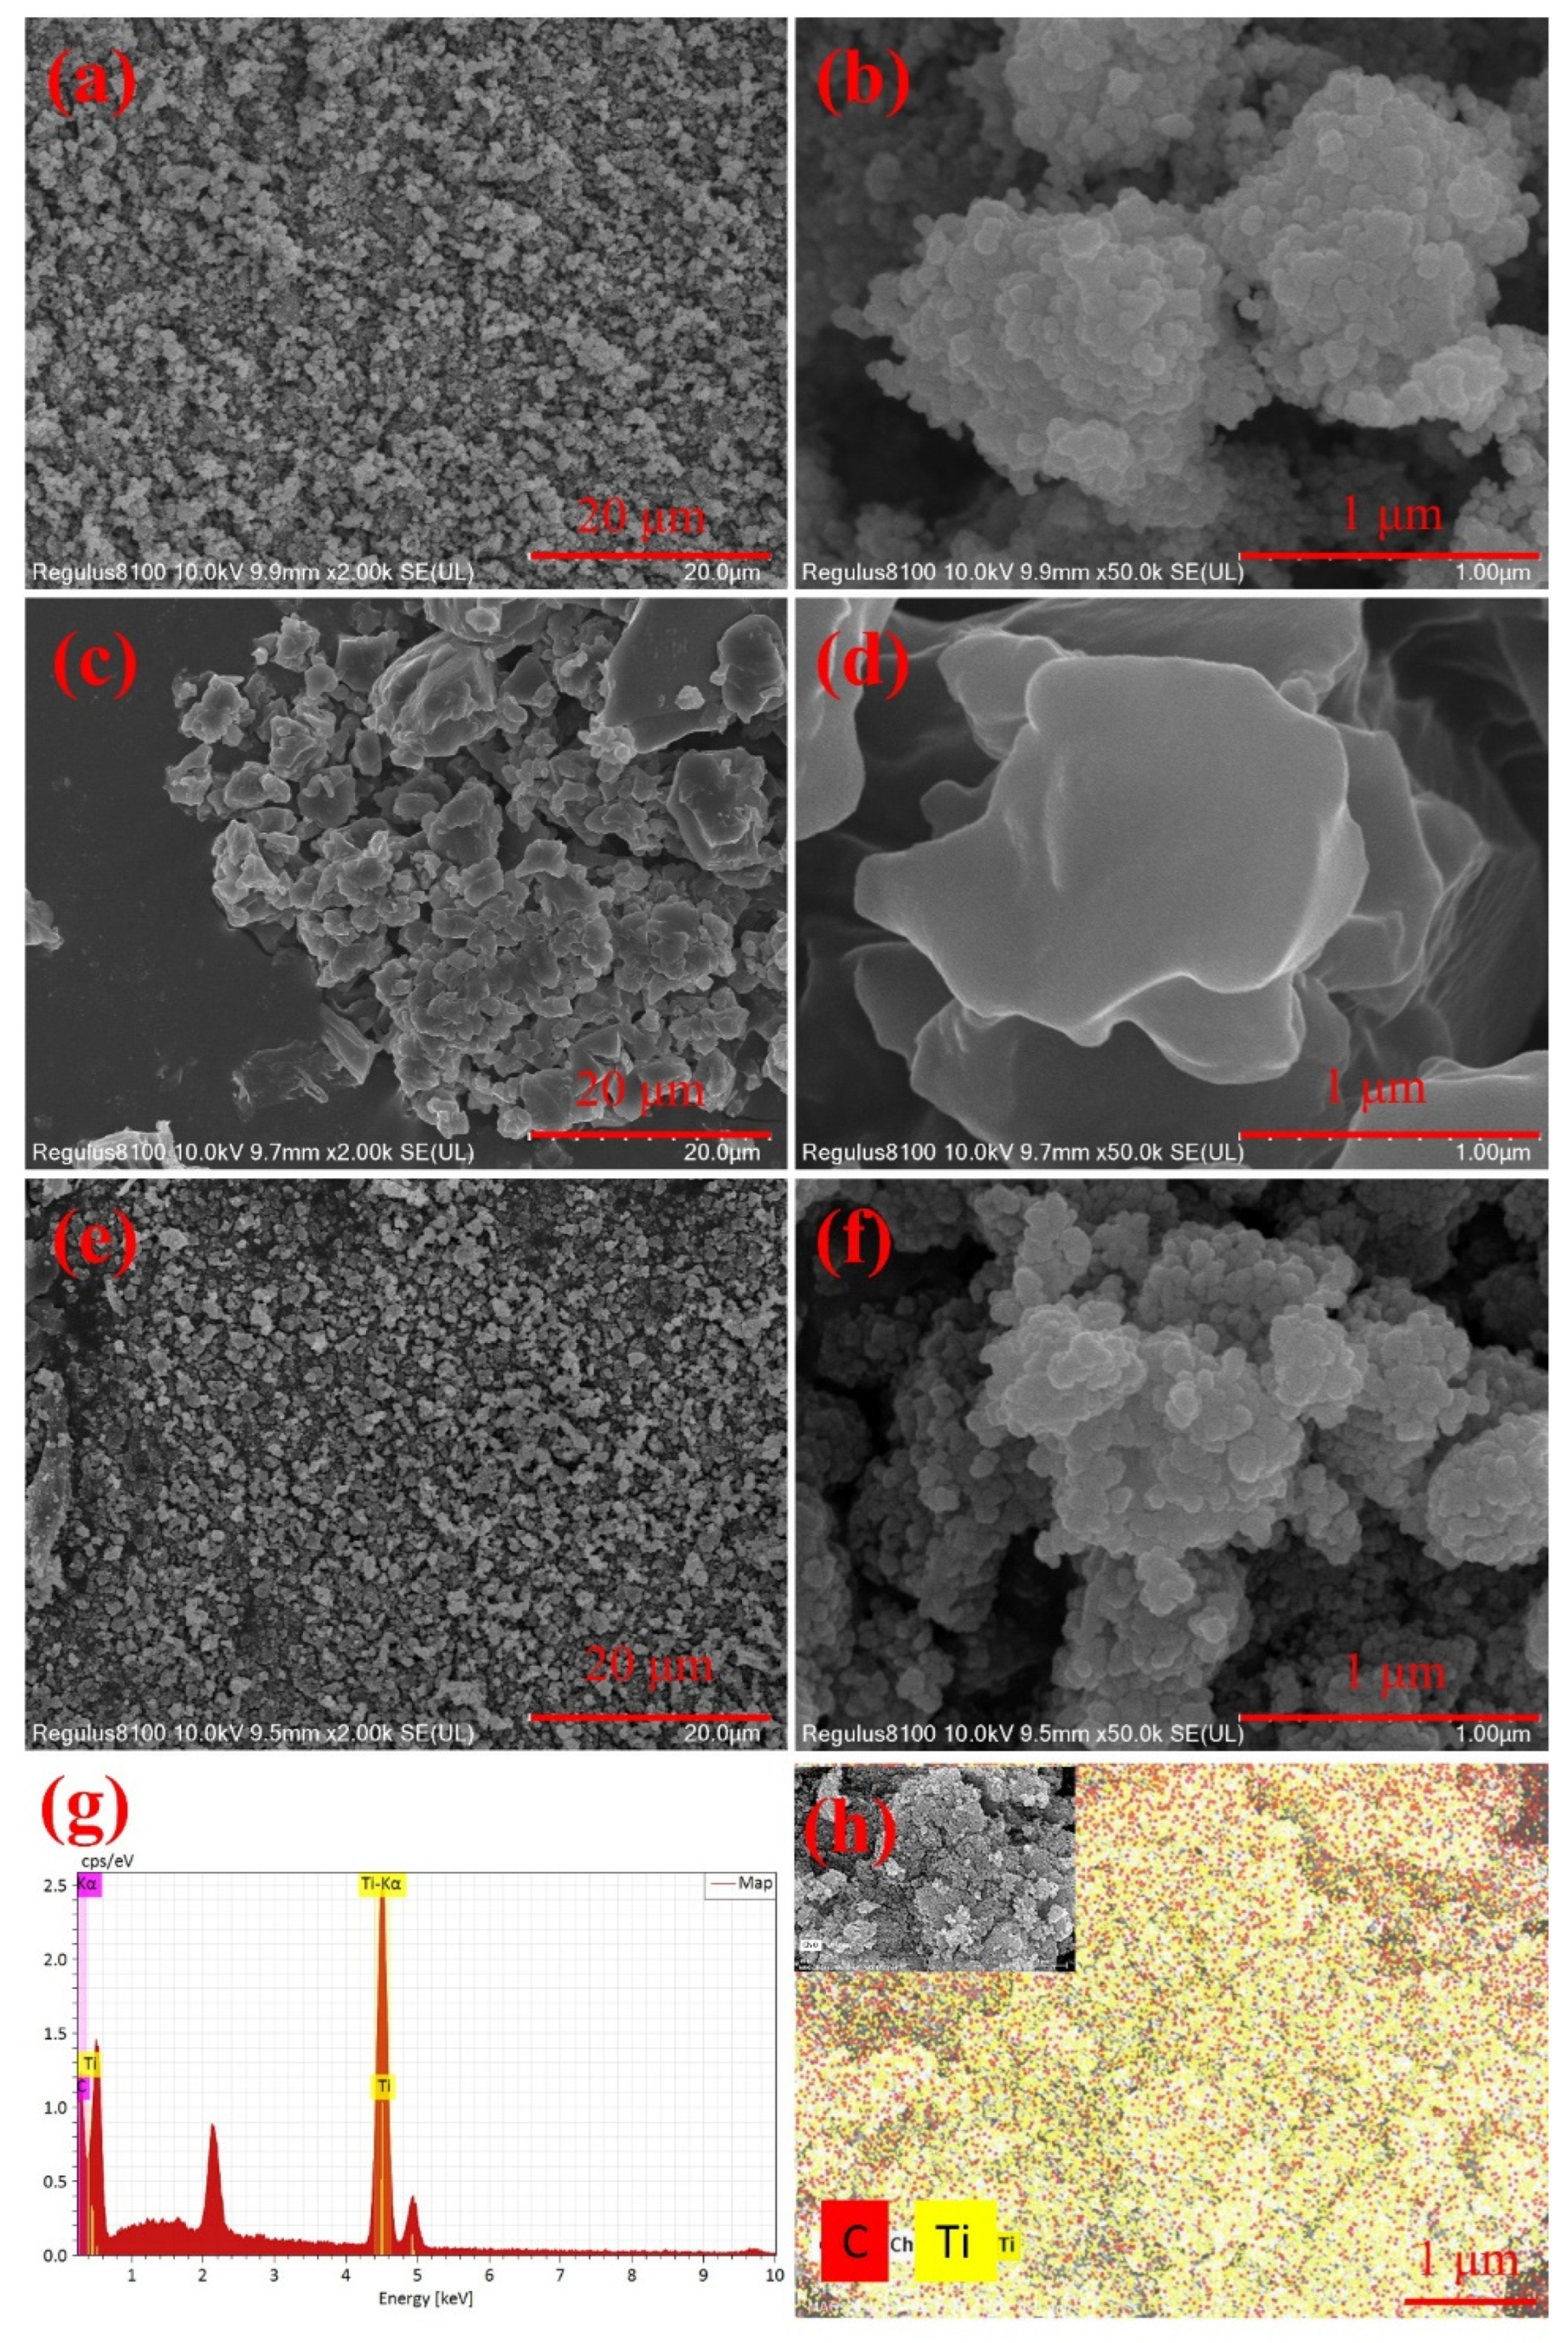
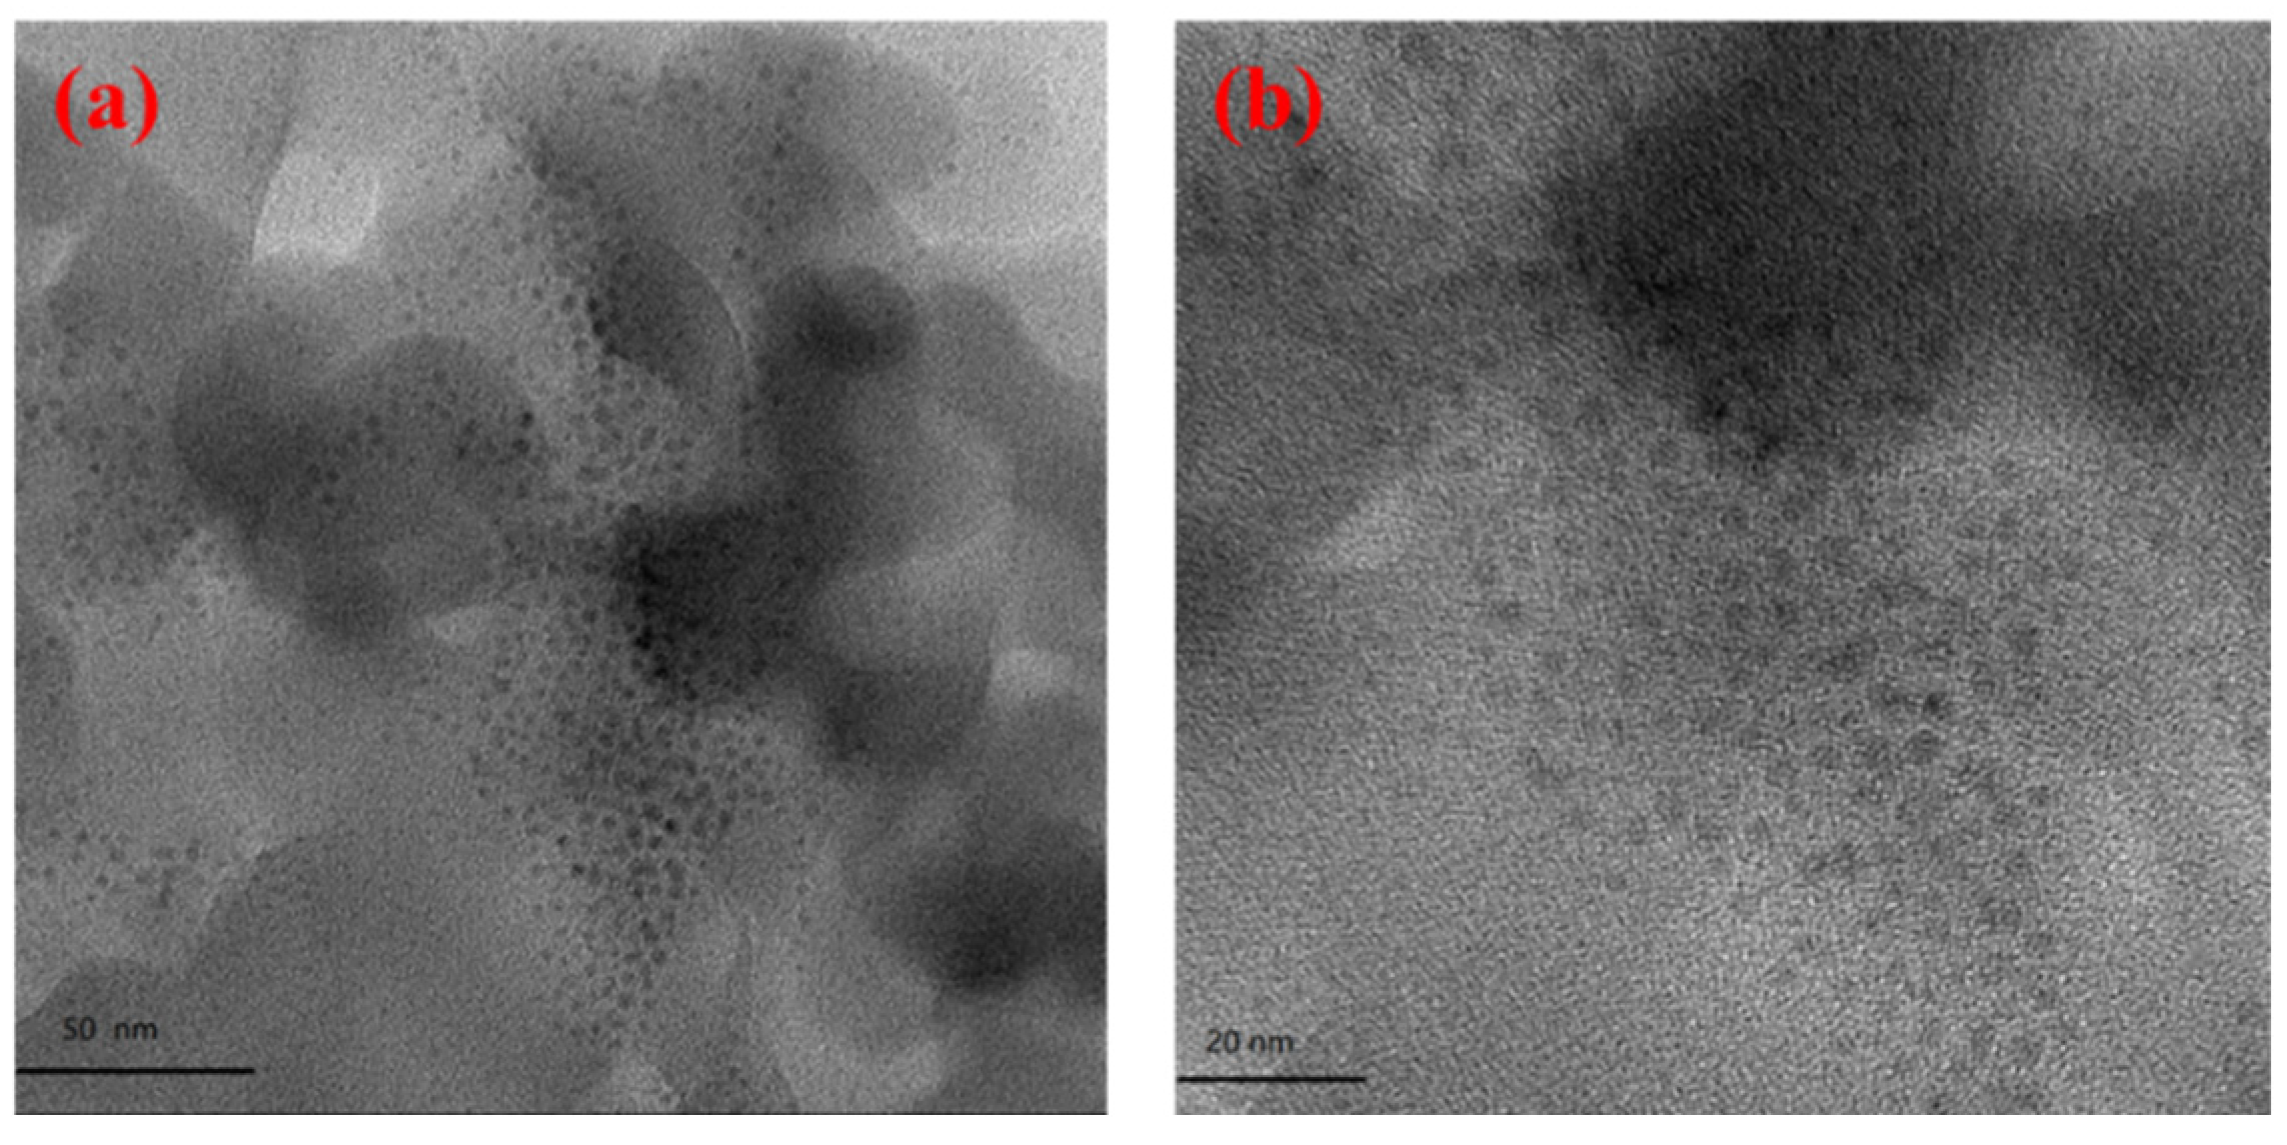
3.1. Characteristics of the Synthesized Samples

The FTIR analysis was conducted to examine the functional groups of the CDs and composites, as shown in Figure 1. The O–H stretching band at 3328 cm−1 and the C–H vibration band in the range of 2976–2898 cm−1 were identified, consistent with previous studies [35,36]. CCA-CDs exhibited characteristic peaks at 1014, 1600, 1670, and 1710 cm−1 corresponding to C–O stretching vibrations, aromatic ring skeleton vibrational stretching, conjugated carbonyl, and non-conjugated carbonyl stretching vibration, respectively [37,38]. Peaks at 1190 and 1398 cm−1 were assigned to C–O–C stretching vibration and C–H bending [39,40]. Thus, the obtained CCA-CDs contained various functional groups, including hydroxyl, carboxylic, carbonyl, and aromatic rings. Hydrophilic groups of –OH and –COOH on CDs promoted their solubility and stability [35]. The characteristic peak of TiO2 was observed at the location of 480–490 cm−1 [41]. The same peak was observed for CCA-CDs/TiO2 composites (Figure 1a). However, the intensity of characteristic peaks belonging to CDs was low in the spectrum of the composites. It can be explained by the fact that fewer CDs are present in the composites. The rigidity of the TiO2 structure showed a negative effect on the intensity of bands belonging to CDs in the FTIR spectrum of the CCA-CDs/TiO2 composites [42].
The XPS spectra of CCA-CDs revealed three peaks: C1s at 286 eV, O1s at 530 eV, and Cu at 932 eV (Figure 1b,c). The presence of Cu indicated the obtained CDs were doped with copper because CCA wood contains a lot of copper ions. However, the XPS spectra did not observe chromium and arsenic in CCA-CDs. XRD spectra showed similar results, with characteristic diffraction peaks of metal oxides absent in the CDs spectra but present in the CCA wood spectrum (Figure S2). There were no obvious diffraction peaks but only some noise for the spectra of CDs (Figure S2b). Chromium and arsenic are too low to be observed. Those results indicated that chromium and arsenic were barely leached from CCA wood during the hydrothermal carbonization and thus less bound to carbon dots. On the other hand, compared with chromium and arsenic, copper ions are more easily complexed with polycarboxylic acids and thus retained on carbon dots. Four peaks presented in the C1 bands of CCA-CDs at 284.6, 286.2, 287.8, and 288.8 eV, respectively, corresponding to the functional groups of C-C, C-O, C=O, and O-C=O (Figure 1c). This confirmed the presence of hydroxyl and carboxyl functional groups, consistent with the FTIR results mentioned earlier.
The zeta potential measurement of the Cu-CDs solution revealed a value of approximately −9.61 (±0.74) mV, indicating a decrease compared to the findings reported by Zulfajri et al. This decline in zeta potential can likely be attributed to the complexation of copper ions, which leads to the consumption of carboxylic acid functional groups on the surface of carbon dots. Consistent with previous research, nitrogen doping has been observed to diminish the zeta potential of carbon dots. This effect is attributed to the substitution of carboxyl groups by the less electronegative amino groups [43].
Figure 2 illustrates the surface morphologies of pure TiO2, CCA-CDs, and CCA-CDs/TiO2 composites. Both the CCA-CDs/TiO2 composites and pure TiO2 particles exhibit similar structures characterized by regular-shaped particles. These particles display uniformity, with the size of individual TiO2 particles measuring approximately 50 nm. The SEM results did not find that carbon dots changed the microstructure of titanium dioxide. The size of CCA-CDs/TiO2 composites barely changed compared with pure TiO2. This negligible change can be attributed to the small size of CCA-CDs in the aqueous phase, measuring 2–4.5 nm in diameter, as depicted in Figure 3. The EDX result indicated that CDs were evenly dispersed in the composites. The atomic mass ratio of carbon and titanium in the composite material is approximately 3:7.
SEM analysis reveals that the CCA-CDs lose their nano state upon drying, resulting in non-uniform particle sizes. The dried nano-carbon dots are ground into powder to prepare the test samples of CCA-CDs. During the drying process, the nanodots agglomerate due to numerous functional groups on their surfaces. Dehydration of hydroxyl or carboxyl groups on the carbon dots’ surfaces leads to the forming of new ether bonds, facilitating agglomeration. This agglomeration contributes to the macroscopically amorphous characteristics of CDs, resulting in larger particle sizes than the other two materials.
Nitrogen adsorption/desorption isotherms curves of the TiO2, CCA-CDs, and CCA-CDs/TiO2 composites at 77.3 K, as well as Barrett–Joyner–Halenda (BJH) pore-size distribution curves, are shown in Figure 4. Generally, the greater the surface area of the photocatalyst is, the more active the reaction sites are. The tested samples showed type IV adsorption isotherms, suggesting that these materials are rich in slit-like pores [44]. The N2 adsorbed quantity of CCA-CDs was lower than that of TiO2 and CCA-CDs/TiO2 composites at the same relative pressure. This result indicated that CCA-CDs have the lowest surface area among the three tested samples, consistent with SEM results. The intensities of isotherm curves for all tested samples were low at low pressure, revealing that they had fewer micropores (Figure 4a) [45]. This observation was further supported by the pore-size distribution curves results, as shown in Figure 4b. The adsorption and desorption isotherms did not overlap and thus formed a hysteresis loop. The types of hysteresis loop curves of TiO2 differ from those of CDs because of their different pore size distribution. The hysteresis loop curves of CCA-CDs and CCA-CDs/TiO2 composites are very similar. The BJH pore-size distribution curves (Figure 4b) displayed that mesopores were the primary pores for TiO2. CCA-CDs and CCA-CDs/TiO2 composites mainly contained mesopores and macropores. TiO2 showed a relatively narrow distribution ranging from 5 to 25 nm, while relatively broad distributions were observed for CCA-CDs and CCA-CDs/TiO2 composites. The broad distributions can be ascribed to the agglomeration of CDs.
Table 1 shows the texture parameters obtained from the N2 adsorption isotherms. For all tested samples, TiO2 had the highest Brunauer–Emmett–Teller (BET) specific surface area of 158.25 m2/g and a total pore volume of 0.406 cm3/g. The situation was reversed for CCA-CDs. The mesoporous volume of TiO2 was also superior to the other two samples, suggesting its higher adsorption ability.

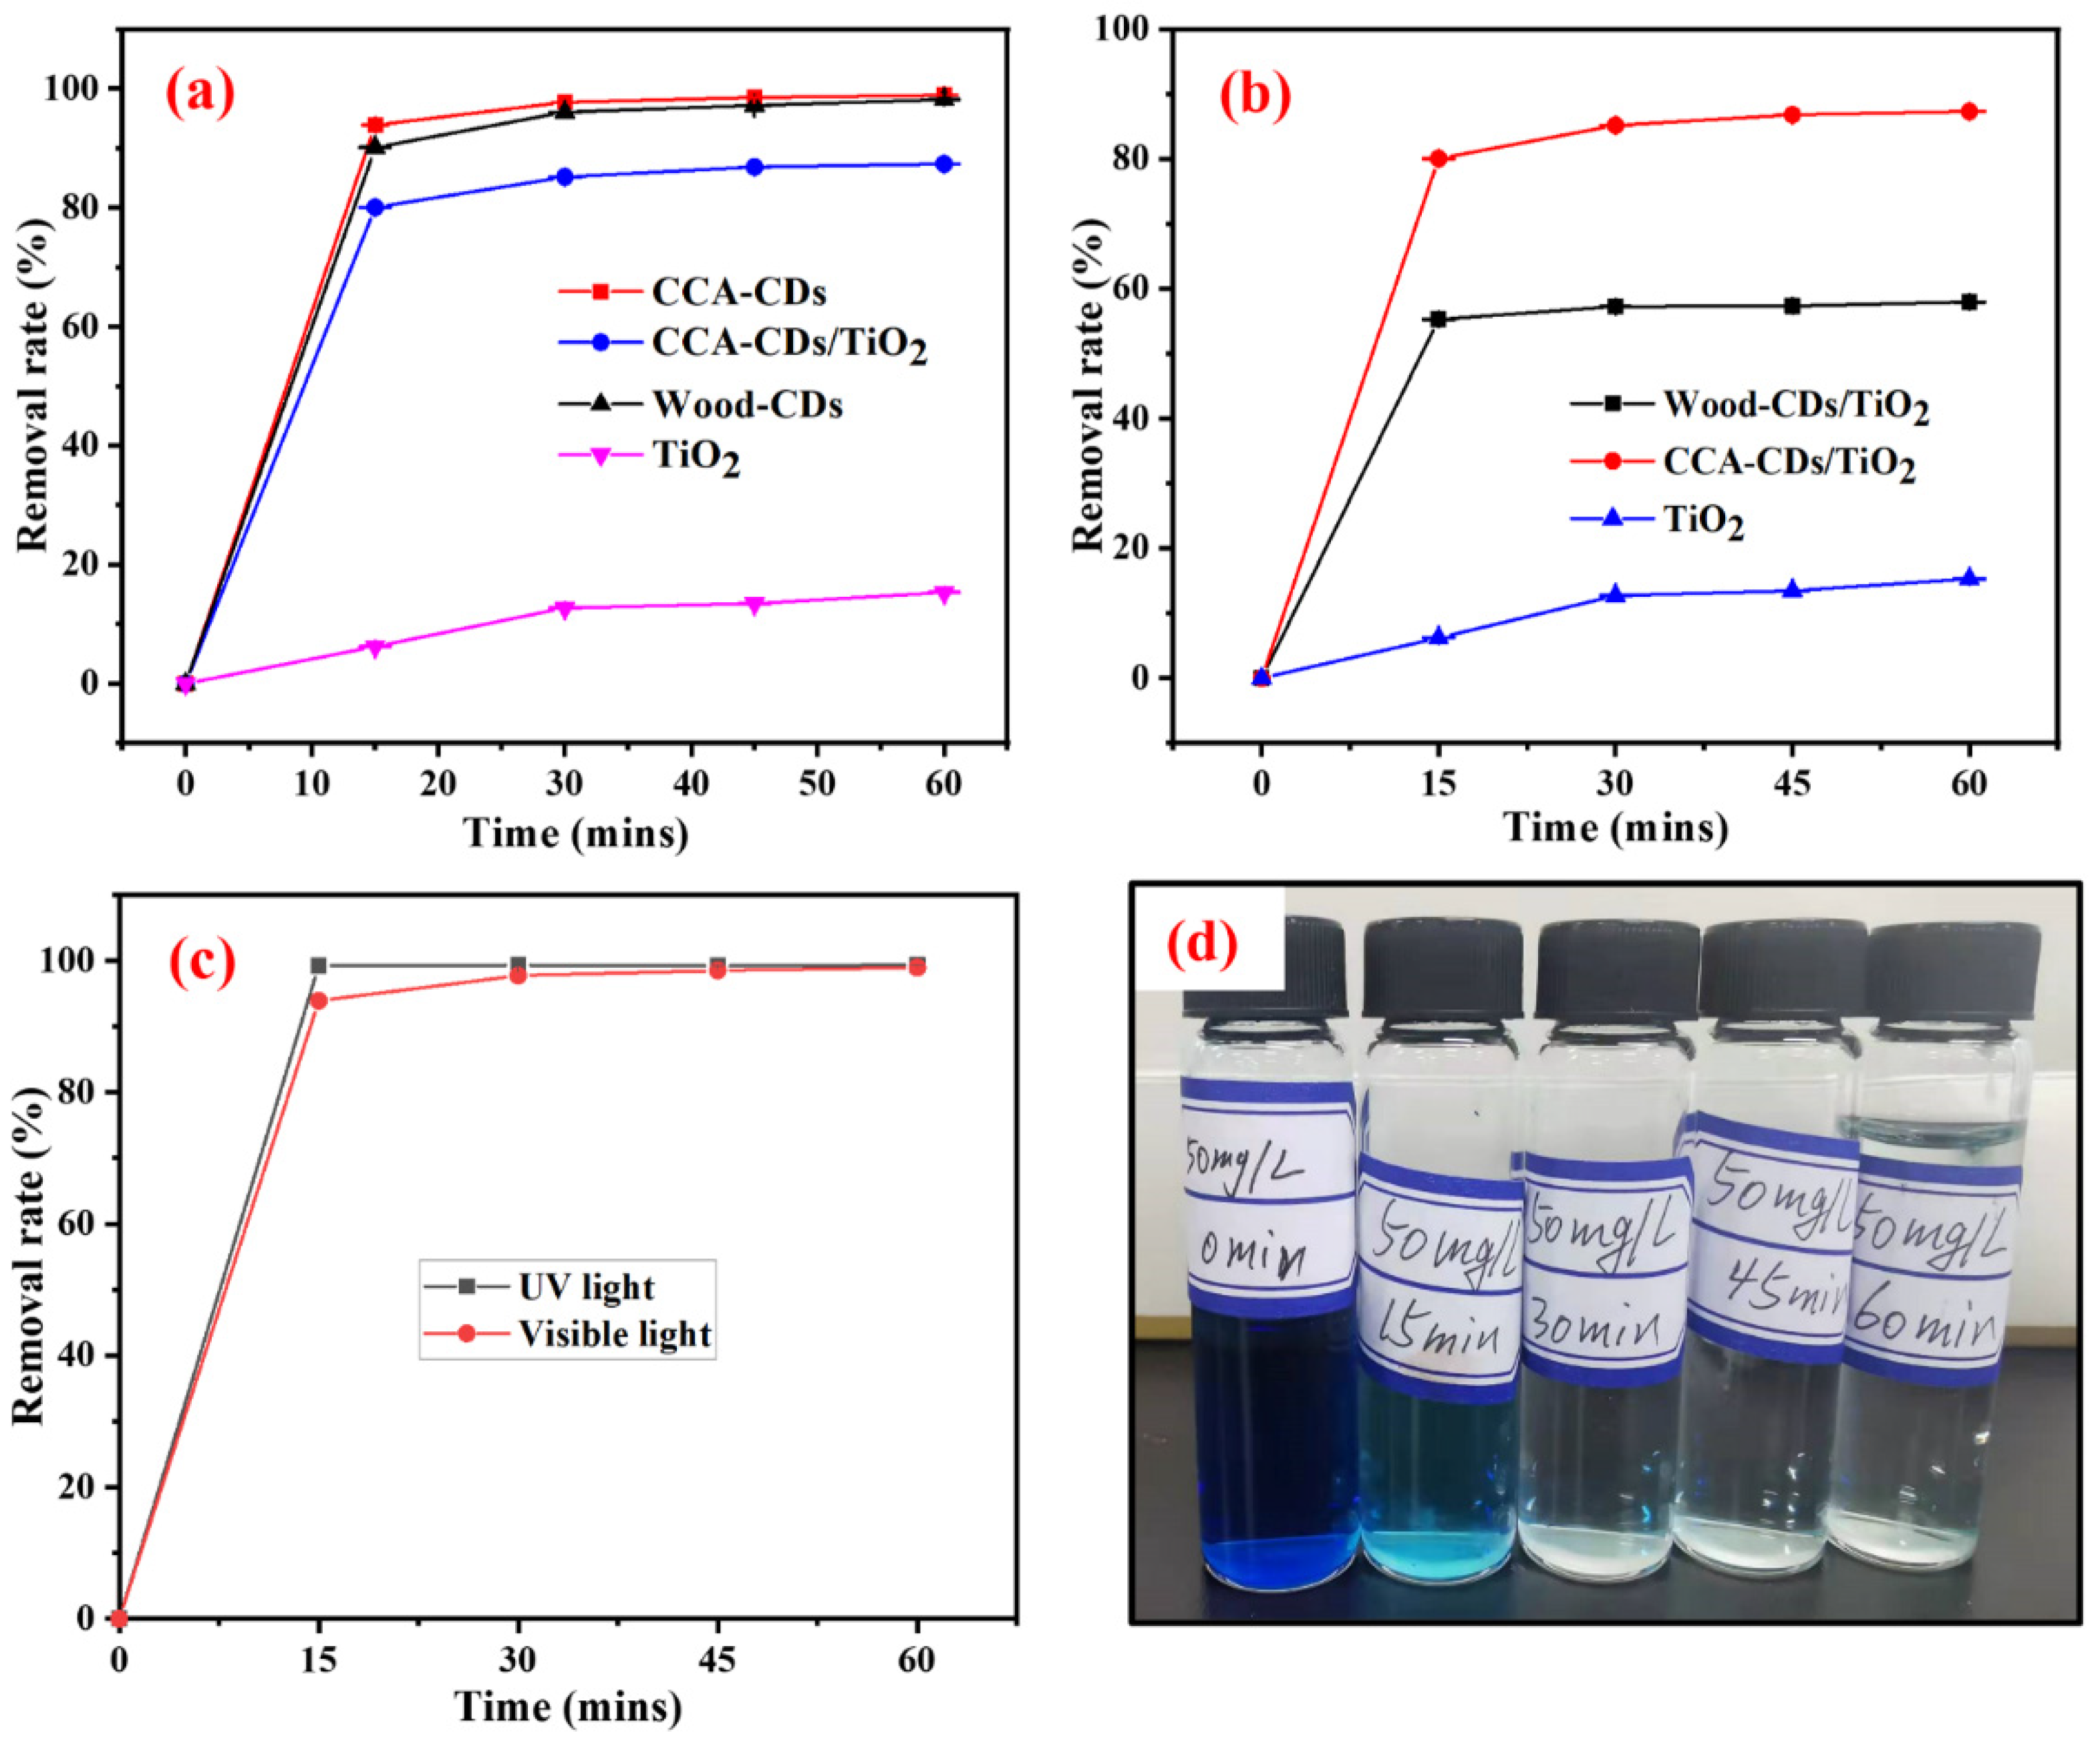
3.2. Photocatalysis Degradation of MB

3.2.1. Influence of Photocatalyst Types

The degradation efficiency of MB was affected by the types of photocatalysts (Figure 5). CCA-CDs exhibited the highest catalysis efficiencies, achieving a removal rate of 98.9% under the artificial lamp light for one hour. The degradation rate of MB treated with CCA-CDs increased by 93.4% after 15 min compared to TiO2 (Figure 5a). This result may seem contradictory to the gas adsorption experimental findings, where a larger BET-specific surface area generally leads to more efficient adsorption degradation [46]. The reason may be that carbon dots have adsorption and catalytic functions. The size and functional groups are different between MB and N2. Moreover, it is important to note the surface area of CDs in solution is higher than solid CDs. During the concentration and drying process, agglomeration will occur between carbon dots, thus destroying nanoparticles’ high surface area characteristics. Therefore, the measured specific surface area should be smaller than the true specific surface area of the carbon dots. The diameter of CCA-CDs particles in solutions is about 2.5 nm, less than that of TiO2. The density of TiO2 is greater than that of carbon dots. Under the same solid–liquid ratio, the volume fraction of pure carbon dots is larger and more uniformly dispersed. Moreover, TiO2 has a relatively narrow bandgap, which has high catalytic activity only under UV light. CDs can photocatalyst the degradation of dyes under visible light [47]. Interestingly, the degradation rate of MB by CCA-CDs/TiO2 composites was higher than by W-CDs/TiO2 composites (Figure 5b). The observation can be attributed to the presence of Cu element in CCA-CDs, which was revealed in the XPS results. CCA-CDs act as acceptors of photogenerated electrons, thus reducing the charge carrier recombination rates and promoting the charge carrier separation process [15].
As Figure 5c shows, the photocatalytic degradation rate of MB by CCA-CDs was lower under a lamp light than under 365 nm UV light within 15 min. This is mainly because the maximum absorption spectral range of CCA-CDs is in the ultraviolet region (Figure S3). Of note, the CCA-CDs solution still maintains good photoluminescence after 24 months of storage at 4 °C (Figure S4). This observation indicates the CCA-CDs have excellent stability. After 30 min, there was almost no difference in the degradation rate of BM under different light resources. Those observations indicated that photocatalytic degradation of MB using CCA-CDs occurred even under weak light (artificial visible light from bulbs) accompanied by an adsorption process.

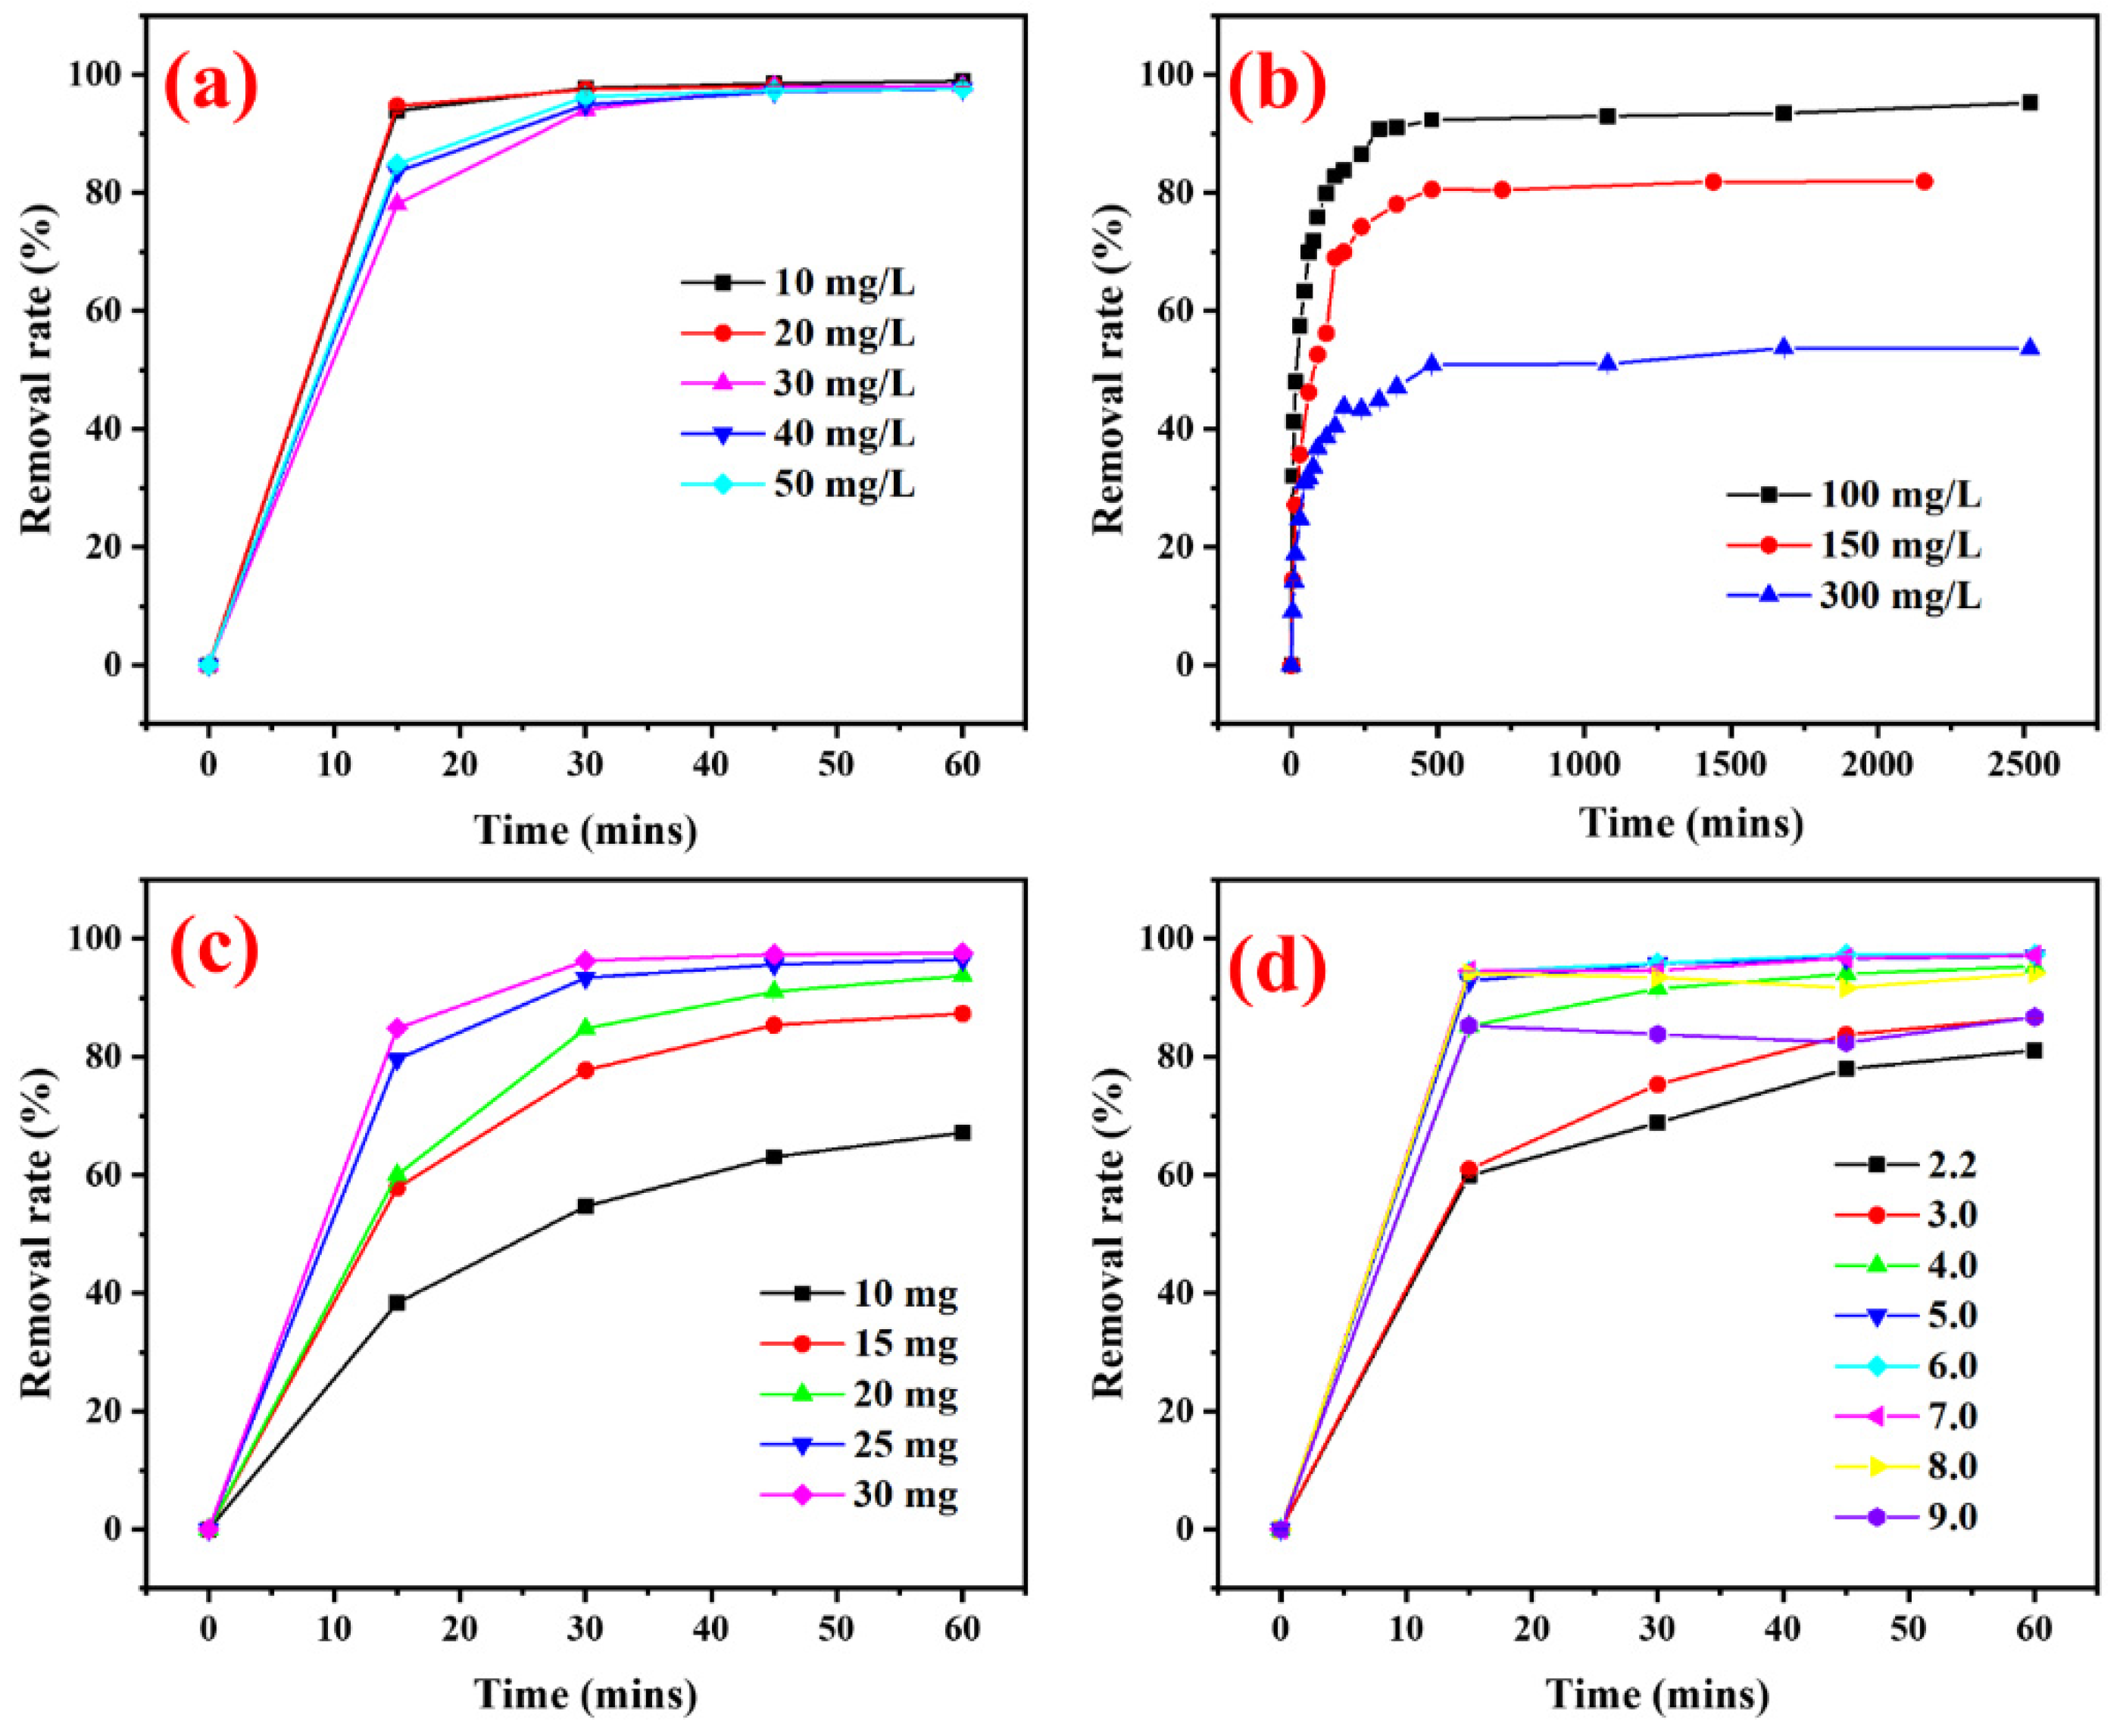
3.2.2. Influence of MB Concentrations, CCA-CDs Contents, and pH

The photocatalytic activity of CCA-CDs was investigated against MB solution under artificial visible light from a bulb, as shown in Figure 6 and Figure S5. Generally, increasing the dye concentration in solutions decreases photocatalytic efficiency. The MB concentration significantly decreased within 15 min and then gradually reached equilibrium with the degradation rate near 100% when the MB concentration was below 50 mg/L (Figure 6a). The photocatalytic activity for MB barely changed with the MB concentration increasing when the MB concentration was below 50 mg/L. The reason is that CDs with a small diameter have many active sites on their surface. Even though the MB concentration was up to 50 mg/L, there were still enough available active sites to catalyze the degradation reaction [48]. Upon further increase in MB concentrations from 100–300 mg/L, the photocatalytic efficiency decreased, consistent with a previous report [42]. The degradation was segmented into three sections as the time of the reaction continued: the dye concentrations decreased sharply in 120 min, and the degradation rate slowed down between 120 and 480 min and finally reached equilibrium (Figure 6b). The high concentration of MB prevents photons from arriving at the catalysts’ surface. The excitation of photocatalyst particles by photons diminished, reducing the generation of electron-hole pairs [44,49]. Moreover, more MB molecules will cover the surface of CDs and shield their active sites with increasing concentrations of MB [50]. Those reasons lead to the reduction of the degradation efficiency of MB.
The removal of MB in the aqueous solution increased with an increase in CCA-CDs doses (Figure 6c). After 15 min under visible light, the removal of the MB dyes was improved from 38 to 82% using 10 to 30 mg doses. A large quantity of CCA-CDs provided more reaction sites for photocatalytic degradation and adsorption of MB, resulting in a higher removal efficiency [51]. However, the rate of increase slowed when the catalyst amount exceeded 20 mg, attributed to the active sites gradually reaching saturation.
The pH of the solution plays a crucial role in affecting the photocatalytic degradation of MB dyes since pH affects the charge distribution on the CDs’ surface and the electrostatic interactions between MB and catalysts in the aqueous solution [51,52]. The influences of pH on MB degradation by CCA-CDs are depicted in Figure 6d. The removal rate of MB was observed to increase with an increase in pH from 2 to 5 and decreased beyond pH 8. The catalytic activity was enhanced because electron recombination decreased with increasing the pH value. There is a strong repulsion between the MB dye cationic and the catalyst surface covered with positive charges in a low pH solution. Zhu et al. (2019) found that the increase in the pH led to the ease of formation of •OH radicals by the following chemical reactions: CCA-CDs + →  e C B  +  h V B +  and (H2O ⇔ H+ + OH)ads h V B +  → H+ + OH [53]. At pH > 8, the photocatalyst becomes unstable due to copper ions. The CD solution prepared from CCA wood is acidic, with a pH of about 2.78 at 25 °C. When the pH of the solution is greater than 8, the free hydroxyl groups in the solution will change the surface functional groups and charges of the carbon dots, thereby reducing the adsorption capacity of the carbon dots to methylene blue. Thus, a pH from 5 to 8 was the most suitable condition for MB degradation in this study, and the lowest efficiency was obtained at a pH of 2–4. Compared with the previous report, the synthetic CCA-CDs had wide pH adaptability [42]. A conclusion could be drawn that high degradation efficiency was observed when the target dye was effectively adsorbed on the surface of the photocatalyst, which was consistent with previous reports [49].

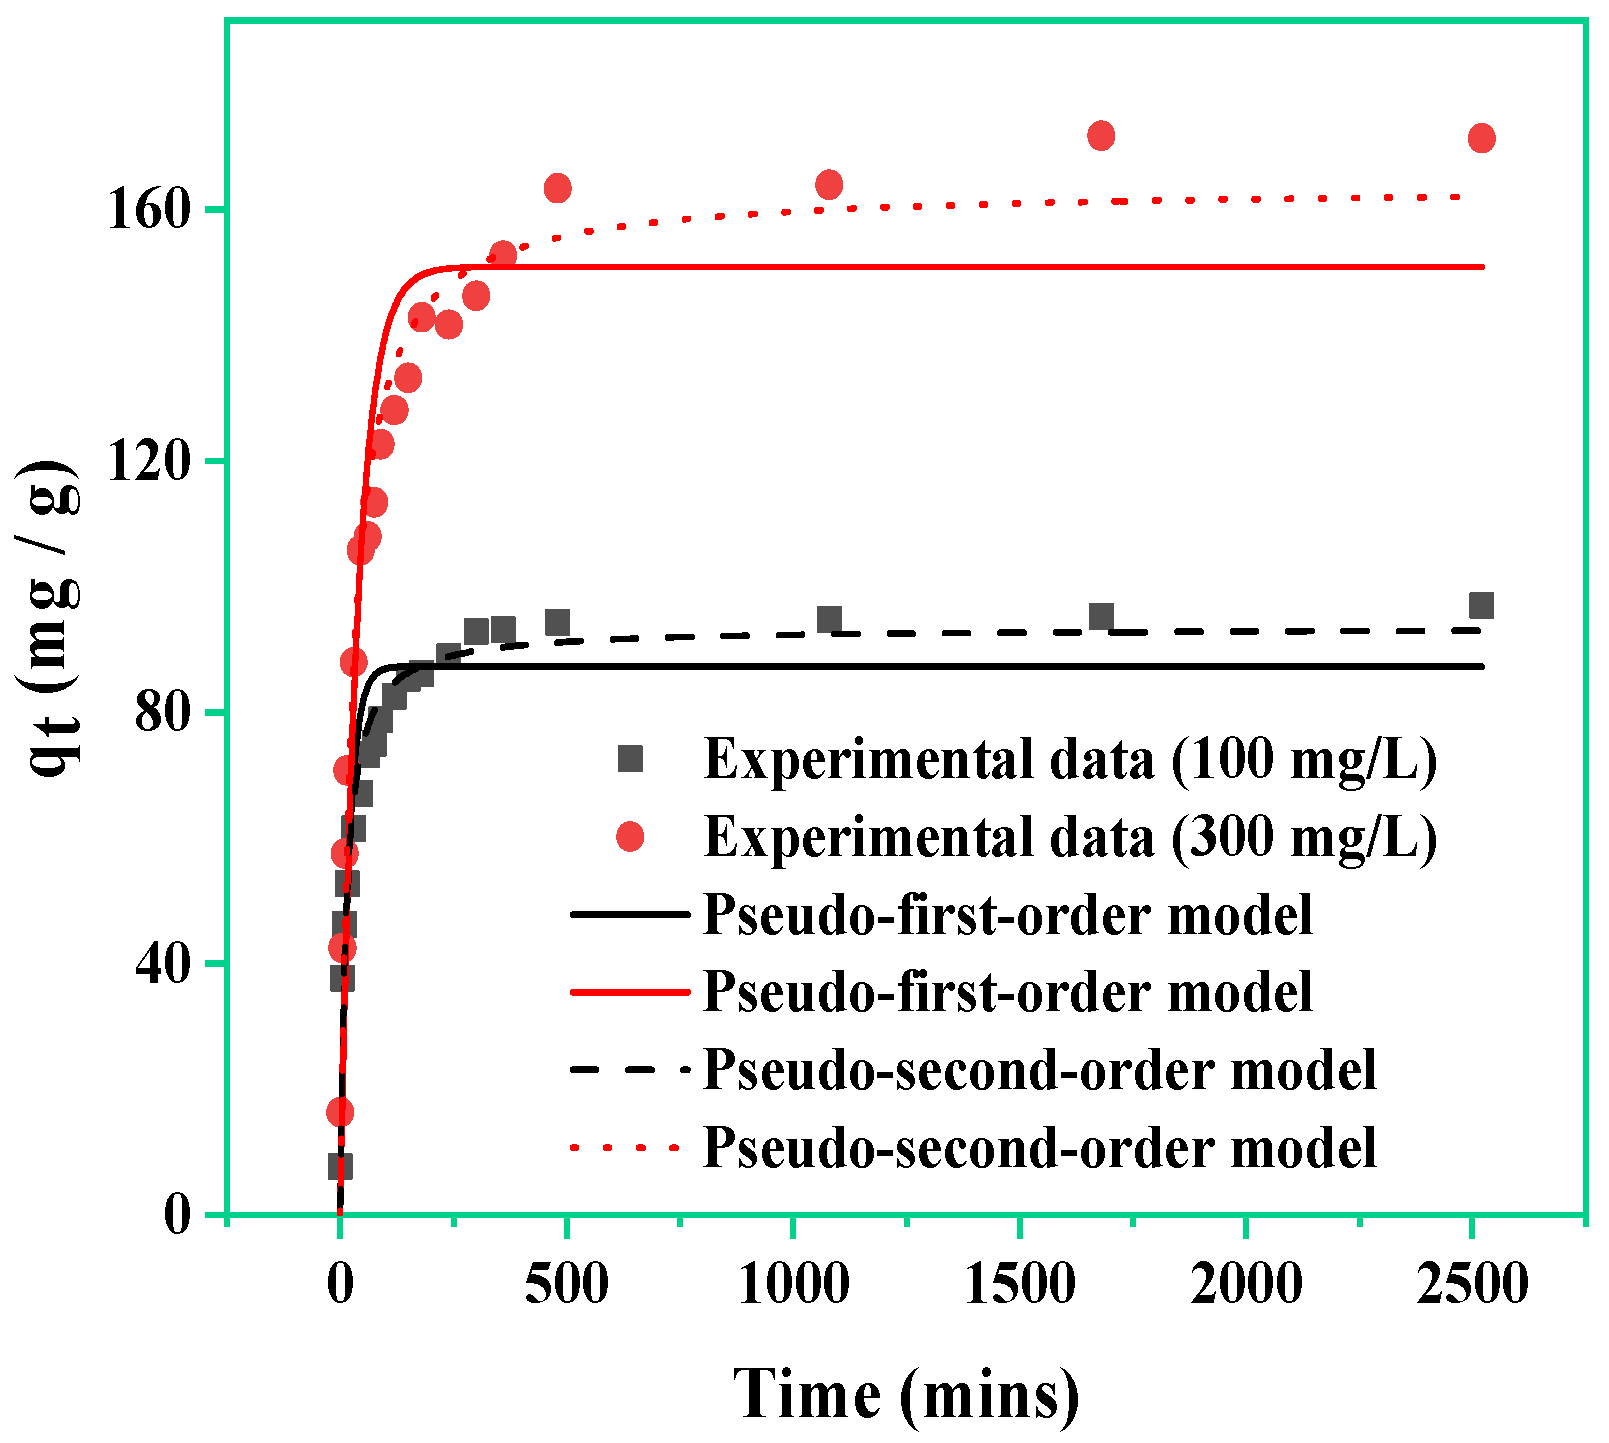
3.3. Kinetic Studies

The kinetic study is essential for understanding the photocatalytic reaction pathways in the treatment process of the aqueous solution. This study employed two models to investigate the mechanism of the reaction process and characterize the rate constants, namely the pseudo-first-order and pseudo-second-order equations, for the degradation of MB by CCA-CDs, as follows:
The pseudo-first-order equation [54] is expressed as follows:
q t = q e ( 1 e k 1 t )
where  q t  and  q e  present the amounts of MB adsorbed at time t and equilibrium, respectively. The parameter  k 1  denotes the rate constant for the pseudo-first-order.
The pseudo-second-order equation [55,56] is expressed as follows:
q t = q e 2 k 2 t / ( 1 + q e k 2 t )
The  k 2  denotes the rate constant in the pseudo-second-order equation.
Kinetic models and parameters for photocatalytic degradation of MB by CCA-CDs are indicated in Figure 7 and Table 2. For a 100 mg/L MB solution, the R2 value for the pseudo-first-order model was 0.870, while the R2 value for the pseudo-second-order model was 0.963. Similar results were observed when the MB concentration was 300 mg/L. The Lagrangian first-order rate equation assumes that the rate at which adsorbate occupies adsorption sites is proportional to the number of unoccupied sites. The second-order kinetic model is based on the following assumption: the adsorption of adsorbate on the adsorbent is chemical adsorption. This process is also commonly used to predict overall adsorption behavior [42]. The pseudo-second-order model was deemed more appropriate for describing the removal of MB dye in this study, and the adsorption process is chemical adsorption. This also showed that carbon dots had a photocatalytic effect. The calculated qe,cal values aligned well with the experimental data (qe,exp) in the case of the pseudo-second-order kinetic model. Table 2 demonstrates a regular effect of initial MB concentration on the rate constants (k1 and k2) was regular, where both k1 and k2 decreased with increasing MB concentration. This finding was consistent with a previous report [57]. When the dye concentration increases, the chromaticity of the solution increases, which affects the transmittance of ultraviolet light, thereby reducing the reaction rate of the photocatalytic degradation of the dye. This suggested that reactant concentration was one of the rate-limiting factors in the degradation process of MB.

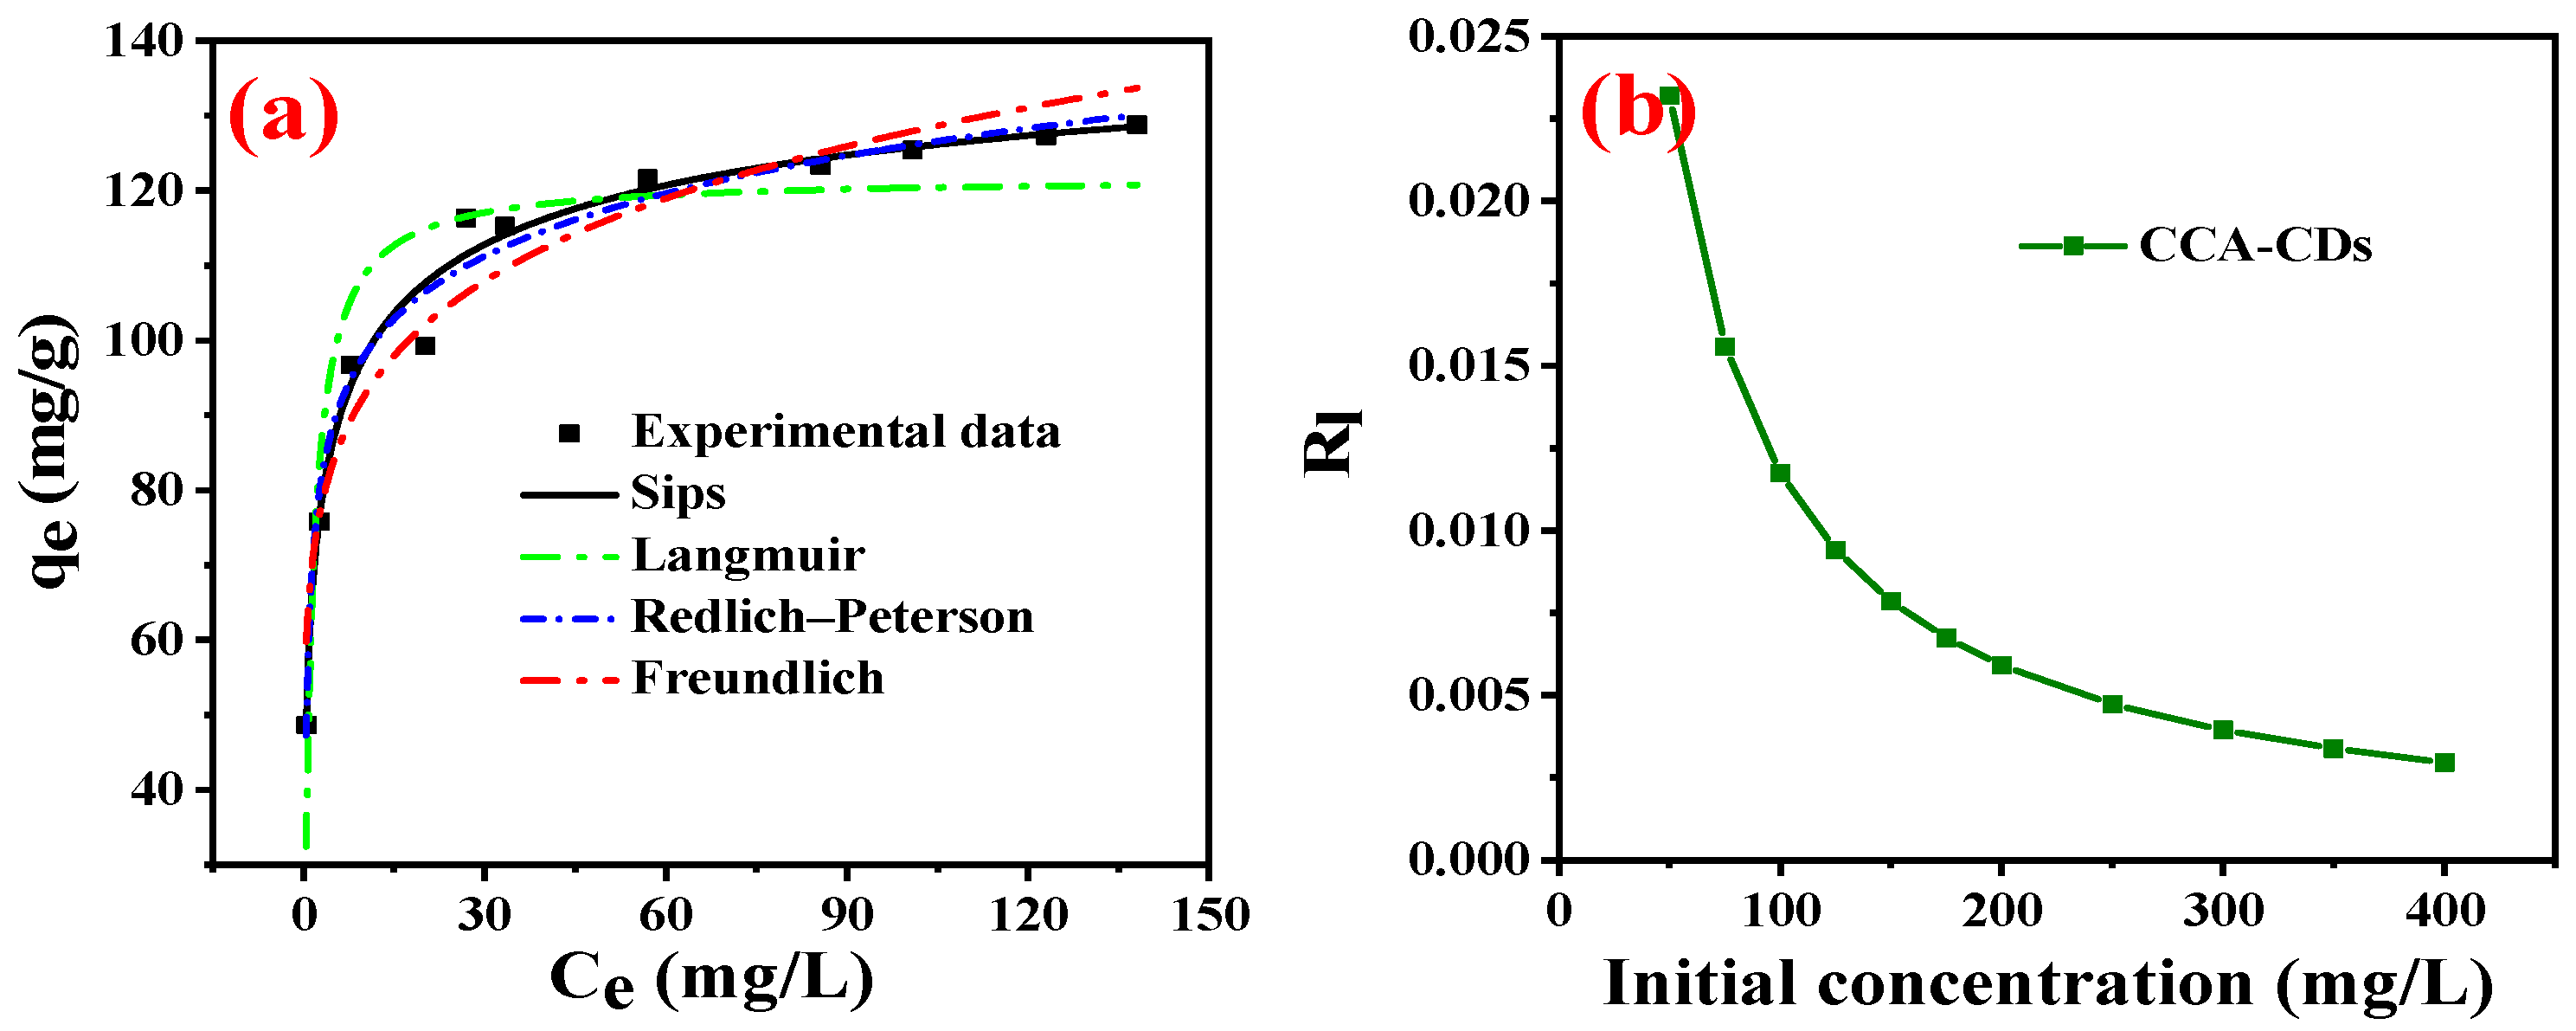
3.4. Isotherm Studies

Isotherm studies express the relationship between the amount of MB adsorbed per gram of adsorbent and the equilibrium concentration of adsorbates. This investigation employed diverse nonlinear isotherm models—Langmuir, Freundlich, Redlich–Peterson, and Sips—to fit the reaction process, with the respective equations detailed below:
(a) Langmuir model [58]:
q e = q m a x K L C e / ( 1 + K L C e )
The  C e  is MB concentration at equilibrium (mg/L),  q e  signifies the quantity of MB adsorbed per unit mass of adsorbent under equilibrium state (mg/g),  K L  stands for the Langmuir isotherm constant (L/mg),  q m a x  is the maximum adsorption capacity (mg/g).
The fundamental feature of the Langmuir isotherm is conveyed through a dimensionless equilibrium constant (Rl). The equation [51] is expressed as follows:
R l = 1 / ( 1 + K l C i )
where Ci represents the initial MB concentration.
(b) Freundlich model [59]:
q e = K f C e 1 / n
where  K f  is a Freundlich constant, reflecting the relative adsorption capacity (mg/g), and n is the reciprocal of the adsorption intensity constant,  C e  and  q e  are the same as mentioned above.
(c) Redlich–Peterson [60] model:
q e = K r C e / ( 1 + a r C e β )
where Kr and β are constants in the Redlich–Peterson model; when β = 1, the equation can be transformed into the Langmuir isotherm, and when  a r C e β  is much greater than 1, the model becomes the Freundlich isotherm. The ratio of Kr/ar represents the adsorption capacity of the reactants to the substrate.
(d) The nonlinear Sips model [61]:
q e = q s K s C e n s / ( 1 + K s C e n s )
where  K s  is the equilibrium constant. If  n s  = 1, this equation will become a Langmuir isotherm. Likewise, it reduces to the Freundlich equation when  C e  or  K s  approaches 0.
The experimental data of MB degradation by CCA-CDs were fitted using the above four models (Figure 8), and the isotherm parameters of different models were listed in Table 3. Notably, the results indicated a superior fit of the Redlich–Peterson and Sips models compared to the Langmuir and Freundlich models. Specifically, the correlation coefficients (R2) for the Sips and Redlich–Peterson isotherms were 0.983 and 0.980, respectively, surpassing those of the Langmuir and Freundlich isotherms. Previous literature shows that the Langmuir and Freundlich equations reflected monolayer and multilayer surface characteristics of absorbents, respectively [61]. The results showed that the adsorption of MB on CDs is heterogeneous multilayer adsorption because CCA-CDs are capable of adsorbing MB and have a photocatalytic effect. The maximum degradation capacity of CCA-CDs was 151.07 mg/g obtained from the Sips model and demonstrated that the performance of CCA-CDs was considerably effective for MB removal.

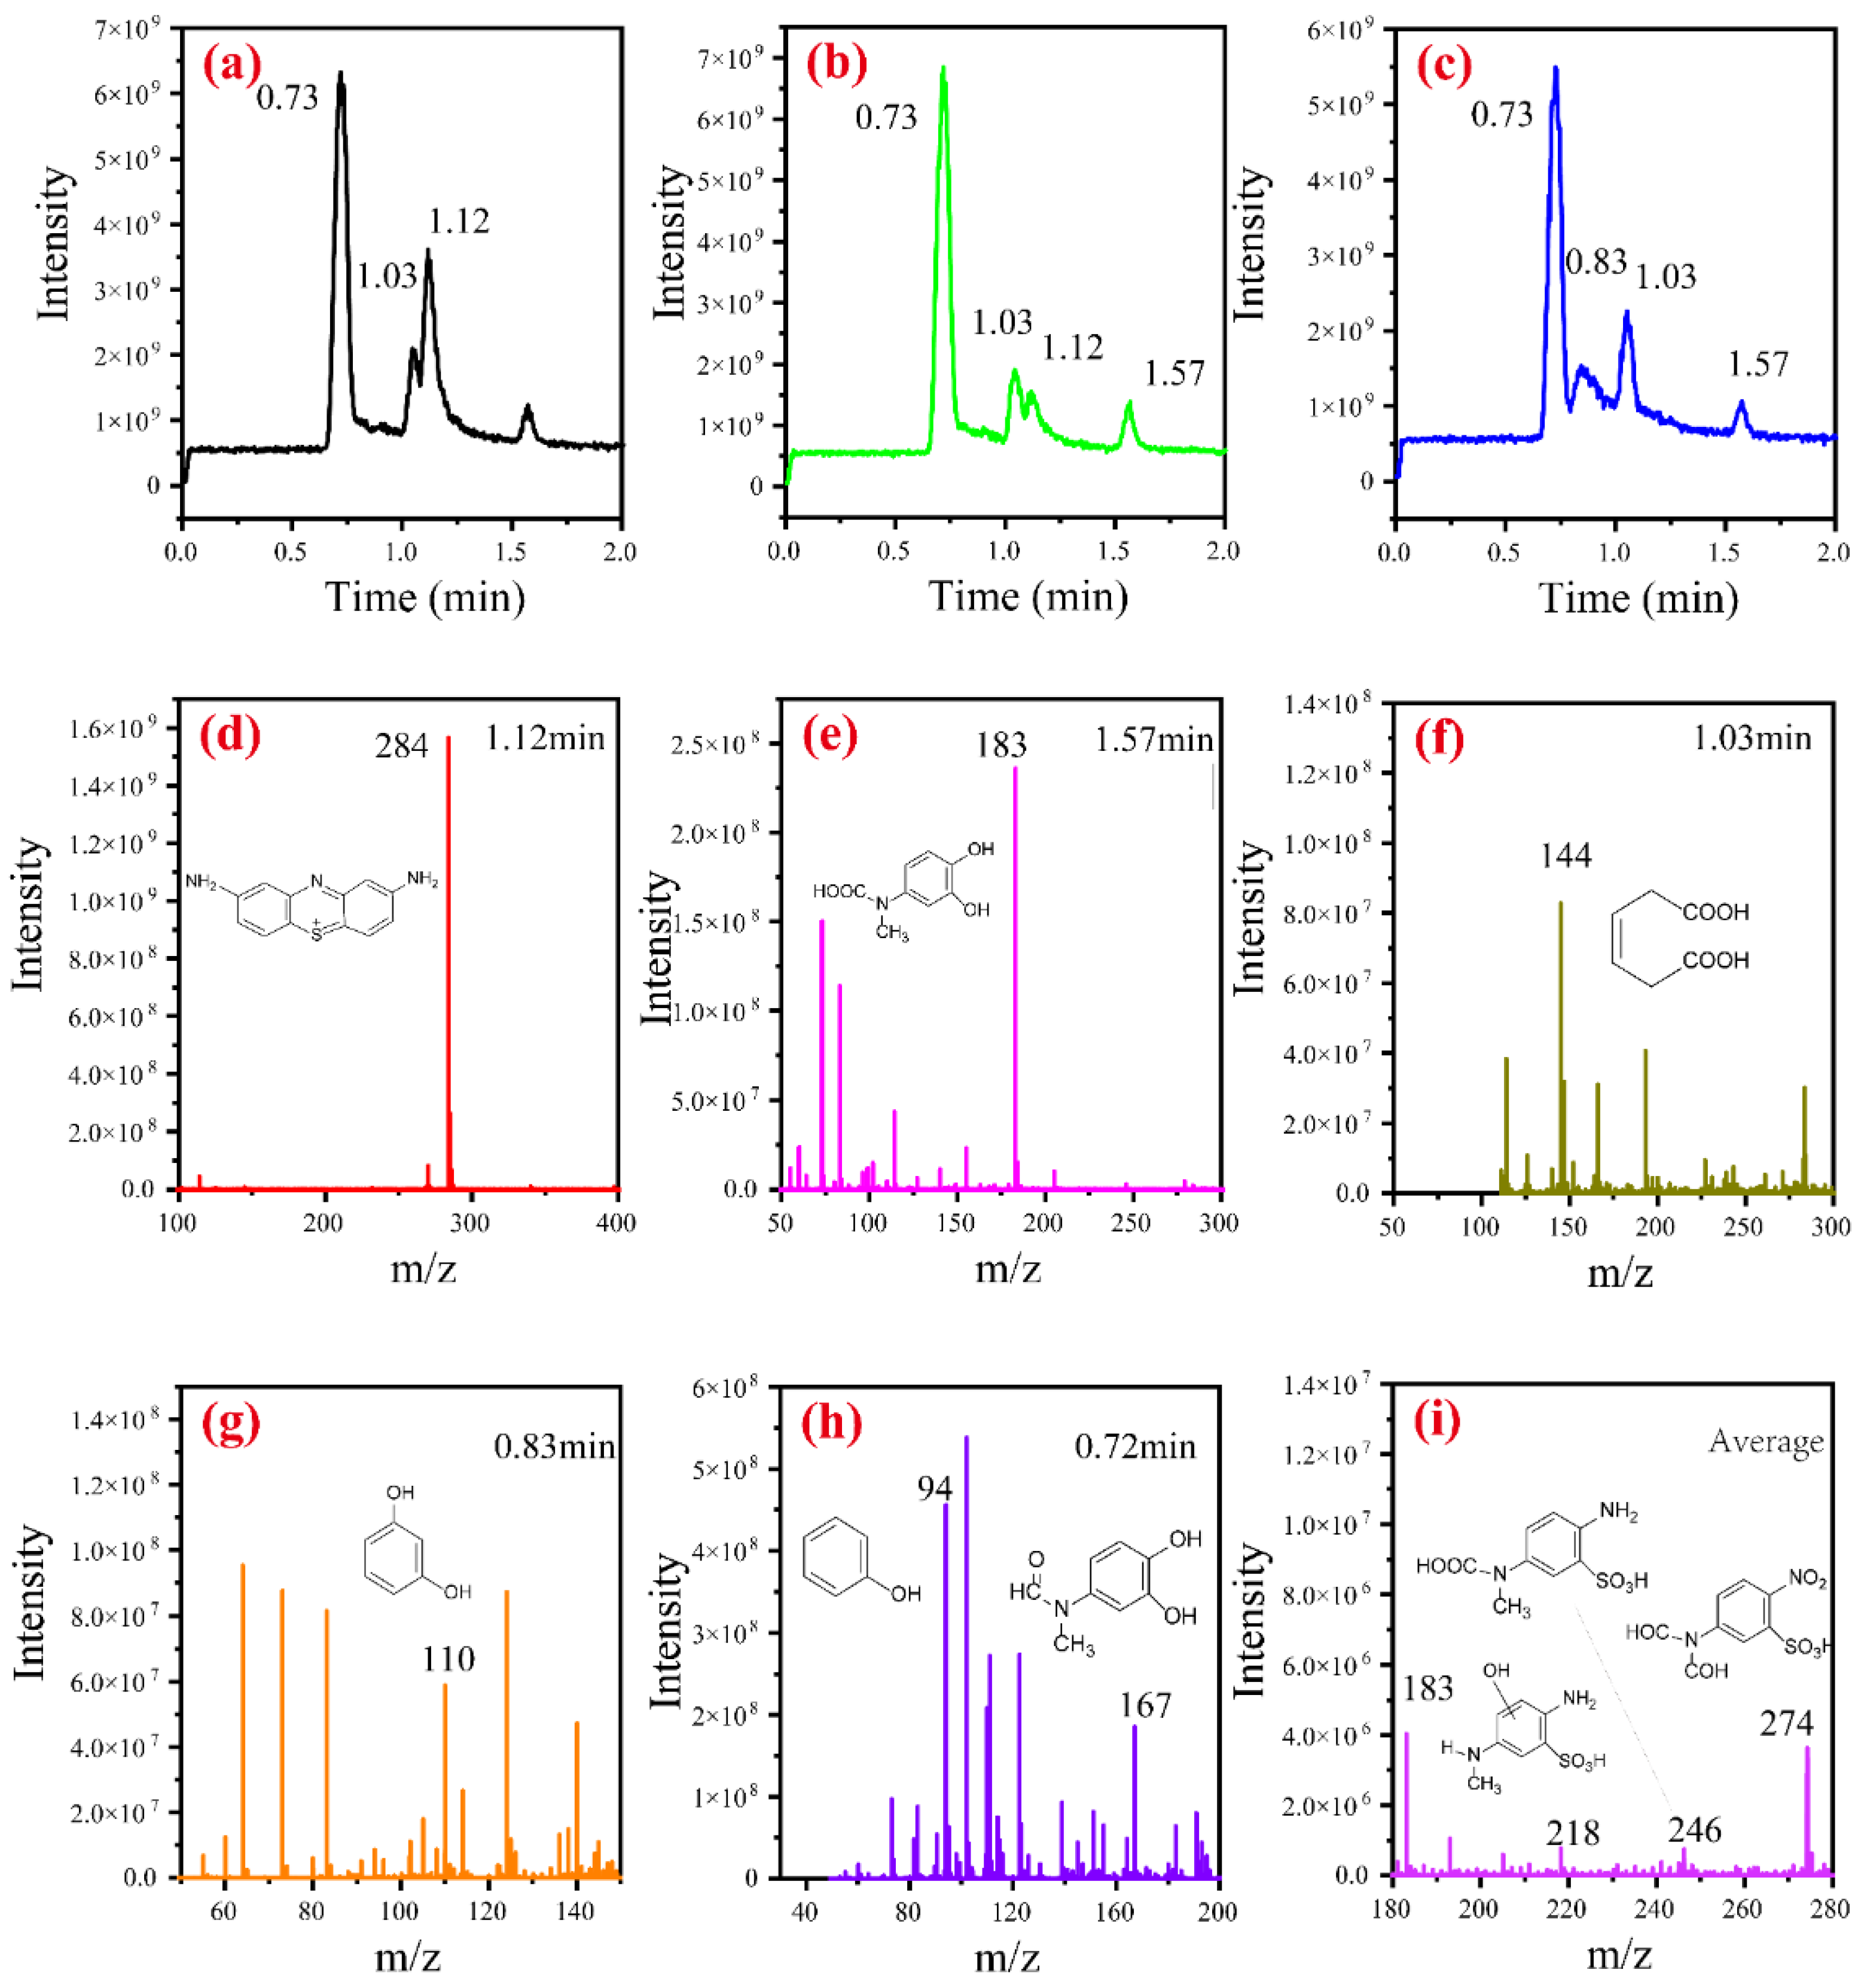
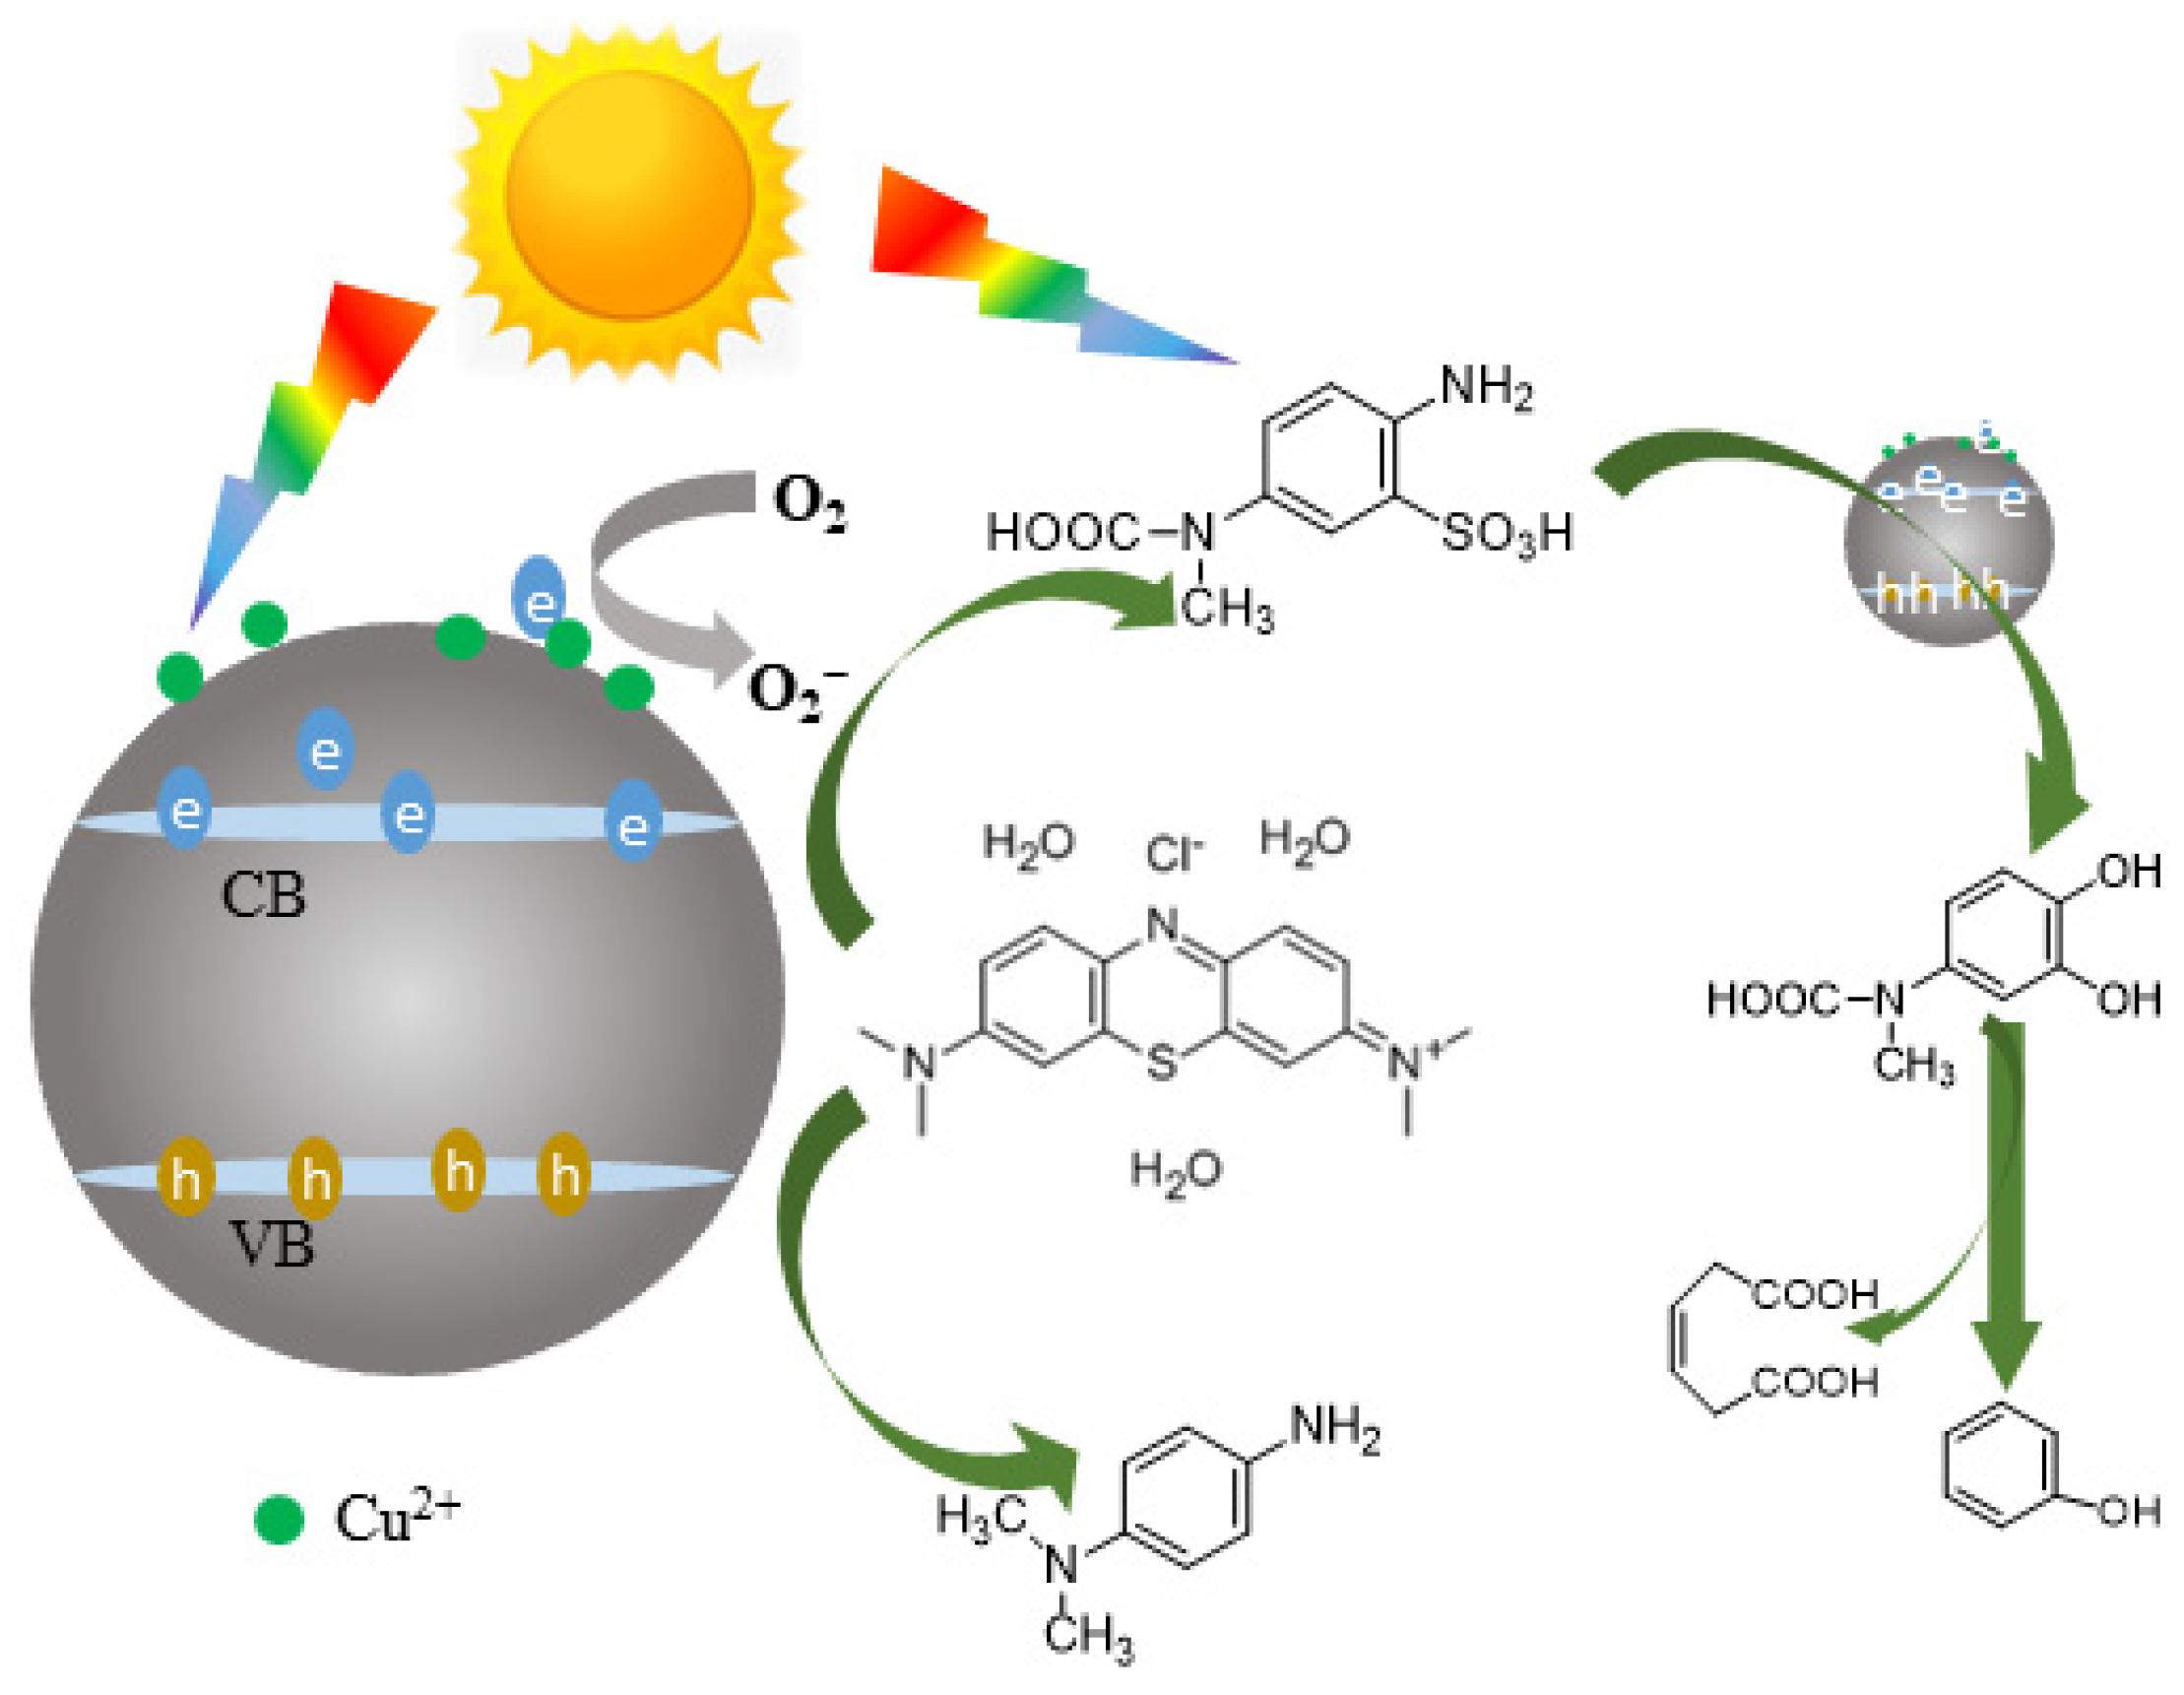
3.5. Mechanism of MB Dye Photodegradation

CCA-CDs as nanoparticles exhibited great adsorption abilities for MB dyes due to their large surface area, facilitating the photodegradation of MB dyes. To further reveal the degradation chemical pathway of MB by CCA-CDs, the degradation products of MB solution of 50 mg/L were investigated by LC-MS analysis. The chromatogram and mass spectra for MB in aqueous after photocatalytic degradation for 15, 30, and 60 min are shown in Figure 9. The intensity of MB peak at the retention time of 1.12 min with m/z 284 [55] decreased with the increase in treatment time. Further, this peak completely disappeared after photocatalytic degradation for 60 min. This result indicated MB had been completely degraded after 60 min. The peak load at 1.03 min was ascribed to 3-Hexenedioic acid. Of note, the intensity of the peak located at the retention time of 0.83 min increased with the treatment time increasing. This showed that the catechol concentration in the aqueous solution increased during treatment. Those observations indicated that the water-soluble degradation products of MB are mainly phenolic and carboxylic acid compounds.
Various studies have demonstrated that CDs or CDs/semiconductor composites absorb photonics, resulting in the generation of photogenerated electrons and holes [62,63]. CDs act as photogenerated electronic transfers for CD composites, reducing the charge carrier recombination rates. Conversely, they absorb the radiation in the visible region, generating electrons and holes. In this study, CCA-CDs successfully generated electron-hole pairs under artificial visible light, driving redox reactions (Figure 10), which agrees with a previous study [31]. Hydroxide ions are oxidized to hydroxyl radicals by the photogenerated hole in the valence band. The superoxide radical anions are generated by donating electrons in the conductance band to oxygen [55]. The presence of •OH radicals has been proved by adding scavengers [42]. In contrast to earlier investigations, introducing copper doping imparts electron acceptor properties to CCA-CDs, enhancing their photocatalytic efficiency.

4. Conclusions

This study investigated the photocatalytic degradation activity of CCA-CDs for methylene blue dye pollutants under artificial visible light from a bulb. CCA-CDs were synthesized directly from CCA-wood waste using an easy hydrothermal carbonation method. CCA-CDs/TiO2 composites were also synthesized and used to catalyze the degradation of MB as the control group. The obtained CD-photocatalysts had the advantages of a broad absorption spectrum range, high catalytic efficiency at room temperature, and high stability. The photocatalytic degradation efficiency of TiO2 for MB is very low under visible light, while CCA-CDs is the opposite. The removal rate of MB catalyzed by CCA-CDs was 93.6% under the artificial visible light from the bulb for 15 min. The maximum degradation capacity of Cu-CDs was 151.07 mg/g obtained from the Sips model. Moreover, CCA-CDs had a wide pH adaptability for the photocatalysis degradation of MB. The pseudo-second-order kinetics fit the experimental data well with a rate constant of 0.00087 for an MB solution of 100 mg/L. Mass spectrometry showed that MB was photocatalytic and degraded by CDs into small molecular compounds, mainly phenols and carboxylic acid. The CCA-CDs solution maintains good photoluminescence after 24 months of storage at 4 °C. This study demonstrated that CDs derived from wood waste are promising photocatalysts for dye degradation from aqueous solutions. However, the reusability of carbon dots as catalysts remains to be further studied. Future research will focus more on the changes in carbon dots’ physical and chemical properties after catalytic degradation.

Supplementary Materials

The following supporting information can be downloaded at https://www.mdpi.com/article/10.3390/f15040680/s1, Figure S1: Digital photo of waste chromate-copper-arsenate wood particles; Figure S2: XRD of (a) CCA-treated wood and (b) the obtained CDs; Figure S3: UV absorption spectra of CCA-CDs and W-CDs, fluorescence images of CCA-CDs in normal light and at 365 nm UV light; Figure S4: Digital photograph of photoluminescence of copper-doped carbon dot solution (stored at 4 °C for 24 months); Figure S5: Absorption spectra of MB treated by CCA-CDs under various experimental conditions: the MB concentrations of 50 mg/L (a) and 100 mg/L (b), the CCA-CDs contents of 10 mg with an MB concentration of 50 mg/L (c), and the pH of 3.0 (d) with the solid to liquid ratio of 1:1. Figure S6: The calibration curve of MB.

Author Contributions

D.X.: conceptualization, methodology, original draft preparation, software; J.Z. and Y.T.: data curation, visualization, reviewing and editing; H.B.: reviewing and editing, funding acquisition; S.M.: supervision, validation, reviewing and editing; P.L.: reviewing and editing, A.K. supervision, validation, reviewing and editing, resources, funding acquisition. All authors have read and agreed to the published version of the manuscript.

Funding

This work was financially supported by the Canada Research Chair Program (694272), Quebec Research and Innovation Consortium for Industrial Bioprocess (CRIBIQ): 2016-039-C21, Mitacs (IT11796), the National Natural Science Foundation of China (32301536), Natural Science Foundation of Shandong Province (ZR2022QC101), basic research project of science, education and production integration pilot project of Qilu University of Technology (2023PX051) and Talent research program of Qilu university of technology (2023RCKY206).

Data Availability Statement

Data will be made available on request.

Acknowledgments

The authors thank the Industrial Waste Technology Centre for technical and logistic support.

Conflicts of Interest

The authors declare that we have no known competing financial interests or personal relationships that could have appeared to influence the work reported in this paper.

References

  1. Chiam, S.-L.; Pung, S.-Y.; Yeoh, F.-Y. Recent developments in MnO2-based photocatalysts for organic dye removal: A review. Environ. Sci. Pollut. Res. 2020, 27, 5759–5778. [Google Scholar] [CrossRef] [PubMed]
  2. Gomaa, H.; Emran, M.Y.; El-Gammal, M.A. Biodegradation of azo dye pollutants using microorganisms. In Handbook of Biodegradable Materials; Springer: Cham, Switzerland, 2023; pp. 781–809. [Google Scholar]
  3. Zhang, X.; Li, Y.; Li, M.; Zheng, H.; Du, Q.; Li, H.; Wang, Y.; Wang, D.; Wang, C.; Sui, K.; et al. Removal of methylene blue from aqueous solution using high performance calcium alginate/activated carbon membrane. Int. J. Cloth. Sci. Technol. 2020, 32, 307–321. [Google Scholar] [CrossRef]
  4. Krishna Moorthy, A.; Govindarajan Rathi, B.; Shukla, S.P.; Kumar, K.; Shree Bharti, V. Acute toxicity of textile dye Methylene blue on growth and metabolism of selected freshwater microalgae. Environ. Toxicol. Pharmacol. 2021, 82, 103552. [Google Scholar] [CrossRef]
  5. Mills, A.; Grosshans, P.; Hazafy, D. A novel reversible relative-humidity indicator ink based on methylene blue and urea. Analyst 2010, 135, 33–35. [Google Scholar] [CrossRef]
  6. Nyankson, E.; Kumar, R.V. Removal of water-soluble dyes and pharmaceutical wastes by combining the photocatalytic properties of Ag3PO4 with the adsorption properties of halloysite nanotubes. Mater. Today Adv. 2019, 4, 100025. [Google Scholar] [CrossRef]
  7. Oladoye, P.O.; Ajiboye, T.O.; Omotola, E.O.; Oyewola, O.J. Methylene blue dye: Toxicity and potential elimination technology from wastewater. Results Eng. 2022, 16, 100678. [Google Scholar] [CrossRef]
  8. Khan, I.; Saeed, K.; Zekker, I.; Zhang, B.; Hendi, A.H.; Ahmad, A.; Ahmad, S.; Zada, N.; Ahmad, H.; Shah, L.A. Review on methylene blue: Its properties, uses, toxicity and photodegradation. Water 2022, 14, 242. [Google Scholar] [CrossRef]
  9. Jothi, V.K.; Ganesan, K.; Natarajan, A.; Rajaram, A. Green Synthesis of Self-Passivated Fluorescent Carbon Dots Derived from Rice Bran for Degradation of Methylene Blue and Fluorescent Ink Applications. J. Fluoresc. 2021, 31, 427–436. [Google Scholar] [CrossRef] [PubMed]
  10. Bazan-Wozniak, A.; Pietrzak, R. Adsorption of organic and inorganic pollutants on activated bio-carbons prepared by chemical activation of residues of supercritical extraction of raw plants. Chem. Eng. J. 2020, 393, 124785. [Google Scholar] [CrossRef]
  11. Waghchaure, R.H.; Adole, V.A.; Jagdale, B.S. Photocatalytic degradation of methylene blue, rhodamine B, methyl orange and Eriochrome black T dyes by modified ZnO nanocatalysts: A concise review. Inorg. Chem. Commun. 2022, 143, 109764. [Google Scholar] [CrossRef]
  12. Jiang, J.; Xie, N.; Jiang, Y.; Han, J.; Feng, G.; Shi, Z.; He, C. Rapid photodegradation of methylene blue by laser-induced plasma. RSC Adv. 2022, 12, 21056–21065. [Google Scholar] [CrossRef]
  13. Juang, R.S.; Ju, Y.C.; Liao, C.S.; Lin, K.S.; Lu, H.C.; Wang, S.F.; Sun, A.C. Synthesis of Carbon Dots on Fe3O4 Nanoparticles as Recyclable Visible-Light Photocatalysts. IEEE Trans. Magn. 2017, 53, 5200404. [Google Scholar] [CrossRef]
  14. Singh, P.; Mohan, B.; Madaan, V.; Ranga, R.; Kumari, P.; Kumar, S.; Bhankar, V.; Kumar, P.; Kumar, K. Nanomaterials photocatalytic activities for waste water treatment: A review. Environ. Sci. Pollut. Res. 2022, 29, 69294–69326. [Google Scholar] [CrossRef] [PubMed]
  15. Akbar, K.; Moretti, E.; Vomiero, A. Carbon dots for photocatalytic degradation of aqueous pollutants: Recent advancements. Adv. Opt. Mater. 2021, 9, 2100532. [Google Scholar] [CrossRef]
  16. Xu, X.; Ray, R.; Gu, Y.; Ploehn, H.J.; Gearheart, L.; Raker, K.; Scrivens, W.A. Electrophoretic analysis and purification of fluorescent single-walled carbon nanotube fragments. J. Am. Chem. Soc. 2004, 126, 12736–12737. [Google Scholar] [CrossRef]
  17. Hebbar, A.; Selvaraj, R.; Vinayagam, R.; Varadavenkatesan, T.; Kumar, P.S.; Duc, P.A.; Rangasamy, G. A critical review on the environmental applications of carbon dots. Chemosphere 2023, 313, 137308. [Google Scholar] [CrossRef]
  18. Song, Z.; Shang, Y.; Lou, Q.; Zhu, J.; Hu, J.; Xu, W.; Li, C.; Chen, X.; Liu, K.; Shan, C.X. A molecular engineering strategy for achieving blue phosphorescent carbon dots with outstanding efficiency above 50%. Adv. Mater. 2023, 35, 2207970. [Google Scholar] [CrossRef]
  19. Wareing, T.C.; Gentile, P.; Phan, A.N. Biomass-based carbon dots: Current development and future perspectives. ACS Nano 2021, 15, 15471–15501. [Google Scholar] [CrossRef] [PubMed]
  20. Rani, N.; Singh, P.; Kumar, S.; Kumar, P.; Bhankar, V.; Kumar, K. Plant-mediated synthesis of nanoparticles and their applications: A review. Mater. Res. Bull. 2023, 163, 112233. [Google Scholar] [CrossRef]
  21. Chen, R.; Wang, Z.; Pang, T.; Teng, Q.; Li, C.; Jiang, N.; Zheng, S.; Zhang, R.; Zheng, Y.; Chen, D. Ultra-Narrow-Bandwidth Deep-Red Electroluminescence Based on Green Plant-Derived Carbon Dots. Adv. Mater. 2023, 35, 2302275. [Google Scholar] [CrossRef]
  22. Kaur, I.; Batra, V.; Bogireddy, N.K.R.; Landa, S.D.T.; Agarwal, V. Detection of organic pollutants, food additives and antibiotics using sustainable carbon dots. Food Chem. 2023, 406, 135029. [Google Scholar] [CrossRef] [PubMed]
  23. Deng, X.; Zhang, M.; Wang, Y.; Li, C.; Zhang, X.; Weng, S.; Li, Y. Carbon dots with selective fluorescence response to hydroxyl radical for sensitive detection of bleomycin. Spectrochim. Acta Part A Mol. Biomol. Spectrosc. 2024, 306, 123582. [Google Scholar] [CrossRef] [PubMed]
  24. He, Z.; Sun, Y.; Zhang, C.; Zhang, J.; Liu, S.; Zhang, K.; Lan, M. Recent advances of solvent-engineered carbon dots: A review. Carbon 2023, 204, 76–93. [Google Scholar] [CrossRef]
  25. Abbasi, A.; Abushad, M.; Khan, A.; Bhat, Z.U.H.; Hanif, S.; Shakir, M. Bare undoped nontoxic carbon dots as a visible light photocatalyst for the degradation of methylene blue and congo red. Carbon Trends 2023, 10, 100238. [Google Scholar] [CrossRef]
  26. Li, H.; He, X.; Kang, Z.; Huang, H.; Liu, Y.; Liu, J.; Lian, S.; Tsang, C.H.A.; Yang, X.; Lee, S.T. Water-soluble fluorescent carbon quantum dots and photocatalyst design. Angew. Chem. Int. Ed. 2010, 49, 4430–4434. [Google Scholar] [CrossRef] [PubMed]
  27. Ham, S.; Kim, Y.; Park, M.J.; Hong, B.H.; Jang, D.-J. Graphene quantum dots-decorated ZnS nanobelts with highly efficient photocatalytic performances. RSC Adv. 2016, 6, 24115–24120. [Google Scholar] [CrossRef]
  28. Bokare, A.; Chinnusamy, S.; Erogbogbo, F. TiO2-graphene quantum dots nanocomposites for photocatalysis in energy and biomedical applications. Catalysts 2021, 11, 319. [Google Scholar] [CrossRef]
  29. Shang, Y.; Liu, T.; Chen, G.; Alborzi, E.; Yong, X.; Wang, Y. N, P co-doped carbon quantum dots bridge g-C3N4 and SnO2: Accelerating charge transport in S-scheme heterojunction for enhanced photocatalytic hydrogen production. J. Alloys Compd. 2024, 971, 172667. [Google Scholar] [CrossRef]
  30. Kaur, I.; Batra, V.; Bogireddy, N.K.; Baveja, J.; Kumar, Y.; Agarwal, V. Chemical-and green-precursor-derived carbon dots for photocatalytic degradation of dyes. Iscience 2024, 27, 108920. [Google Scholar] [CrossRef]
  31. Bhati, A.; Anand, S.R.; Gunture; Garg, A.K.; Khare, P.; Sonkar, S.K. Sunlight-induced photocatalytic degradation of pollutant dye by highly fluorescent red-emitting Mg-N-embedded carbon dots. ACS Sustain. Chem. Eng. 2018, 6, 9246–9256. [Google Scholar] [CrossRef]
  32. Sabet, M.; Mahdavi, K. Green synthesis of high photoluminescence nitrogen-doped carbon quantum dots from grass via a simple hydrothermal method for removing organic and inorganic water pollutions. Appl. Surf. Sci. 2019, 463, 283–291. [Google Scholar] [CrossRef]
  33. Gallareta-Olivares, G.; Rivas-Sanchez, A.; Cruz-Cruz, A.; Hussain, S.M.; González-González, R.B.; Cárdenas-Alcaide, M.F.; Iqbal, H.M.; Parra-Saldívar, R. Metal-doped carbon dots as robust nanomaterials for the monitoring and degradation of water pollutants. Chemosphere 2023, 312, 137190. [Google Scholar] [CrossRef] [PubMed]
  34. Xing, D.; Koubaa, A.; Tao, Y.; Magdouli, S.; Li, P.; Bouafif, H.; Zhang, J. Copper-Doped Carbon Nanodots with Superior Photocatalysis, Directly Obtained from Chromium-Copper-Arsenic-Treated Wood Waste. Polymers 2023, 15, 136. [Google Scholar] [CrossRef] [PubMed]
  35. Kou, X.; Xin, X.; Zhang, Y.; Meng, L.Y. Facile synthesis of nitrogen-doped carbon dots (N-CDs) and N-CDs/NiO composite as an efficient electrocatalyst for oxygen evolution reaction. Carbon Lett. 2021, 31, 695–706. [Google Scholar] [CrossRef]
  36. Murugan, N.; Prakash, M.; Jayakumar, M.; Sundaramurthy, A.; Sundramoorthy, A.K. Green synthesis of fluorescent carbon quantum dots from Eleusine coracana and their application as a fluorescence ‘turn-off’ sensor probe for selective detection of Cu2+. Appl. Surf. Sci. 2019, 476, 468–480. [Google Scholar] [CrossRef]
  37. Zhuang, L.; Song, X.J.; Xu, Y.H. Study on the Infrared Spectral Characteristic of Tetracentron sinense Wood. Hubei Agric. Sci. 2017, 7, 1334–1339. [Google Scholar]
  38. Arul, V.; Sethuraman, M.G. Facile green synthesis of fluorescent N-doped carbon dots from Actinidia deliciosa and their catalytic activity and cytotoxicity applications. Opt. Mater. 2018, 78, 181–190. [Google Scholar] [CrossRef]
  39. Liu, Y.; Guo, D.; Gao, Y.; Tong, B.; Li, Y.; Zhu, Y. Non-thermal effect of microwave on the chemical structure and luminescence properties of biomass-derived carbon dots via hydrothermal method. Appl. Surf. Sci. 2021, 552, 149503. [Google Scholar] [CrossRef]
  40. Ramezani, Z.; Qorbanpour, M.; Rahbar, N. Green synthesis of carbon quantum dots using quince fruit (Cydonia oblonga) powder as carbon precursor: Application in cell imaging and As3+ determination. Colloids Surf. A Physicochem. Eng. Asp. 2018, 549, 58–66. [Google Scholar] [CrossRef]
  41. Zhang, J.-Y.; Boyd, I.W.; O’Sullivan, B.; Hurley, P.; Kelly, P.; Senateur, J.-P. Nanocrystalline TiO2 films studied by optical, XRD and FTIR spectroscopy. J. Non-Cryst. Solids 2002, 303, 134–138. [Google Scholar] [CrossRef]
  42. Abd El Khalk, A.A.; Betiha, M.A.; Mansour, A.S.; Abd El Wahed, M.G.; Al-Sabagh, A.M. High degradation of methylene blue using a new nanocomposite based on zeolitic imidazolate framework-8. ACS Omega 2021, 6, 26210–26220. [Google Scholar] [CrossRef]
  43. Zulfajri, M.; Dayalan, S.; Li, W.-Y.; Chang, C.-J.; Chang, Y.-P.; Huang, G.G. Nitrogen-doped carbon dots from Averrhoa carambola fruit extract as a fluorescent probe for methyl orange. Sensors 2019, 19, 5008. [Google Scholar] [CrossRef]
  44. Van Luam, P.; Kim, D.G.; Ko, S.O. Mechanisms of Methylene Blue Degradation by Nano-Sized β-MnO2 Particles. KSCE J. Civ. Eng. 2020, 24, 1385–1394. [Google Scholar]
  45. Ning, R.; Ge, C.; Liu, Q.; Tian, J.; Asiri, A.M.; Alamry, K.A.; Li, C.M.; Sun, X. Hierarchically porous N-doped carbon nanoflakes: Large-scale facile synthesis and application as an oxygen reduction reaction electrocatalyst with high activity. Carbon 2014, 78, 60–69. [Google Scholar] [CrossRef]
  46. Jagiello, J.; Chojnacka, A.; Pourhosseini, S.E.M.; Wang, Z.; Beguin, F. A dual shape pore model to analyze the gas adsorption data of hierarchical micro-mesoporous carbons. Carbon 2021, 178, 113–124. [Google Scholar] [CrossRef]
  47. Umrao, S.; Sharma, P.; Bansal, A.; Sinha, R.; Singh, R.K.; Srivastava, A. Multi-layered graphene quantum dots derived photodegradation mechanism of methylene blue. RSC Adv. 2015, 5, 51790–51798. [Google Scholar] [CrossRef]
  48. Hwang, K.-J.; Lee, J.-W.; Shim, W.-G.; Jang, H.D.; Lee, S.-I.; Yoo, S.-J. Adsorption and photocatalysis of nanocrystalline TiO2 particles prepared by sol–gel method for methylene blue degradation. Adv. Powder Technol. 2012, 23, 414–418. [Google Scholar] [CrossRef]
  49. Guo, H.; Ke, Y.; Wang, D.; Lin, K.; Shen, R.; Chen, J.; Weng, W. Efficient adsorption and photocatalytic degradation of Congo red onto hydrothermally synthesized NiS nanoparticles. J. Nanopart. Res. 2013, 15, 1–12. [Google Scholar] [CrossRef]
  50. An, T.; An, J.; Yang, H.; Li, G.; Feng, H.; Nie, X. Photocatalytic degradation kinetics and mechanism of antivirus drug-lamivudine in TiO2 dispersion. J. Hazard. Mater. 2011, 197, 229–236. [Google Scholar] [CrossRef]
  51. Liu, L.; Fan, S.; Li, Y. Removal Behavior of Methylene Blue from Aqueous Solution by Tea Waste: Kinetics, Isotherms and Mechanism. Int. J. Environ. Res. Public Health 2018, 15, 1321. [Google Scholar] [CrossRef]
  52. Bechambi, O.; Jlaiel, L.; Najjar, W.; Sayadi, S. Photocatalytic degradation of bisphenol A in the presence of Ce–ZnO: Evolution of kinetics, toxicity and photodegradation mechanism. Mater. Chem. Phys. 2016, 173, 95–105. [Google Scholar] [CrossRef]
  53. Zhu, M.; Agustiono, K.T.; Song, F.; Tong, O.; Dzarfan, O.M.H.; Mashallah, R.; Saeed, S. Applicability of BaTiO3/graphene oxide (GO) composite for enhanced photodegradation of methylene blue (MB) in synthetic wastewater under UV–vis irradiation. Environ. Pollut. 2019, 255, 113182. [Google Scholar] [CrossRef]
  54. Daneshvar, E.; Vazirzadeh, A.; Niazi, A.; Kousha, M.; Naushad, M.; Bhatnagar, A. Desorption of Methylene blue dye from brown macroalga: Effects of operating parameters, isotherm study and kinetic modeling. J. Clean. Prod. 2017, 152, 443–453. [Google Scholar] [CrossRef]
  55. Houas, A.; Lachheb, H.; Ksibi, M.; Elaloui, E.; Guillard, C.; Herrmann, J.-M. Photocatalytic degradation pathway of methylene blue in water. Appl. Catal. B Environ. 2001, 31, 145–157. [Google Scholar] [CrossRef]
  56. Al-Ghouti, M.A.; Khraisheh, M.A.; Ahmad, M.N.; Allen, S. Adsorption behaviour of methylene blue onto Jordanian diatomite: A kinetic study. J. Hazard. Mater. 2009, 165, 589–598. [Google Scholar] [CrossRef] [PubMed]
  57. Shankang, T.; Qijin, G.; Gang, L.; Xiao, W.; Renwu, Y. Investigation into salt effect and kinetics of photocatalytic degradation of reactive dye K-GL. Chem. Ind. Eng. Prog. 2021, 33, 1908. [Google Scholar]
  58. Langmuir, I. The constitution and fundamental properties of solids and liquids. Part I. Solids. J. Am. Chem. Soc. 1916, 38, 2221–2295. [Google Scholar] [CrossRef]
  59. Freundlich, H. Over the adsorption in solution. J. Phys. Chem. 1906, 57, 1100–1107. [Google Scholar]
  60. Redlich, O.; Peterson, D.L. A useful adsorption isotherm. J. Phys. Chem. 1959, 63, 1024. [Google Scholar] [CrossRef]
  61. Belhachemi, M.; Addoun, F. Comparative adsorption isotherms and modeling of methylene blue onto activated carbons. Appl. Water Sci. 2011, 1, 111–117. [Google Scholar] [CrossRef]
  62. Anwar, D.I.; Mulyadi, D. Synthesis of Fe-TiO2 Composite as a Photocatalyst for Degradation of Methylene Blue. Procedia Chem. 2015, 17, 49–54. [Google Scholar] [CrossRef]
  63. Devadi, M.A.H.; Krishna, M.; Murthy, H.N.; Sathyanarayana, B. Statistical optimization for photocatalytic degradation of methylene blue by Ag-TiO2 nanoparticles. Procedia Mater. Sci. 2014, 5, 612–621. [Google Scholar] [CrossRef]
Figure 1. FTIR spectra (a), XPS full scan survey spectrum (b) of the synthesized CCA-CDs, and high-resolution XP spectrum of C1s of CCA-CDs (c).
Forests 15 00680 g001
Figure 2. SEM images of TiO2 (a,b), CCA-CDs at (c,d), CCA-CDs/TiO2 composites (e,f), and the EDX result of CCA-CDs/TiO2 composites (g,h).
Forests 15 00680 g002
Figure 3. TEM images for CCA-CDs at 50 (a) and 20 nm (b) scale.
Forests 15 00680 g003
Figure 4. Nitrogen adsorption/desorption isotherms (a) and BJH pore-size distribution curves (b) of the TiO2, CCA-CDs, and CCA-CDs doped-TiO2 at 77.3 K.
Forests 15 00680 g004
Figure 5. The removal rate of MB treated by 30 mg of CDs (a) and CDs/TiO2 composites (b) under room light, compared to the removal rate of MB under UV light and visible light (c) for 30 mL methylene blue (MB) solution with a concentration of 10 mg/L. and (d) digital photo of photocatalytic degradation of methylene blue aqueous solution (50 mg/L) by copper doped carbon dots.
Forests 15 00680 g005
Figure 6. Effect of the operating parameters on MB removal rate (%) treated by CCA-CDs: effect of initial MB concentrations where the solid-to-liquid ratio for CCA-CDs and MB solution was 1:1000 (a,b), contents of CCA-CDs for 30 mL MB solution with a concentration of 50 mg/L (c), and pH for 30 mg CCA-CD dispersed in 30 mL MB solution with a concentration of 50 mg/L (d).
Forests 15 00680 g006
Figure 7. Kinetic models for removing methylene blue at 100 and 300 mg/L concentrations by 30 mg CCA-CDs at a pH value of 6.2.
Forests 15 00680 g007
Figure 8. Isotherm curves of MB degradation by CCA-CDs (a) and the R1 plots (b) with 30 mg CCA-CD dispersed in 30 mL MB solution.
Forests 15 00680 g008
Figure 9. LC-MS chromatogram spectra of MB treated with CCA-CDs for 15 min (a), 30 min (b), 60 min (c), and mass spectra with retention time at 1.12 min (d), 1.57 min (e), 1.03 min (f), 0.83 min (g), 0.72 min (h) and the average of subfigure (c) (i), respectively.
Forests 15 00680 g009
Figure 10. Schematic photocatalytic degradation mechanism of photo methylene blue pollutants.
Forests 15 00680 g010
Table 1. Porous texture parameters calculated from the N2 adsorption isotherms at 77.3 K.
SamplesSBET (m2/g)Sext (m2/g)Vmi (cm3/g)Vme (cm3/g)VT (cm3/g)
TiO2158.25108.240.0110.3950.406
CCA-CDs80.5055.380.0160.2270.243
CCA-CDs/TiO2144.6398.560.0070.3260.333
Table 2. Non-linear kinetics parameters calculated for MB degradation by CCA-CDs.
ModelsParametersSamples
100.000 mg/L300.000 mg/L
qe,exp (mg/g)95.280171.660
Pseudo-first-orderqe,cal (mg/g)87.290150.850
k1 (min−1)0.0550.026
R20.8700.883
Pseudo-second-orderqe,cal (mg/g)93.430163.620
k2 (g/(mg·min))0.087 × 10−20.024 × 10−2
R20.9630.964
Table 3. Isotherm parameters of MB removal by CCA-CDs.
ModelsParametersCCA-CDs
Langmuirqmax (mg/g)121.81
KL (L/mg)0.82
R20.877
FreundlichKf (mg/g)67.05
1/n0.14
R20.940
Redlich–PetersonKr (L/g)290.52
ar (L/mg)3.58
β0.91
R20.980
Sipsqs (mg/g)151.07
Ks (L/g)0.68
ns0.43
R20.983
Disclaimer/Publisher’s Note: The statements, opinions and data contained in all publications are solely those of the individual author(s) and contributor(s) and not of MDPI and/or the editor(s). MDPI and/or the editor(s) disclaim responsibility for any injury to people or property resulting from any ideas, methods, instructions or products referred to in the content.

