1. Introduction
Wood as a renewable material is used in various industries. However, wood sometimes has undesirable properties (swelling, shrinkage, and poor resistance against the biological attack of fungi and insects). These properties limit the outdoor use of wood, which is a reason for modifying wood in various ways [
1,
2]. Wood treatment at high temperatures is a promising alternative to chemical wood treatment. This technology has been known for a long time but was not part of commercial interest due to the high availability of cheap hardwood. Hardwood prices rise, and because of that, this technology has become extremely valuable. In the thermal treatment process, wood is heated to 160–250 °C depending on the species used and the desired material properties [
3]. Heat treatment reduces the hydrophilic behaviour of the wood by modifying the chemical structure of some of its components. It also results in a significant reduction in the hemicellulose content, thus improving the dimensional stability of the wood [
4,
5]. The decrease in hygroscopicity of the thermally modified wood was also observed by the authors Li et al., 2017 [
6]. Another improved property of heat treatment is achieving a dark colour resembling rarer wood [
7]. The basis of industrial production is the selection of the right temperature and time, which help to obtain the desired colour values of the wood. The chemical and physical properties of wood change according to the used temperature [
8,
9,
10]. The colour of the wood is determined by chemical compounds, including cellulose, hemicelluloses, lignin, and extractives [
11]. The colour of thermally treated fir wood was investigated in the work of Kučerová et al. [
8]. On the other hand, pine wood is composed of sapwood and heartwood. The two parts of pine wood are of a different colour. But we assume the larger range of pine wood colour after thermal treatment. Moreover, a comparison of the chemical composition and colour of both wood parts will be a topic of interest. The colour of wood is affected mostly by the colour of the extractives, which make up a very small percentage of the wood’s structure after thermal treatment [
12]. Other authors state that wood colour changes due to heat are caused by the thermal degradation of hemicelluloses and lignin [
12]. We can assume that the values of the colour coordinates of the wood are affected by the chemical composition of the wood after thermal treatment.
This study aimed to determine the influence of increased temperature on mass loss kinetics, chemical composition, and pine wood colour changes in time during thermal treatment. The colour will be measured on samples of wood, extracted sawdust, holocellulose, and lignin isolated from the extracted sawdust of pine heartwood (HW) and sapwood (SW). Subsequently, we will verify the measured values with the proposed mixing colour model, which relates the measured colour of holocellulose and lignin with the extracted sawdust colour.
3. Results and Discussion
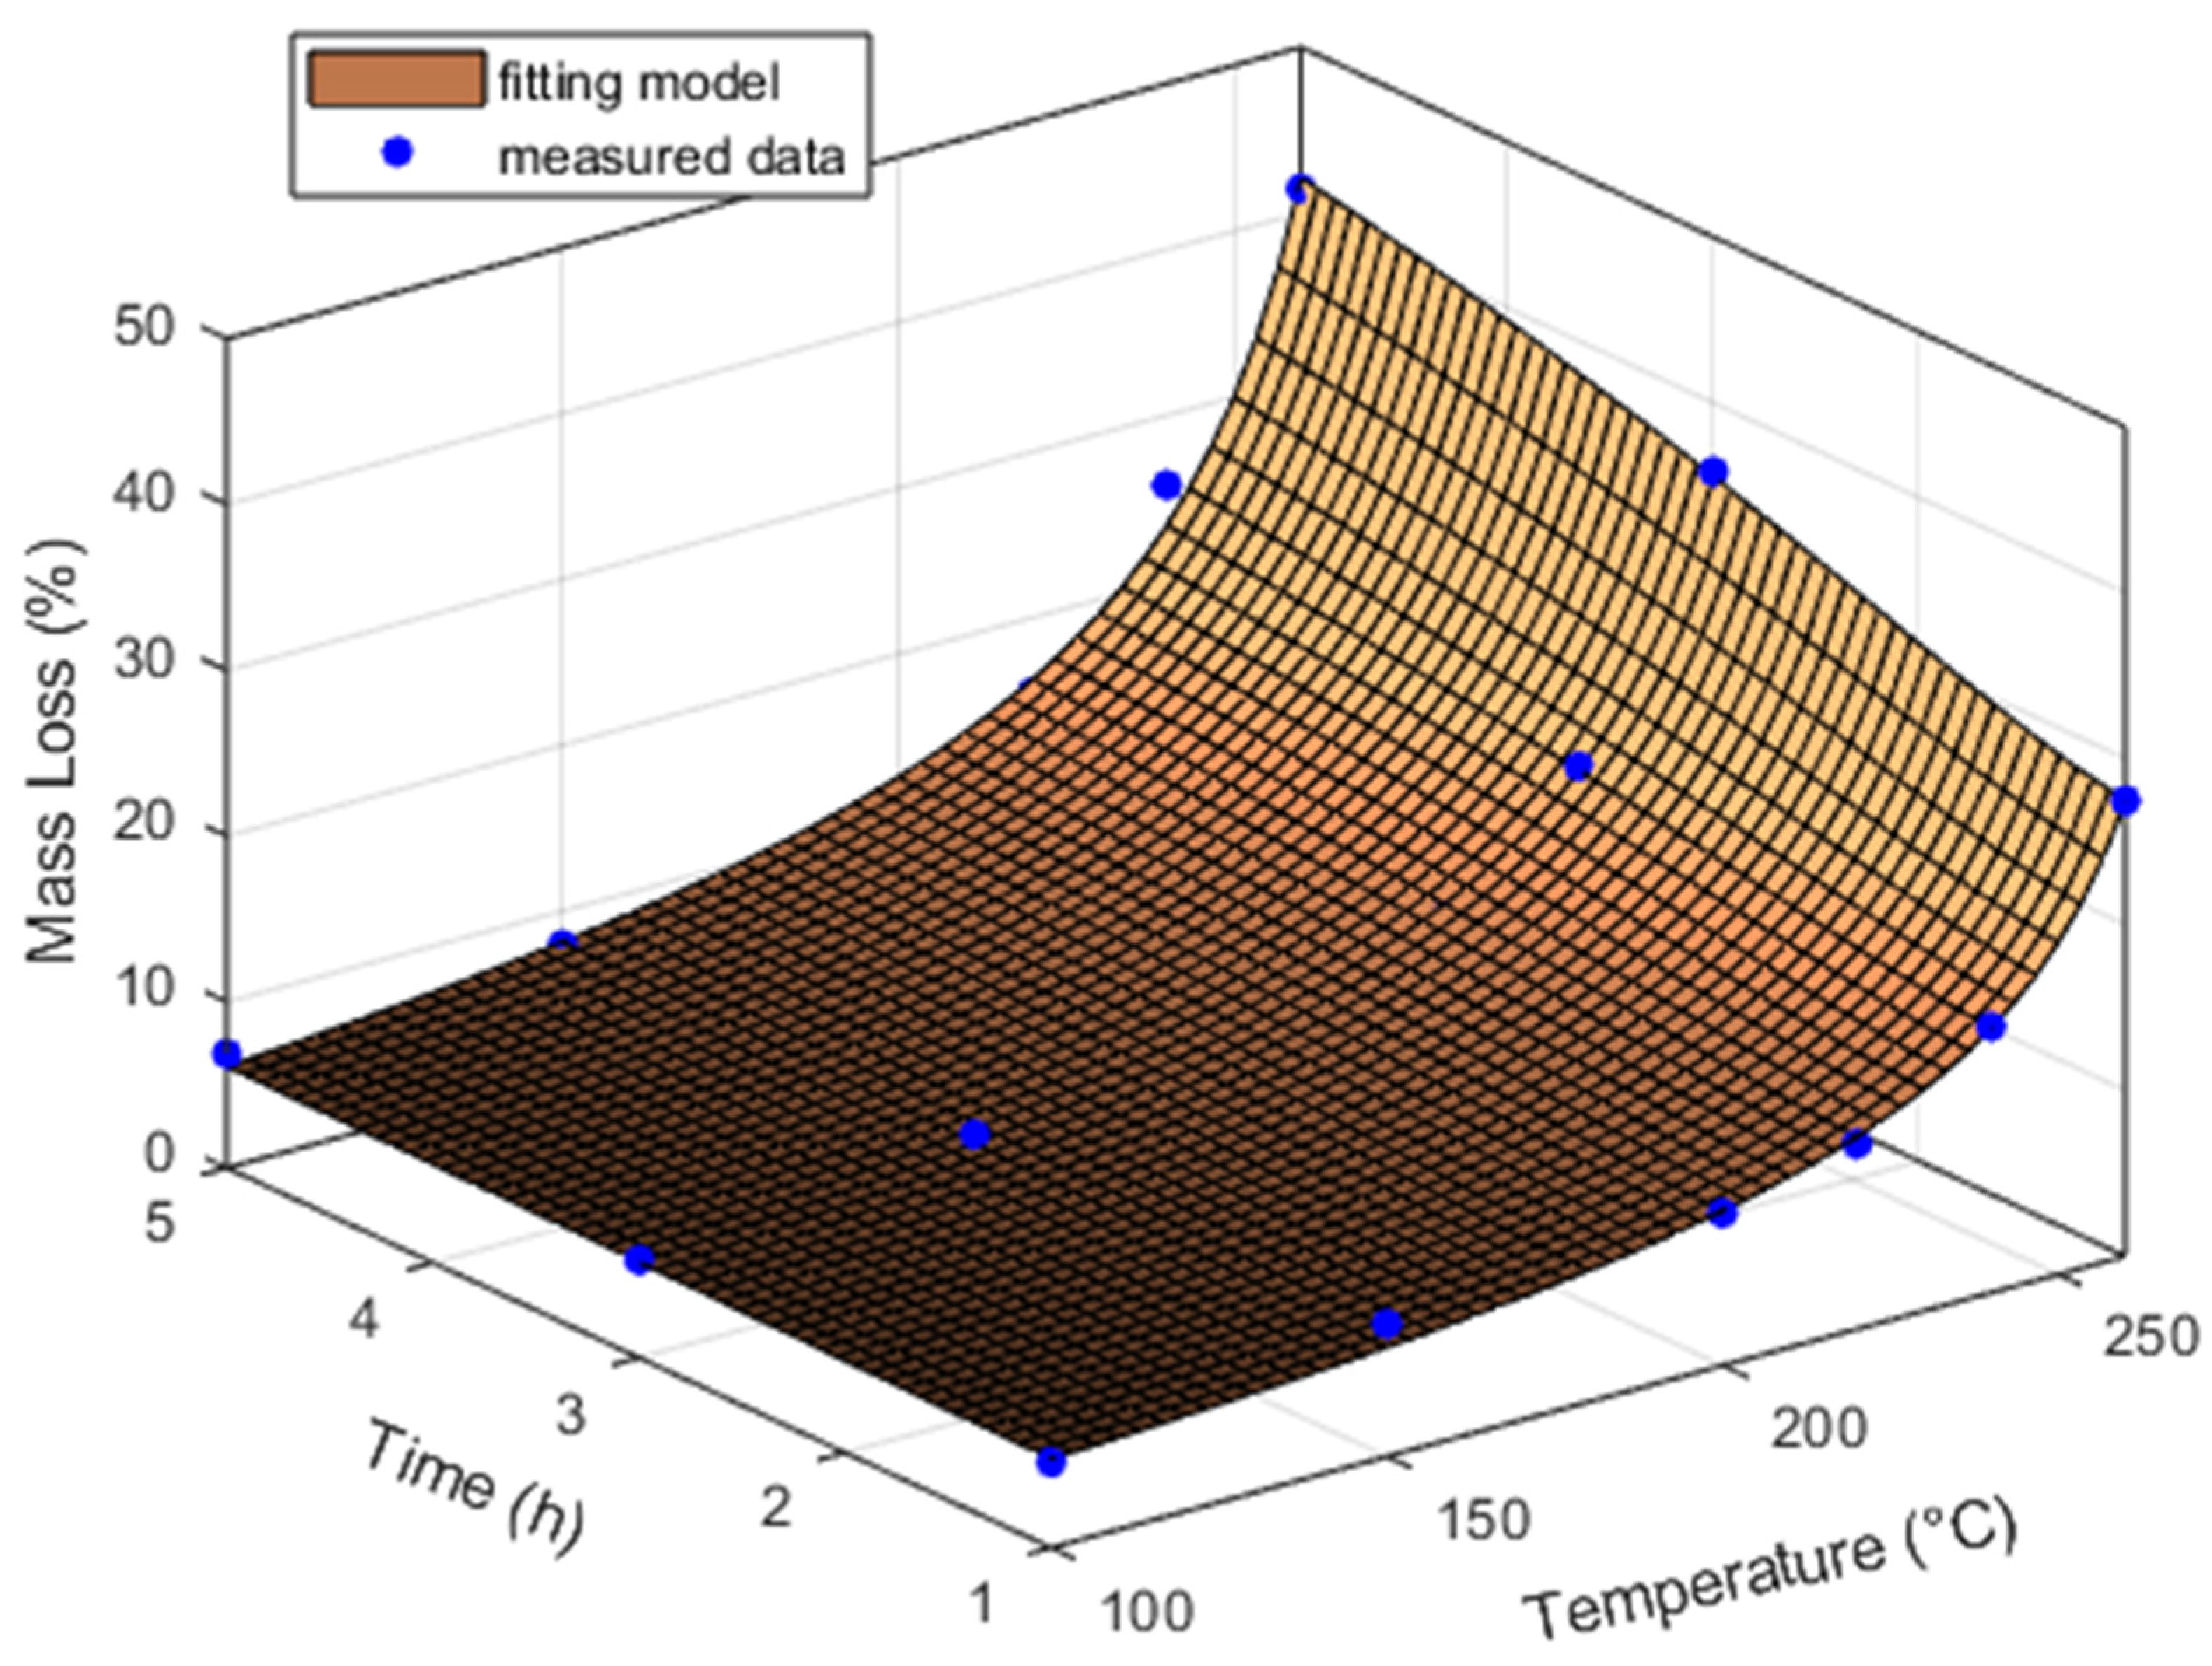
The heat treatment of pine heartwood and sapwood led to mass loss (
Figure 1 and
Figure 2), which was connected with changes in the content of the chemical components of the wood (
Figure 3,
Figure 4,
Figure 5,
Figure 6,
Figure 7 and
Figure 8). The mass loss for heartwood and sapwood increased with increasing temperature and time of thermal treatment. The lowest mass loss was recorded at a temperature of 100 °C and a time of 1 h. The mass loss considerably increased over a temperature of 220 °C at all times of treatment. The highest change in the mass loss was 41.48% for heartwood and 49.21% for sapwood at a temperature of 260 °C and 5 h of treatment. Sapwood degraded faster than heartwood; at a temperature of 260 °C and 1 h, 3 h, and 5 h, it was degraded by 8.56%, 14.60%, and 15.71%.
Table 1 contains the calculated values of the mass loss parameters from Equation (1). The parameter d shows the temperature at which the wood would completely degrade. This temperature was almost computed equally for heartwood and sapwood. The meaning of parameter c is the rate of wood change during treatment. According to this parameter, sapwood was degraded faster than heartwood. Regression formula 1 is valid from 1 h to 5 h and temperatures of 100 °C to 260 °C. According to Hill 2006 [
20], temperatures up to 100 °C cause a lower mass loss associated mainly with the loss of volatile substances and bound water, whereas the loss of macromolecular components of wood occurs above 100 °C. In the work of Čermák et al., 2021 [
21], for pine at a temperature of 220 °C and a time of 6 h, mass loss attained 13.5%. In another study, mass loss was determined in pine wood at a temperature of 220 °C at 7% [
22].
The chemical content of pine heartwood and softwood is shown in
Table 2. The percentage content of chemical components was used as initial information in the model (Equation (3)). The ratio
mi/
m multiplied by 100 is the percentage content of the i-compound in the mixture.
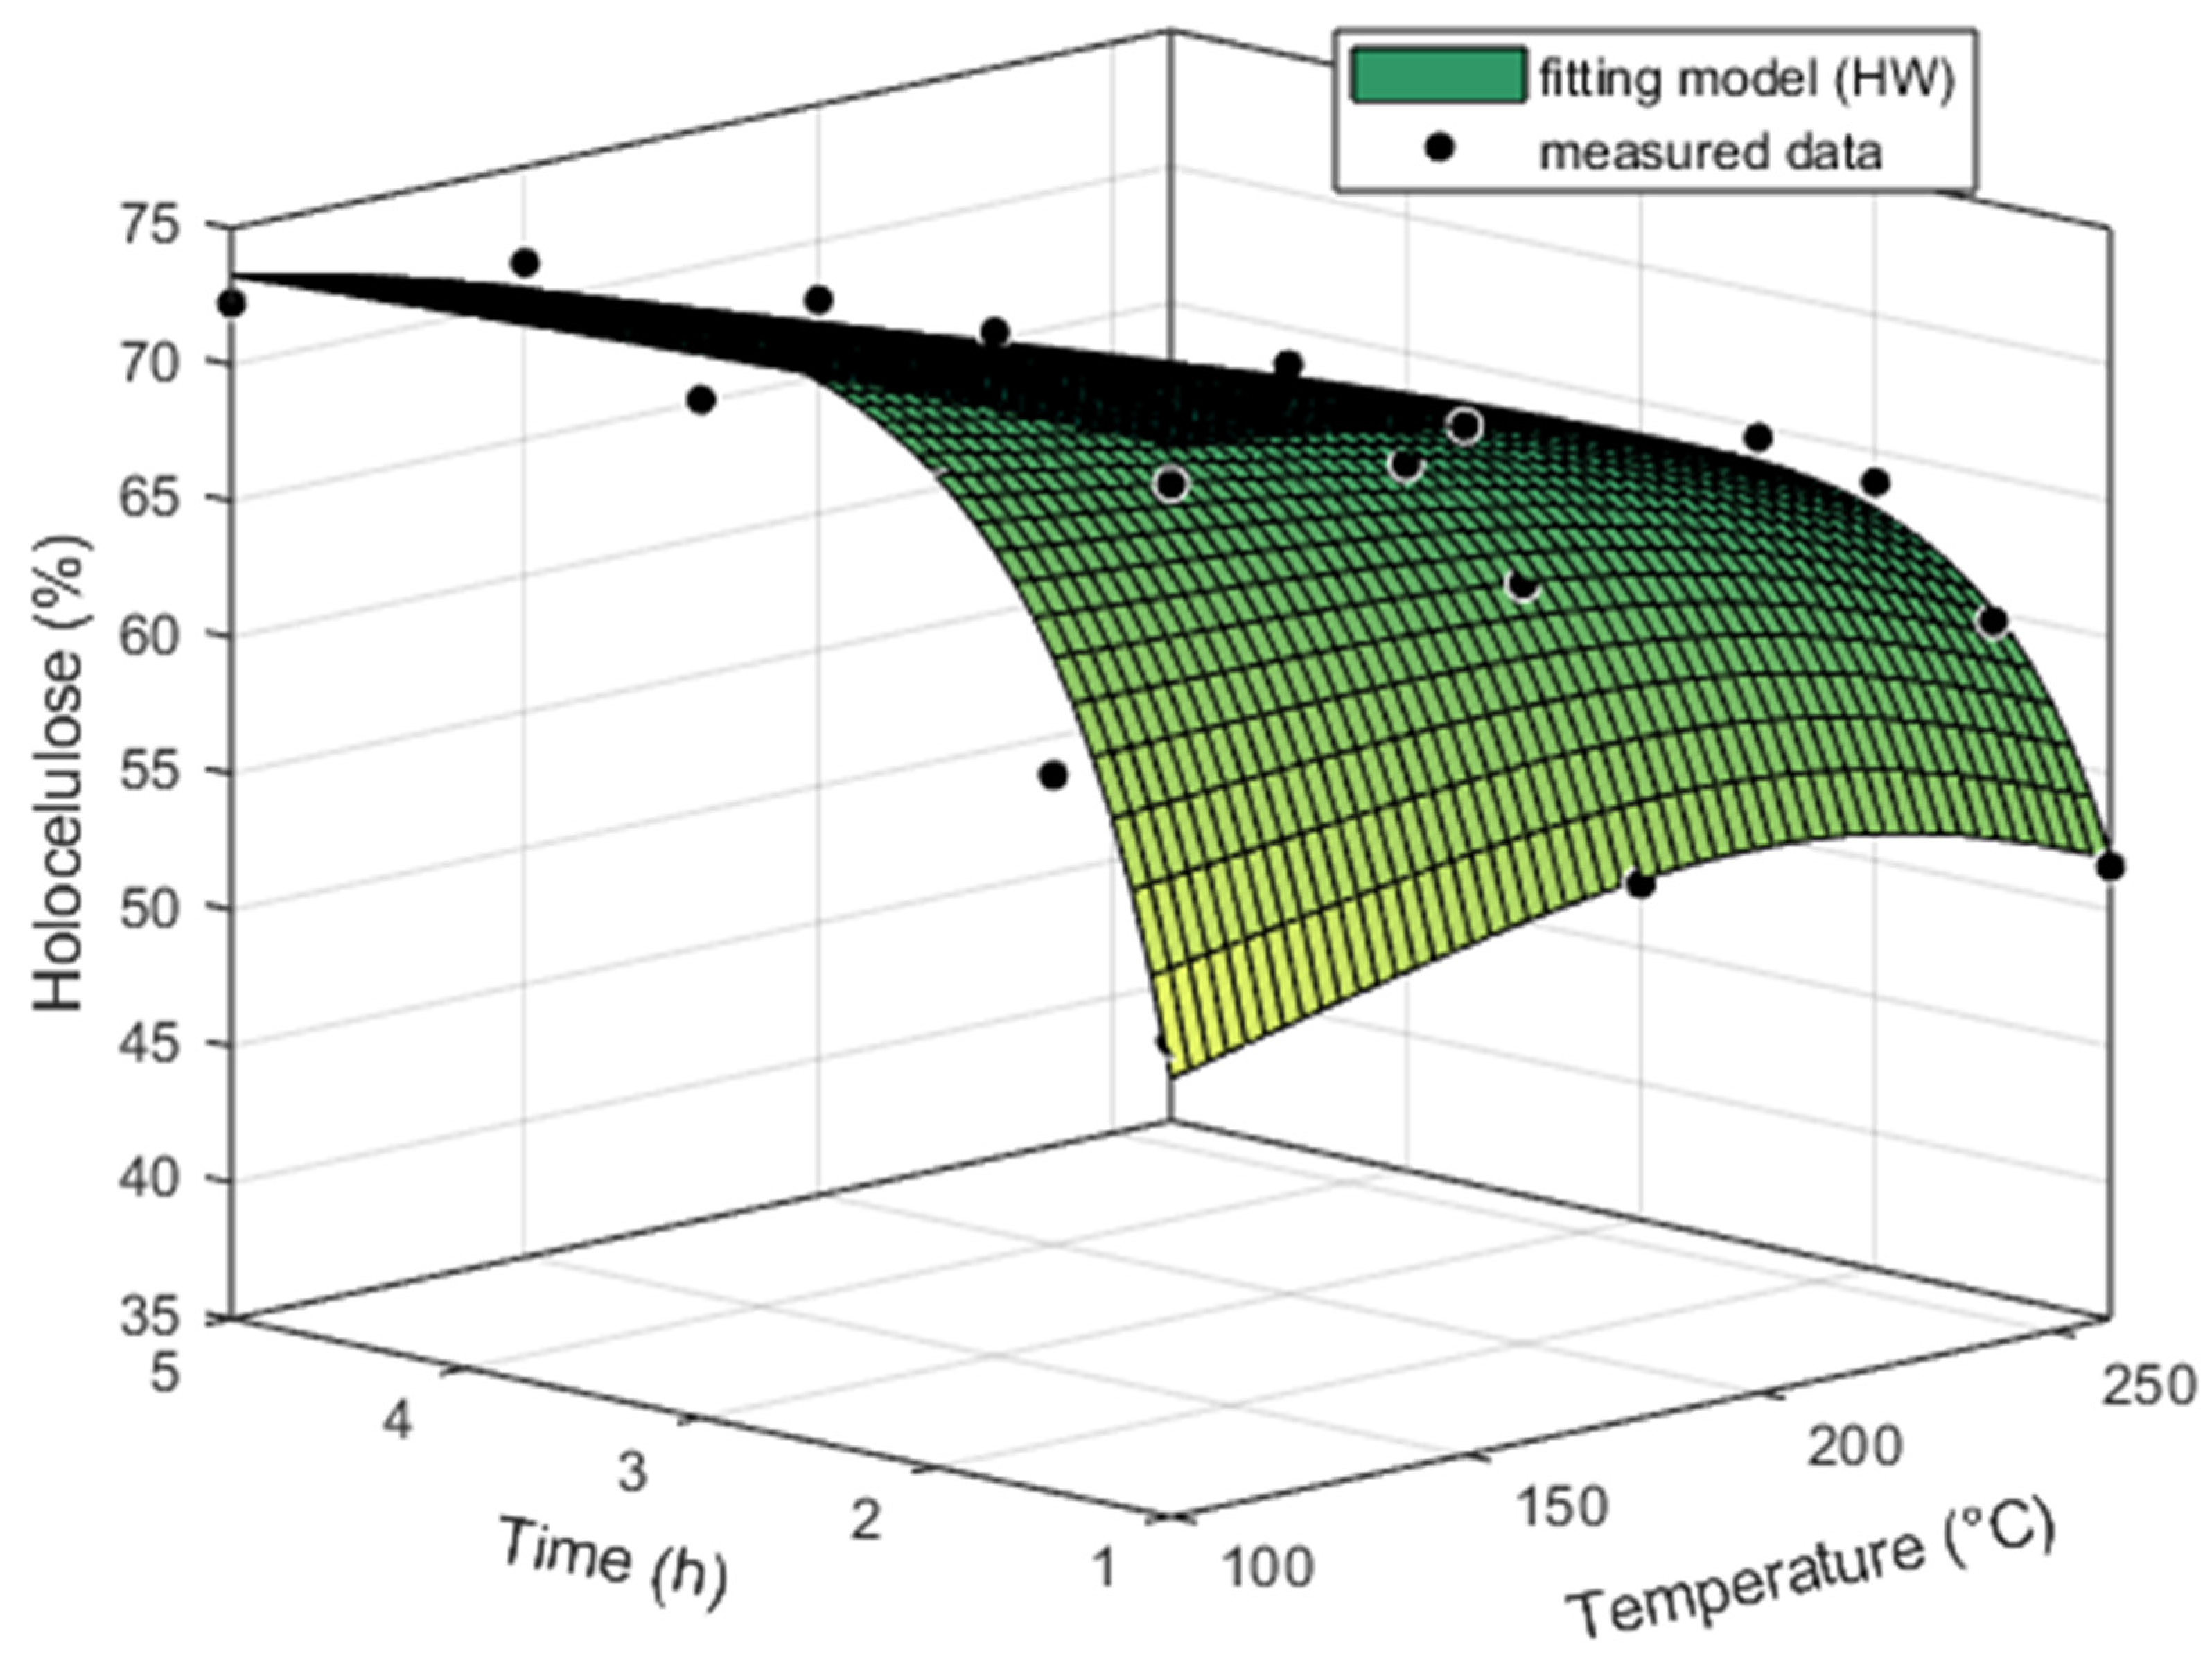
The content of holocellulose in the heartwood and sapwood was approximately the same at temperatures of 100 and 150 °C (
Figure 3 and
Figure 4). With increasing temperature and exposure time, its content decreased in the heartwood and sapwood. The holocellulose of heartwood degraded continually with temperature, and the largest change was noted between 240 and 260 °C. On the contrary, the holocellulose of sapwood degraded slightly up to a temperature of 240 °C, but at a temperature of 260 °C we already noticed a sharp decrease in its content. The lowest value of the holocellulose content was recorded at a temperature of 260 °C and a time of 5 h, namely, 37.91% for the heartwood and 29.30% for the sapwood. Holocellulose in sapwood degraded faster than holocellulose in heartwood; at a temperature of 260 °C and a time from 0 h up to 5h, it was degraded by 47.87% for heartwood and 60.24% for sapwood. The percentage content of holocellulose or lignin was also computed according to Equation (1) (
Table 3 and
Table 4). According to Piernik et al., 2022 [
22], the reduction in the holocellulose content after thermal treatment is mainly caused by the degradation of hemicelluloses. These authors state that the degradation of hemicelluloses was significantly faster compared to that of cellulose.
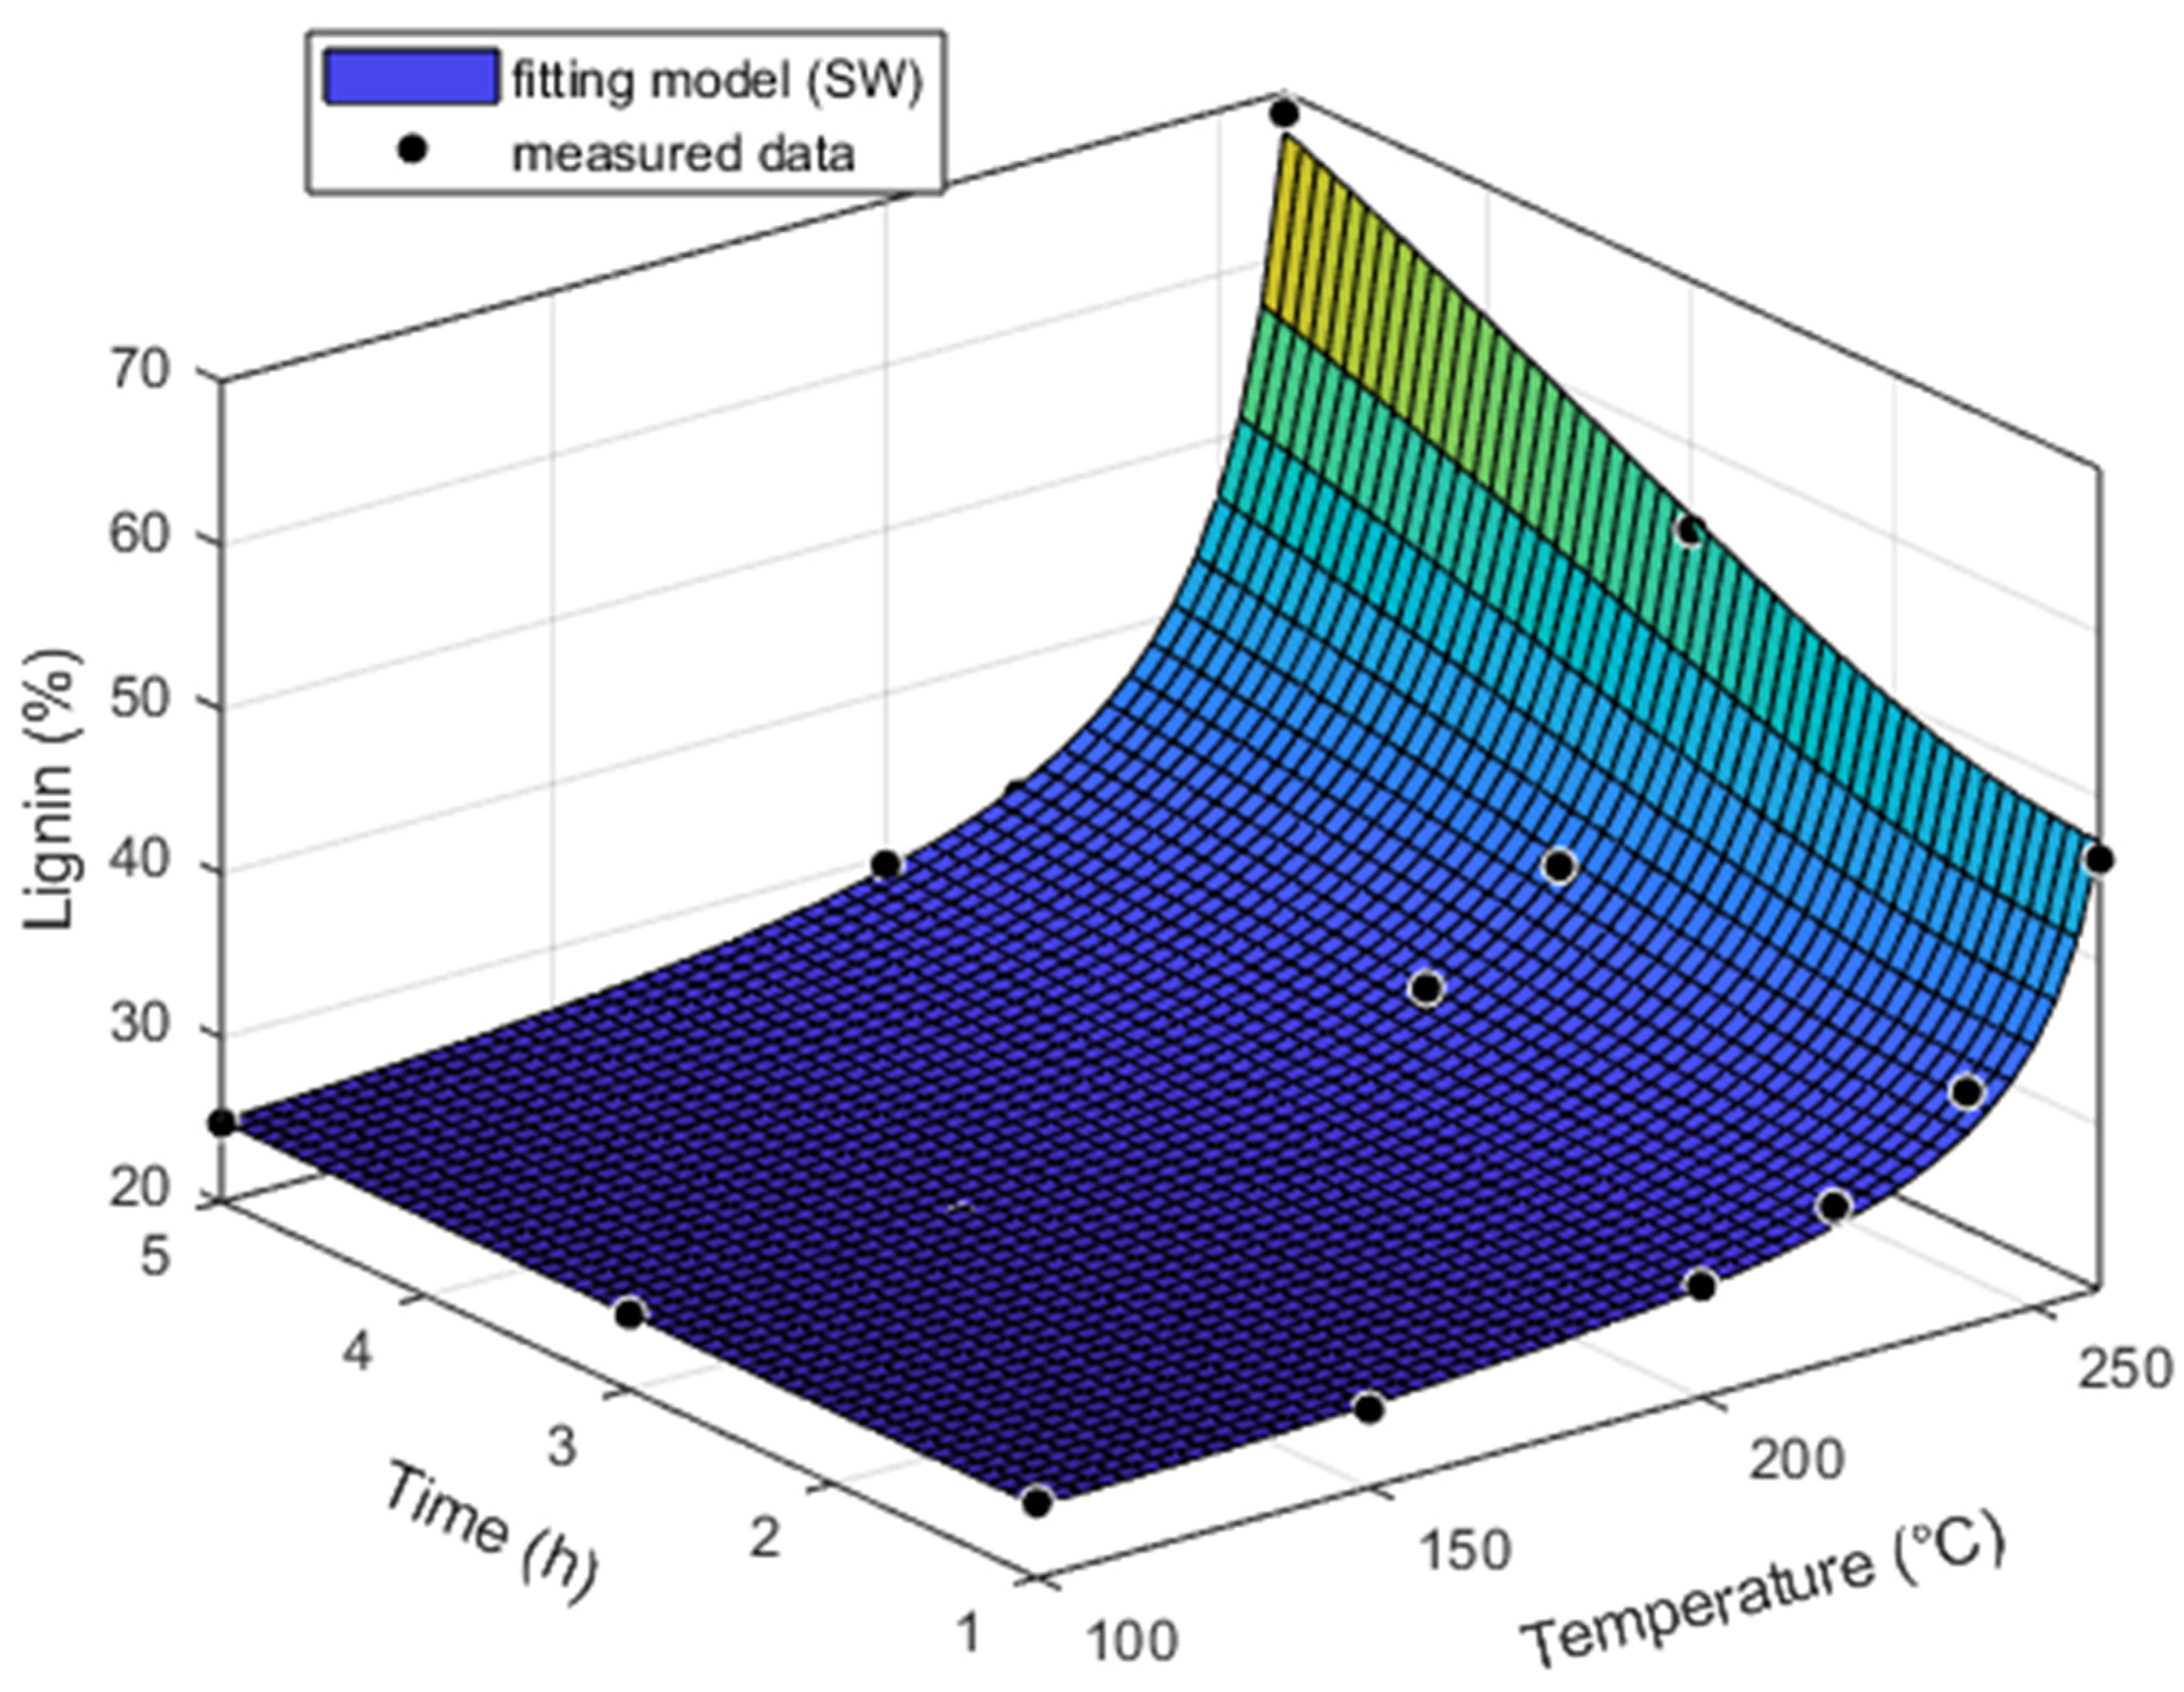
The change in lignin content had the opposite trend to the change in holocellulose content. The content of lignin in the original heartwood and sapwood samples of pine was approximately the same. Lignin isolated from heartwood and sapwood increased with temperature and treatment time (
Figure 5 and
Figure 6). The highest lignin content was recorded at a temperature of 260 °C and a time of 5 h, namely, 59.57% for the heartwood and 68.77% for the sapwood. Its content increased faster in the sapwood than in the heartwood. At a temperature of 260 °C and a time from 0 h up to 5 h, it was increased by 142.35% for heartwood and 179.44% for sapwood. A negative linear correlation with a high coefficient of determination (0.9990–1) was found between lignin and holocellulose at all treatment times and types of pine wood.
The thermal treatment causes the depolymerization of lignin. Hemicelluloses reach a more advanced stage of degradation at a lower temperature compared to lignin, which results in an apparent lignin increase in the other components [
23].
The degradation results of holocellulose and lignin were confirmed with the model in Equation (1). The rate of change, which is represented with parameter c, was the same for the holocellulose and lignin of sapwood. The c value of 6.7 was less than the double value of the c parameter of mass loss. Therefore, we can assume that the difference was caused by extractives. The rate of change of holocellulose was slower than that of lignin in heartwood, but the doubled rate of change of mass loss was between the rate of change of holocellulose and that of lignin.
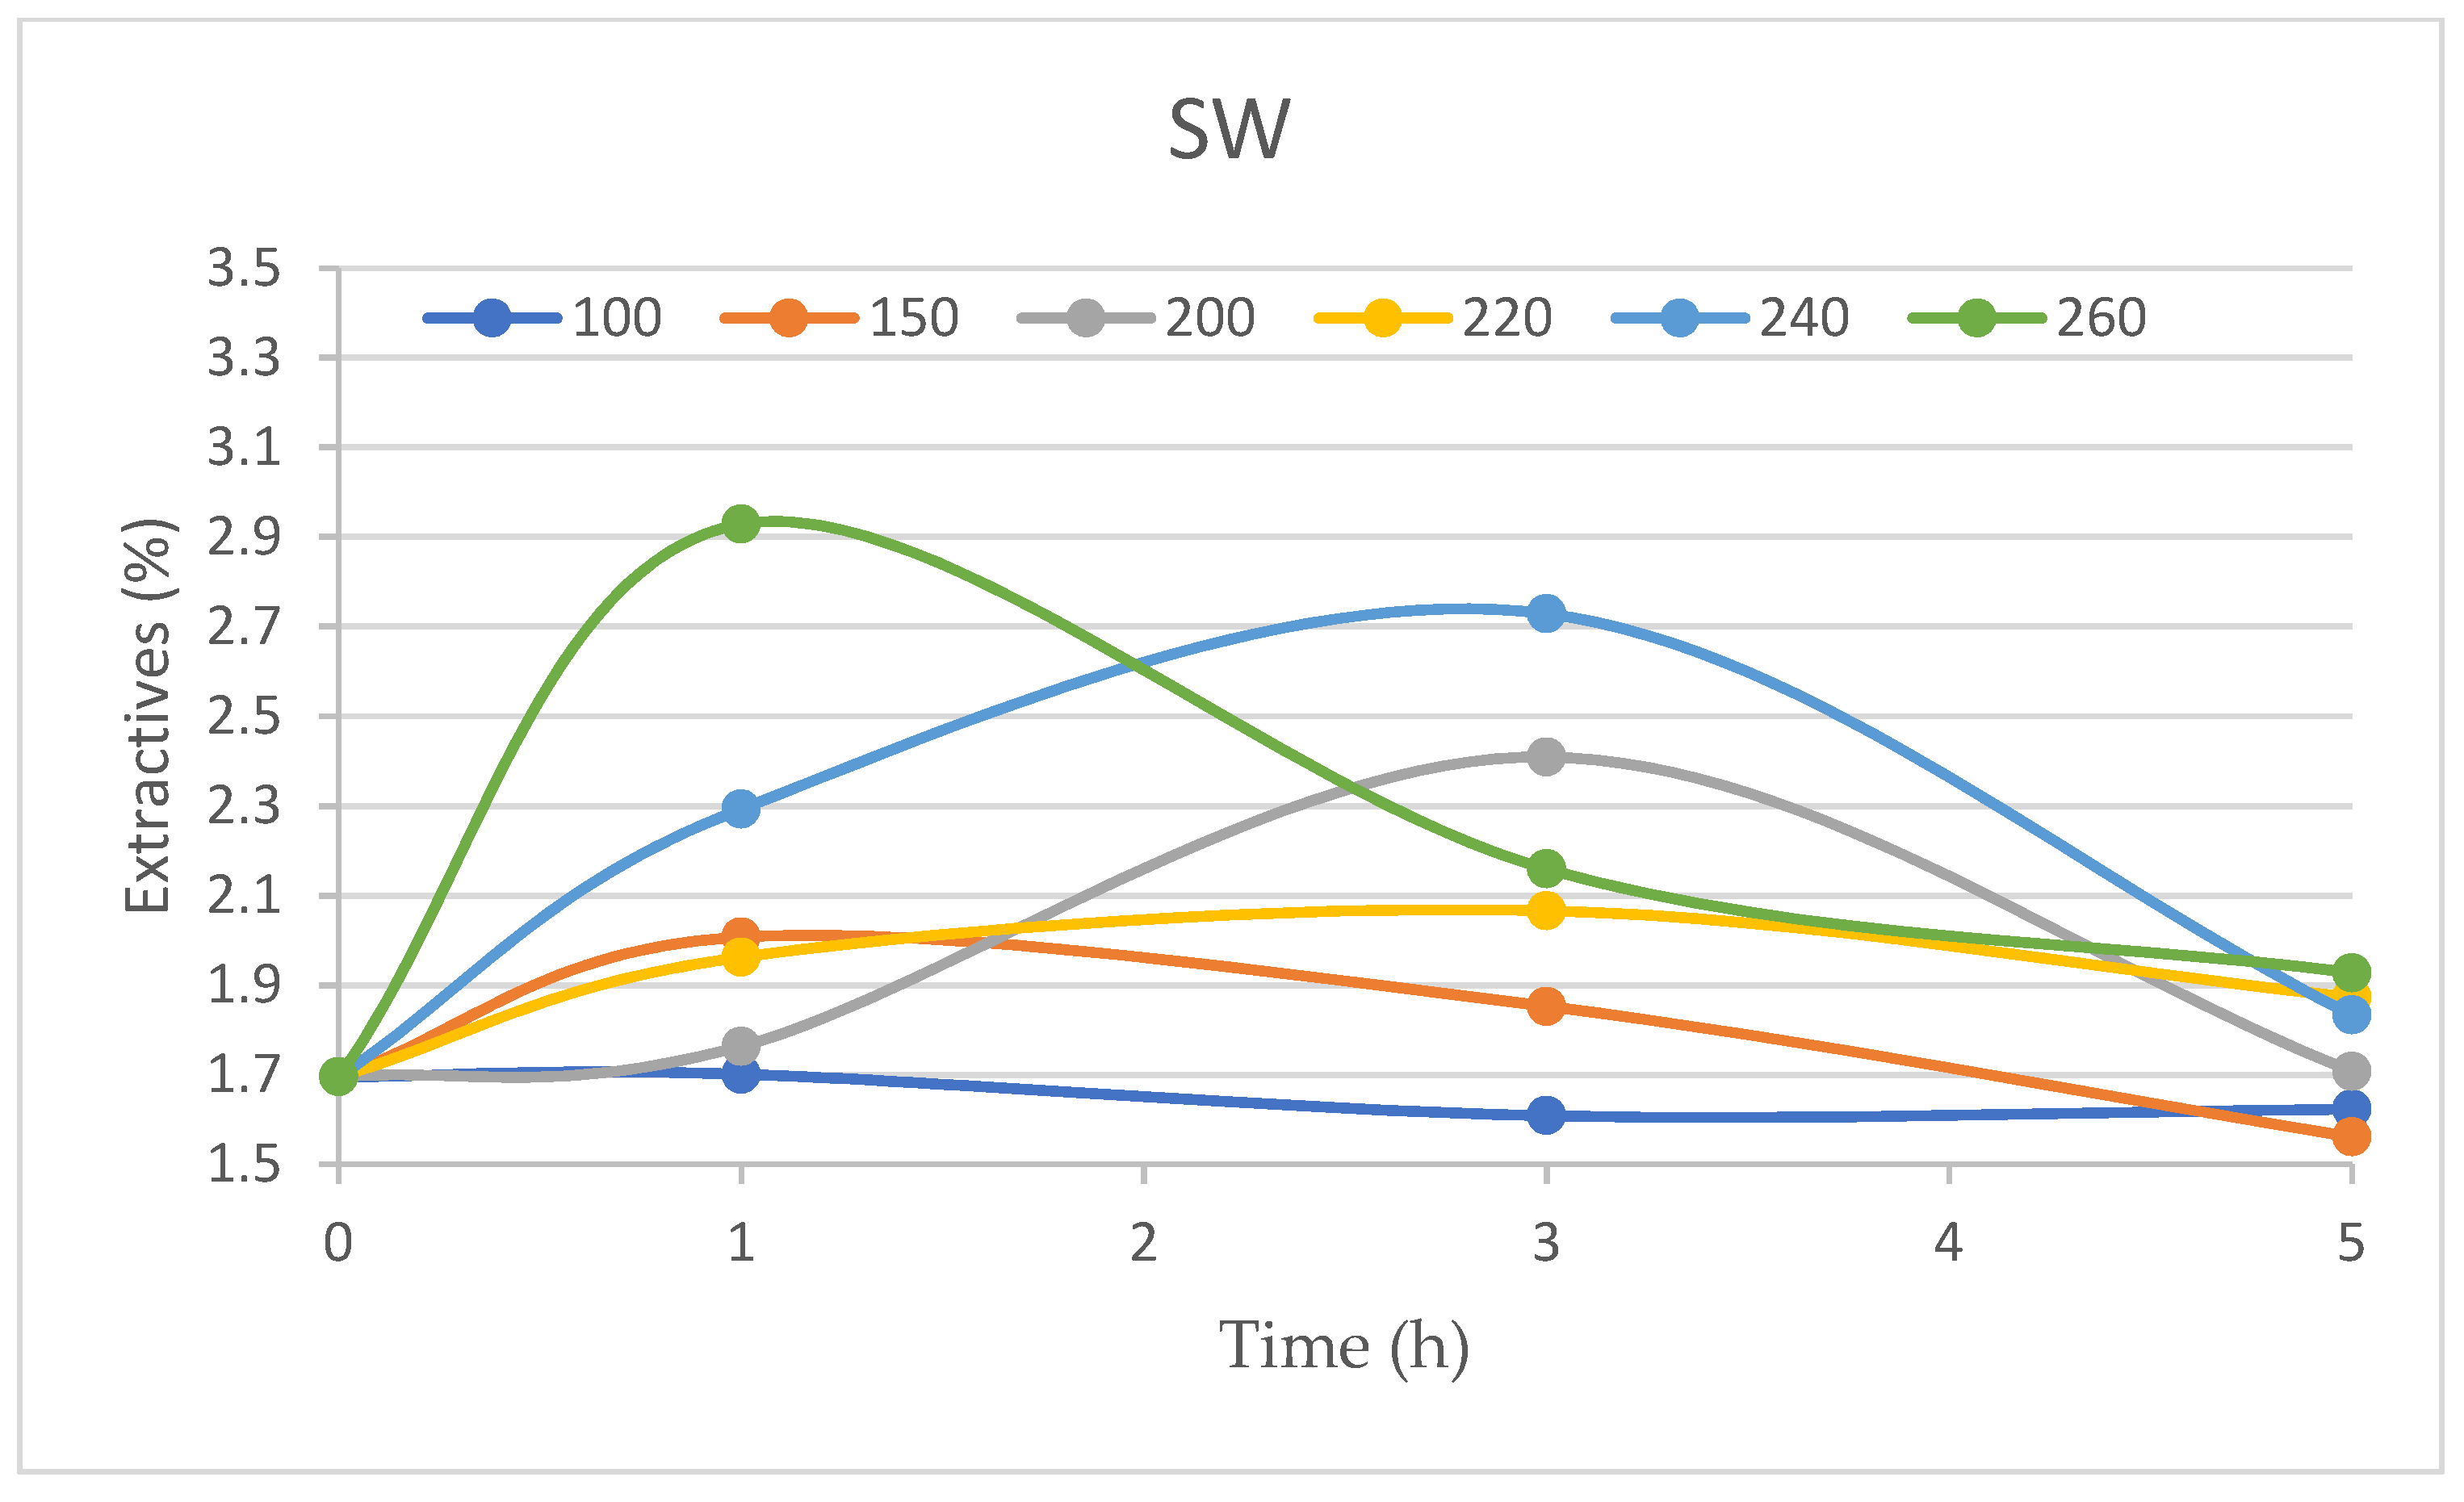
The content of extractives decreased in the heartwood at a temperature of 100 °C and 150 °C and a time of 1 h, whereas at higher temperatures and the same treatment time, their content increased (
Figure 7). It reached its maximum at a temperature of 260 °C and 1 h for heartwood and sapwood, namely, 3.60% and 2.93%. The maximum content of extractives was observed at 3 h treatment at a temperature of 240 °C: for heartwood, it was 3.15% and for sapwood 2.73%. With five hours of treatment, the maximum content of extractives was also observed at a temperature of 240 °C for heartwood. The change in extractive content had a different course in heartwood and sapwood (
Figure 7 and
Figure 8). Extractive content was higher in heartwood than in sapwood at all times of treatment. The reduction in the content of extractives is probably caused by the decomposition of certain extractives into volatile products. The increase in the content of extractives soluble in toluene-ethanol indicates the emergence of new extractives arising from the decomposition of the main components of wood. According to Esteves et al., 2011 [
24], the increase, followed by a decrease, in extractive amounts in thermally modified wood suggests that there is an equilibrium between degradation and volatilization and that the appearance of new extractable compounds comes from polysaccharide and lignin degradation. As the temperature increases, new compounds form as a result of the degradation of carbohydrates, and lignin degrades to volatiles, causing a decrease in extractive contents.
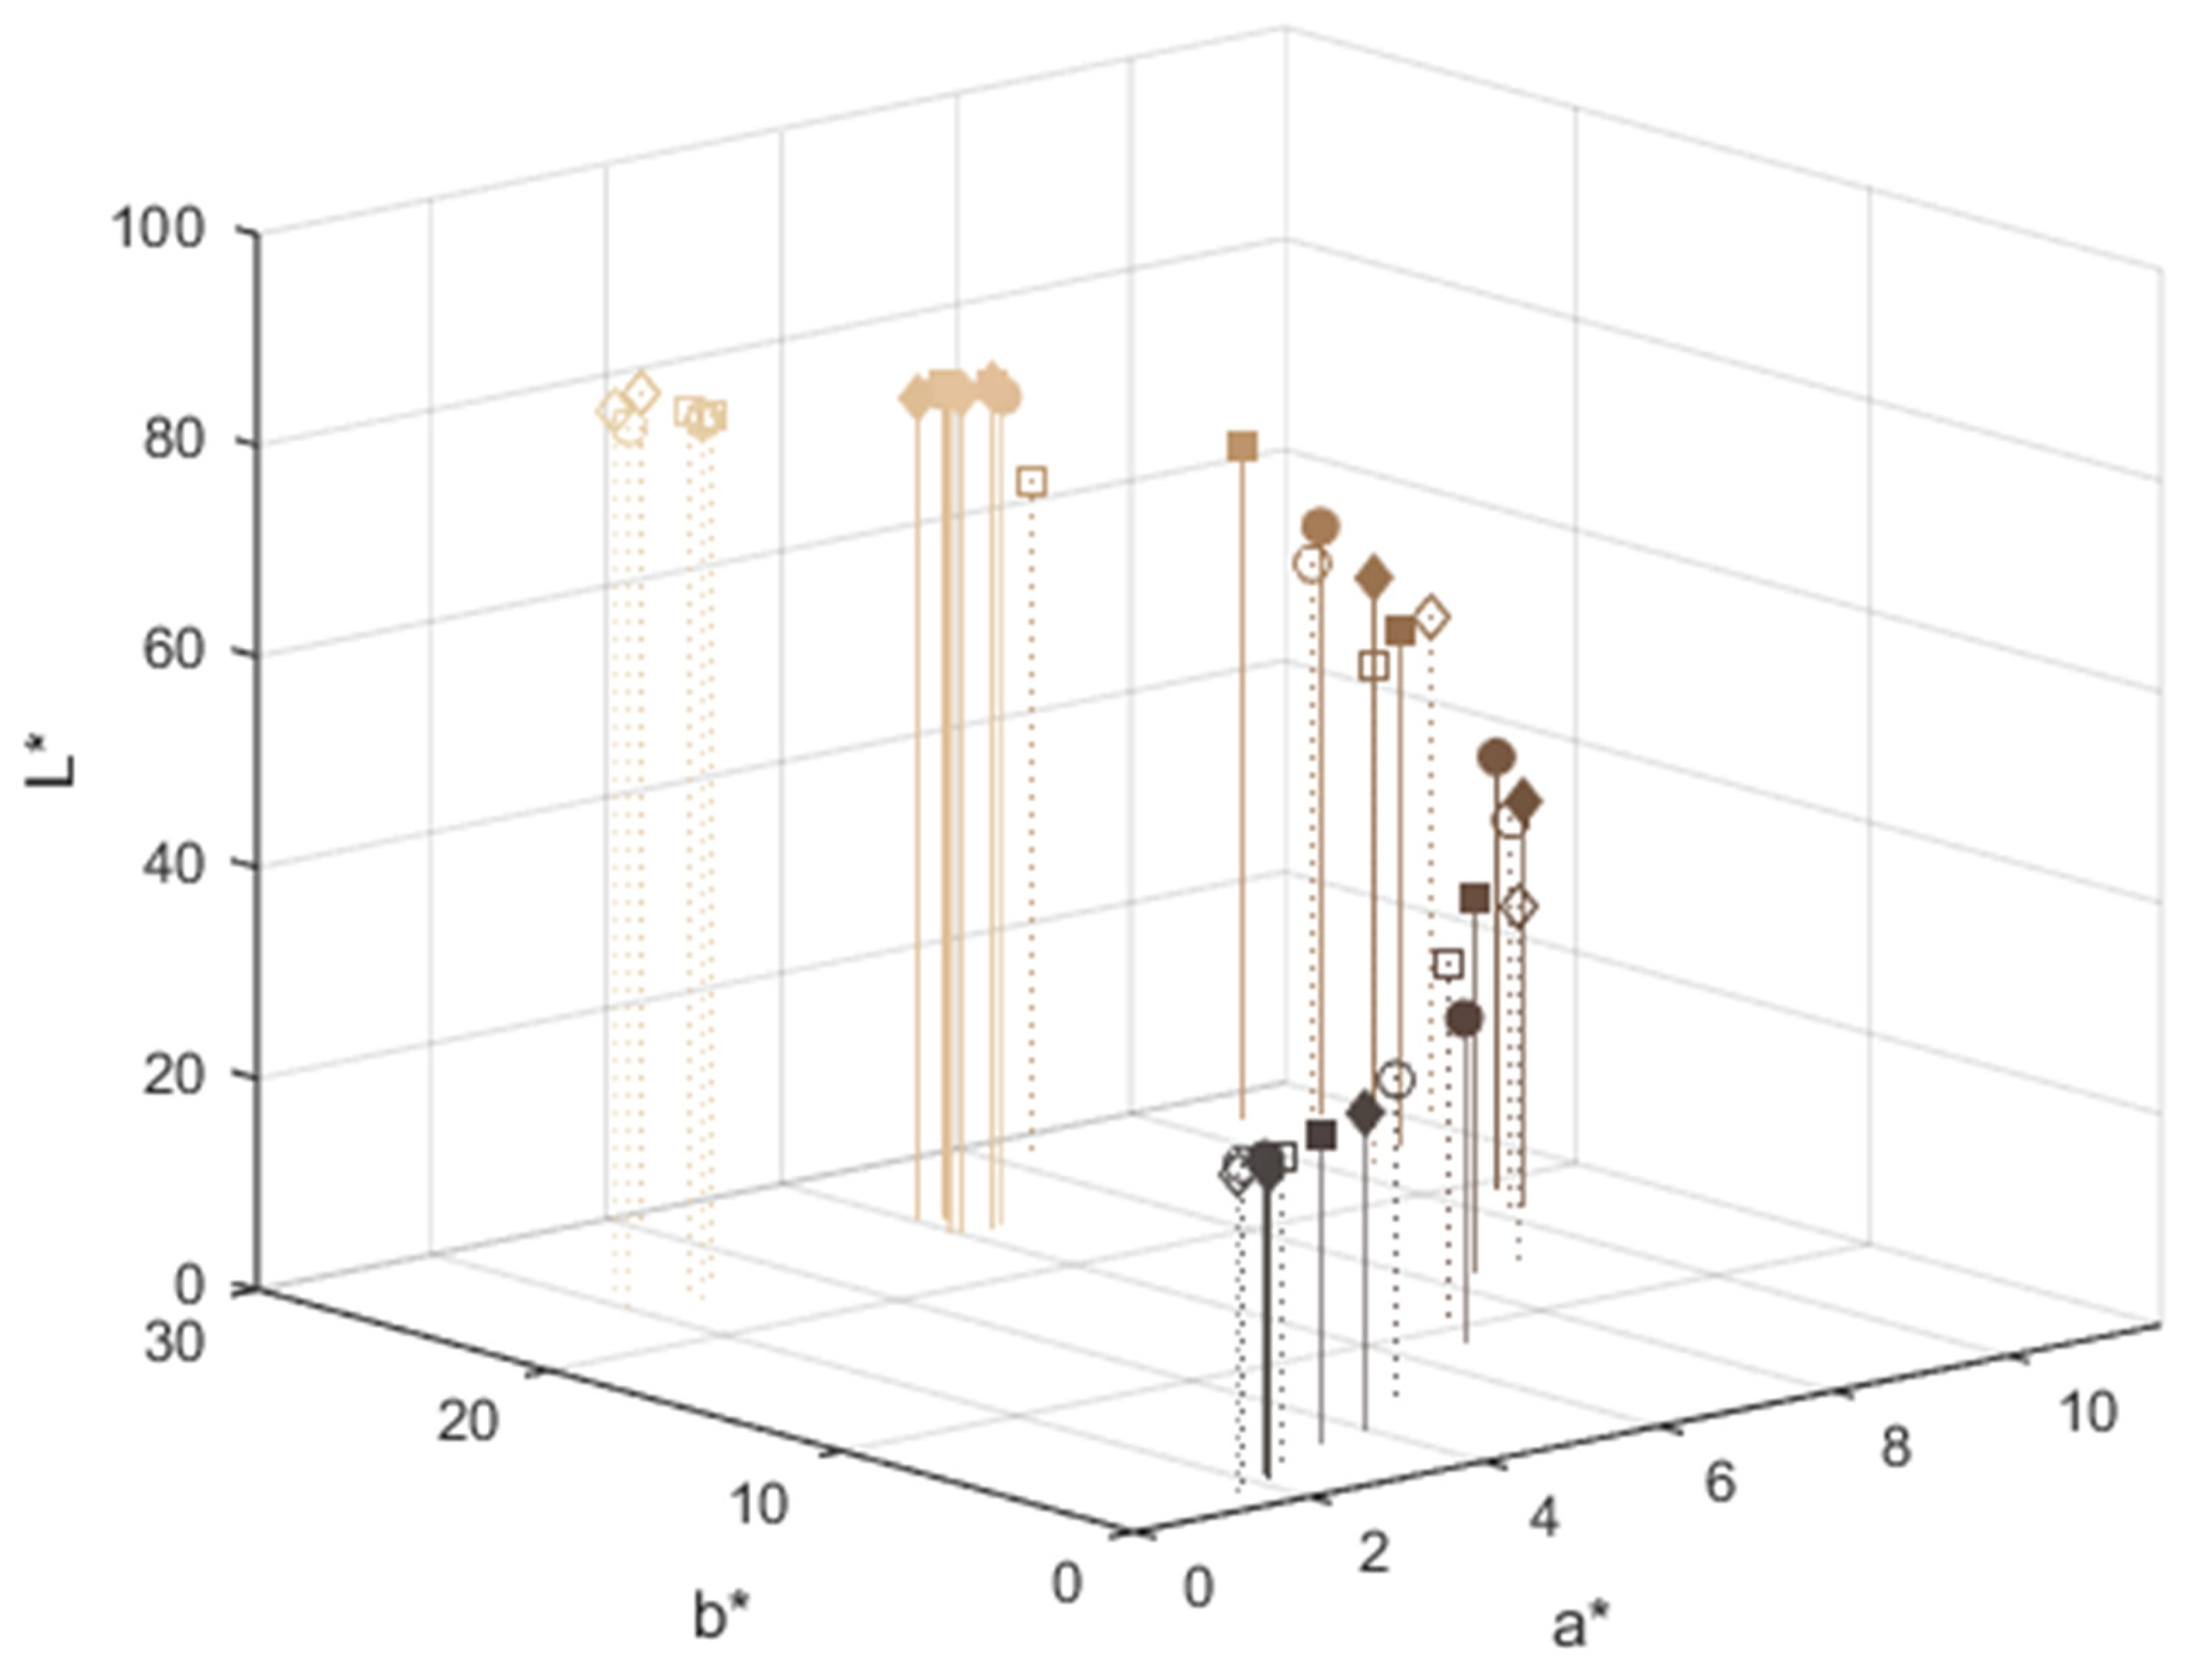
The colour of pine wood was recorded in CIEL*a*b* colour space, as seen in
Figure 9.
All three coordinates of CIEL*a*b* space showed significant changes caused by position in the trunk (heartwood or sapwood), treatment temperature (20–260 °C) and treatment time (0–5 h). The
ANOVA method confirmed statistically significant differences in the colour coordinates in the heartwood and sapwood at specified temperatures and times. A Tukey post hoc test revealed significant pairwise differences between almost all the pairs of factors, the parts of the trunk and temperature, in all three coordinates of L*, a*, and b*. The effect of temperature and the part of the trunk on colour coordinate L* is shown in the following
Table 5.
We found a statistically significant difference in a* (1 h) by both the part of the trunk (F(1, 826) = 633.05, p = 0.000) and by temperature (F(6, 826) = 708.92, p = 0.000). Similarly in b* (1 h) there was a significant difference by both factors (F(1, 826) = 43.80, p = 0.000 and F(6, 826) = 1897.37, p = 0.000). Also, the interaction effect between these factors was significant.
A multiple comparisons test confirmed that, in the case of the one-hour experiment, significant changes in the sapwood were already indicated at a temperature of 150 °C and were caused by the components of L* and b*.
The additional two experiments (3 and 5 h) also gave similar results in post hoc tests. In both, the colour change of the heartwood and the sapwood already occurred above 150 °C and was again due to the L* and b* coordinates. In the sapwood, at 5 h, there was already a change in b* between a temperature of 20 and 100 °C.
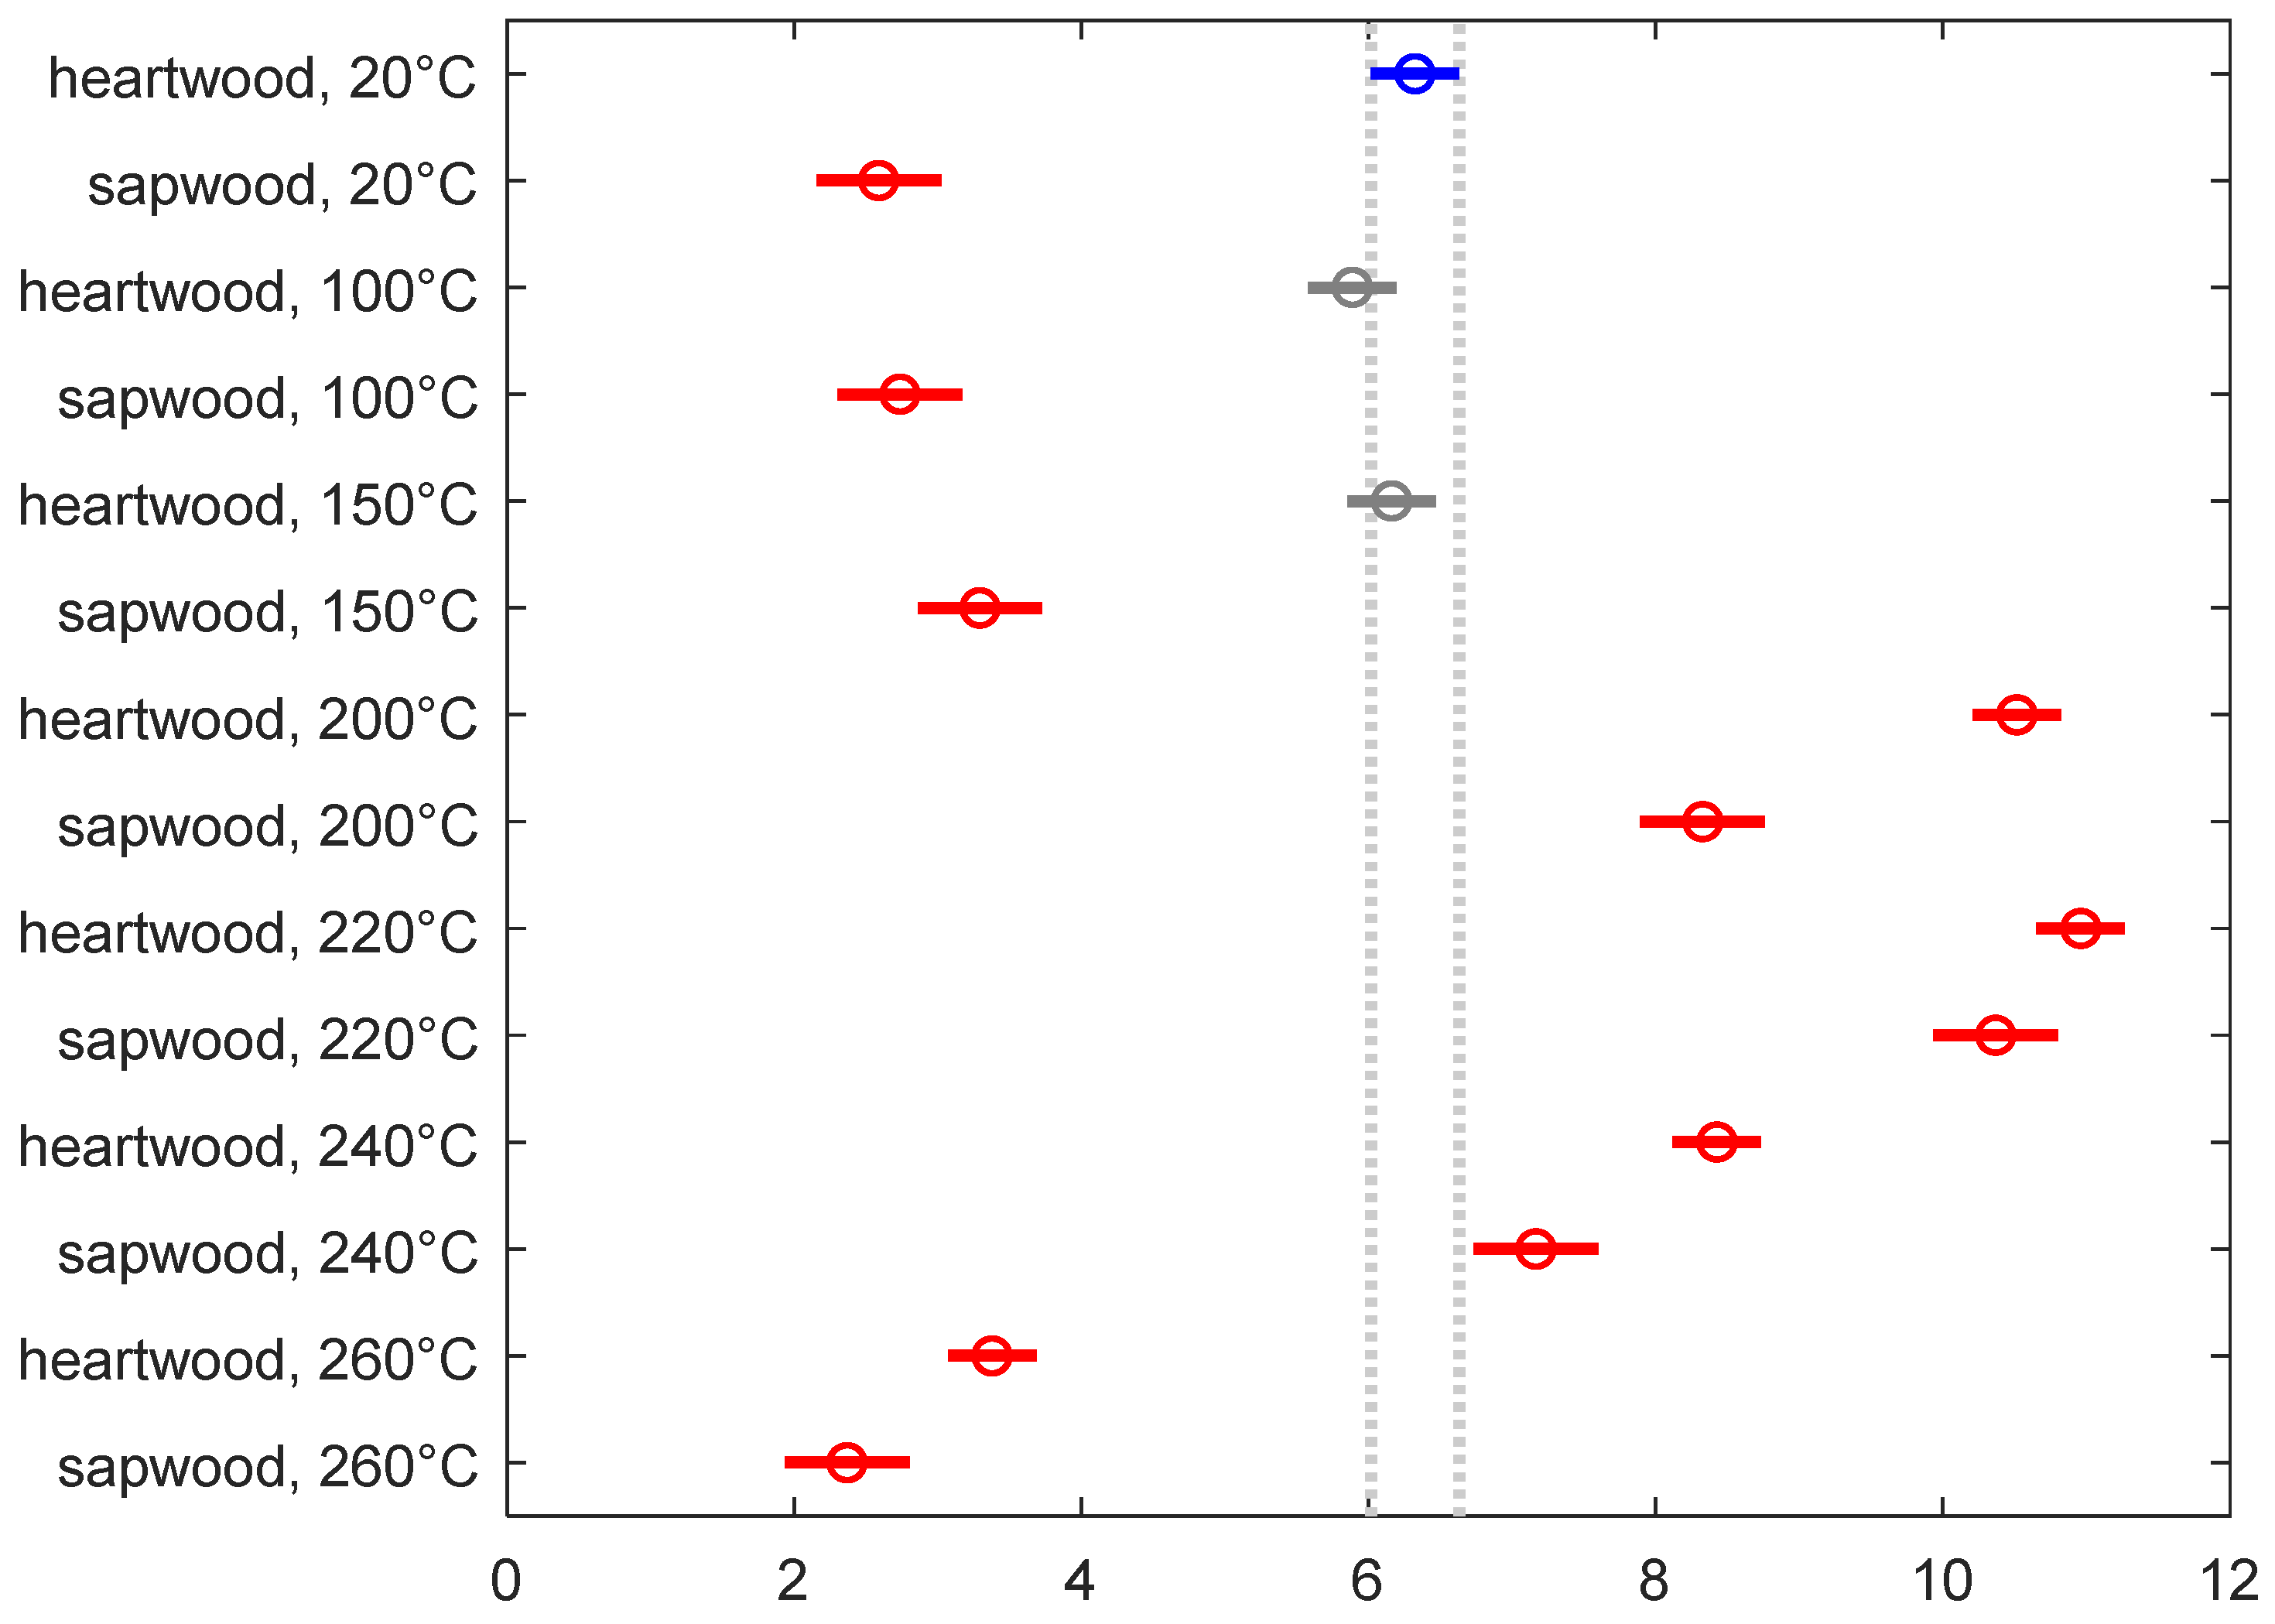
Despite general results, some significant similarities were also observed in all three coordinates and some exceptions were noted. At a temperature of 20 and 150 °C, the colour of the heartwood did not change significantly. Temperatures of 100 °C and 150 °C also showed the same colour in this trunk part (
Figure 10,
Figure 11 and
Figure 12). In the figures, each symbol indicates the group mean and confidence interval for the group. The groups that do not have significantly different means from the selected blue group appear in grey and their intervals overlap. The red symbols represent the means and confidence intervals for the groups with significantly different means from the mean of the selected blue group.
In the case of the one-hour experiment, the colour changes in both parts of the trunk at a temperature of 220 °C were not significantly different. At a temperature of 260 °C, at 3 and 5 h, a colour change was no longer indicated in either the heartwood or the sapwood (
Table 6).
The section planes of the graph in
Figure 9 are projected into coordinate planes in
Figure 13,
Figure 14,
Figure 15,
Figure 16,
Figure 17 and
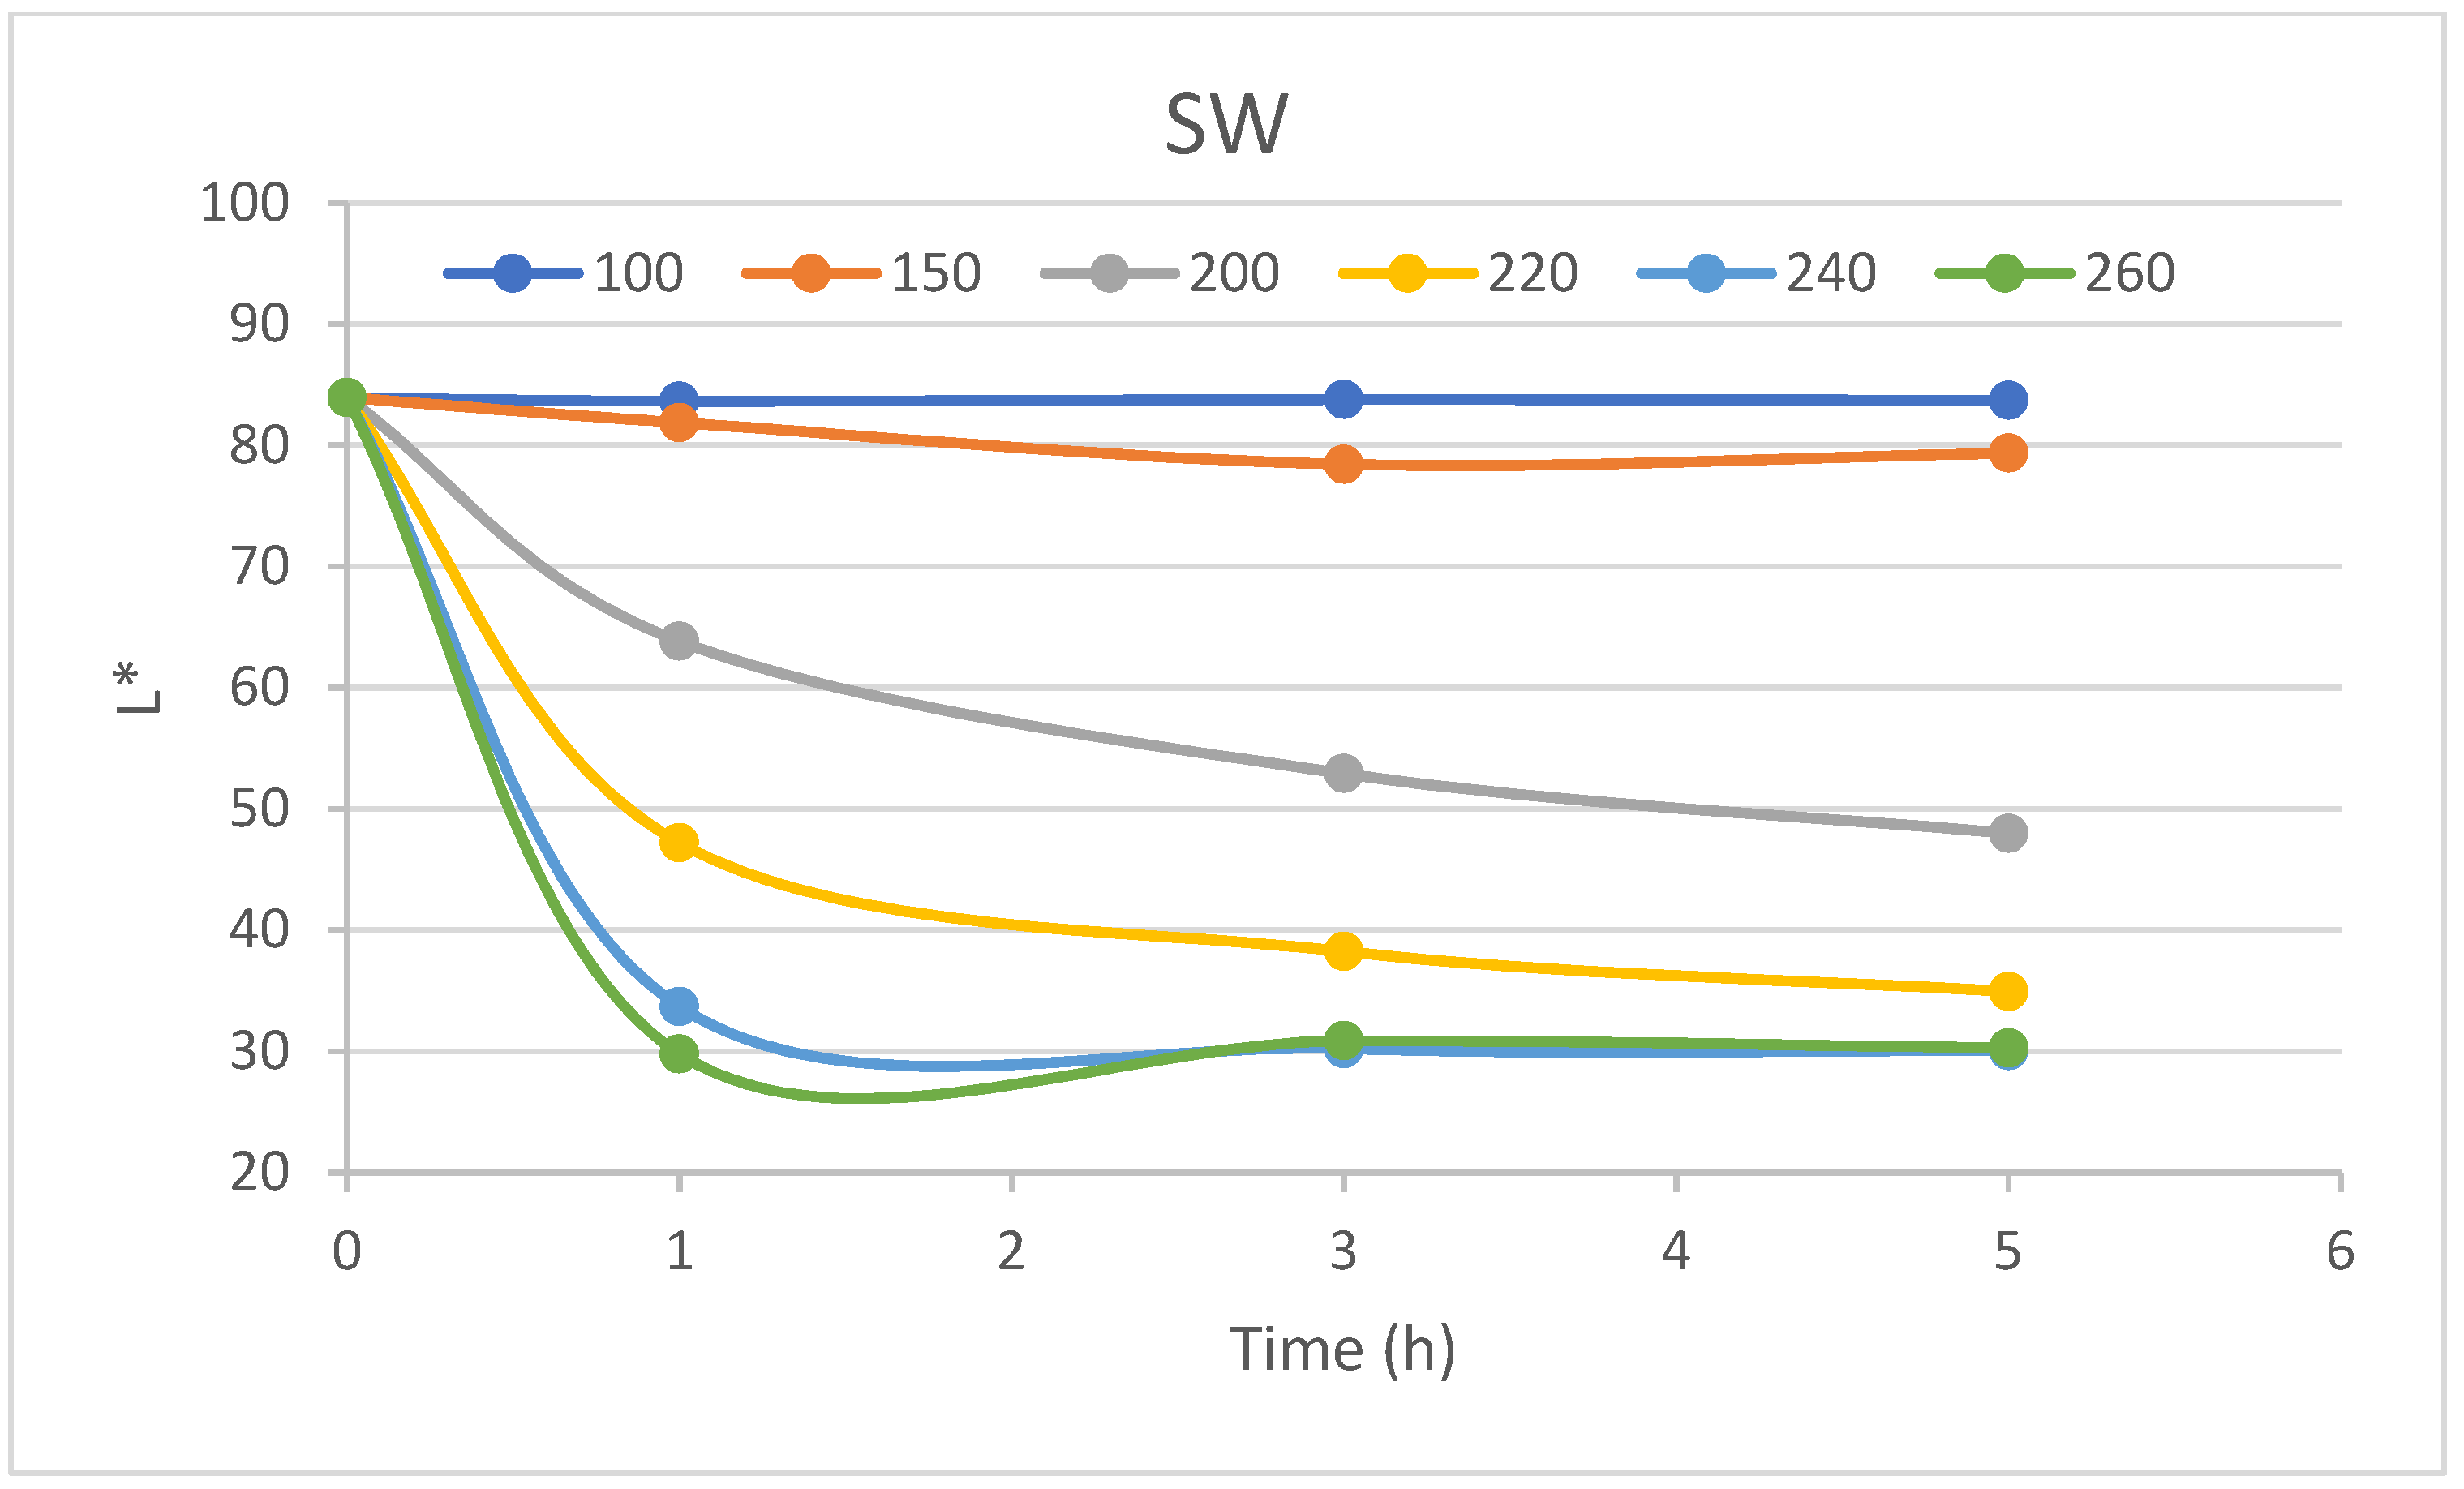
Figure 18. Their common feature is a colour coordinate change in time at constant surrounding temperature. All three colour coordinates showed the characteristic graphs of their change in time. The kinetics of lightness always showed a non-increasing character for both parts of the trunk—heartwood (HW) and sapwood (SW). The significant differences in lightness kinetic curves were observed at surrounding temperatures above 150 °C, as seen in
Figure 13 and
Figure 14. The fastest drop in lightness was always recorded during the first hour of the experiment, followed by deaccelerated periods which can converge to the unique value of lightness. This idea is promoted by almost the same lightness kinetics curves of 240 and 260 °C surrounding temperatures. The convergent values of heartwood and sapwood are the same in statistical meaning, as seen in
Table 6. The lightness value of 30 indicates the dark colour of pine wood.
The detailed analysis of the lightness convergent value involves the performance of long-duration and therefore more energy-consuming experiments, which seem inevitable as indicated in Gonzales-Peña and Hale’s 2009 article [
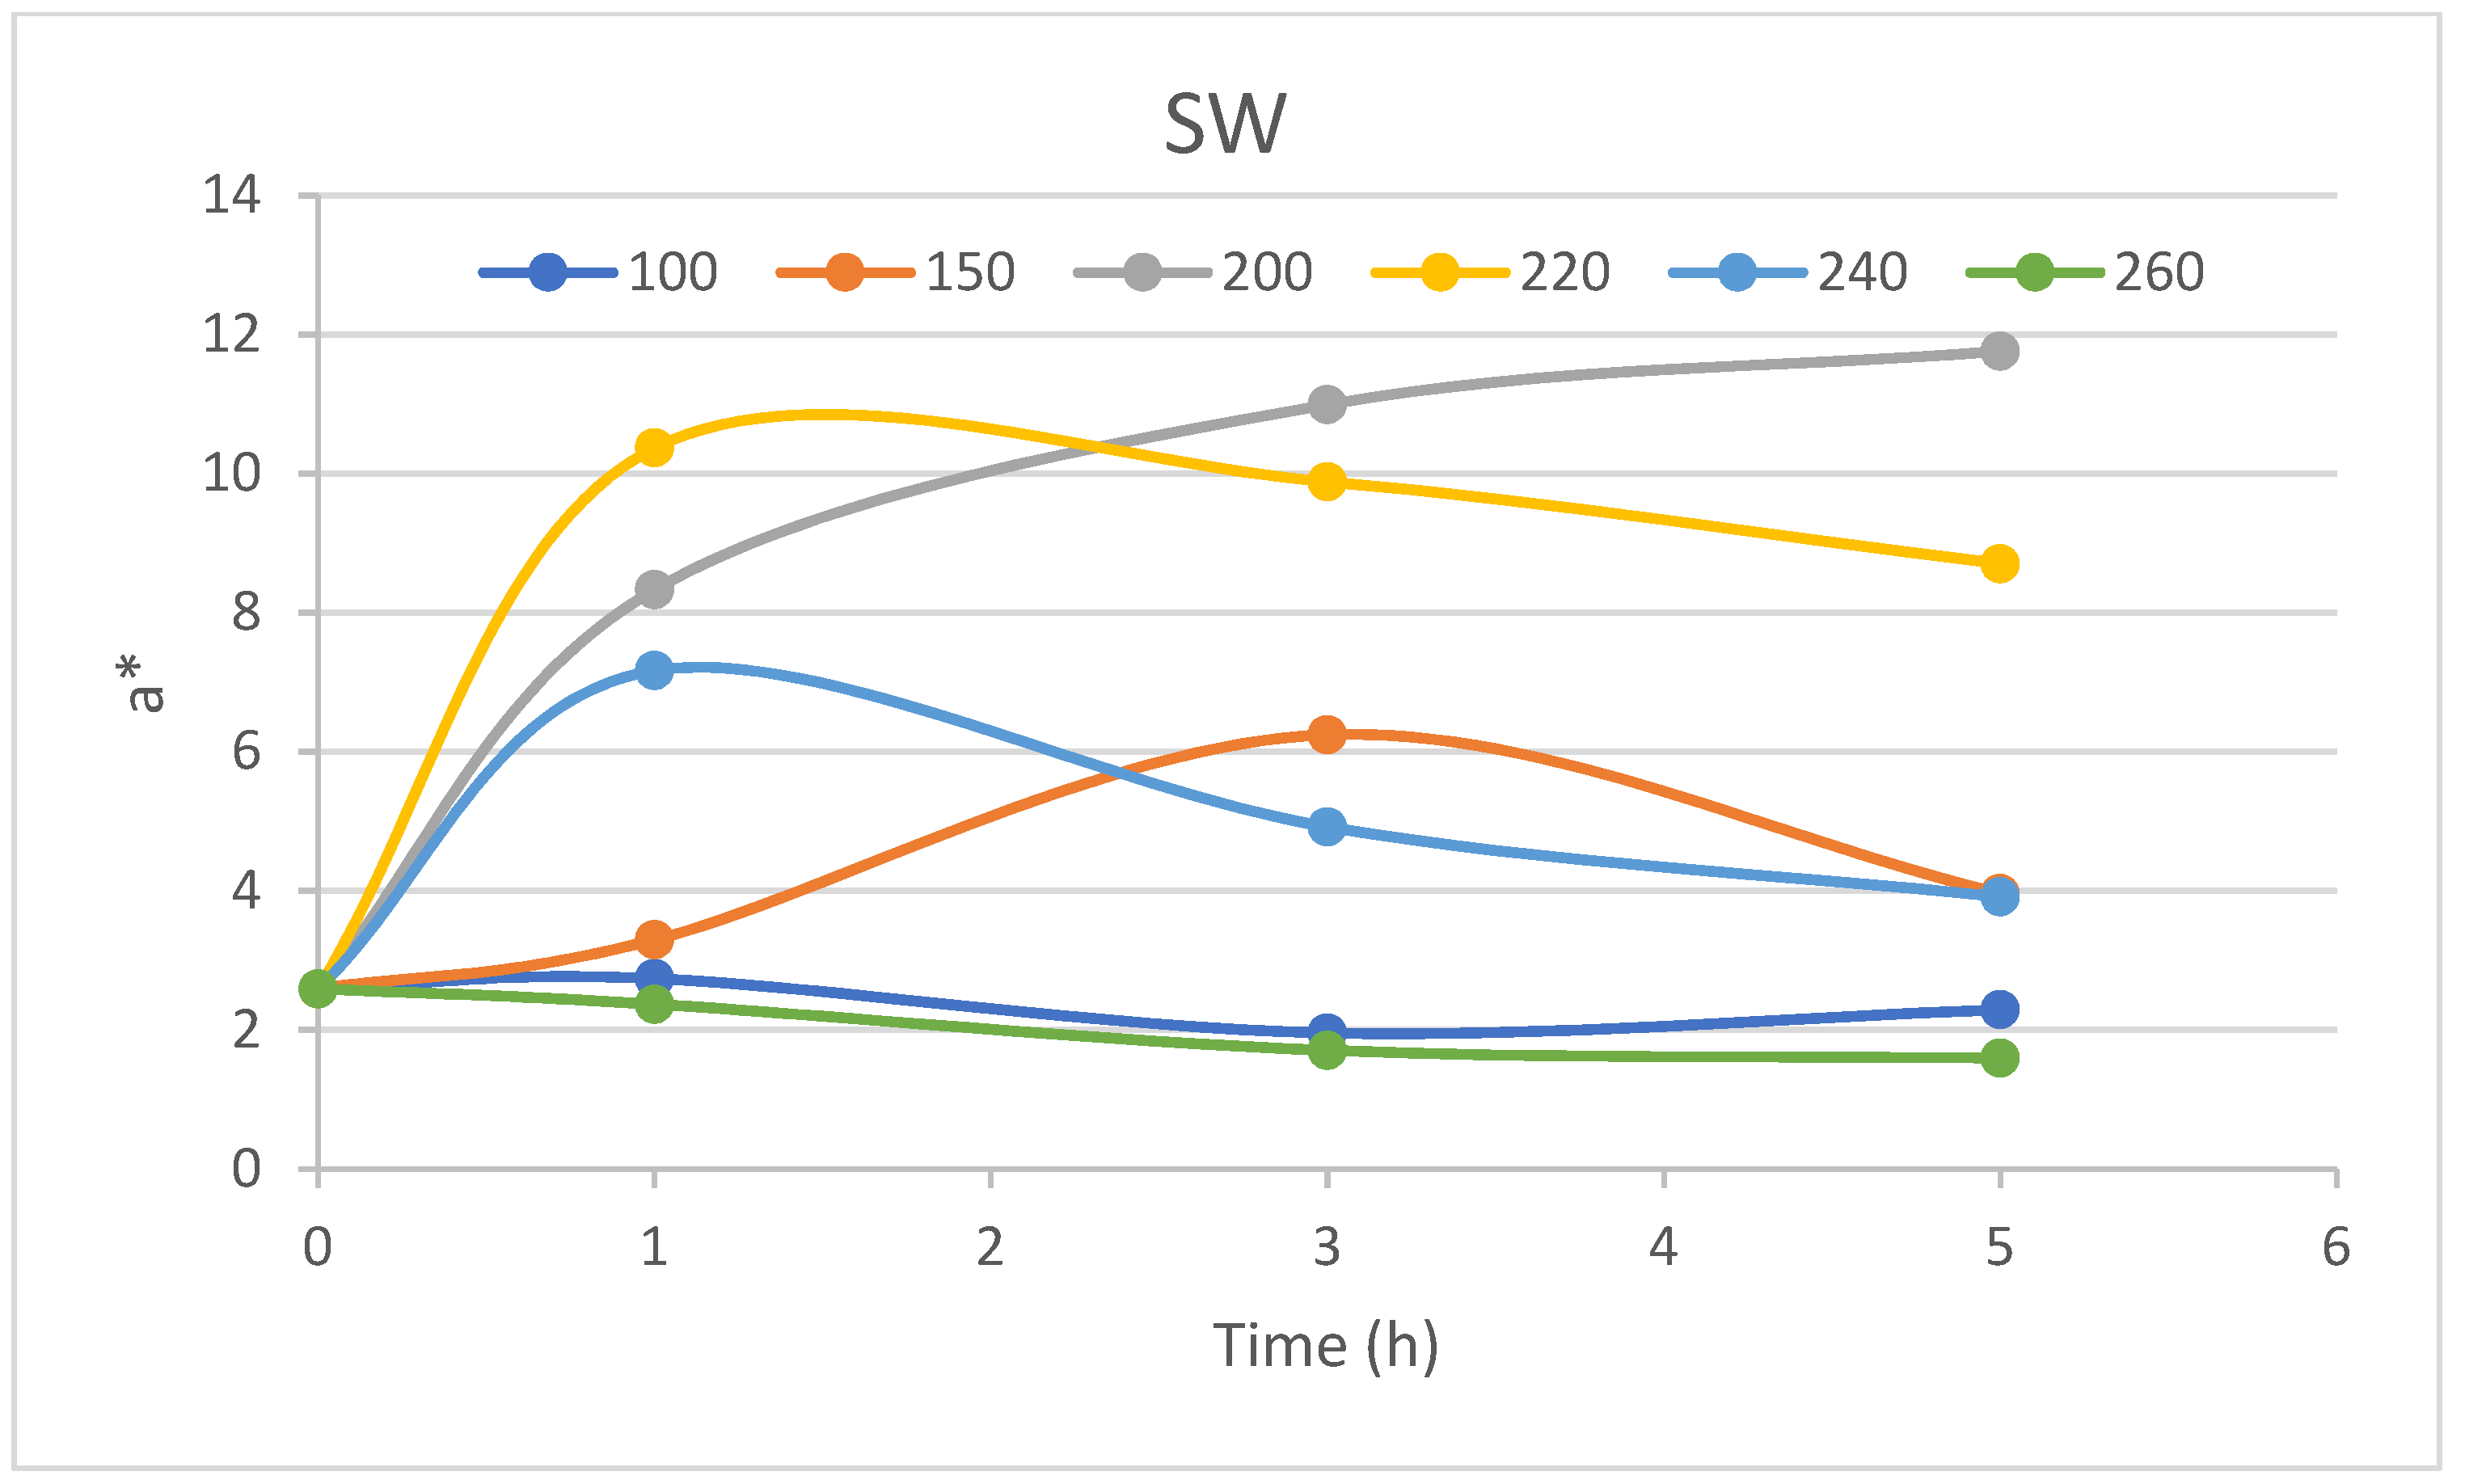
25]. The same energy-consuming experiments should be conducted for a* and b* coordinates, too. The coordinate a* kinetics showed rather different behaviour than the lightness one. The coordinate a* of heartwood was almost unchanged at 100 and 150 °C, while kinetics at other surrounding temperatures differed. All kinetics curves showed the fastest change at the beginning of the experiment. Almost all curves retained the course of change, with the curves below 220 °C having an ascending character, and those at 260 °C having descending character, except for 240 °C. The kinetics curve of 240 °C was ascending in the first hour, and then descending. Such behaviour is hardly to be explained with different insights into wood structure other than chemical composition and chemical structure. The different behaviour of sapwood a* coordinate kinetics was observed during the first five hours of the experiment. The b* value of 2 was observed as a convergent value of sapwood as well as heartwood for a surrounding temperature of 260 °C. Almost the same is true for the 100 °C kinetic curve of sapwood, as seen in
Figure 16. Other kinetic curves showed a maximum during the five hours of the experiment except for the 200 °C kinetic curve. The 150 °C kinetic curve reached the maximum at a slower rate than curves at surrounding temperatures of 200 and 220 °C. The 200 °C kinetic curve reached a maximum of 12 for both parts of the trunk, as seen in
Figure 15 and
Figure 16.
The kinetic curves of the b* coordinate showed similar graphs for the sapwood and the heartwood part of the trunk. Its values ranged in intervals of 0 to 30. The curves accelerated during the first hour of the experiment, and then they showed convergence. The exception was detected in sapwood curves of 100 and 150 °C and heartwood of 240 °C surrounding temperature. In sapwood, these two curves started to accelerate at 3 h, while in heartwood, this curve almost kept the same rate. The initial rate of change of the b* coordinate was decreasing for temperatures of 220–260 °C in sapwood. Then, this course was slowed down.
The change in pine wood colour can be expressed according to Equation (2). It can be stated that the largest significant change was in lightness, followed by coordinate b* and finally by coordinate a*. The exception of order was recorded in the change of a* and b* coordinates of the 200 °C sapwood kinetic curves.
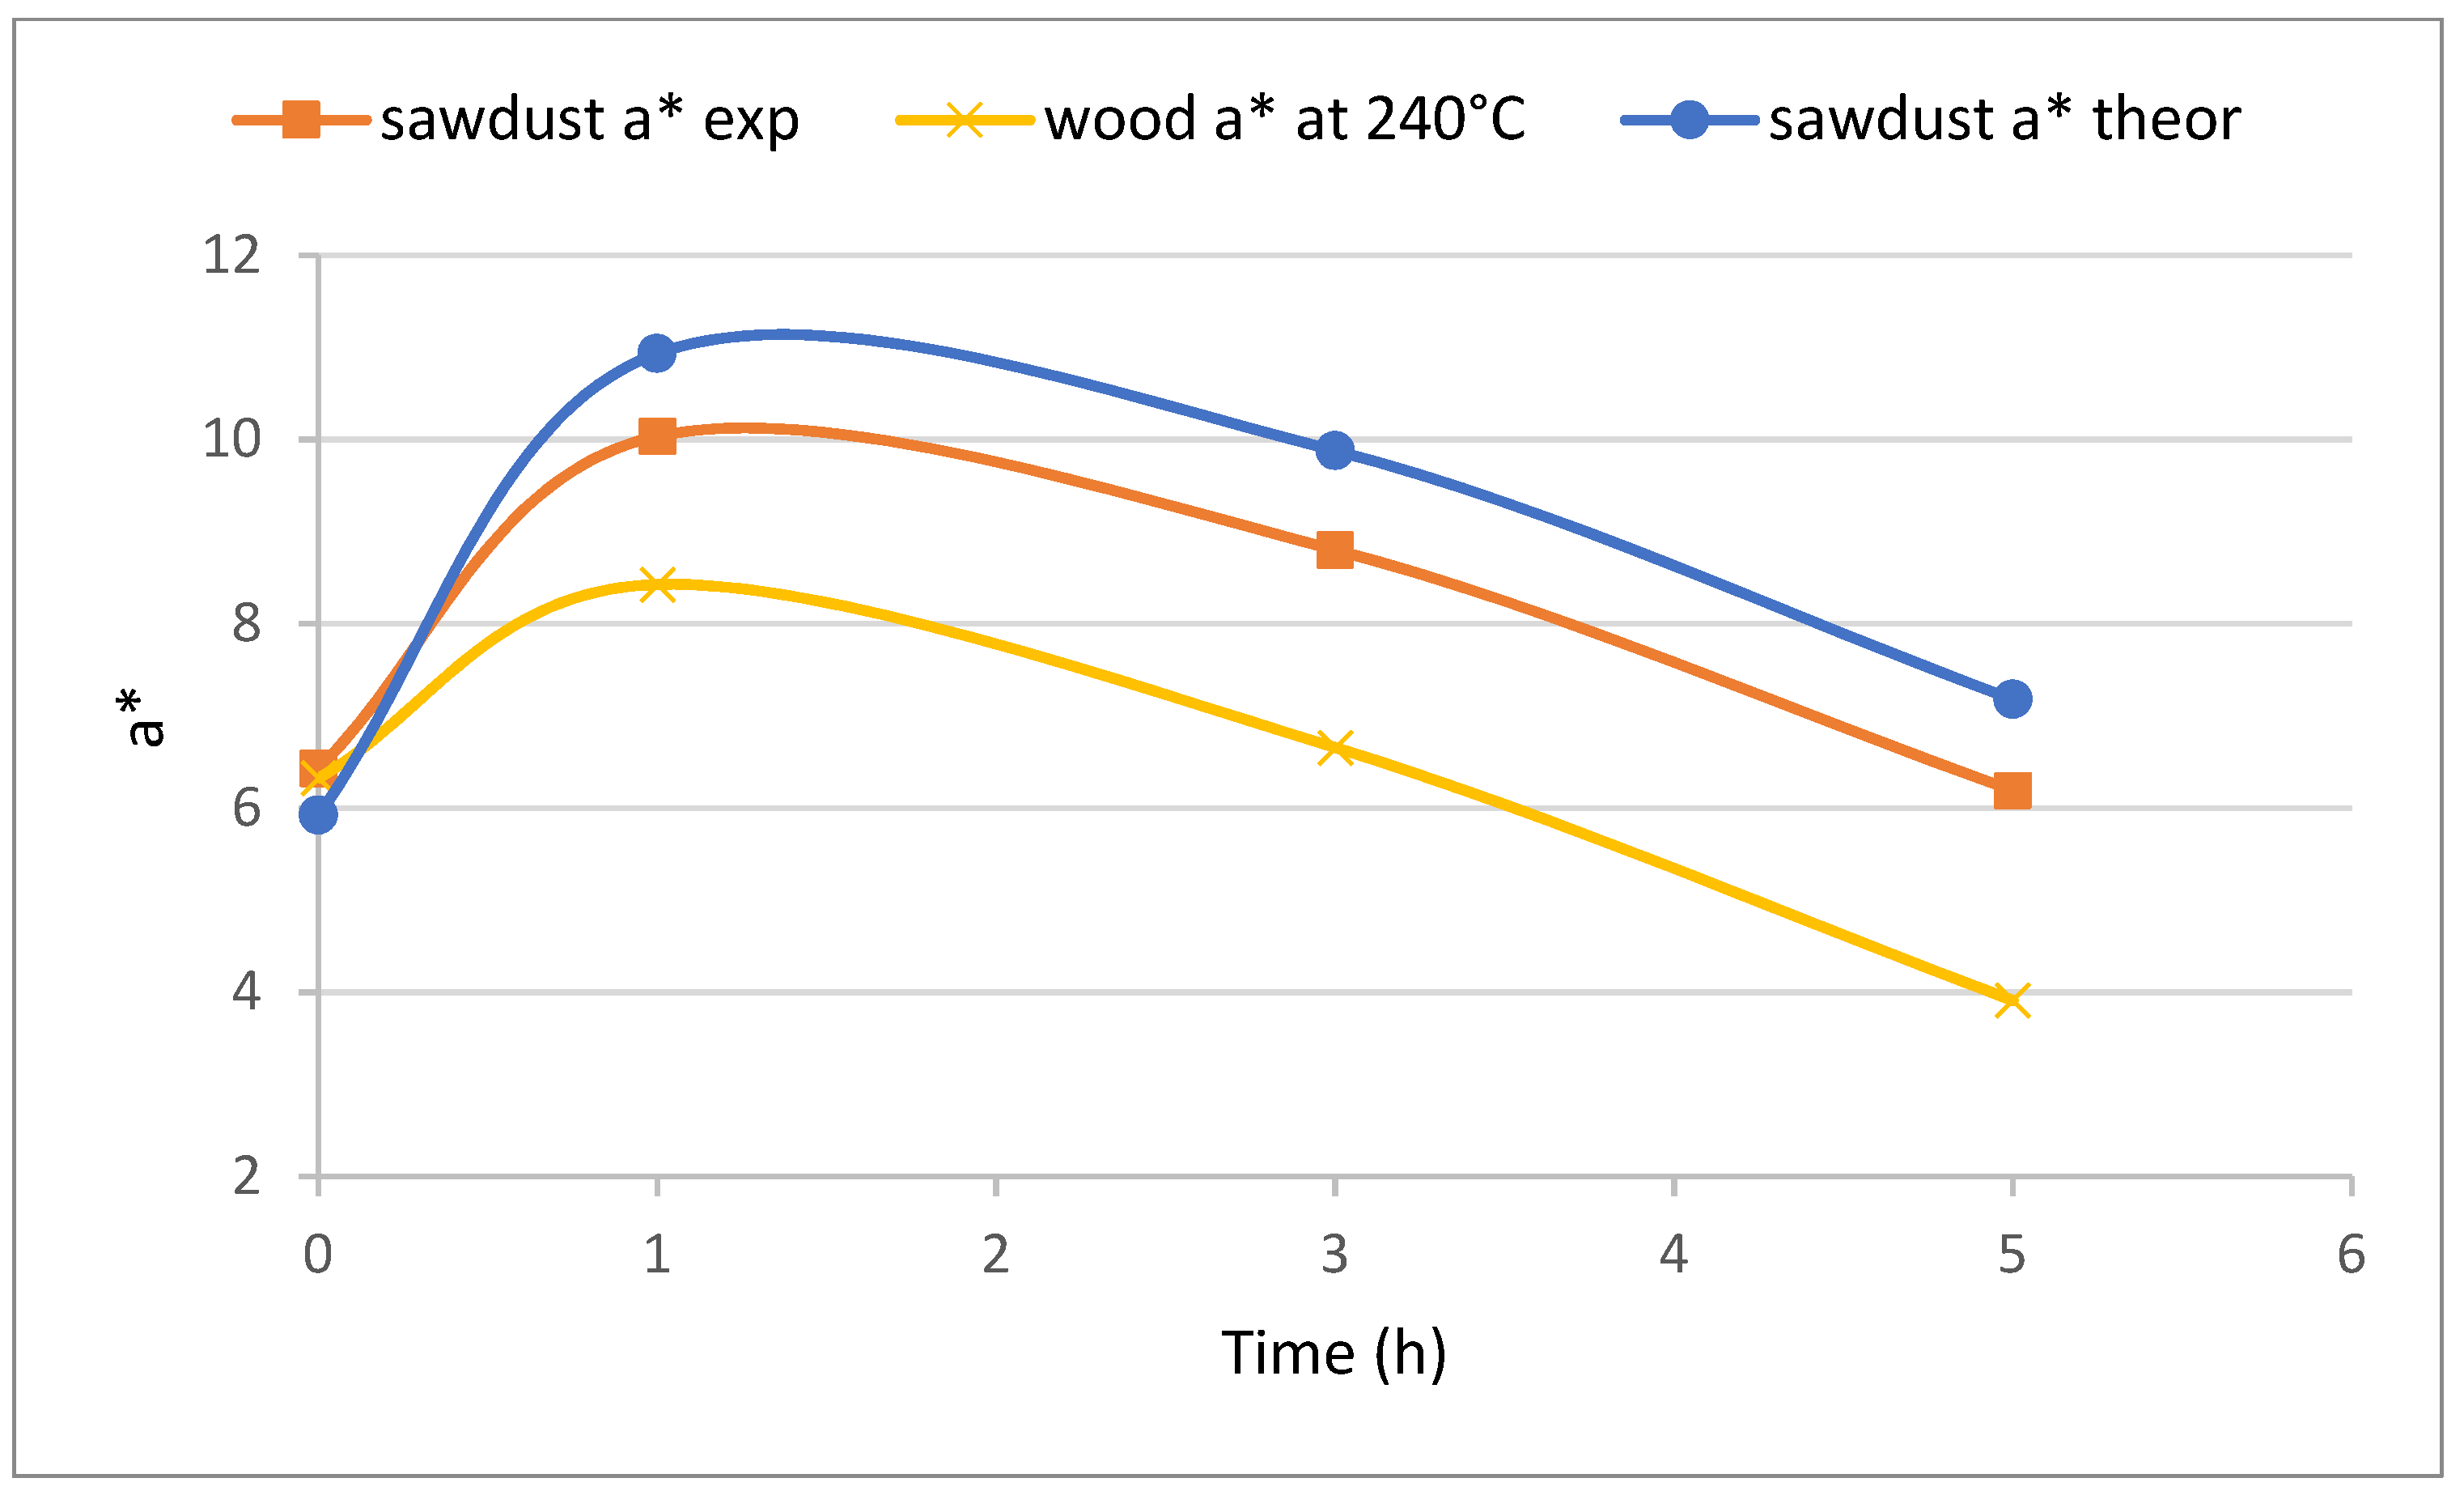
The most surprising kinetic curve was observed for the a* coordinate of heartwood at 240 °C. Therefore, the question arises of which chemical compound is responsible for such behaviour as a part of the wood substance. For an answer, we developed the model of mixing colours along with their masses, expressed as Equation (3). The XYZ space is the colour space which can be recomputed to CIEL*a*b* according to transformation formulas and vice versa [
16,
17,
18]. The computed extracted sawdust colour utilized the percentage of holocellulose and lignin in a mix according to Equation (3). Then, the computed and measured values were compared and the comparison is shown in
Figure 19.
The theoretically computed values of extracted sawdust are the largest but they copy the character of experimental values. The measured a* of wood is the smallest but it also copies the character of the previous two kinetic curves. The difference can be assigned to the colour change in extractives during the whole period of treatment or different anatomical sections [
26].
The beginning period of treatment is characterized by ascending a* in extracted sawdust which is determined by changes in holocellulose (the ascending slope in
Figure 20 for holocellulose).
Then, additional periods are characterized with descending a* in extracted sawdust which is determined by changes in lignin (the descending slope in
Figure 20 for lignin). Both changes are enhanced with the change in extractives.


