Article

Variability of Water Use Efficiency of Gmelina arborea Plantations in the Tropical Dry Forest of Colombia

by
Ana Milena López Aguirre
1,2,* and
Alonso Barrios Trilleras
2
1
Programa de Doctorado en Planificación y Manejo Ambiental de Cuencas Hidrográficas, Facultad de Ingeniería Forestal, Universidad del Tolima, Ibagué 730001-6299, Colombia
2
Departamento de Ciencias Forestales, Facultad de Ingeniería Forestal, Universidad del Tolima, Ibagué 730001-6299, Colombia
*
Author to whom correspondence should be addressed.
Forests 2024, 15(7), 1192; https://doi.org/10.3390/f15071192
Submission received: 17 June 2024 / Revised: 29 June 2024 / Accepted: 2 July 2024 / Published: 10 July 2024
(This article belongs to the Section Forest Ecology and Management)

Abstract

:
Effective forest management strategies to adapt to climate change are essential. Water use efficiency (WUE), which integrates biomass production and water consumption, is a key indicator of forest adaptation. This study evaluated the WUE of Gmelina arborea plantations in the tropical dry forest and identified the main influencing factors, with implications for silviculture and management. Data on total biomass (TB) and total volume (V) were obtained from permanent sample plots in the upper and lower Magdalena River basin in Colombia. WUE was calculated as m3 of V (WUEV) or kg of TB (WUETB) per m3 of evapotranspired water. Significant regional differences were found, with higher WUE in the Caribbean plains (WUETB = 1 kg m−3 and WUEV = 0.0018 m3 m−3) compared to the inter-Andean valleys (WUETB = 0.77 kg m−3 and WUEV = 0.013 m3 m−3). Stand variables had the greatest influence on WUE, showing positive associations with site productivity and stand density measures. Soil variables such as texture, available water, and calcium content, along with a drier climate, were crucial for achieving higher WUE. The study underscores the importance of comprehensive site selection and effective silvicultural practices to maximize WUE and productivity, especially in the context of climate change.

1. Introduction

Continued global warming has contributed to the intensification of climate change and its impacts on ecosystems and the resources available for forest growth and productivity [1,2,3,4,5]. Many forest ecosystems are currently under constant water stress and droughts, which are expected to become increasingly recurrent and severe [6], limiting water availability for forests [7].
Water limitations are reflected in forest productivity, growth rates, and resource use efficiency [8,9,10]. Low water availability can limit carbon fixation, significantly reduce biomass production, and, in extreme cases, contribute to tree mortality [11,12]. Estimating water use at the tree and stand level is becoming increasingly important for both forest management and water resource management [13]. Understanding the relationship between water requirements for biomass production is essential for adapting forest management to climate change [14]. In the literature, this relationship is referred to as water use efficiency (WUE) [15,16,17].
In general, WUE is determined by the relationship between biomass produced and water consumed, a balance that can be assessed at different levels, from instantaneous fluxes at the leaf level (e.g., photosynthesis rates vs. transpiration rates), tree level (e.g., biomass produced vs. water transpired), and stand or watershed level (e.g., yield vs. water consumed) [15,16,17,18,19,20].
This relationship between the amount of dry matter produced and the amount of water transpired depends mainly on the characteristics of the species (e.g., its genetics) and those related to the ability to optimize carbon assimilation processes and water evapotranspiration [21,22], as well as to the characteristics of the environment in which the plant grows and develops and forest management practices [23,24,25,26]. Spatial variation in net primary productivity, evapotranspiration, transpiration, and WUE has been attributed to stand variables such as forest type, stand age, stand density [14,27], and site quality [8]. Therefore, it is now important to understand the role of forest management practices, stand characteristics, and site variables with respect to WUE.
In tropical forests, water use has also been reported to depend on variables such as tree size, sapwood area, and leaf area index [13]. Among environmental variables, temperature, soil moisture, and vapor pressure deficit have been shown to have significant relationships with both growth and water use or transpiration [13,27].
Among the tree species planted in Colombia, Gmelina arborea Roxb. stands out as one of the most important. It is native to habitats ranging from the wettest to the driest in India, Bangladesh, Sri Lanka, Myanmar, Thailand, and parts of the Asian continent [28]. It is currently the second fastest-growing hardwood species, surpassed only by some species of the genus Eucalyptus [29]. In Colombia, it occupies about 20,000 ha, mainly in the plains of the Caribbean coast and in the interior of the inter-Andean valleys of the Magdalena River. G. arborea grows in the tropical dry forest, mainly characterized by limited water availability and high evaporative demand, in places where an increase in drought episodes is expected, with the expected negative consequences on productivity and resource use for forest plantations.
The productivity of plantations of this species has shown a strong correlation with climatic factors, with positive relationships with rainfall and negative relationships with temperature, evaporation, and evapotranspiration [30,31]. Evaluations conducted on juvenile and adult G. arborea trees in the Caribbean region of Colombia showed a decrease in transpiration rates, with tree age and changes in physiological traits in response to water availability [32,33]. Additionally, studies conducted under different site conditions in Latin America have linked the wilting of G. arborea apical meristems to increased drought intensity [34,35,36].
Given these scenarios, it is essential to evaluate the WUE of G. arborea plantations and to identify the main drivers of WUE between stand and site variables. The evaluation of these relationships will allow for the identification and characterization of sites with high WUE and contribute information to the generation of strategies leading to the adaptation of forest management to climate change.
The aims of this study were (i) to evaluate the variability in WUE (in biomass and volume) of G. arborea plantations grown along a gradient of the Magdalena River basin in Colombia, (ii) to investigate the association of stand and site (climatic and soil) variables with WUE (in biomass and volume) of G. arborea plantations, and (iii) to identify the key stand and site variables that exert the greatest influence on the variability in WUE.

2. Materials and Methods
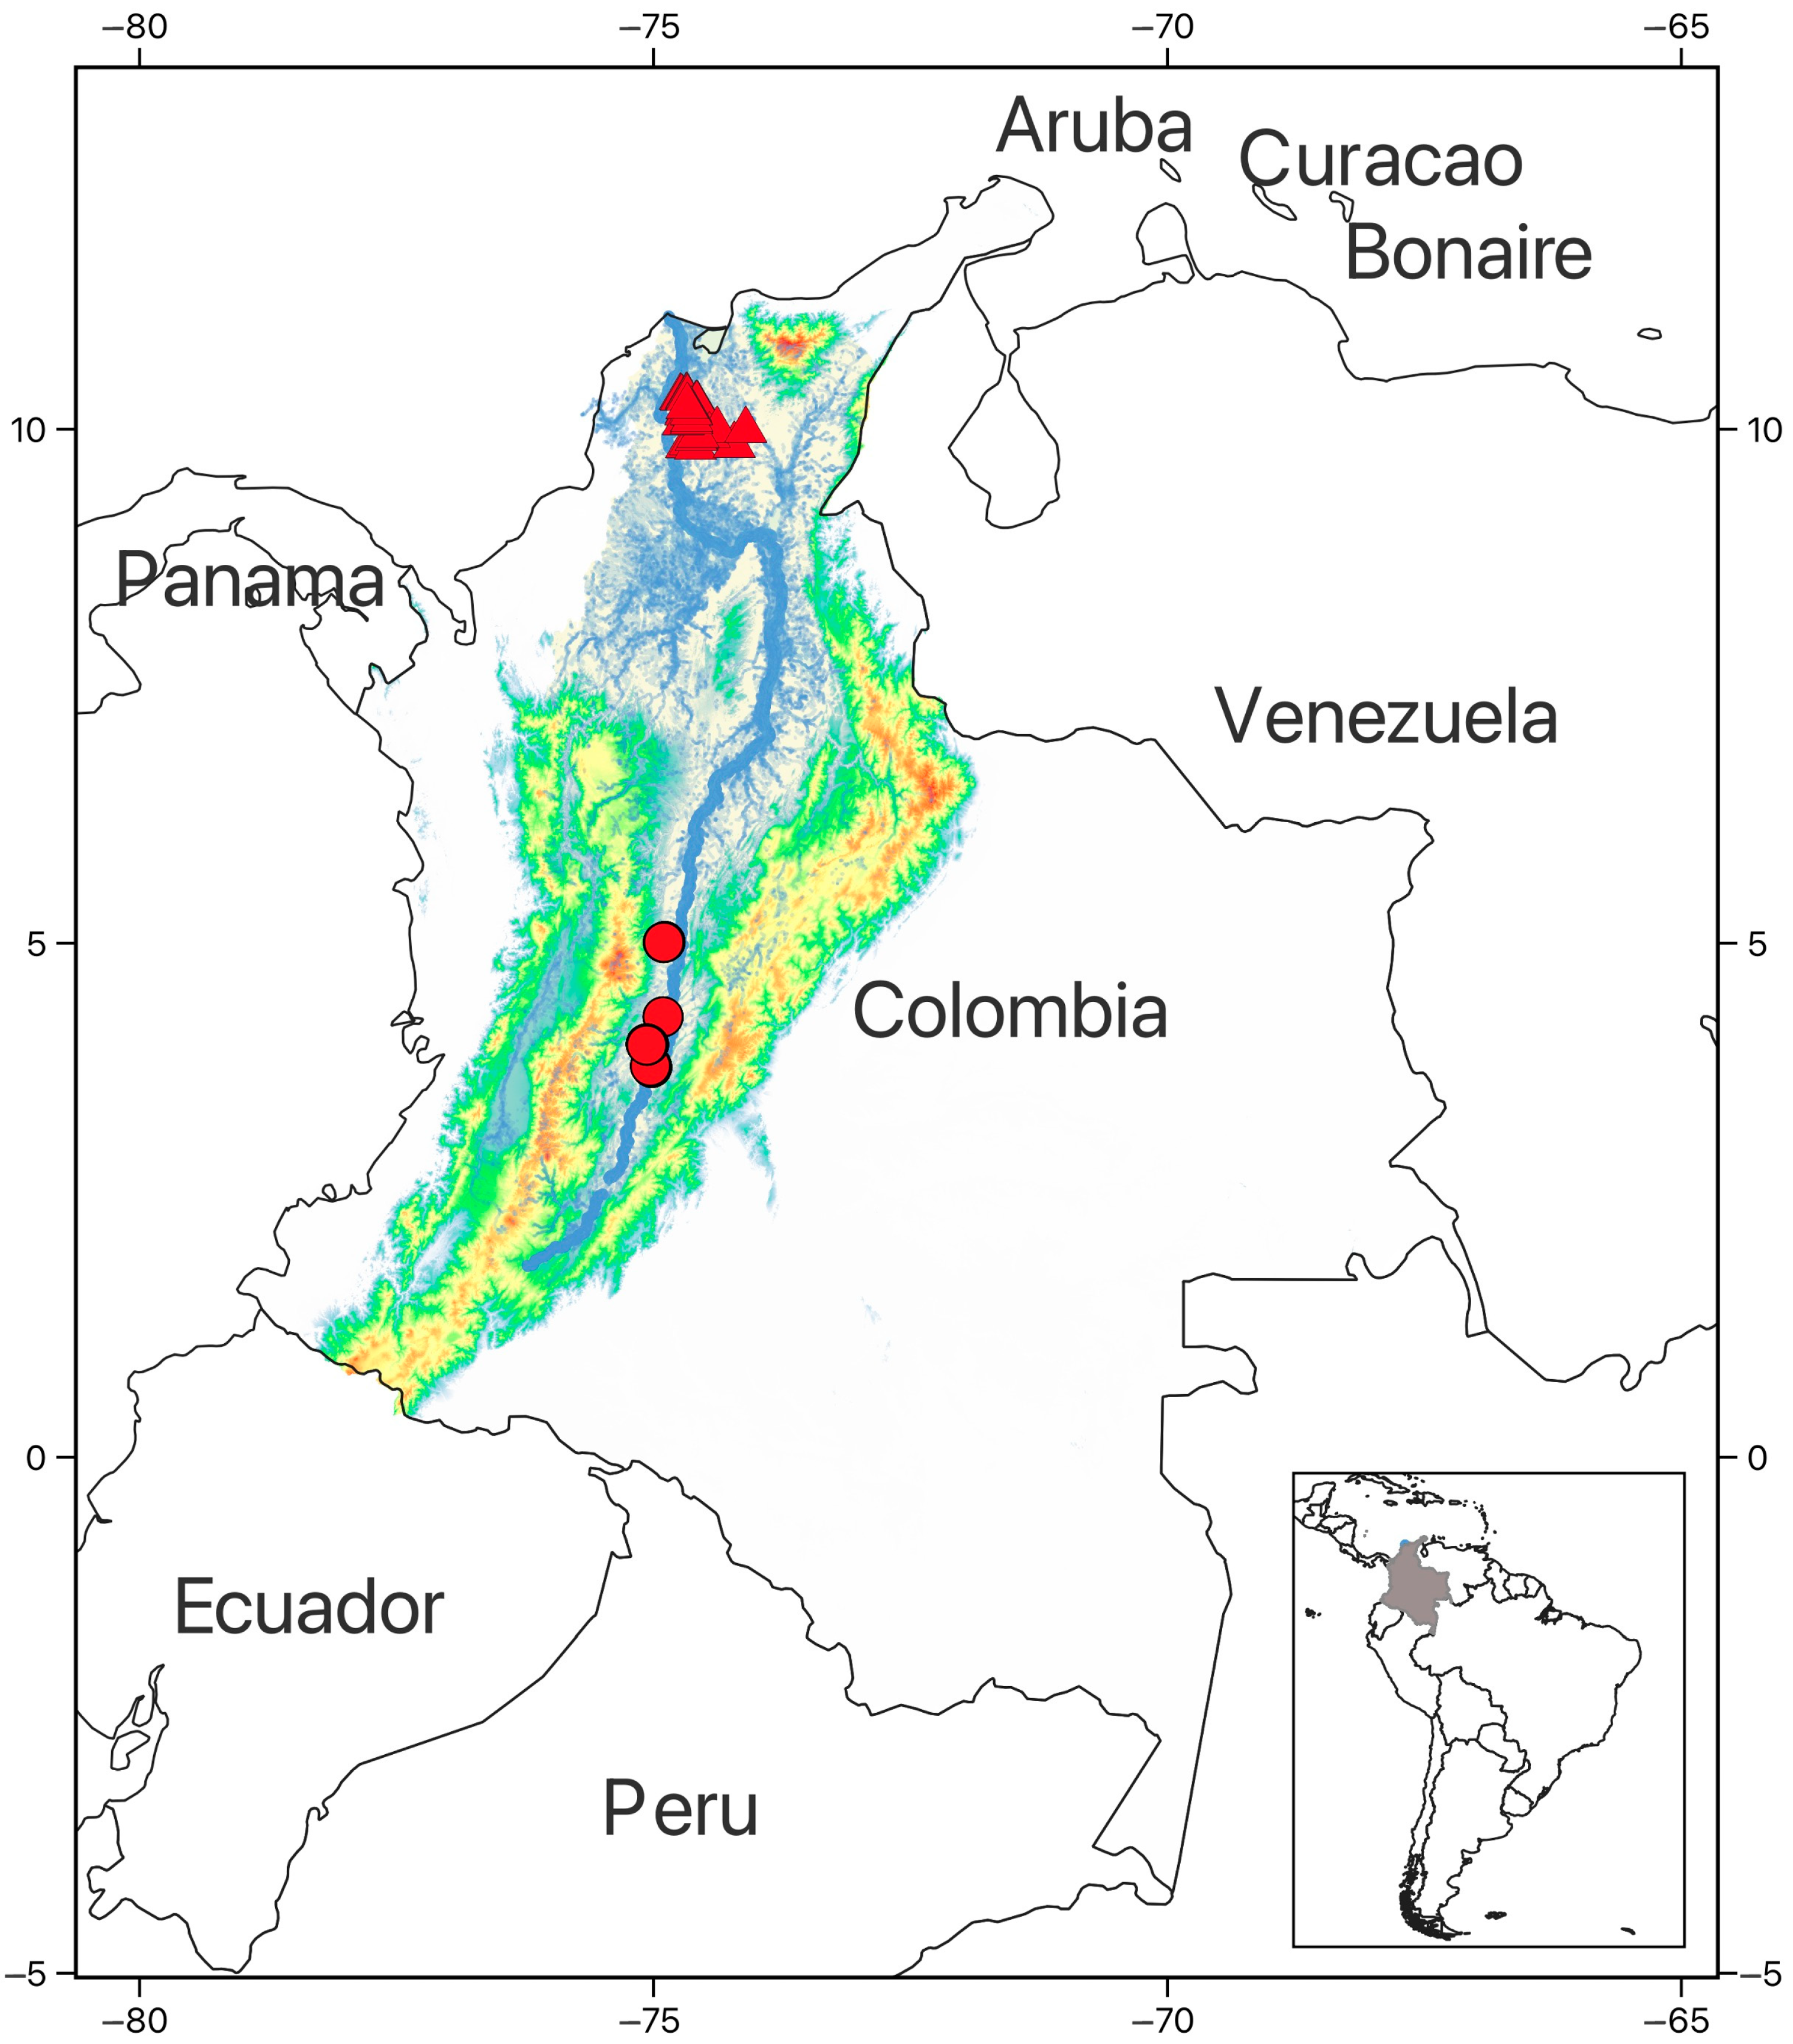
2.1. Study Area

A total of 73 stands of G. arborea were monitored along an altitudinal gradient in the Magdalena River basin, Colombia (Figure 1). These stands are located within the tropical dry forest, as classified by Holdridge’s life zone system [37]. In the lower part of the basin, on the Caribbean plains, there are 54 stands of G. arborea, with an altitude gradient between 13 and 145 m above sea level, an average annual temperature of 28.3 °C, a relative humidity of 78.6%, and an average annual rainfall of 1532 mm yr−1, with a unimodal distribution, with rainfall mainly concentrated in the months of August, September, and October. In the upper part of the basin, in the inter-Andean valleys of the Magdalena River, 19 stands are located; this region is characterized by an elevation ranging from 287 to 388 m above sea level, with an average annual temperature of 27.5 °C, relative humidity of 74%, and an average annual rainfall of 1996 mm yr−1, with a bimodal distribution, with the rainiest months being April and May for the first rainy season and October and November for the second rainy season.

2.2. Permanent Sampling Plots

The study used data from 114 permanent sampling plots (PSPs) established in 73 stands of G. arborea. The PSP network was designed to reflect the distribution of age, stand density, and productivity levels of the plantations. None of the stands showed unusual mortality events, and none were thinned. Circular plots between 500 and 800 m2 were used. The age of the stands at the time of plot establishment ranged from 1 to 12 years, with densities between 375 and 1060 trees ha−1. The PSPs were measured on two occasions with an interval of 1 to 4 years during the period between 2007 and 2014. In each plot, diameter (D) measurements were taken for all trees and heights for a sample of trees. Unmeasured heights were estimated using a local height-diameter model for each plot. The dominant height of each plot was calculated as the average height of 100 trees ha−1 with higher diameters.

2.3. Stand Variables

The stand variables used were age, calculated as the difference between the date of measurement and the date of stand establishment, stand density measured through the number of trees (N), basal area (BA), and relative spacing (RS), and productivity measured by dominant height (H), site index (SI), leaf area index (LAI), total volume per hectare (V), total biomass per hectare (TB), and mean annual increment in volume (MAIV) and biomass (MAITB) (Table 1). Tree total volume was determined using a taper function fitted by [38] to the species. Site index estimates for a base age of 10 years were made using the model fitted by [39] for G. arborea:
S I = 52.185 · 1 e 0.038 · 10 ln H 52.185 ln 1 e 0.038 · A
where SI is the site index (m), H is the dominant height (m), and A is the stand age (yr).
The aboveground (AGB) and belowground biomass (BGB) were predicted using the following equations derived from [40,41] and reported by [42]:
A G B = 2.6832 + 1156.7223 + 2.6832 1 + e 34.8699 D 6.4150
B G B = 144.4302 1 + e D 30.8573 6.5314
where ABG and BGB are the aboveground and belowground biomass (kg tree−1), respectively, and D is the diameter at breast height (cm). The total biomass (TB) was determined as the sum of AGB and BGB for each tree in the plot. The leaf area index (LAI) of each plot was calculated from the ratio of the sum of predicted tree leaf area, using a model fitted for the species [43], to the plot size.

2.4. Site Variables

2.4.1. Climatic Variables

Climatic variables were studied from 2007 to 2014, using daily data from 109 climatological stations located along the altitudinal gradient of the Magdalena River basin, obtained from the platform of the Colombian Institute of Hydrology, Meteorology, and Environmental Studies (IDEAM) (http://dhime.ideam.gov.co, accessed on 10 January 2024). For each PSP, daily values of climatic variables were obtained using a geometric mean with all stations around the central point of each plot, using the methodology described by [44]. This methodology uses values weighted by the inverse of the distance and elevation differences between the climatological station and the central point of each PSP. The search radius for applying the geometric mean varied according to the availability of information for each variable of interest (e.g., a radius of 25 km was used for rainfall, but a radius of 200 km was used for net solar radiation).
From the daily climatic information generated for each PSP, values of precipitation (Pm), mean (Tm), minimum (Tmn), and maximum (Tmx) air temperature, relative humidity (RH), wind speed (Ws), and net solar radiation (Rn) were determined (Table 2). From these variables, the vapor pressure deficit (VPD) and the reference evapotranspiration (ET0) and actual evapotranspiration (ETa) were determined. VPD was calculated as [45]
V P D = 1 R H · 0.611 · e 17.502 · T m 240.97 + T m
where VPD is the vapor pressure deficit (kPa), Tm is the mean air temperature (°C), and RH is the relative humidity of the air (%).
Reference evapotranspiration was determined using the FAO Penman–Monteith method [46]:
E T 0 = 0.408 · · R n G + γ · 900 T m + 273 W s · e s e a + γ · 1 + 0.34 · W s
where ET0 is the reference evapotranspiration (mm d−1), Rn is the net radiation (MJ m−2 d−1), G is the soil heat flux (MJ m−2 d−1), (es − ea) is the vapor pressure deficit of the air (kPa), ∆ is the slope of the saturation vapor pressure curve (kPa °C−1), γ is the psychrometric constant (kPa °C−1), Tm is the mean temperature (°C), and Ws is the wind speed (m s−1).
The actual evapotranspiration (ETa) was calculated as E T a = E T 0 · K c [46]. This method accounts for the relationship between reference evapotranspiration (ET0) and a crop coefficient (Kc) specific to the crop. In this study, a Kc = 0.871 was used, derived from transpiration measurements on trees of the same species obtained via sapflow techniques and ET0 data. Additionally, an aridity index (AI) was calculated as the ratio between Pm and ET0.

2.4.2. Soil Variables

Soil samples were collected during plot establishment and analyzed from the top layer to a depth of 30 cm for each of the monitored stands. The soil variables analyzed were texture (Tex), available water capacity (AWC), soil pH, organic matter (OM), phosphorus content (P), potassium content (K), cation exchange capacity (CEC), calcium content (Ca), magnesium content (Mg), and sodium content (Na) (Table 3). For statistical analysis, textural classes were classified according to their available water capacity in the following order: 1 = clay; 2 = loamy clay; 3 = clay loam; 4 = sandy clay; 5 = clay loamy sand; 6 = loam; 7 = loamy sand; 8 = sandy clay loam; 9 = silt loam; 10 = sandy loam; 11 = loamy sand; 12 = sand [47].

2.5. Water Use Efficiency

WUE was expressed as the amount of biomass or stem wood produced per unit of water evapotranspired [15,16,17,18,19,20]. To provide a comprehensive understanding of WUE, we calculated it using two distinct measures: WUETB, which represents the efficiency in terms of total biomass production, and WUEV, which represents the efficiency in terms of stem wood volume production. These two measures capture different aspects of forest productivity and resource use. WUETB (kg m−3 H2O) reflects the overall growth efficiency, including leaves, branches, stem, and roots, thus providing a holistic view of the ecosystem’s WUE. In contrast, WUEV (m3 m−3 H2O) focuses specifically on the economically valuable component of the forest, the stem wood, which is critical for timber production and forest management. By evaluating both measures, we can better understand the trade-offs and synergies between overall biomass production and stem wood volume in relation to water use, thereby informing more sustainable forest management practices. WUE was calculated for each PSP using the following relationships:
W U E T B = i T B E T a
W U E V = i V E T a
where WUETB (kg m−3 H2O, i.e., kg of biomass per m3 of water evapotranspired) and WUEV (m3 m−3 H2O, i.e., m3 of solid wood per m3 of water evapotranspired) represent the water use efficiency in biomass and volume, respectively, iTB and iV are the increments in total biomass and stem wood volume between the first and last measurement of each PSP, and ETa is the accumulated actual evapotranspiration between the date of the first and last measurement in each PSP.

2.6. Data Analysis

All analyses were performed using the statistical software R version 4.4.1 [48] and R-studio version 2024.04.2+764 [49]. A t-Student test was performed to examine differences between stand and site variables and WUE (in biomass and volume) for stands located in the lower basin of the Caribbean plains and in the inter-Andean valleys (upper basin) of the Magdalena River. To ensure the assumptions of parametric tests were met, we evaluated normality using Q–Q plots and assessed homogeneity of variances with Levene’s test. Any issues with non-normality and heteroscedasticity were addressed with log transformations when necessary. Furthermore, a bivariate Pearson correlation analysis was performed to investigate the relationship between WUE and stand and site variables.
Additionally, a canonical correlation analysis (CCA) was performed to identify stand and site (climate and soil) variables that drive WUE. The CCA statistical approach was used because it facilitates the study of relationships between sets of multiple dependent and independent variables [50]. CCA allows for the generation of two main outcomes: the ‘‘canonical variables’’, which represent the optimal linear combinations of dependent and independent variables, and the ‘‘canonical correlation’’, which represents the strength of the relationship between them [51,52].
For the CCA analysis, the random vector consisting of all the variables in the study was divided into two sets of variables, the vector x’ = [x1, x2, …, xq], consisting of the 33 stand and site variables analyzed, and the vector y’ = [y1, y2, …, yq], consisting of WUETB and WUEV.
The approach used in CCA considers that the association between x and y is the highest correlation between two single variables uk and vk derived from x and y, where uk = a’k x is a linear combination of the variables x, and vk = b’k y is a linear combination of the variables y. The number of pairs of canonical variables is limited to the smaller dimension between x’ and y’ (k = 1, …, s) [53], in our case, s = 2, as this was the smallest number of variables between the vector x’ and y’; therefore, the maximum number of pairs of canonical variables was two.
The vectors a’k and b’k (k = 1, …, s) of the canonical variables (uk, vk), which define the required linear combinations of the variables x and y, are found as the eigenvectors of the matrices E1(q1 × q1) and E2(q2 × q2) defined as
E 1 = R 11 1 R 12 R 22 1 R 21 , E 2 = R 22 1 R 21 R 11 1 R 12 ,
where R11 is the correlation matrix of the variables in set x, R22 is the correlation matrix of the variables in set y, and R12 (= R21) is the q1 × q2 matrix of the correlations between the two sets of variables. The canonical correlations R1, R2, …, Rs are obtained as the square roots of the non-null eigenvalues of E1 or E2. These s canonical correlations express the association between the variables x and y once the correlation within the set is removed [53].
To test the significance of each canonical correlation coefficient, we used the Wilks’ Lambda test, which tests the sequential hypotheses that the k-th and all subsequent canonical correlations are null. Wilks’ lambda values are calculated from the eigenvalues and converted to F-statistics using Rao’s approximation [48].
Because our goal was to determine whether a relationship existed and how strong it was, and then to identify the original variables that exerted greater influence on WUE, in the study, only the first pair of canonical variables (u1, v1) (i.e., the strongest canonical correlation) was included in the analysis and discussion of results in the study. Additionally, to aid in the understanding and interpretation of the canonical variables (u1, v1), correlation coefficients were calculated between the canonical variables and each of the original variables in their respective set (canonical loadings) and the other set of variables (canonical cross-loadings).

3. Results

3.1. Regional Variations in Stand and Site Variables
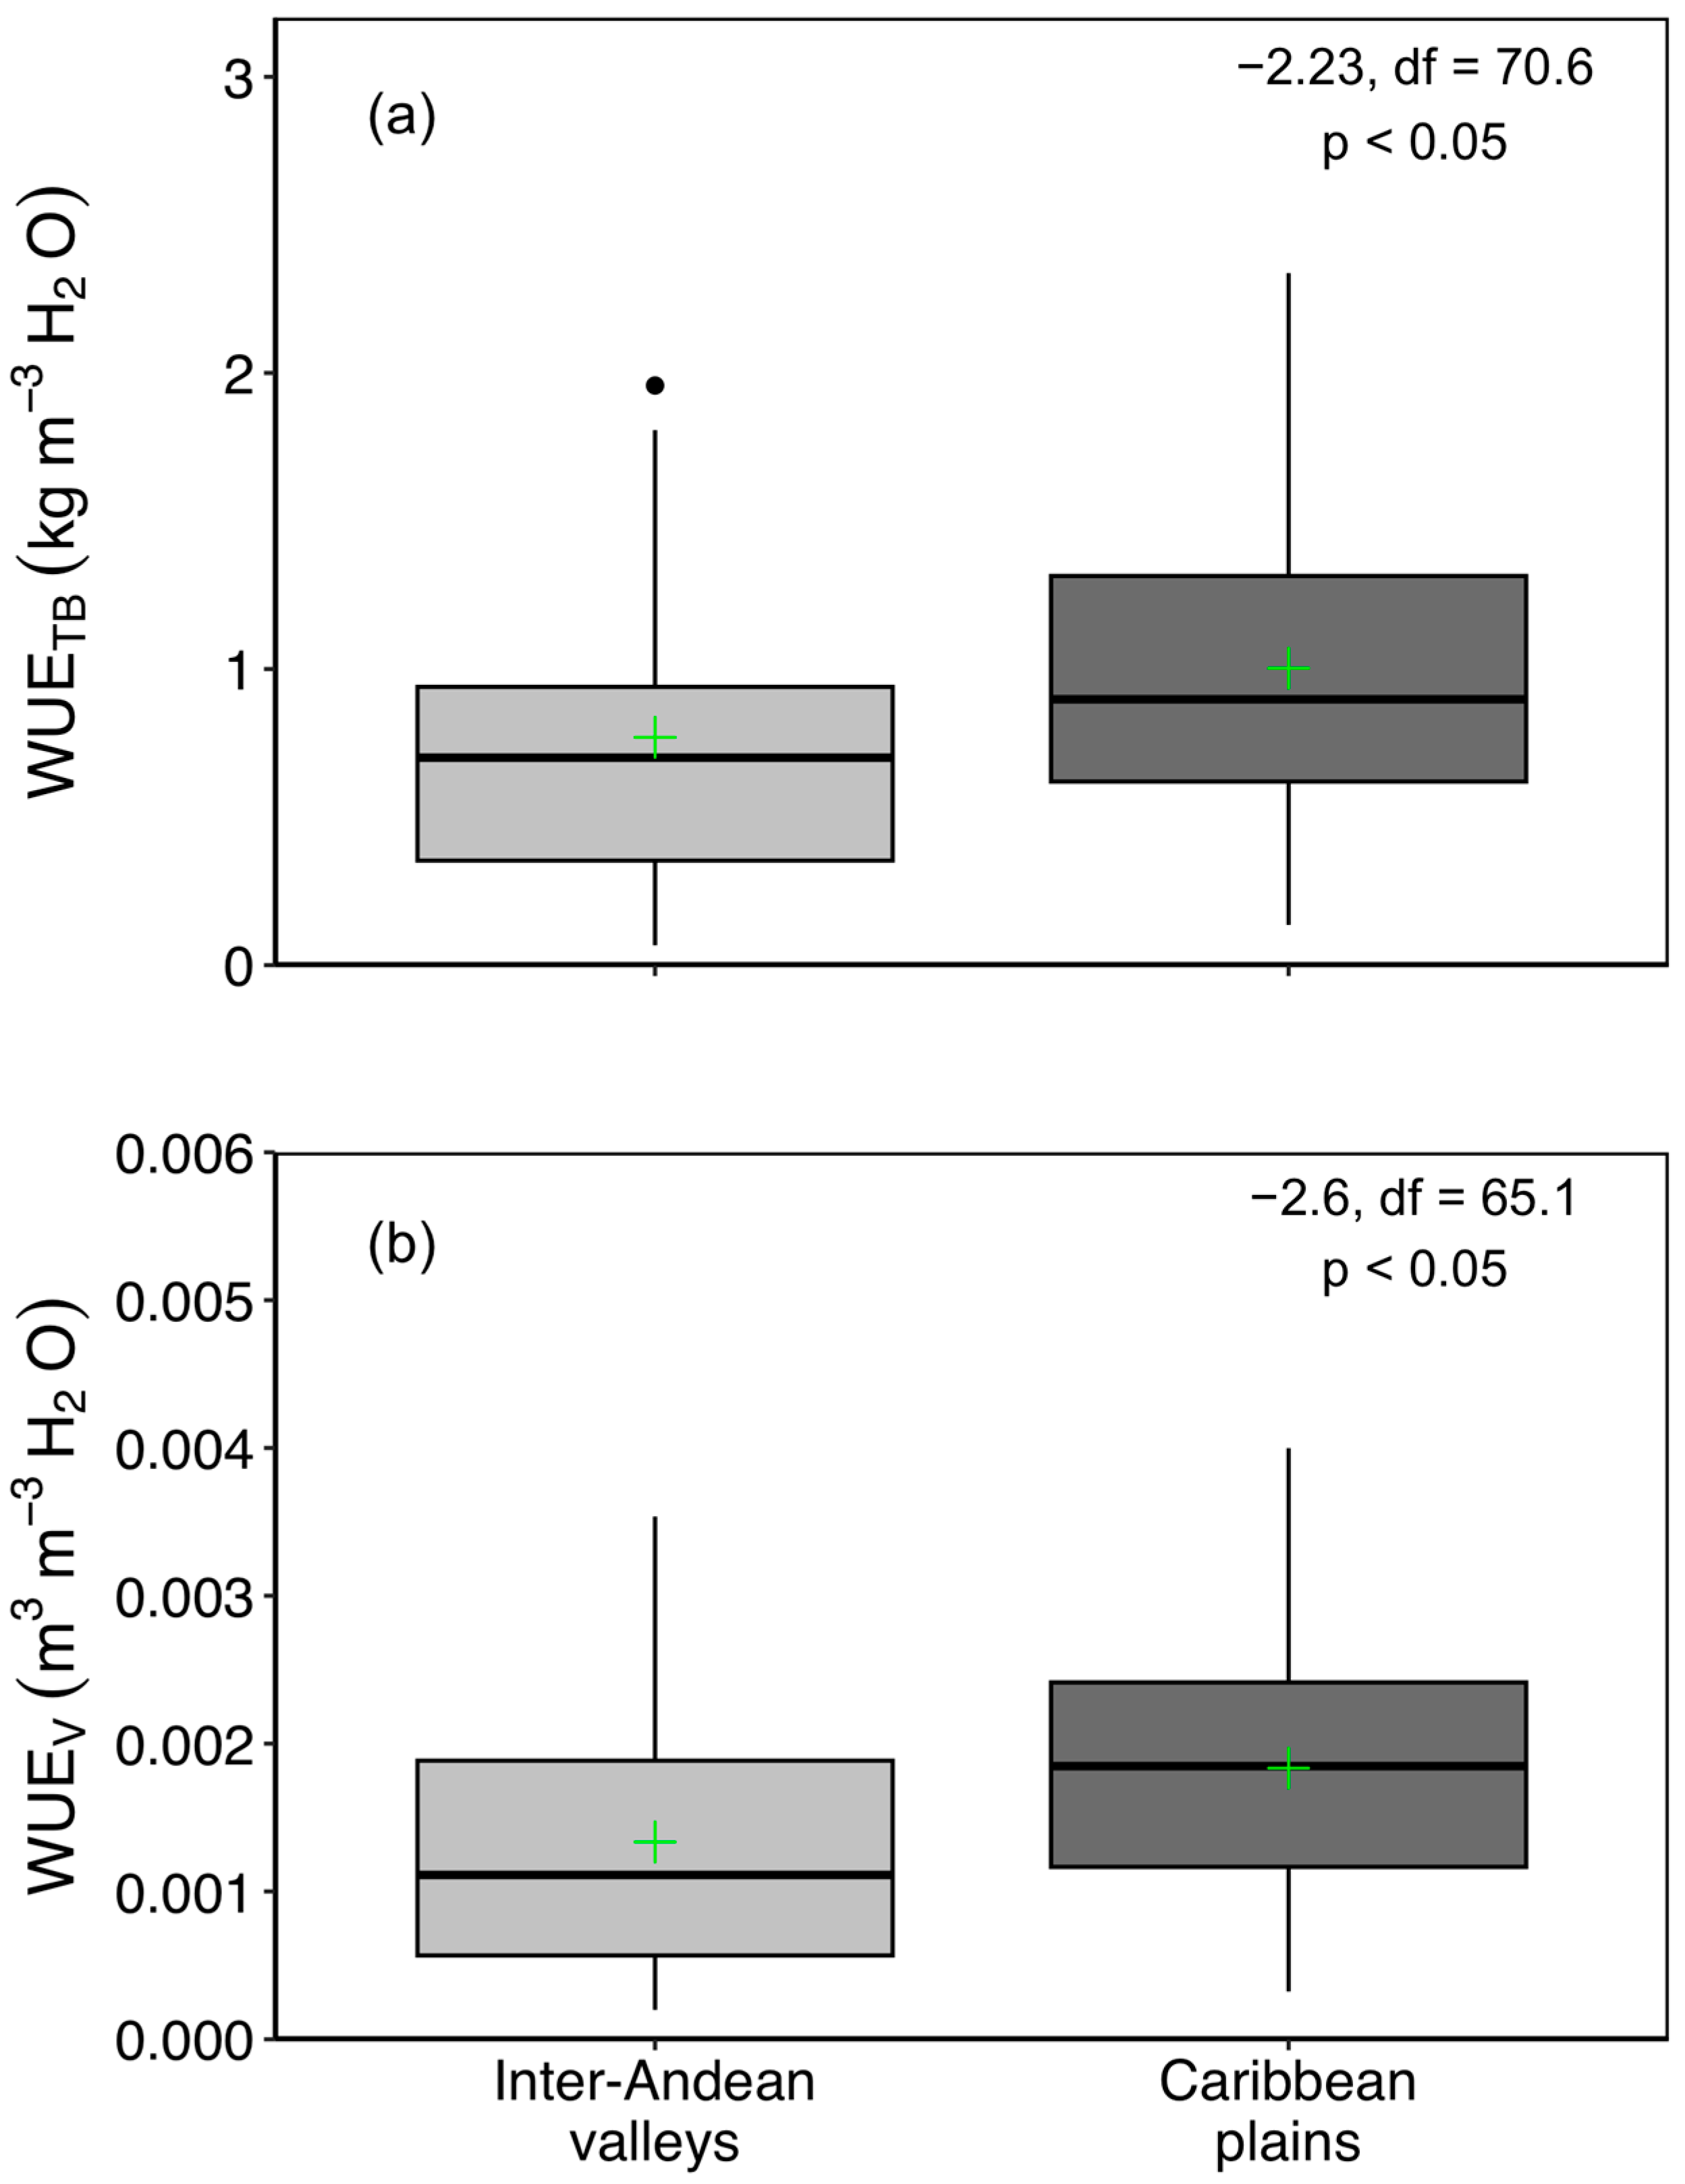
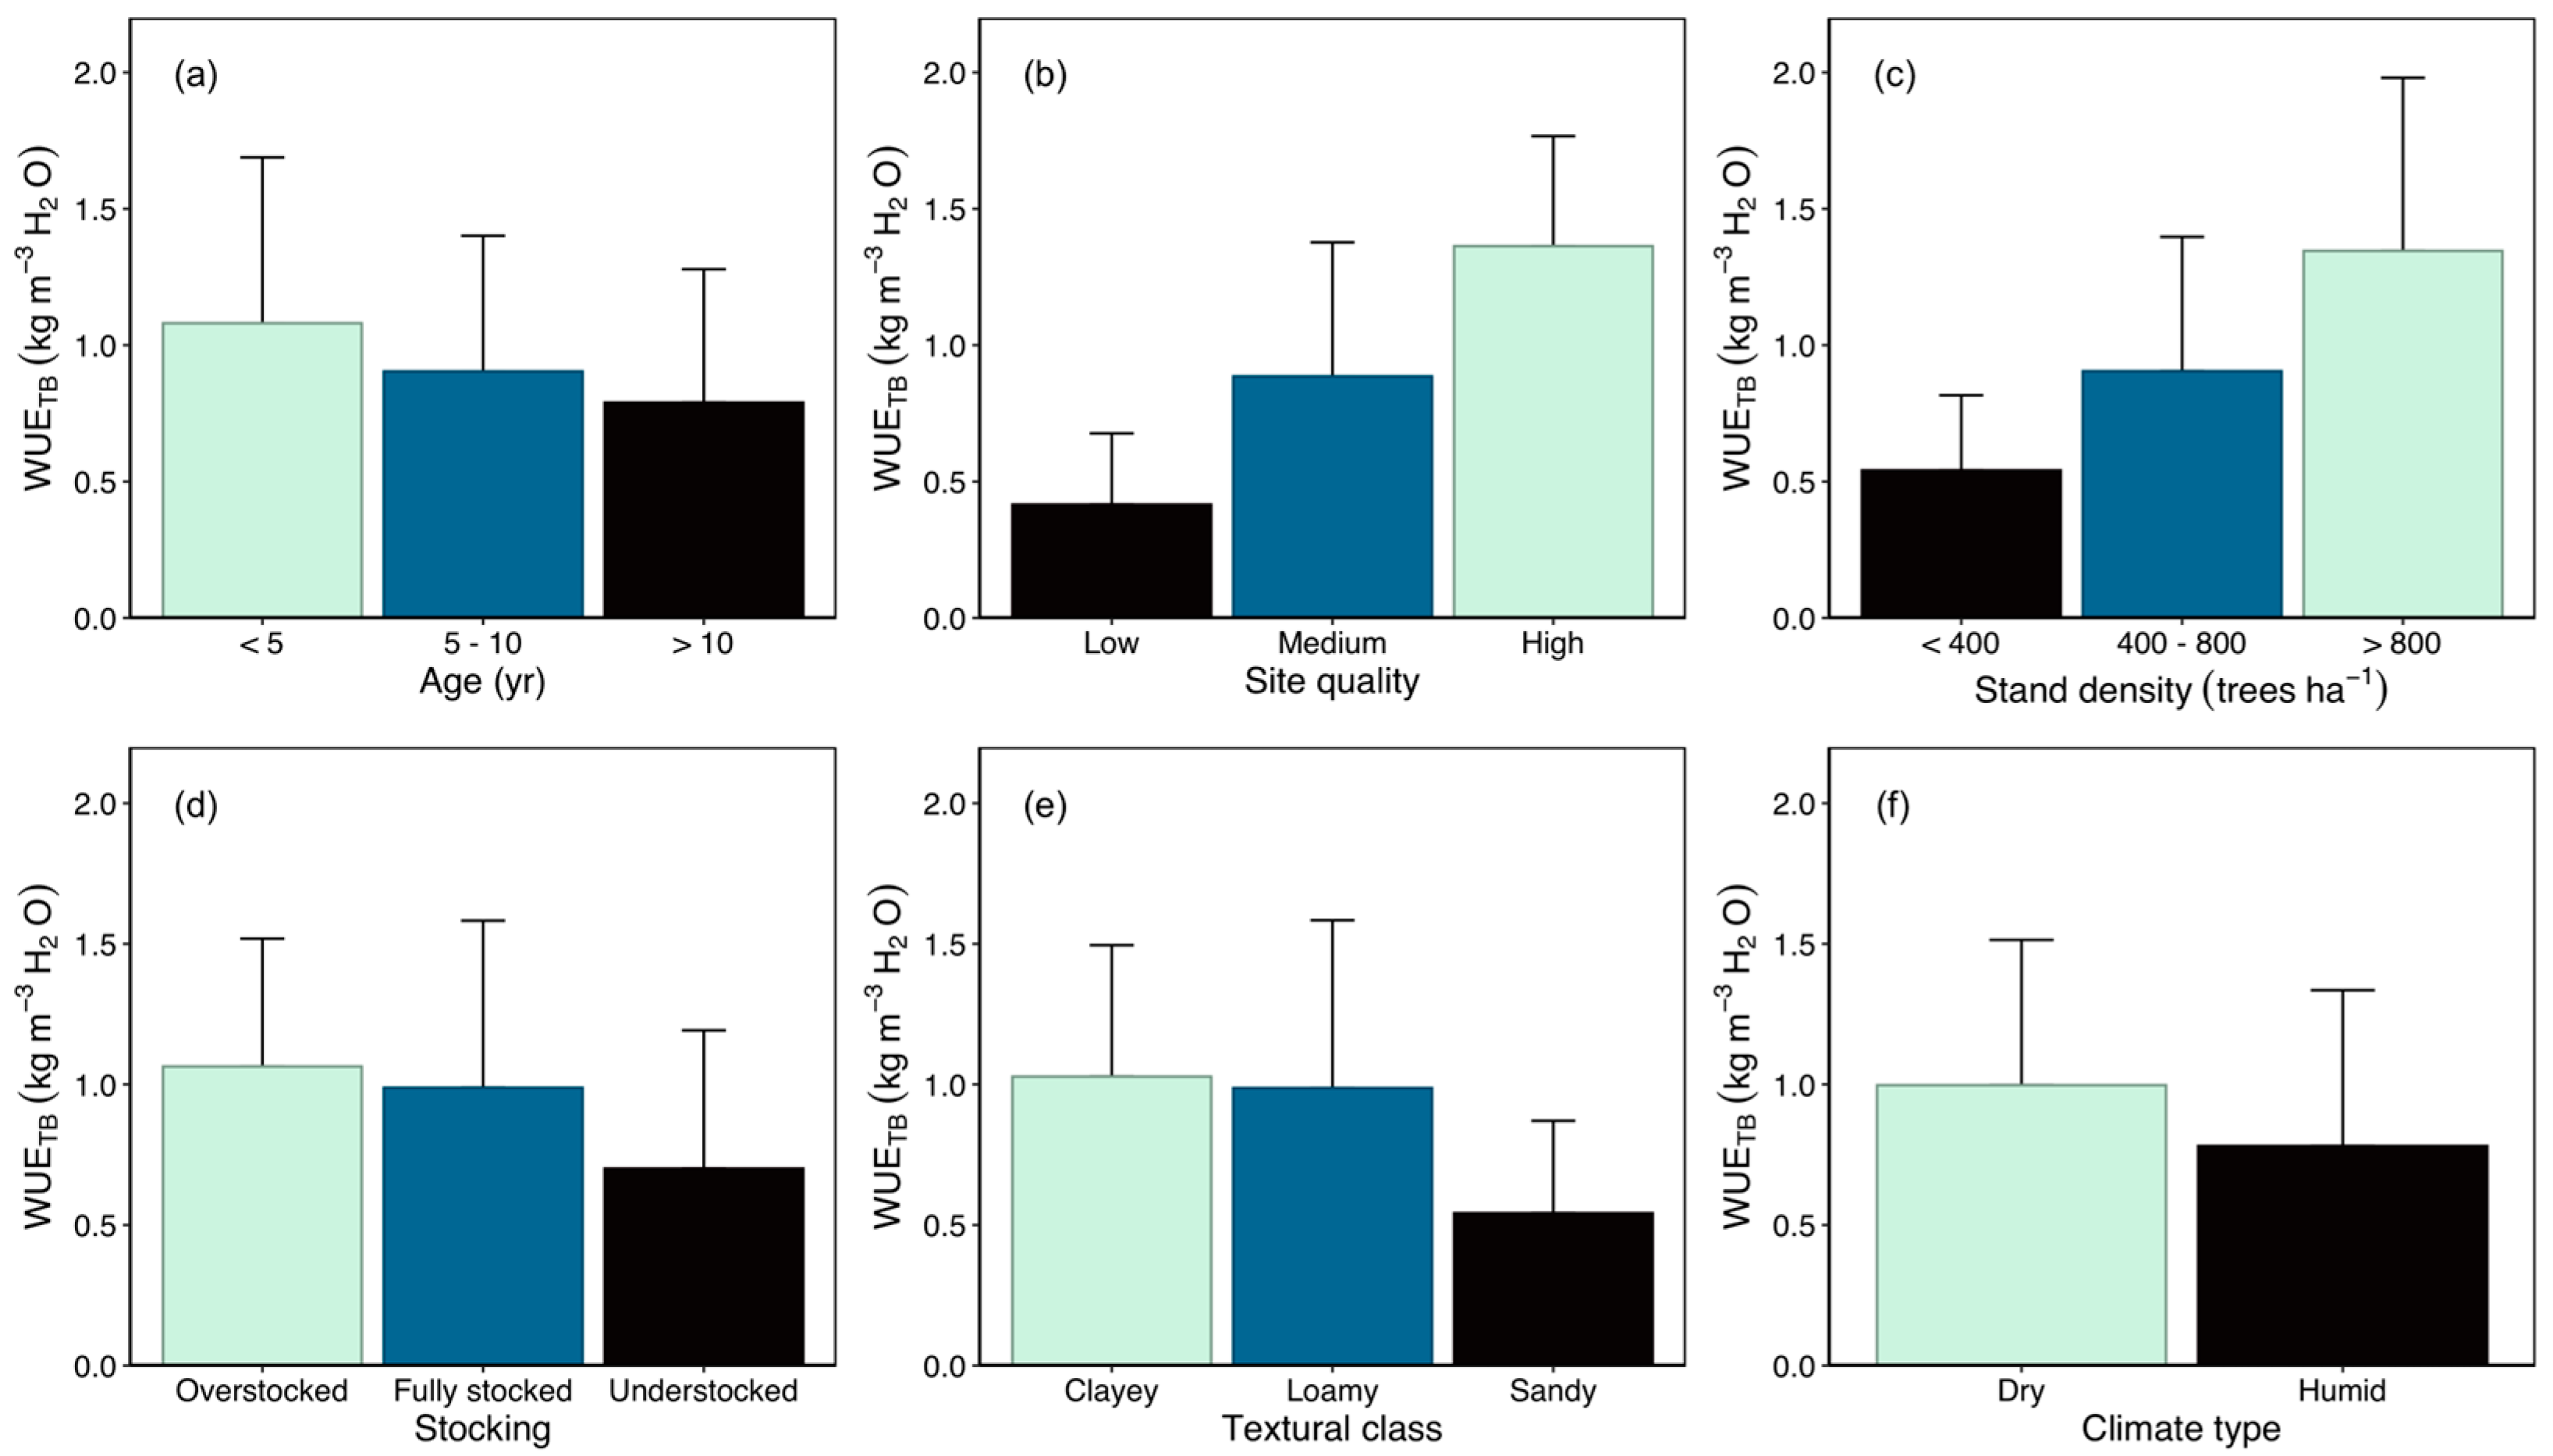
Figure 2 compares various stand and site variables between the inter-Andean valleys and the Caribbean plains. Significant regional differences are observed in site quality, stocking, and productivity of G. arborea stands between these two regions. The Caribbean plains exhibit more productive stands, as reflected in higher annual volume production (Figure 2a–c).
Additionally, the studied regions show significant differences in climate and soil conditions. The Caribbean plains experience a significantly drier climate (Figure 2d) and higher maximum air temperatures (Figure 2e). However, the maximum VPD shows no significant differences compared to the inter-Andean valleys (Figure 2f). The soils in the Caribbean plains are characterized by fine textures (Figure 2g), higher available water capacity (Figure 2h), and higher calcium content (Figure 2i).

3.2. WUE Variation

G. arborea showed a mean WUETB of 0.93 kg m−3 H2O, with a range of 0.07–2.34 kg m−3 H2O, and a mean WUEV of 0.0017 m3 m−3 H2O, with a range of 0.0002–0.0040 m3 m−3 H2O. Significant differences in WUETB (p < 0.05) and WUEV (p < 0.05) were found between G. arborea plantations located in two regions of the Magdalena River basin, in the Caribbean plains and the inter-Andean valleys (Figure 3). The Caribbean plains had 30.3% and 37.4% more WUETB and WUEV, respectively, than the inter-Andean valleys (Figure 3). The mean WUETB was 1.00 kg m−3 H2O, with a range from 0.14 to 2.34 kg m−3 H2O, for those stands located in the Caribbean plains, and 0.77 kg m−3 H2O, with a range of 0.07 to 1.96 kg m−3 H2O, for the stands located in the inter-Andean valleys (Figure 3a). Considering WUEV, the mean was 0.0018 m3 m−3 H2O, with a range of 0.0003 to 0.0040 m3 m−3 H2O, for the Caribbean plains, and 0.0013 m3 m−3 H2O, with a range of 0.0002 to 0.0035 m3 m−3 H2O, in the inter-Andean valleys (Figure 3b).

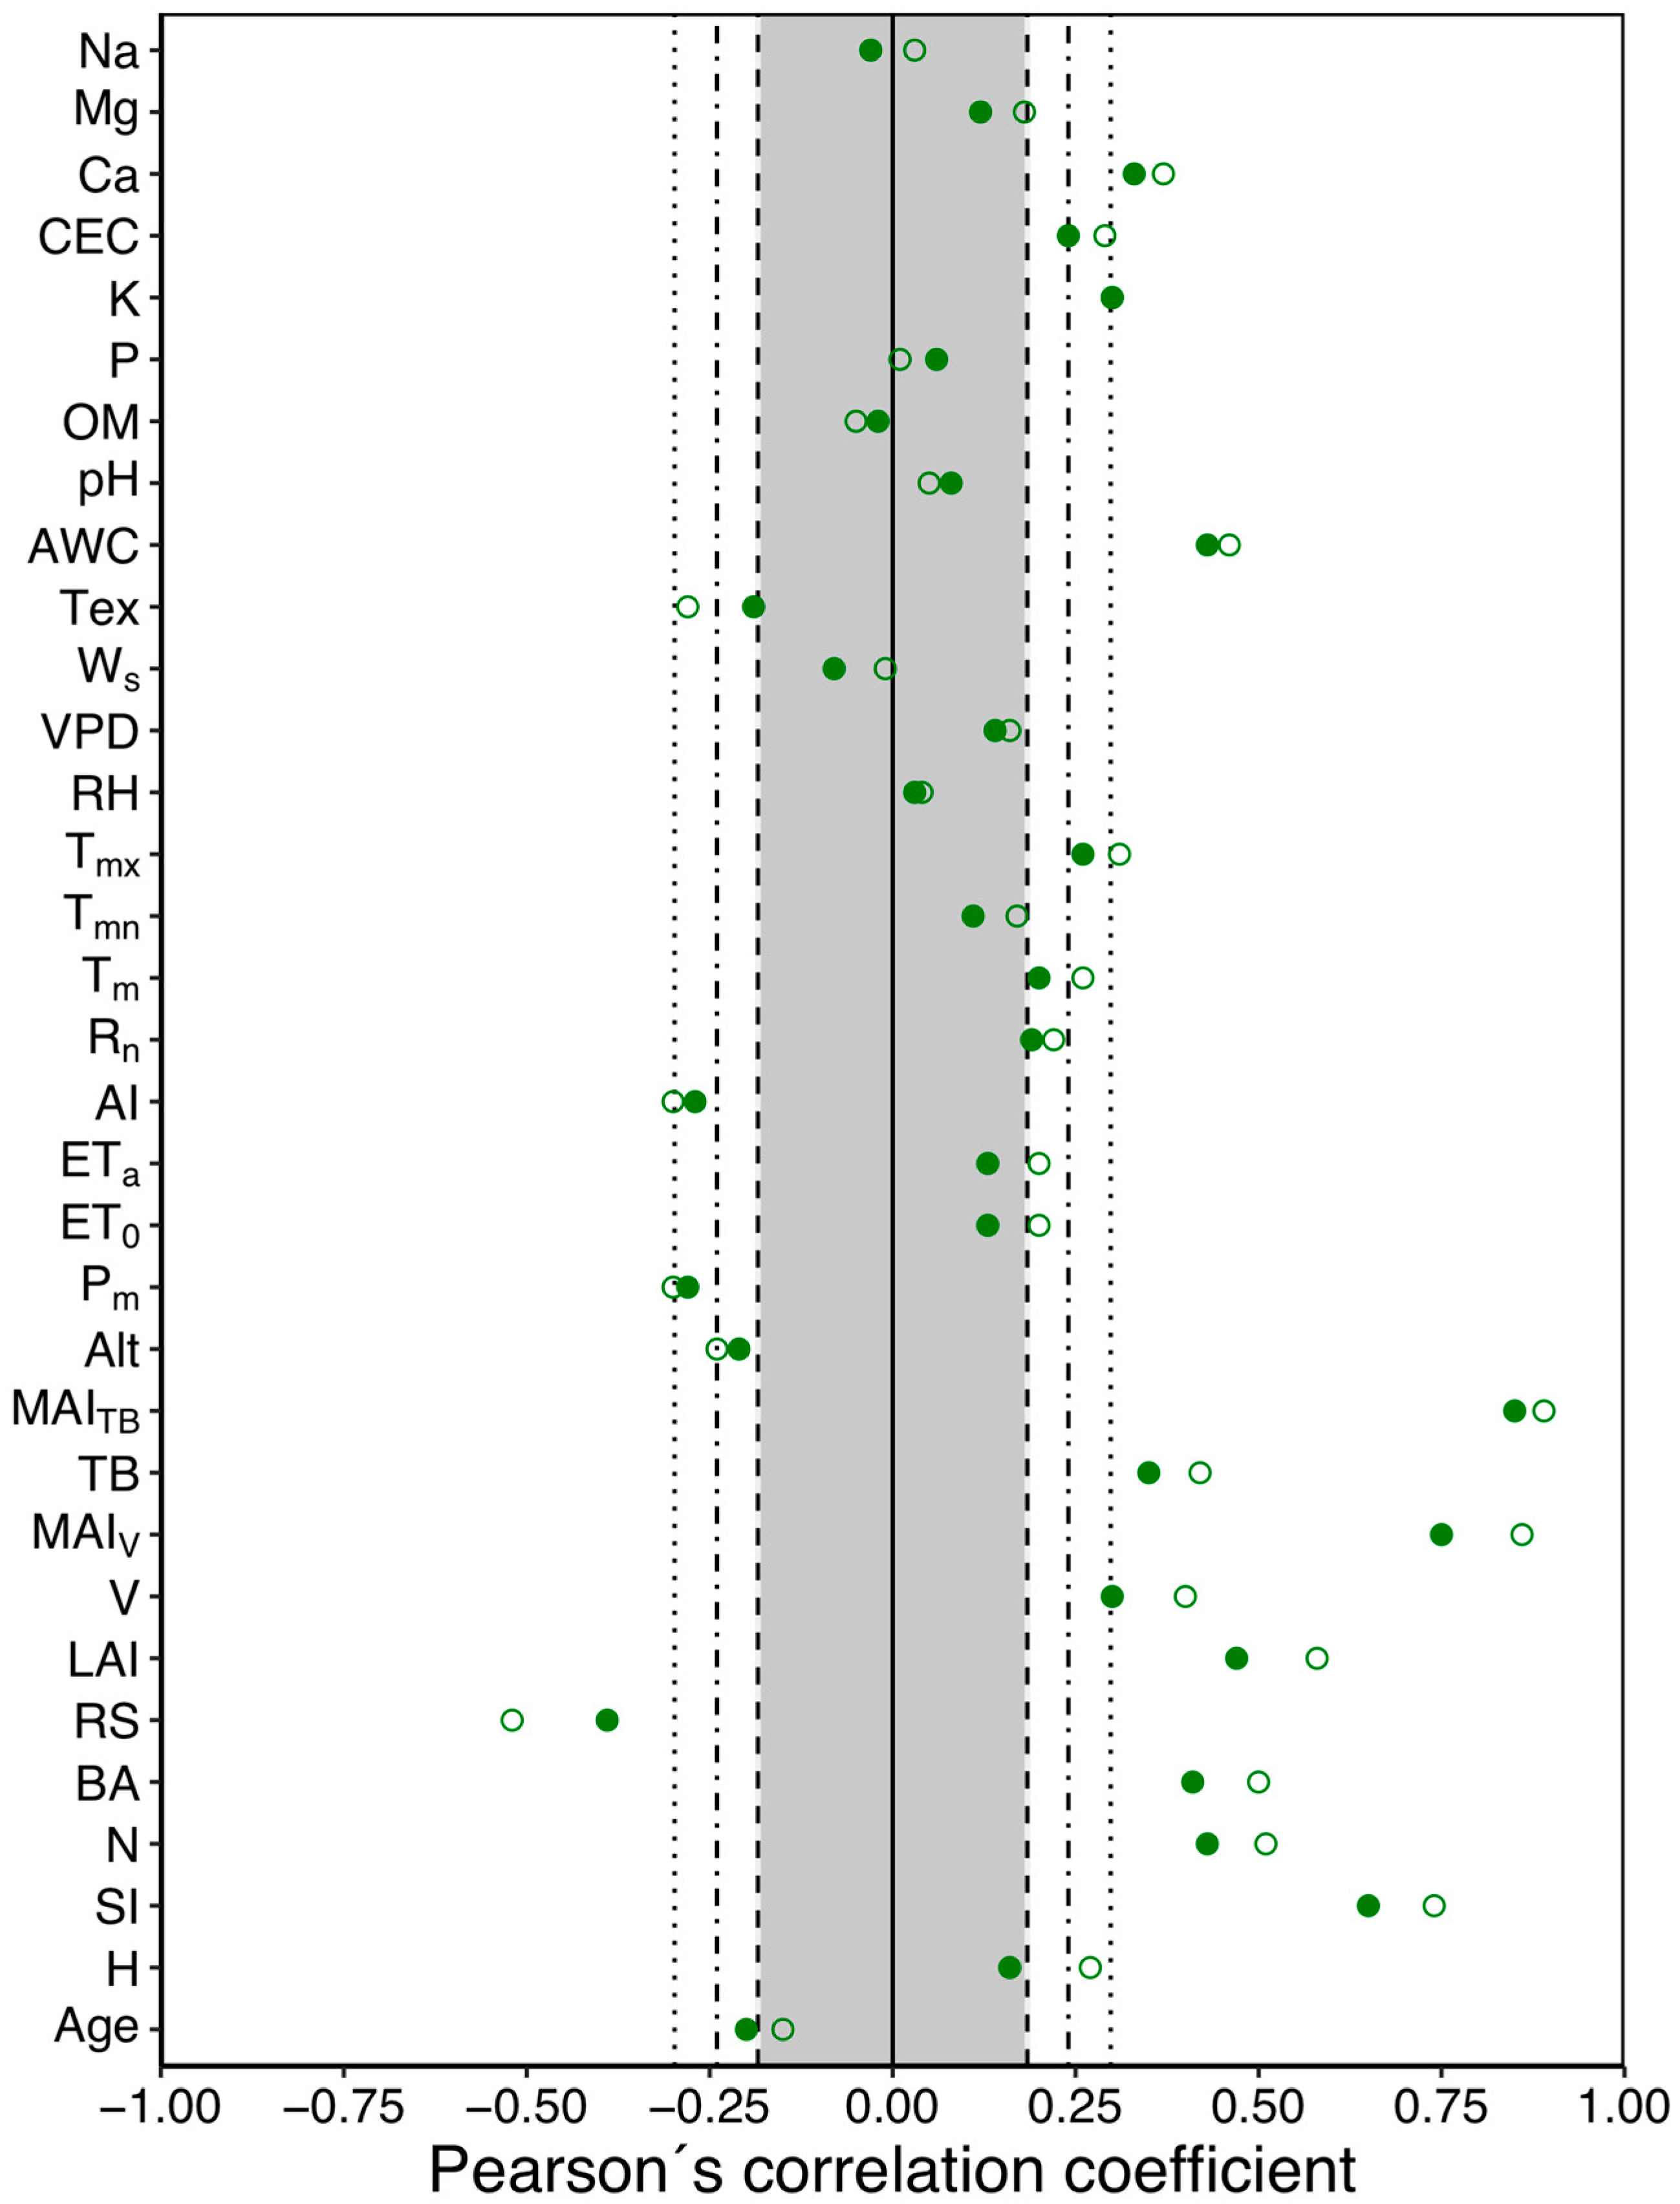
3.3. Relationship between WUE and Stand and Site Variables

Figure 4 presents a matrix of Pearson bivariate correlations between WUETB and WUEV and stand and site variables (climatic and soil variables) for G. arborea plantations. WUETB and WUEV showed moderate and strong significant correlations with stand variables, especially positive correlations with MAITB (r = 0.85 for WUETB and r = 0.89 for WUEV) and MAIV (r = 0.75 for WUETB and r = 0.86 for WUEV), SI (r = 0.65 for WUETB and r = 0.74 for WUEV), and LAI (r = 0.47 for WUETB and r = 0.58 for WUEV), indicating that more productive stands have higher WUE (Figure 4). Additionally, there was a significant moderate positive linear correlation between stand density measures, especially with N (r = 0.43 for WUETB and r = 0.51 for WUEV), and a negative significant correlation with RS (r = −0.39 for WUETB and r = −0.52 for WUEV), indicating that the species requires high stand densities to reach its productive potential. A weak negative significant correlation was observed between age and WUETB (r = −0.20), but the correlation was not significant for WUEV (r = −0.15, p > 0.05), although stands of different ages were included in the study.
A significant weak negative correlation was found between altitude and both WUETB (r = −0.21) and WUEV (r = −0.24). Similarly, a significant moderate inverse relationship was found between WUETB and WUEV with precipitation (r = −0.28 for WUETB and r = −0.30 for WUEV), and a positive relationship was found with the aridity index (r = −0.27 for WUETB and r = −0.30 for WUEV), indicating that sites with higher WUE correspond to lower and generally drier sites (Figure 4). In addition, weak significant positive correlations were found with net solar radiation and air temperatures, especially with mean and maximum air temperatures (Figure 4).
Among the soil variables evaluated, moderate positive relationships were found with AWC (r = 0.43 for WUETB and r = 0.46 for WUEV) and soil calcium content (r = 0.33 for WUETB and r = 0.37 for WUEV). In addition, weak positive correlations were also observed between WUETB and WUEV and CEC and soil potassium content (Figure 4), and a weak negative relationship was also found with soil texture, showing that stands located on sandy soils had the lowest values of WUETB and WUEV.

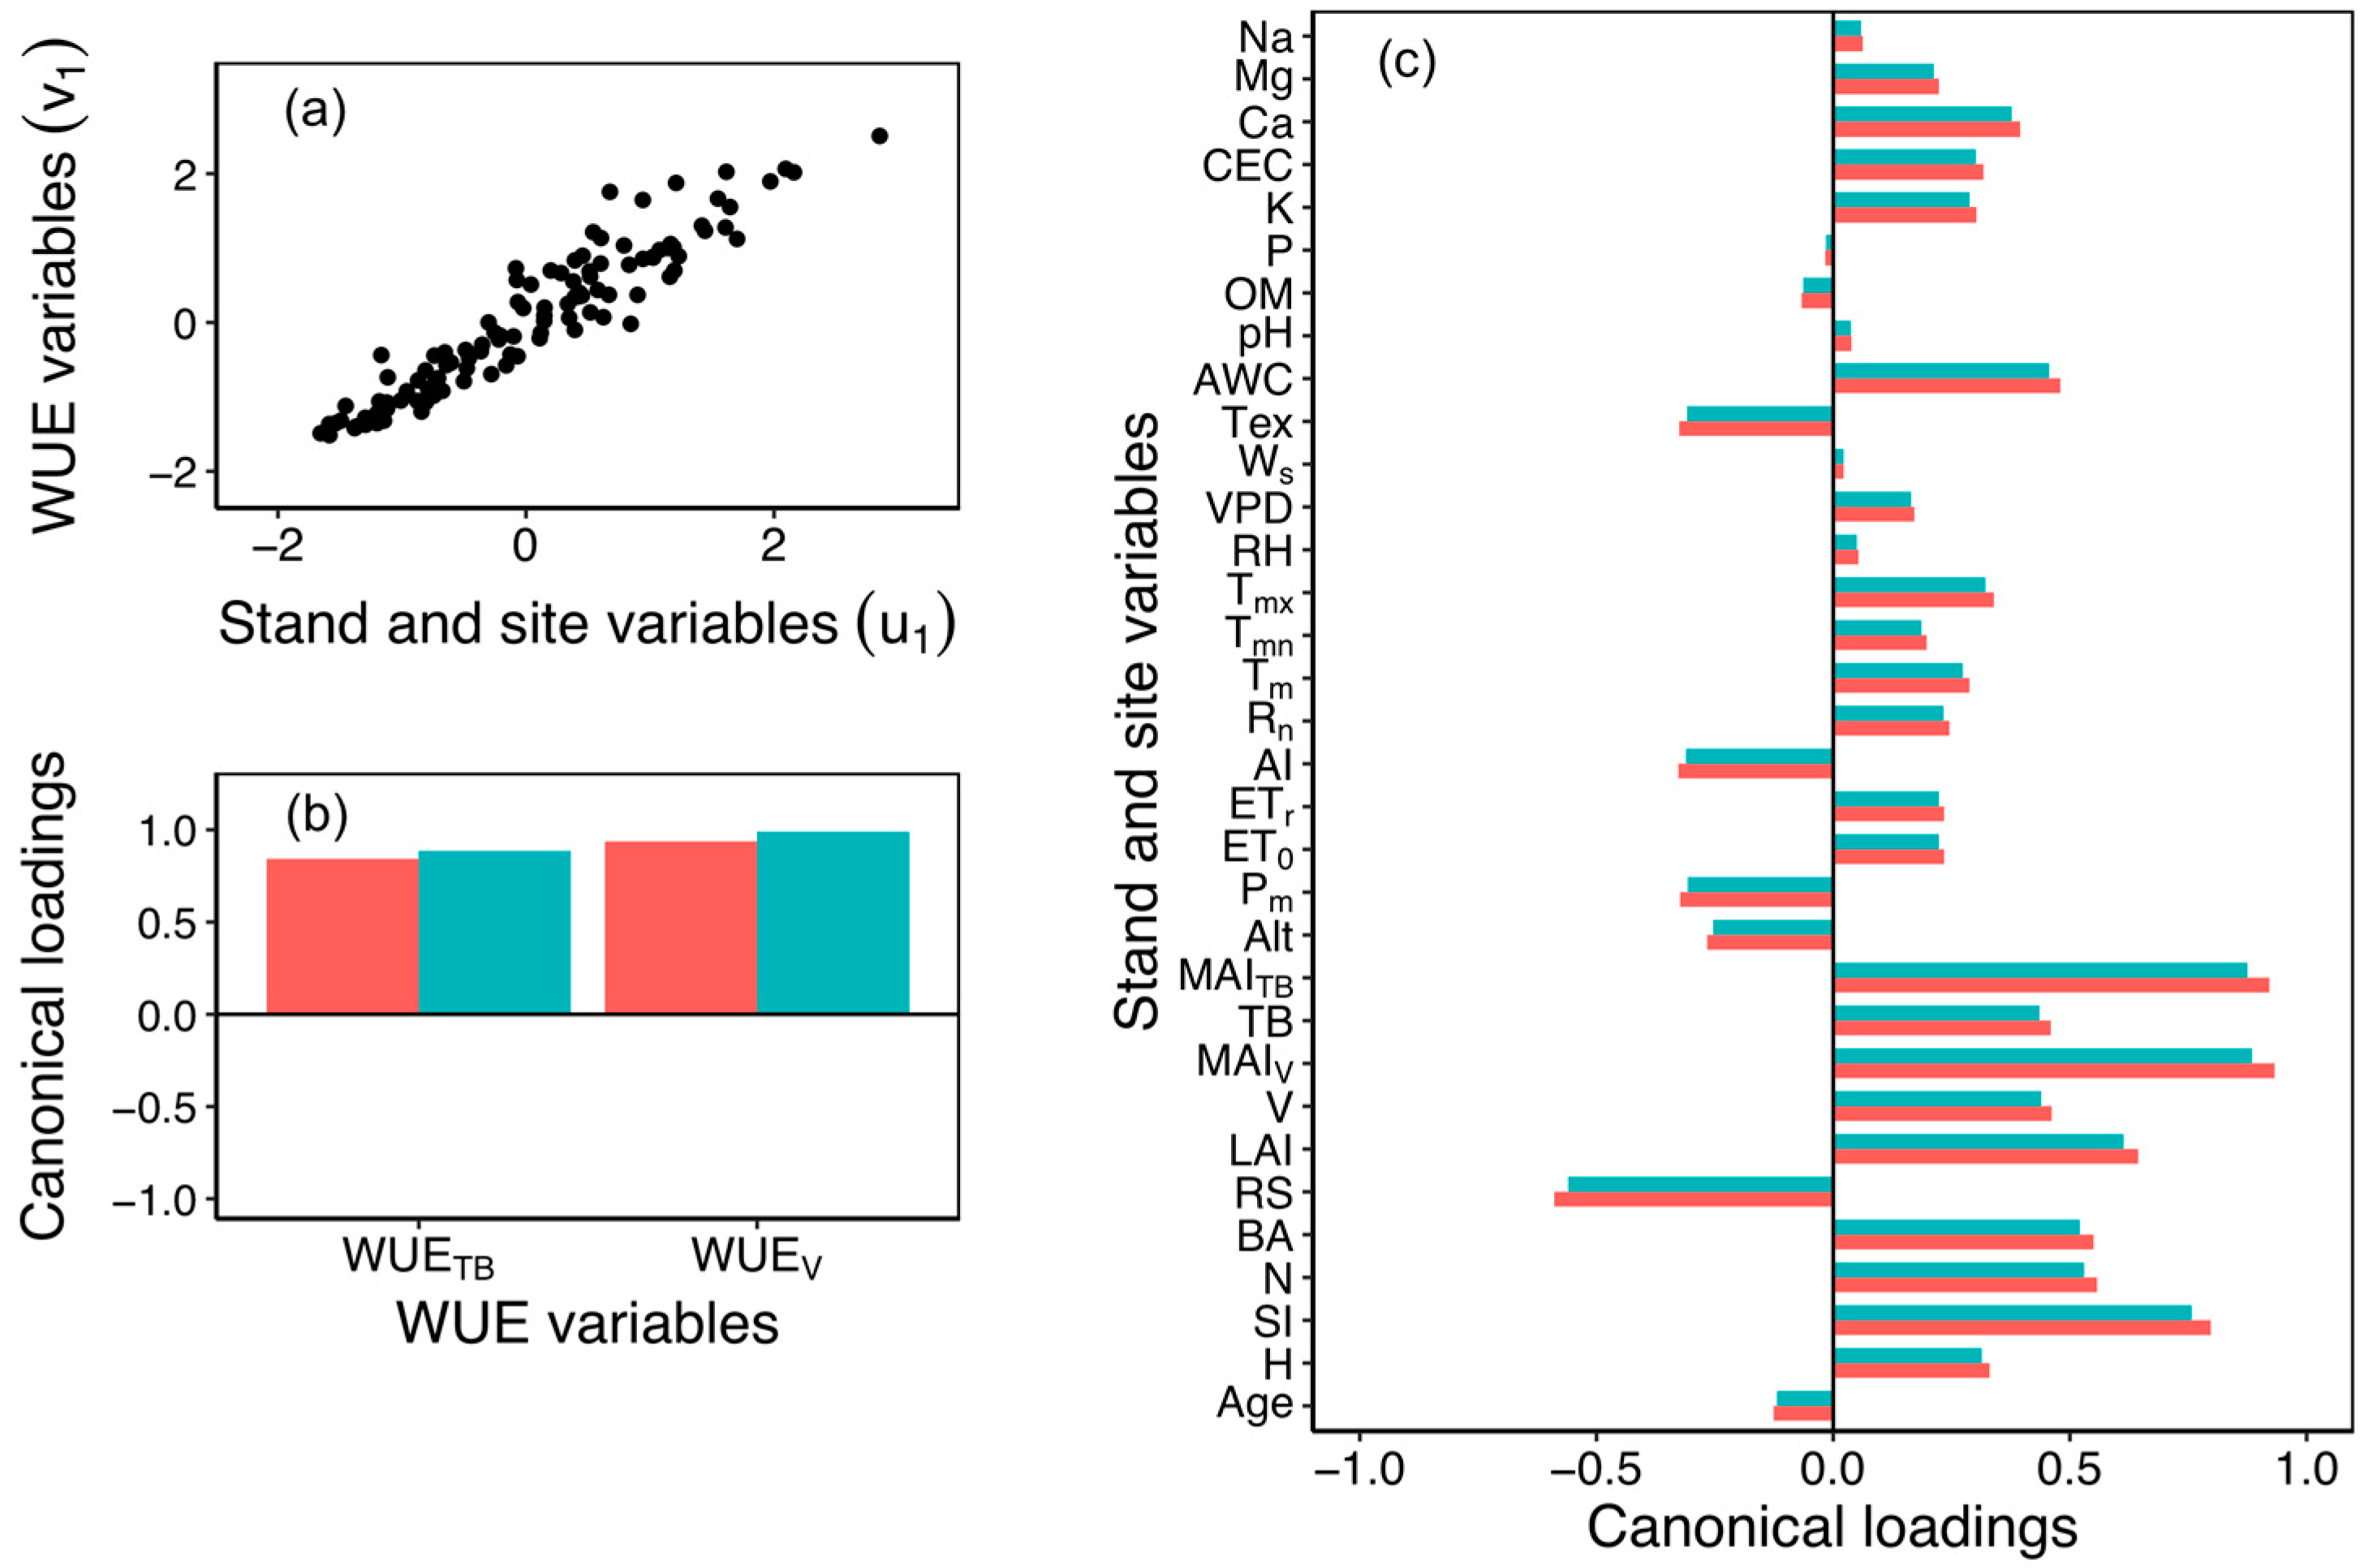
3.4. Canonical Correlations

Table 4 shows the canonical correlations obtained from the canonical correlation analysis, the canonical values of R2, and the results of the significance test. These results show the existence of two highly significant canonical correlations, R(u₁, v₁) = 0.949 and R(u₂, v₂) = 0.845, between the vectors of variables consisting of water use efficiency (WUETB and WUEV) and stand and site variables. The results show that 90.1% and 71.4% of the variance in the data is explained by canonical variable pairs 1 and 2, respectively (Table 4).
The most significant canonical correlation from Table 2 (u1, v1) indicates that the canonical variables are directly proportional and highly correlated (Figure 5a). The values for each canonical variable were obtained from the standardized data of the original variables in the determined linear combinations for each canonical variable.
Figure 5b shows the canonical loadings between the canonical variable v1 (cyan) and each of the observed variables composing it, WUETB (canonical loading of 0.89) and WUEV (canonical loading of 0.99). As can be seen in Figure 5b, there is a high correspondence between the values of the canonical variables, as the canonical cross-loadings between u1 (red) and WUETB and WUEV also show high values of 0.84 and 0.94, respectively. Figure 5c shows the canonical loadings (red) and cross-loadings (cyan) of each of the 33 observed stand and site variables as well as the canonical variables formed by the stand and site variables (u1 = red) and water use efficiency (v1 = cyan).
Considering the canonical cross-loadings, the results in Figure 5c indicate that stands with higher rates of WUE (WUETB and WUEV) were positively associated with all stand variables, except age and RS, which showed negative associations. Of these, the stand variables that showed the highest association with the canonical WUE variable (v1) were (in descending order) MAIV (canonical cross-loading of 0.88), MAITB (0.87), SI (0.76), LAI (0.61), RS (−0.56), N (0.53), BA (0.52), V (0.44), and TB (0.44).
Among the observed site variables, those with the highest positive association with the canonical variable WUE (v1) were AWC (canonical cross-loading of 0.46), Ca content (0.38), Tmx (0.32), and CEC (0.30). Conversely, the original site variables that showed the strongest negative association, in descending order, were AI (−0.31), Tex (−0.31), and Pm (−0.31).

3.5. Main Driver of WUE

Figure 6 illustrates the relationships between stand and site variables and their mean effect on WUETB. Age was categorized into three age classes < 5, 5–10, >10 years. Site quality was categorized into three ranges, as defined by [39]: low site quality stands (SI ≤ 18.6 m), medium site quality stands (SI between 18.6 and 24.1 m), and high site quality stands (SI > 24.1 m). The stocking levels were categorized as overstocked stands (RS ≤ 0.20), fully stocked stands (RS > 0.20 and RS ≤ 0.30), and understocked stands (RS > 0.30). Climate type was derived from the aridity index (AI) and categorized as drier sites (AI ≤ 1) and humid sites (AI > 1).
As shown in Figure 6a, a slight decrease in WUETB is observed with increasing stand age, with younger stands showing up to 37% higher WUETB compared to older stands. Among stand variables, site quality exhibited the strongest effect on WUETB, with increases of up to 53% and 69% when moving from low to medium and high site quality, respectively (Figure 6b). Stand density also significantly impacted WUETB, with variations of up to 60% between stand densities of <400 trees ha−1 and >800 trees ha−1 (Figure 6c). Additionally, a decrease of 52% was observed between overstocked and understocked stands (Figure 6d).
Soil texture also had a strong effect on the WUETB of G. arborea. Stands on sandy soils had WUETB values between 86% and 90% lower than those on loamy and clayey soils, respectively (Figure 6e). Finally, the analysis indicated that drier sites had, on average, 28% higher WUETB than humid sites (Figure 6f).
Figure 7 illustrates the relationship between the MAITB and WUEV and WUETB. Circles represent PSPs in the inter-Andean valleys, and triangles represent PSPs in the Caribbean plains. Figure 7a shows a positive correlation between MAITB and WUETB (kg m−3 H2O), with a coefficient of determination of 0.72. Similarly, Figure 7b shows a positive correlation between MAITB and WUEV (m3 m−3 H2O), with a coefficient of determination of 0.79, indicating that higher MAITB is associated with greater WUEV. These results suggest that in both the inter-Andean valleys and the Caribbean plains, higher MAITB is positively correlated with greater WUE, both in terms of total biomass and volume.

4. Discussion

Stand-level WUE is a critical indicator of water use strategy in forests and reflects ecophysiological processes related to biomass production and transpiration. This study presents estimates of WUE in G. arborea plantations based on PSPs measurements, examining its relationship with various stand and site variables. Additionally, the silvicultural implications of these findings are discussed.
G. arborea showed lower WUETB values compared to other hardwood species such as Eucalyptus benthamii (2.86 kg biomass per m3 H2O) [54] and Eucalyptus grandis × Eucalyptus urophylla (1.8 to 3.2 kg biomass per m3 H2O) [23]. However, the WUEV values of G. arborea are within the ranges reported by [55] for Eucalyptus grandis in South Africa, who reported WUEV values ranging from 0.0011 to 0.0123 m3 of wood produced per m3 of water consumed. Differences in WUE compared to other species can be attributed to genetic variability and the physiological adaptations that each species develops, which determine their efficiency in water use and capacity to produce biomass. Previous research has reported significant variations in WUE and biomass growth among different Eucalyptus clones in Brazil, attributed to genetic differences in drought tolerance [7]. In that study, the observed WUE ranged from 1.5 g biomass L−1 to 2.3 g biomass L−1, highlighting the impact of genetic variability and physiological traits on WUE and biomass production across species [7]. Another study demonstrated that half-sib families of G. arborea exhibit significant variations in intrinsic WUE, with moderate heritability, emphasizing the potential to genetically select progenies with higher intrinsic WUE without compromising biomass production [42].
The study reports significant differences in WUETB and WUEV between the lower and upper Magdalena River basin regions. The Caribbean plains exhibited 30.3% higher WUETB and 37.4% higher WUEV compared to the inter-Andean valleys. The Caribbean plains demonstrated more productive plantations, indicated by higher site quality, greater annual volume production, and stands managed with higher stockings. These differences suggest that silvicultural practices have been more effectively applied in the Caribbean plains, leading to relatively greater success. Additionally, despite the drier climate, the soils in the Caribbean plains possess fine textures with superior water retention and fertility. Consequently, forest plantations in this region can support more intensive management practices due to their enhanced productivity [39].
Despite the wide range of stand ages included in this study, encompassing both young and rotation-aged stands, the analyses indicated that stand age exerts a weak negative effect on WUE. This result is similar to that reported for Pinus strobus in Canada [56]. The WUE of G. arborea was directly related to stand variables associated with productivity, such as MAIV, MAITB, SI, and LAI. Highly productive stands exhibited higher WUE, supporting the hypothesis that more productive forests are more efficient in resource use [8,57]. The positive relationships with MAI suggest that the WUE of G. arborea is primarily controlled by carbon assimilation rates, which facilitate greater biomass and volume accumulation [58].
High WUE is generally associated with increased carbon assimilation, leading to a positive correlation with growth [59]. Conversely, if higher WUE results from stricter stomatal control, it may inversely correlate with growth. This assertion is further supported by the positive correlation found between WUE and LAI, indicating that an increase in leaf surface area available to intercept sunlight enhances carbon assimilation and, consequently, biomass production [60,61]. Additionally, a higher LAI can significantly alter the stand environment by reducing soil temperature and water evaporation. The shade provided by a higher LAI decreases leaf temperature and transpiration, thereby conserving water and enhancing WUE [62,63].
Basal area and stand density showed a positive relationship with WUE, whereas RS exhibited a negative relationship with WUE. This indicates that higher stand densities, which result in more intense competition for resources, positively affect WUE. Previous studies have demonstrated that G. arborea is highly dependent on stand density for its development [31,64]. Additionally, higher stand densities allow for greater growth per hectare through increased resource competition and earlier site occupancy [24], leading to higher stand growth rates [65,66]. This enhanced growth is likely due to optimized resource use, as denser stands maximize light interception and water utilization, illustrating a balance between competition and resource availability inherent in density-dependent growth.
Within the climate variables, WUETB and WUEV were negatively associated with variables related to water availability, such as Pm and AI. Conversely, air temperatures, particularly Tmx, exhibited a positive association with WUE. These results suggest that G. arborea is well adapted to regions with dry climates [58,64].
Evaluations in temperate and subtropical coniferous and broadleaf forests have shown that ecosystem WUE generally decreases with increasing temperature and precipitation [67]. However, these relationships are not universal across all forest types. For instance, past research has found that WUE was positively correlated with temperature and solar radiation in broadleaf and coniferous forest ecosystems [68]. This indicates that the response of WUE to climatic variables can vary significantly depending on species-specific adaptations and the ecological characteristics of different forest types.
The study highlights the crucial role of soil properties in determining the WUE of G. arborea plantations. A positive relationship was observed between soil texture, AWC, and WUE, indicating that higher soil moisture levels significantly enhance water uptake efficiency. Fine soil textures, which retain more water, improve water availability and tree absorption efficiency [11,12]. Consistent with our findings, G. arborea grown in forest plantations exhibited the best annual growth on loamy soils in Venezuela [69]. In contrast, unfavorable soil textures can restrict water infiltration and root penetration, leading to water stress and reduced WUE, as trees must allocate more resources to cope with water scarcity rather than biomass production [70].
Furthermore, the study found that sufficient soil calcium content is crucial for the ability of G. arborea to withstand water stress. Calcium plays a vital role in maintaining cell turgor and membrane stability, allowing trees to function normally under drought conditions [71,72]. This adaptation enables trees to conserve and use water more efficiently during periods of scarcity. Past research has demonstrated a significant relationship between forest water uptake and soil calcium content, establishing it as a reliable predictor of WUE in forests in northern China [72]. Soils with higher CEC also demonstrated a positive relationship with WUE, as they can retain essential nutrients and moisture more effectively, thereby enhancing plant health and productivity [70].
Results from this study have important implications for selecting sites for new G. arborea plantations. Higher-quality sites, characterized by higher site indices, clay and loamy soil textures with higher AWC, higher calcium content, and higher CEC, are ideal for this species [69,73]. These sites support greater forest productivity and WUE, especially in lower altitude regions [23,31]. Avoiding sites with excessive precipitation and selecting those with favorable air temperatures will contribute to more sustainable and productive plantations [67,74].
Past studies have shown that proper site preparation is essential to ensure optimal soil structure and drainage for G. arborea forest plantations [75]. Practices such as subsoiling can break compacted layers, improve water infiltration, and enhance root penetration [24,75].
Basophilic forest species, such as G. arborea, thrive in soils with higher pH levels, which are typically rich in calcium [73,75]. Research has indicated that G. arborea benefits from the addition of calcium and magnesium to the soil [76,77]. Therefore, applying lime to increase calcium content in calcium-poor soils is essential for this species. These conditions enhance nutrient availability and water retention, supporting better growth and productivity [68,71,72]. Additionally, mineral fertilization can further improve nutrient availability and water retention capacity [77].
Research on G. arborea shows that higher stand densities lead to taller trees and greater stem diameter growth [64]. Studies have similarly demonstrated a significant positive correlation between site productivity (e.g., site index) and stand density for this species [31]. Additionally, thinning studies have shown that less intensive thinning is suitable for ensuring full site occupancy, promoting a higher LAI, more uniform growth, and reduced intraspecific competition in the stands of this species [78]. Therefore, maintaining appropriate stand stockings throughout the rotation length is crucial for the effective management of G. arborea stands.
Implementing these practices will enhance the sustainability and profitability of G. arborea plantations. This management approach is particularly relevant in the context of climate change, where efficient water management is crucial for maintaining the productivity and resilience of forest plantations. Additionally, integrating the selection of appropriate genotypes into management strategies can further enhance the benefits obtained from optimal silvicultural practices, ensuring that plantations reach their maximum productivity potential [8,57].

5. Conclusions

G. arborea plantations exhibited significant variability in WUE, both in terms of biomass and volume, along the Magdalena River basin. The Caribbean plains showed notably higher WUE compared to the inter-Andean valleys, indicating the influence of regional stand and site characteristics on plantation productivity.
The study identified that stand variables, particularly those related to site productivity such as MAIV, MAITB, SI, and LAI, were strongly associated with WUE. Higher productivity stands demonstrated greater WUE, supporting the concept that more productive forests are more efficient in resource use. Additionally, stand stocking played a significant role in maintaining higher productivity and WUE.
Soil variables significantly modulate the WUE of G. arborea forest plantations. Fine soil textures with higher AWC and higher calcium content are correlated with increased WUE. Conversely, climate variables exhibit a minor influence on WUE in G. arborea plantations. Nevertheless, this species exhibits superior adaptation to drier climates compared to humid environments.
Overall, these findings underscore the importance of comprehensive site selection and effective silvicultural practices in maximizing the WUE and overall productivity of G. arborea plantations, especially in the context of climate change, where efficient water management is increasingly critical.

Author Contributions

Conceptualization, A.M.L.A. and A.B.T.; methodology, A.M.L.A. and A.B.T.; formal analysis, A.M.L.A. and A.B.T.; writing—original draft preparation, A.M.L.A. and A.B.T.; writing—review and editing, A.M.L.A. and A.B.T. All authors have read and agreed to the published version of the manuscript.

Funding

The authors thank the Office of Research and Scientific Development of the University of Tolima for the financial support granted for the development of the research through Projects No. 440121 and No. 20123.

Data Availability Statement

The data presented in this study are available on request from the corresponding author.

Conflicts of Interest

The authors declare no conflicts of interest.

References

  1. Loustau, D.; Bosc, A.; Colin, A.; Ogee, J.; Davi, H.; Francois, C.; Dufrene, E.; Deque, M.; Cloppet, E.; Arrouays, D.; et al. Modeling Climate Change Effects on the Potential Production of French Plains Forests at the Sub-Regional Level. Tree Physiol. 2005, 25, 813–823. [Google Scholar] [CrossRef] [PubMed]
  2. Intergovernmental Panel on Climate Change (IPCC). Climate Change 2014: Synthesis Report; Pachauri, R.K., Mayer, L.A., Eds.; Intergovernmental Panel on Climate Change (IPCC): Geneva, Switzerland, 2015; ISBN 978-92-9169-143-2. [Google Scholar]
  3. Kwon, H.; Law, B.E.; Thomas, C.K.; Johnson, B.G. The Influence of Hydrological Variability on Inherent Water Use Efficiency in Forests of Contrasting Composition, Age, and Precipitation Regimes in the Pacific Northwest. Agric. For. Meteorol. 2018, 249, 488–500. [Google Scholar] [CrossRef]
  4. Bhattacharya, A. Changing Climate and Resource Use Efficiency in Plants; Elsevier: Amsterdam, The Netherlands, 2019; ISBN 978-0-12-816209-5. [Google Scholar]
  5. Asensio, V.; Domec, J.-C.; Nouvellon, Y.; Laclau, J.-P.; Bouillet, J.-P.; Jordan-Meille, L.; Lavres, J.; Rojas, J.D.; Guillemot, J.; Abreu-Junior, C.H. Potassium Fertilization Increases Hydraulic Redistribution and Water Use Efficiency for Stemwood Production in Eucalyptus grandis Plantations. Environ. Exp. Bot. 2020, 176, 104085. [Google Scholar] [CrossRef]
  6. Plomion, C.; Bartholomé, J.; Bouffier, L.; Brendel, O.; Cochard, H.; De Miguel, M.; Delzon, S.; Gion, J.-M.; Gonzalez-Martinez, S.C.; Guehl, J.-M.; et al. Understanding the Genetic Bases of Adaptation to Soil Water Deficit in Trees through the Examination of Water Use Efficiency and Cavitation Resistance: Maritime Pine as a Case Study. J. Plant Hydraul. 2016, 3, e008. [Google Scholar] [CrossRef]
  7. Hakamada, R.E.; Hubbard, R.M.; Moreira, G.G.; Stape, J.L.; Campoe, O.; Ferraz, S.F.D.B. Influence of Stand Density on Growth and Water Use Efficiency in Eucalyptus Clones. For. Ecol. Manag. 2020, 466, 118125. [Google Scholar] [CrossRef]
  8. Binkley, D.; Stape, J.L.; Ryan, M.G. Thinking about Efficiency of Resource Use in Forests. For. Ecol. Manag. 2004, 193, 5–16. [Google Scholar] [CrossRef]
  9. Waghorn, M.J.; Whitehead, D.; Watt, M.S.; Mason, E.G.; Harrington, J.J. Growth, Biomass, Leaf Area and Water-Use Efficiency of Juvenile Pinus radiata in Response to Water Deficits. N. Z. J. For. Sci. 2015, 45, 3. [Google Scholar] [CrossRef]
  10. Berner, L.T.; Law, B.E.; Hudiburg, T.W. Water Availability Limits Tree Productivity, Carbon Stocks, and Carbon Residence Time in Mature Forests across the Western US. Biogeosciences 2017, 14, 365–378. [Google Scholar] [CrossRef]
  11. Pereira, J.S.; Chaves, M.; Caldeira, M.; Correia, A.V. Water Availability and Productivity. In Plant Growth and Climate Change; Morison, J.I.L., Morecroft, M.D., Eds.; Wiley: Hoboken, NJ, USA, 2006; pp. 118–145. ISBN 978-1-4051-3192-6. [Google Scholar]
  12. Guedes, B.S.; Olsson, B.A.; Sitoe, A.A.; Egnell, G. Net Primary Production in Plantations of Pinus taeda and Eucalyptus cloeziana Compared with a Mountain Miombo Woodland in Mozambique. Glob. Ecol. Conserv. 2018, 15, e00414. [Google Scholar] [CrossRef]
  13. Sohel, S.I. Systematic Review and Meta-Analysis Reveals Functional Traits and Climate Are Good Predictors of Tropical Tree Water Use. Trees For. People 2022, 8, 100226. [Google Scholar] [CrossRef]
  14. Li, X.; Farooqi, T.J.A.; Jiang, C.; Liu, S.; Sun, O.J. Spatiotemporal Variations in Productivity and Water Use Efficiency across a Temperate Forest Landscape of Northeast China. For. Ecosyst. 2019, 6, 22. [Google Scholar] [CrossRef]
  15. Wullschleger, S.; Meinzer, F.; Vertessy, R. A Review of Whole-Plant Water Use Studies in Tree. Tree Physiol. 1998, 18, 499–512. [Google Scholar] [CrossRef] [PubMed]
  16. Medrano, H.; Flexas, J.; Ribas-Carbó, M.; Gulías, J. Measuring Water Use Efficiency in Grapevines. In Methodologies and Results in Grapevine Research; Delrot, S., Medrano, H., Or, E., Bavaresco, L., Grando, S., Eds.; Springer: Dordrecht, The Netherlands, 2010; pp. 123–134. ISBN 978-90-481-9282-3. [Google Scholar]
  17. Fernandes, T.J.G.; Del Campo, A.D.; Herrera, R.; Molina, A.J. Simultaneous Assessment, through Sap Flow and Stable Isotopes, of Water Use Efficiency (WUE) in Thinned Pines Shows Improvement in Growth, Tree-Climate Sensitivity and WUE, but Not in WUEi. For. Ecol. Manag. 2016, 361, 298–308. [Google Scholar] [CrossRef]
  18. Medrano Gil, H.; Bota Salort, J.; Cifre Llompart, J.; Flexas Sans, J.; Ribas Carbó, M.; Gulías León, J. Eficiencia En El Uso Del Agua Por Las Plantas. Investig. Geogr. 2007, 43, 63. [Google Scholar] [CrossRef]
  19. Delrot, S.; Medrano, H.; Or, E.; Bavaresco, L.; Grando, S. Methodologies and Results in Grapevine Research; Springer: Dordrecht, The Netherlands, 2010; ISBN 978-90-481-9282-3. [Google Scholar]
  20. Hasanuzzaman, M. Plant Ecophysiology and Adaptation under Climate Change: Mechanisms and Perspectives I: General Consequences and Plant Responses; Springer: Singapore, 2020; ISBN 9789811521553. [Google Scholar]
  21. Farquhar, G.; Richards, R. Isotopic Composition of Plant Carbon Correlates with Water-Use Efficiency of Wheat Genotypes. Funct. Plant Biol. 1984, 11, 539. [Google Scholar] [CrossRef]
  22. Bouvet, J.-M.; Makouanzi Ekomono, C.G.; Brendel, O.; Laclau, J.-P.; Bouillet, J.-P.; Epron, D. Selecting for Water Use Efficiency, Wood Chemical Traits and Biomass with Genomic Selection in a Eucalyptus Breeding Program. For. Ecol. Manag. 2020, 465, 118092. [Google Scholar] [CrossRef]
  23. Stape, J.L.; Binkley, D.; Ryan, M.G.; Do Nascimento Gomes, A. Water Use, Water Limitation, and Water Use Efficiency in a Eucalyptus Plantation. Bosque Valdivia 2004, 25, 35–41. [Google Scholar] [CrossRef]
  24. Otto, M.S.G.; Hubbard, R.M.; Binkley, D.; Stape, J.L. Dominant Clonal Eucalyptus grandis × urophylla Trees Use Water More Efficiently. For. Ecol. Manag. 2014, 328, 117–121. [Google Scholar] [CrossRef]
  25. Battie-Laclau, P.; Delgado-Rojas, J.S.; Christina, M.; Nouvellon, Y.; Bouillet, J.-P.; Piccolo, M.D.C.; Moreira, M.Z.; Gonçalves, J.L.D.M.; Roupsard, O.; Laclau, J.-P. Potassium Fertilization Increases Water-Use Efficiency for Stem Biomass Production without Affecting Intrinsic Water-Use Efficiency in Eucalyptus grandis Plantations. For. Ecol. Manag. 2016, 364, 77–89. [Google Scholar] [CrossRef]
  26. Zhang, Z.; Zhang, L.; Xu, H.; Creed, I.F.; Blanco, J.A.; Wei, X.; Sun, G.; Asbjornsen, H.; Bishop, K. Forest Water-Use Efficiency: Effects of Climate Change and Management on the Coupling of Carbon and Water Processes. For. Ecol. Manag. 2023, 534, 120853. [Google Scholar] [CrossRef]
  27. Chen, S.; Wei, W.; Tong, B.; Chen, L. Effects of Soil Moisture and Vapor Pressure Deficit on Canopy Transpiration for Two Coniferous Forests in the Loess Plateau of China. Agric. For. Meteorol. 2023, 339, 109581. [Google Scholar] [CrossRef]
  28. Rojas Rodríguez, F.; Dagoberto, A.; Aguilar, R.; Roque, R.; Meza, A.; Olman, M.; Gamboa, M.; Arguedas, M. Manual Para Productores de Melina Gmelina arborea en Costa Rica; FONAFIFO: Cartago, Costa Rica, 2004. [Google Scholar]
  29. Ministerio de Agricultura y Desarrollo Rural (MADR). Boletín Estadístico Forestal Marzo 2023; MADR: Bogotá, Colombia, 2023. [Google Scholar]
  30. Guzman, R.Z. Site Productivity Evaluation of Some Yemane (Gmelina arborea Roxb.) Plantations in the Philippines, Ph.D. Thesis, University of the Philippines, Los Baños, Laguna, 1988.
  31. Barrios Trilleras, A.; López Aguirre, A.M.; Báez Aparicio, C.A. Modelamiento de La Productividad de Gmelina arborea Roxb. Con Base En Variables Biofísicas y de Rodal. Colomb. For. 2021, 24, 71–87. [Google Scholar] [CrossRef]
  32. Melo-Cruz, O.; Martínez-Bustamante, E.; Correa-Londoño, G. Indicadores Morfométricos Foliares Para La Detección Temprana Del Estrés Hídrico de Gmelina arborea Roxb. En Sistemas Agroforestales, Santafé de Antioquia. Colomb. For. 2012, 15, 215. [Google Scholar] [CrossRef]
  33. Rojas, A.; Moreno, L.; Melgarejo, L.M.; RodrÃguez, M.M.A. Physiological Response of Gmelina (Gmelina arborea Roxb.) to Hydric Conditions of the Colombian Caribbean. Agron.-Colomb. 2012, 30, 52–58. [Google Scholar]
  34. Arguedas, M.; Rodriguez-Solis, M.; Moya, R.; Berrocal, A. Gmelina arborea “Death Disease” in Fast-Growth Plantations: Effects of Soil and Climatic Conditions on Severity and Incidence and Its Implications for Wood Quality. For. Syst. 2018, 27, e003. [Google Scholar] [CrossRef]
  35. Coy-Rodríguez, V.A.; Vargas-Osorio, L.J.; Varón-López, M.; López-Cardona, N. Identificación de Hongos y Bacterias Asociados a Fustes de Melina (Gmelina arborea Roxb.) En El Departamento Del Tolima, Colombia. Rev. Acad. Colomb. Cienc. Exactas Físicas Nat. 2018, 42, 343. [Google Scholar] [CrossRef]
  36. Fernandez, A.; Fernandez, F.; Imitola, S. Diseño de Un Sistema de Riego Para la Plantación de Gmelina arborea de Aw Faber Castell & TH Reforestación SAS. Bachelor’s Thesis, Universidad del Norte, Barranquilla, Colombia, 2018. [Google Scholar]
  37. Rodriguez, J.; Urueña, E.; Borralho, N. Mejoramiento de Semillas Para Incrementar Las Plantaciones de Teca (Tectona grandis L.f.) y Melina (Gmelina arborea Roxb.) En El Departamento de Tolima; Corporación Nacional de Investigación y Fomento Forestal (CONIF): Bogotá, Colombia, 2011. [Google Scholar]
  38. Niño Lopez, G.S.; Ramos Molina, P.A.; Barrios Trilleras, A.; López Aguirre, A.M. Modelos Compatibles de Ahusamiento-Volumen Para Árboles de Gmelina arborea Roxb. En El Alto Magdalena, Colombia. Colomb. For. 2018, 21, 174–187. [Google Scholar] [CrossRef]
  39. Collazos, J.C.; Barrios Trilleras, A.; Diaz Sierra, D.R. Modelos de Altura Dominante Para Gmelina arborea Roxb. En Colombia. Colomb. For. 2024, 27, e20569. [Google Scholar] [CrossRef]
  40. Obando, D. Interceptación de La Radiación, Acumulación y Distribución de Biomasa y Contenido de Carbono En Gmelina arborea Roxb. y Pochota Quinata (Jacq) Dugand. Bachelor’s Thesis, Universidad del Tolima, Ibagué, Colombia, 2004. [Google Scholar]
  41. Rodriguez, N. Guía Para La Cuantificación de La Biomasa y El Carbono Forestal, Generación de Modelos y Uso de Herramientas Para Su Estimación; Corporación Autonóma Regional de Cundinamarca—CAR: Bogotá, Colombia, 2013. [Google Scholar]
  42. López-Aguirre, A.M.; Barrios-Trilleras, A.; Melo-Cruz, O.A. Balancing Wood Production and Water Use Efficiency in the Selection of Open-Pollinated Families of Gmelina arborea. New For. 2024, 55, 961–978. [Google Scholar] [CrossRef]
  43. Arias, D.; Calvo-Alvarado, J.; Dohrenbusch, A. Calibration of LAI-2000 to Estimate Leaf Area Index (LAI) and Assessment of Its Relationship with Stand Productivity in Six Native and Introduced Tree Species in Costa Rica. For. Ecol. Manag. 2007, 247, 185–193. [Google Scholar] [CrossRef]
  44. Barrios, A.; Trincado, G.; Garreaud, R. Alternative Approaches for Estimating Missing Climate Data: Application to Monthly Precipitation Records in South-Central Chile. For. Ecosyst. 2018, 5, 28. [Google Scholar] [CrossRef]
  45. Zhao, C.Y.; Si, J.H.; Feng, Q.; Yu, T.F.; Li, P.D. Comparative Study of Daytime and Nighttime Sap Flow of Populus euphratica. Plant Growth Regul. 2017, 82, 353–362. [Google Scholar] [CrossRef]
  46. Allen, R.G. Crop Evapotranspiration: Guidelines for Computing Crop Water Requirements; FAO Irrigation and Drainage Paper; Food and Agriculture Organization of the United Nations: Rome, Italy, 2000; ISBN 978-92-5-104219-9. [Google Scholar]
  47. La Manna, L.; Tarabini, M.; Gomez, F.; Noli, P.A.; Vogel, B.; Buduba, C.G. Estimación de La Capacidad de Retención de Agua de Suelos Volcánicos En Función de Variables de Fácil Determinación a Campo. Cienc. Suelo 2018, 36, 23–29. [Google Scholar]
  48. R Core Team. R: A Language and Environment for Statistical Computing; R Foundation for Statistical Computing: Vienna, Austria, 2024. [Google Scholar]
  49. RStudio Team. RStudio: Integrated Development Environment for R; RStudio, PBC.: Boston, MA, USA, 2020. [Google Scholar]
  50. Hair, J.F.; Anderson, R.E.; Tatham, R.L.; Black, W.C. Análise Multivariada de Dados; Artmed: Porto Alegre, Brazil, 2021; ISBN 978-85-363-0482-3. [Google Scholar]
  51. Badii, M.H.; Castillo, J. Análisis de Correlación Canónica (ACC) e Investigación Científica. Rev. Innovaciones Neg. 2017, 4, 405–422. [Google Scholar] [CrossRef]
  52. Johnson, R.A.; Wichern, D.W. Applied Multivariate Statistical Analysis, 6th ed.; Pearson/Prentice Hall: Upper Saddle River, NJ, USA, 2007; ISBN 978-0-13-187715-3. [Google Scholar]
  53. Everitt, B.S. An R and S-PLUS® Companion to Multivariate Analysis; Springer Texts in Statistics; Springer: London, UK, 2005; ISBN 978-1-85233-882-4. [Google Scholar]
  54. Maier, C.A.; Albaugh, T.J.; Cook, R.I.; Hall, K.; McInnis, D.; Johnsen, K.H.; Johnson, J.; Rubilar, R.A.; Vose, J.M. Comparative Water Use in Short-Rotation Eucalyptus benthamii and Pinus taeda Trees in the Southern United States. For. Ecol. Manag. 2017, 397, 126–138. [Google Scholar] [CrossRef]
  55. Albaugh, J.M.; Dye, P.J.; King, J.S. Eucalyptus and Water Use in South Africa. Int. J. For. Res. 2013, 2013, 852540. [Google Scholar] [CrossRef]
  56. Skubel, R.; Arain, M.A.; Peichl, M.; Brodeur, J.J.; Khomik, M.; Thorne, R.; Trant, J.; Kula, M. Age Effects on the Water-use Efficiency and Water-use Dynamics of Temperate Pine Plantation Forests. Hydrol. Process. 2015, 29, 4100–4113. [Google Scholar] [CrossRef]
  57. Gyenge, J.; Fernández, M.E.; Sarasola, M.; Schlichter, T. Testing a Hypothesis of the Relationship between Productivity and Water Use Efficiency in Patagonian Forests with Native and Exotic Species. For. Ecol. Manag. 2008, 255, 3281–3287. [Google Scholar] [CrossRef]
  58. Melo-Cruz, O.; Guzman Betancourt, A.; Rojas Urquiza, A. Ecología y Funcionalidad de La Gmelina arborea Roxb.: Aplicada a La Silvicultura En Áreas de Bosque Seco Tropical; Sello Editorial Universidad del Tolima: Ibagué, Colombia, 2019; ISBN 978-958-55-6939-3. [Google Scholar]
  59. Fardusi, M.J.; Ferrio, J.P.; Comas, C.; Voltas, J.; Resco De Dios, V.; Serrano, L. Intra-Specific Association between Carbon Isotope Composition and Productivity in Woody Plants: A Meta-Analysis. Plant Sci. 2016, 251, 110–118. [Google Scholar] [CrossRef] [PubMed]
  60. Zhou, X.; Geng, X.; Yin, G.; Hänninen, H.; Hao, F.; Zhang, X.; Fu, Y.H. Legacy Effect of Spring Phenology on Vegetation Growth in Temperate China. Agric. For. Meteorol. 2020, 281, 107845. [Google Scholar] [CrossRef]
  61. Zhang, Q.; Ficklin, D.L.; Manzoni, S.; Wang, L.; Way, D.; Phillips, R.P.; Novick, K.A. Response of Ecosystem Intrinsic Water Use Efficiency and Gross Primary Productivity to Rising Vapor Pressure Deficit. Environ. Res. Lett. 2019, 14, 074023. [Google Scholar] [CrossRef]
  62. Yang, Z.; Liu, J.; Poree, F.; Schaeufele, R.; Helmke, H.; Frackenpohl, J.; Lehr, S.; Von Koskull-Döring, P.; Christmann, A.; Schnyder, H.; et al. Abscisic Acid Receptors and Coreceptors Modulate Plant Water Use Efficiency and Water Productivity. Plant Physiol. 2019, 180, 1066–1080. [Google Scholar] [CrossRef] [PubMed]
  63. Feng, H.; Xu, T.; Liu, L.; Zhou, S.; Zhao, J.; Liu, S.; Xu, Z.; Mao, K.; He, X.; Zhu, Z.; et al. Modeling Transpiration with Sun-Induced Chlorophyll Fluorescence Observations via Carbon-Water Coupling Methods. Remote Sens. 2021, 13, 804. [Google Scholar] [CrossRef]
  64. Hakamada, R.; Prados-Coronado, J.; Lages, C.; Vrechi, A.; Zuñiga-Grajeda, V.; Villota-Gonzalez, F.H.; Sulbaran-Rangel, B. Initial Growth of Gmelina arborea and Efficacy of RGB Image to Capture Canopy Area in a Large Range of Stockings. Remote Sens. 2023, 15, 4751. [Google Scholar] [CrossRef]
  65. Stape, J.L.; Binkley, D. Insights from Full-Rotation Nelder Spacing Trials with Eucalyptus in São Paulo, Brazil. South. For. J. For. Sci. 2010, 72, 91–98. [Google Scholar] [CrossRef]
  66. Forrester, D.I.; Collopy, J.J.; Beadle, C.L.; Warren, C.R.; Baker, T.G. Effect of Thinning, Pruning and Nitrogen Fertiliser Application on Transpiration, Photosynthesis and Water-Use Efficiency in a Young Eucalyptus nitens Plantation. For. Ecol. Manag. 2012, 266, 286–300. [Google Scholar] [CrossRef]
  67. Yu, G.; Song, X.; Wang, Q.; Liu, Y.; Guan, D.; Yan, J.; Sun, X.; Zhang, L.; Wen, X. Water-use Efficiency of Forest Ecosystems in Eastern China and Its Relations to Climatic Variables. New Phytol. 2008, 177, 927–937. [Google Scholar] [CrossRef] [PubMed]
  68. Liu, Z.; Ji, X.; Ye, L.; Jiang, J. Inherent Water-Use Efficiency of Different Forest Ecosystems and Its Relations to Climatic Variables. Forests 2022, 13, 775. [Google Scholar] [CrossRef]
  69. Henri, C.J. Soil-Site Productivity of Gmelina arborea, Eucalyptus urophylla and Eucalyptus grandis Forest Plantations in Western Venezuela. For. Ecol. Manag. 2001, 144, 255–264. [Google Scholar] [CrossRef]
  70. Binkley, D.; Fisher, R.F. Ecology and Management of Forest Soils, 1st ed.; Wiley: Hoboken, NJ, USA, 2019; ISBN 978-1-119-45565-3. [Google Scholar]
  71. White, P.J. Calcium in Plants. Ann. Bot. 2003, 92, 487–511. [Google Scholar] [CrossRef] [PubMed]
  72. Yin, Y.; Zhou, Y.-B.; Li, H.; Zhang, S.-Z.; Fang, Y.; Zhang, Y.-J.; Zou, X. Linking Tree Water Use Efficiency with Calcium and Precipitation. Tree Physiol. 2022, 42, 2419–2431. [Google Scholar] [CrossRef] [PubMed]
  73. Roshetko, J.M. Agroforestry Species and Technologies: A Compilation of the Highlights and Factsheets Published by NFTA and FACT Net 1985–1999; Winrock: Morrilton, AR, USA, 2001; ISBN 978-1-57360-032-3. [Google Scholar]
  74. Xue, B.-L.; Guo, Q.; Otto, A.; Xiao, J.; Tao, S.; Li, L. Global Patterns, Trends, and Drivers of Water Use Efficiency from 2000 to 2013. Ecosphere 2015, 6, 1–18. [Google Scholar] [CrossRef]
  75. Barrios Trilleras, A.; López Aguirre, A.M.; Nieto, V. Experiencias y Avances en el Manejo Silvícola de Plantaciones Forestales Comerciales; Corporación Nacional de Investigación y Fomento Forestal—CONIF: Bogotá, Colombia, 2011; ISBN 978-958-99597-6. [Google Scholar]
  76. Calvo-Alvarado, J.; Dagoberto, A.; Jimenez Rodriguez, C.; Montero, J. Efecto de Cinco Sustratos En El Contenido Foliar de Nutrientes y Crecimiento Inicial de Tres Especies Forestales Empleadas En Mesoamérica. Rev. For. Mesoam. Kurú 2008, 5, 1–15. [Google Scholar]
  77. Barrios, A.; López, A.M.; Nieto, V.; Burgos, N.; Yaya, M.; González, I. Efecto Del Control de Malezas y Fertilización Sobre El Crecimiento Inicial de Gmelina arborea Roxb. En El Departamento Del Tolima, Colombia. Colomb. For. 2011, 14, 31. [Google Scholar] [CrossRef]
  78. Urueña Lozano, H. Assessing Different Stocking Regimes in a Plantation of Gmelina arborea in Northern Colombia. New For. 2004, 28, 287–291. [Google Scholar] [CrossRef]
Figure 1. Geographic location of the study area along the Magdalena River basin. The red-filled circles represent the monitored sites within the inter-Andean valleys, and the red-filled triangles indicate the monitored sites in the Caribbean plains.
Forests 15 01192 g001
Figure 2. Means and 95% confidence intervals for stand, climate, and soil variables for G. arborea stands in the inter-Andean valleys and the Caribbean plains. Site index (a), relative spacing (b), mean annual increment in volume (c), aridity index (d), maximum air temperature (e), maximum vapor pressure deficit (f), soil texture (g), soil available water capacity (h) and soil calcium content (i).
Forests 15 01192 g002
Figure 3. Variation in WUE in total biomass (a) and total volume (b) for G. arborea stands grown in the inter-Andean valleys and Caribbean plains of the Magdalena River basin, Colombia. Green plus sign represents the mean.
Forests 15 01192 g003
Figure 4. Pearson correlation coefficients (r) and statistical significance for WUETB (solid green circles) and WUEV (empty green circles) and stand and site (climate and soil) variables. Correlation coefficients beyond the dotted lines are highly significant (p < 0.001); those between the dotted lines and the dot-dash lines are significant (p < 0.01); those between the dot-dash lines and the dashed lines are significant (p < 0.05); the gray area is not significant (p > 0.05).
Forests 15 01192 g004
Figure 5. Analysis of the first pair of canonical variables (u1, red) and (v1, cyan). (a) Scatter plot of the standardized values of the first pair of canonical variables (u1, v1), (b) canonical loadings and cross-loadings between the original variables in set v1 (WUETB, WUEV) and each canonical variable (u1, v1), and (c) canonical loadings and cross-loadings between the original variables in set u1 (stand and site variables) and each canonical variable (u1, v1).
Forests 15 01192 g005
Figure 6. Factors influencing water use efficiency of G. arborea forest stands. Effects of age (a), site quality (b), stand density (c), stocking levels derived from RS classes (d), soil textural class (e), and climate type derived from AI (f). The error bars represent the standard deviation.
Forests 15 01192 g006
Figure 7. Relationship between MAITB and WUE in total biomass (a) and volume (b). Data points with circles represent PSPs in the inter-Andean valleys, and triangles represent PSPs in the Caribbean plains. Lines represent models fitted to the data, with model equations and coefficients of determination displayed for each relationship. The gradient from blue to red shows the increase in WUE.
Forests 15 01192 g007
Table 1. Descriptive statistics of stand variables in the last measurement of monitored PSPs of G. arborea in the inter-Andean valleys and the Caribbean plains of the Magdalena River basin.
Stand VariableMeanStandard DeviationMinimumMaximum
Age (yr)7.23.52.215.5
Dominant height (H, m)17.15.86.327.9
Site index (SI, m)21.93.613.129.0
Density (N, trees ha−1)660.0171.4225.01020.0
Basal area (BA, m2 ha−1)16.77.82.734.2
Relative spacing (RS)0.30.10.10.6
Leaf area index (LAI, m2 m−2)6.52.70.711.8
Volume (V, m3 ha−1)114.376.66.1290.8
MAI in volume (MAIV, m3 ha−1 yr−1)15.67.61.630.8
Total biomass (TB, Mg ha−1)71.239.911.1171.4
MAI in TB (MAITB, Mg ha−1 yr−1)10.44.42.821.8
Table 2. Descriptive statistics of climate variables during the period between 2007 and 2014 in the inter-Andean valleys and the Caribbean plains of the Magdalena River basin.
VariableMeanStandard DeviationMinimumMaximum
Annual precipitation (Pm, mm yr−1)1566.8435.7854.03218.1
Reference evapotranspiration (ET0, mm yr−1)1508.0134.11292.02599.4
Actual evapotranspiration (ETa, mm yr−1)1313.5116.81125.32264.1
Aridity index (AI, mm mm−1)1.060.350.442.28
Net solar radiation (Rn, MJ m−2 yr−1)3759.9232.13229.44217.3
Mean air temperature (Tm, °C)28.20.626.729.7
Minimum air temperature (Tmn, °C)22.70.621.324.1
Maximum air temperature (Tmx, °C)33.70.931.535.6
Relative humidity (RH, %)76.93.065.883.6
Vapor pressure deficit (VPD, kPa)1.150.140.871.56
Wind speed (Ws, m s−1)1.890.641.198.87
Table 3. Descriptive statistics of soil variables monitored in G. arborea stands in the inter-Andean valleys and the Caribbean plains of the Magdalena River basin.
VariablesMeanStandard DeviationMinimumMaximum
Soil texture (Tex)6.04.11.011.0
Available water content (AWC, cm3 cm−3)0.120.020.070.16
Soil pH5.930.934.127.60
Organic matter (OM, %)2.251.430.027.21
Phosphorus (P, ppm)23.019.41.786.5
Potassium (K, meq 100 g−1)0.200.170.030.70
Cation exchange capacity (CEC, meq 100 g−1)23.415.14.660.0
Calcium (Ca, meq 100 g−1)14.39.71.038.2
Magnesium (Mg, meq 100 g−1)8.18.00.234.4
Sodium (Na, meq 100 g−1)0.400.500.052.67
Table 4. Canonical correlations between stand and site variables (uk) and WUE (vk), with eigenvalues (R2) and their statistical significance (p-value).
Canonical Variable PairsCanonical Correlation (R)Canonical R2Mult. Fdf1df2p-Value
(u1, v1) 0.9490.90111.86266158<0.001
(u2, v2) 0.8450.7146.2533280<0.001
Disclaimer/Publisher’s Note: The statements, opinions and data contained in all publications are solely those of the individual author(s) and contributor(s) and not of MDPI and/or the editor(s). MDPI and/or the editor(s) disclaim responsibility for any injury to people or property resulting from any ideas, methods, instructions or products referred to in the content.

