Article

Relationship between Urban Forest Fragmentation and Urban Shrinkage in China Differentiated by Moisture and Altitude

1
Institute of Remote Sensing and Earth Sciences, Hangzhou Normal University, Zhejiang Provincial Key Laboratory of Urban Wetlands and Regional Change, Hangzhou 311121, China
2
Kharkiv Institute at Hangzhou Normal University, Hangzhou Normal University, Hangzhou 311121, China
3
Hebei Key Laboratory of Mining Development and Security Technology, Hebei Industrial Technology Institute of Mine Ecological Remediation, College of Mining Engineering, North China University of Science and Technology, Tangshan 063210, China
*
Author to whom correspondence should be addressed.
Forests 2024, 15(9), 1522; https://doi.org/10.3390/f15091522
Submission received: 12 August 2024 / Revised: 27 August 2024 / Accepted: 28 August 2024 / Published: 29 August 2024
(This article belongs to the Special Issue Urban Green Infrastructure and Urban Landscape Ecology)

Abstract

:
Forest fragmentation and urban shrinkage have become the focus of attention in global ecological conservation, with the goal of achieving sustainable development. However, few studies have been concerned with urban forest patterns in shrinking cities. It is necessary to explore whether the loss of the population will mitigate urban forest degradation. Thus, in this study, 195 shrinking cities were identified based on demographic datasets to characterize the spatiotemporal patterns of urban forests in China against a depopulation background. To illustrate the explicit spatial evolution of urban forests in shrinking cities in China, in this study, we reclassified land-use products and determined the annual spatial variations from 2000 to 2022 using area-weighted centroids and landscape pattern indexes. The effects of different climatic and topographical conditions on the spatiotemporal variations in the urban forest patterns against population shrinkage were discussed. The results demonstrated that the forest coverage rate in the shrinking cities of China increased from 40.05 to 40.47% with a generally southwestern orientation, and the most frequent decrease appeared from 2010 to 2015. Except for the temperate humid and sub-humid Northeast China, with plains and hills, all geographical sub-regions of the shrinking cities exhibited growing urban forests. Relatively stable movement direction dynamics and dramatic area changes in climatic sub-regions with large forest coverage were observed. The urban forest centroids of shrinking cities at a lower elevation exhibited more fluctuating changes in direction. The urban forests in the shrinking cities of China were slightly fragmented, and this weakened condition was identified via the decelerating fragmentation. The urban forests of the shrinking cities in the warm-temperate, humid, and sub-humid North China and basin regions exhibited the most pattern variations. Therefore, it is emphasized that the monitoring of policy implementation is essential due to the time lag of national policies in shrinking cities, especially within humid and low-altitude regions. This research concludes that the mitigation of urban deforestation in the shrinking cities of China is greatly varied according to moisture and altitude and sheds light on the effects of the population density from a new perspective, providing support for urban forest management and improvements in the quality of residents’ lives.

1. Introduction

Due to increasing urbanization, natural ecosystems have suffered substantial and frequent disturbances, especially those with widespread impervious surfaces, resulting in environmental concerns [1,2,3]. Forests in urban ecosystems, characterized by a strong interconnection between human activity and the natural environment, have been recognized for their irreplaceable contributions to the sustainable development goals, such as pollution reduction, the mitigation of urban heat island effects, and biodiversity [4,5,6]. Hence, urban forest monitoring has attracted attention from scholars and organizations worldwide [7,8].
Field-based observations of urban forests are fundamental for city governments to quantify the benefits of monitoring, but they are costly and exhibit efficiency constraints [9,10]. Satellite remote sensing techniques provide spatially explicit and comparable data, especially the Landsat series, with a long time sequence and adequate spatial resolution for regional research. Such techniques have become the mainstream in field observations to characterize, monitor, and manage urban forests [11,12]. The remote-sensing-based monitoring of urban forests has rapidly progressed with regard to vegetation mapping and parameter retrieval, as has the analysis of spatiotemporal patterns and driving forces [13,14,15]. Kowe et al. [16] analyzed the long-term fragmentation of urban forests in a metropolitan city using landscape indexes derived from Landsat-based land-use maps. Yang et al. [17] assessed the forest degradation in agglomerations in China based on spatial centroids. Huang et al. [18] quantified the responses of urban forests to natural and artificial pressure via a comparative study in two typical urban agglomerations using vegetation indexes from Landsat images. Despite these great advancements, urban forest patterns have traditionally been explored within metropolises. In contrast to the explosive growth in the urban population of these metropolises, some regions are currently experiencing shrinkages, characterized by population loss, and are called shrinking cities [19,20]. Against the background of depopulation, human disturbance is weakened and the pressure on this urban ecosystem is partly relieved, which alleviates the environmental effects and optimizes the ecological conditions [21,22]. Thus, studying the spatiotemporally explicit patterns of urban forests in shrinking cities, which are not well documented, could provide new insights for humans regarding the mitigation of environmental effects and the regulation of regional environments.
In this study, previous land-use maps from the Landsat series from 2000 to 2022 were adopted to determine the spatiotemporal pattern dynamics of urban forests in shrinking cities in China. The main goal was to explore whether urban forest fragmentation in shrinking cities displayed a certain trend. Taking China as the study area, a country representative of complex urban forest ecosystems, the insufficiently studied relationship between forest fragmentation and urban shrinkage was explored so as to guide policymaking and support global ecological conservation. To reveal the evolution characteristics, the long-term quantification of urban forest patterns in shrinking cities was performed, with an additional focus on the geographical sub-regions and climatic and topographical conditions. The detailed objectives were as follows: (1) quantify the annual forest variations in the shrinking cities of China within the context of various geographical stratifications; (2) map the annual direction of urban forest changes in shrinking cities with different climatic and topographical conditions; and (3) analyze the annual spatial patterns in forests with diverse geographical conditions in shrinking cities. The insights acquired from our findings can inform strategic decision-making regarding the mitigation of environmental effects in depopulated areas.

2. Materials and Methods

2.1. Study Area

The study area included all shrinking cities within China, belonging to 25 provinces, as shown in Figure 1a. The identification of the shrinking cities via a demographic indicator is described in Section 2.3.1. Considering the temperatures, precipitation, and moisture over multiple years, China was separated into seven sub-regions [23,24], i.e., the temperate and warm-temperate desert of Northwest China (TWTD), the temperate grassland of Inner Mongolia (TG), the temperate humid and sub-humid Northeast China (THSH), the warm-temperate humid and sub-humid North China (WTHSH), the subtropical humid Central and South China (STH), the Qinghai–Tibet Plateau (QTP), and the tropic humid South China (TH) (Figure 1b). Topography was diversified in China, with a rising three-terrace topography from the east to the west [25]. According to a digital elevation model and the national standard [26], there were five types of topographical landscapes, namely plains, hills, basins, mountains, and plateaus (Figure 1c).

2.2. Data Preprocessing
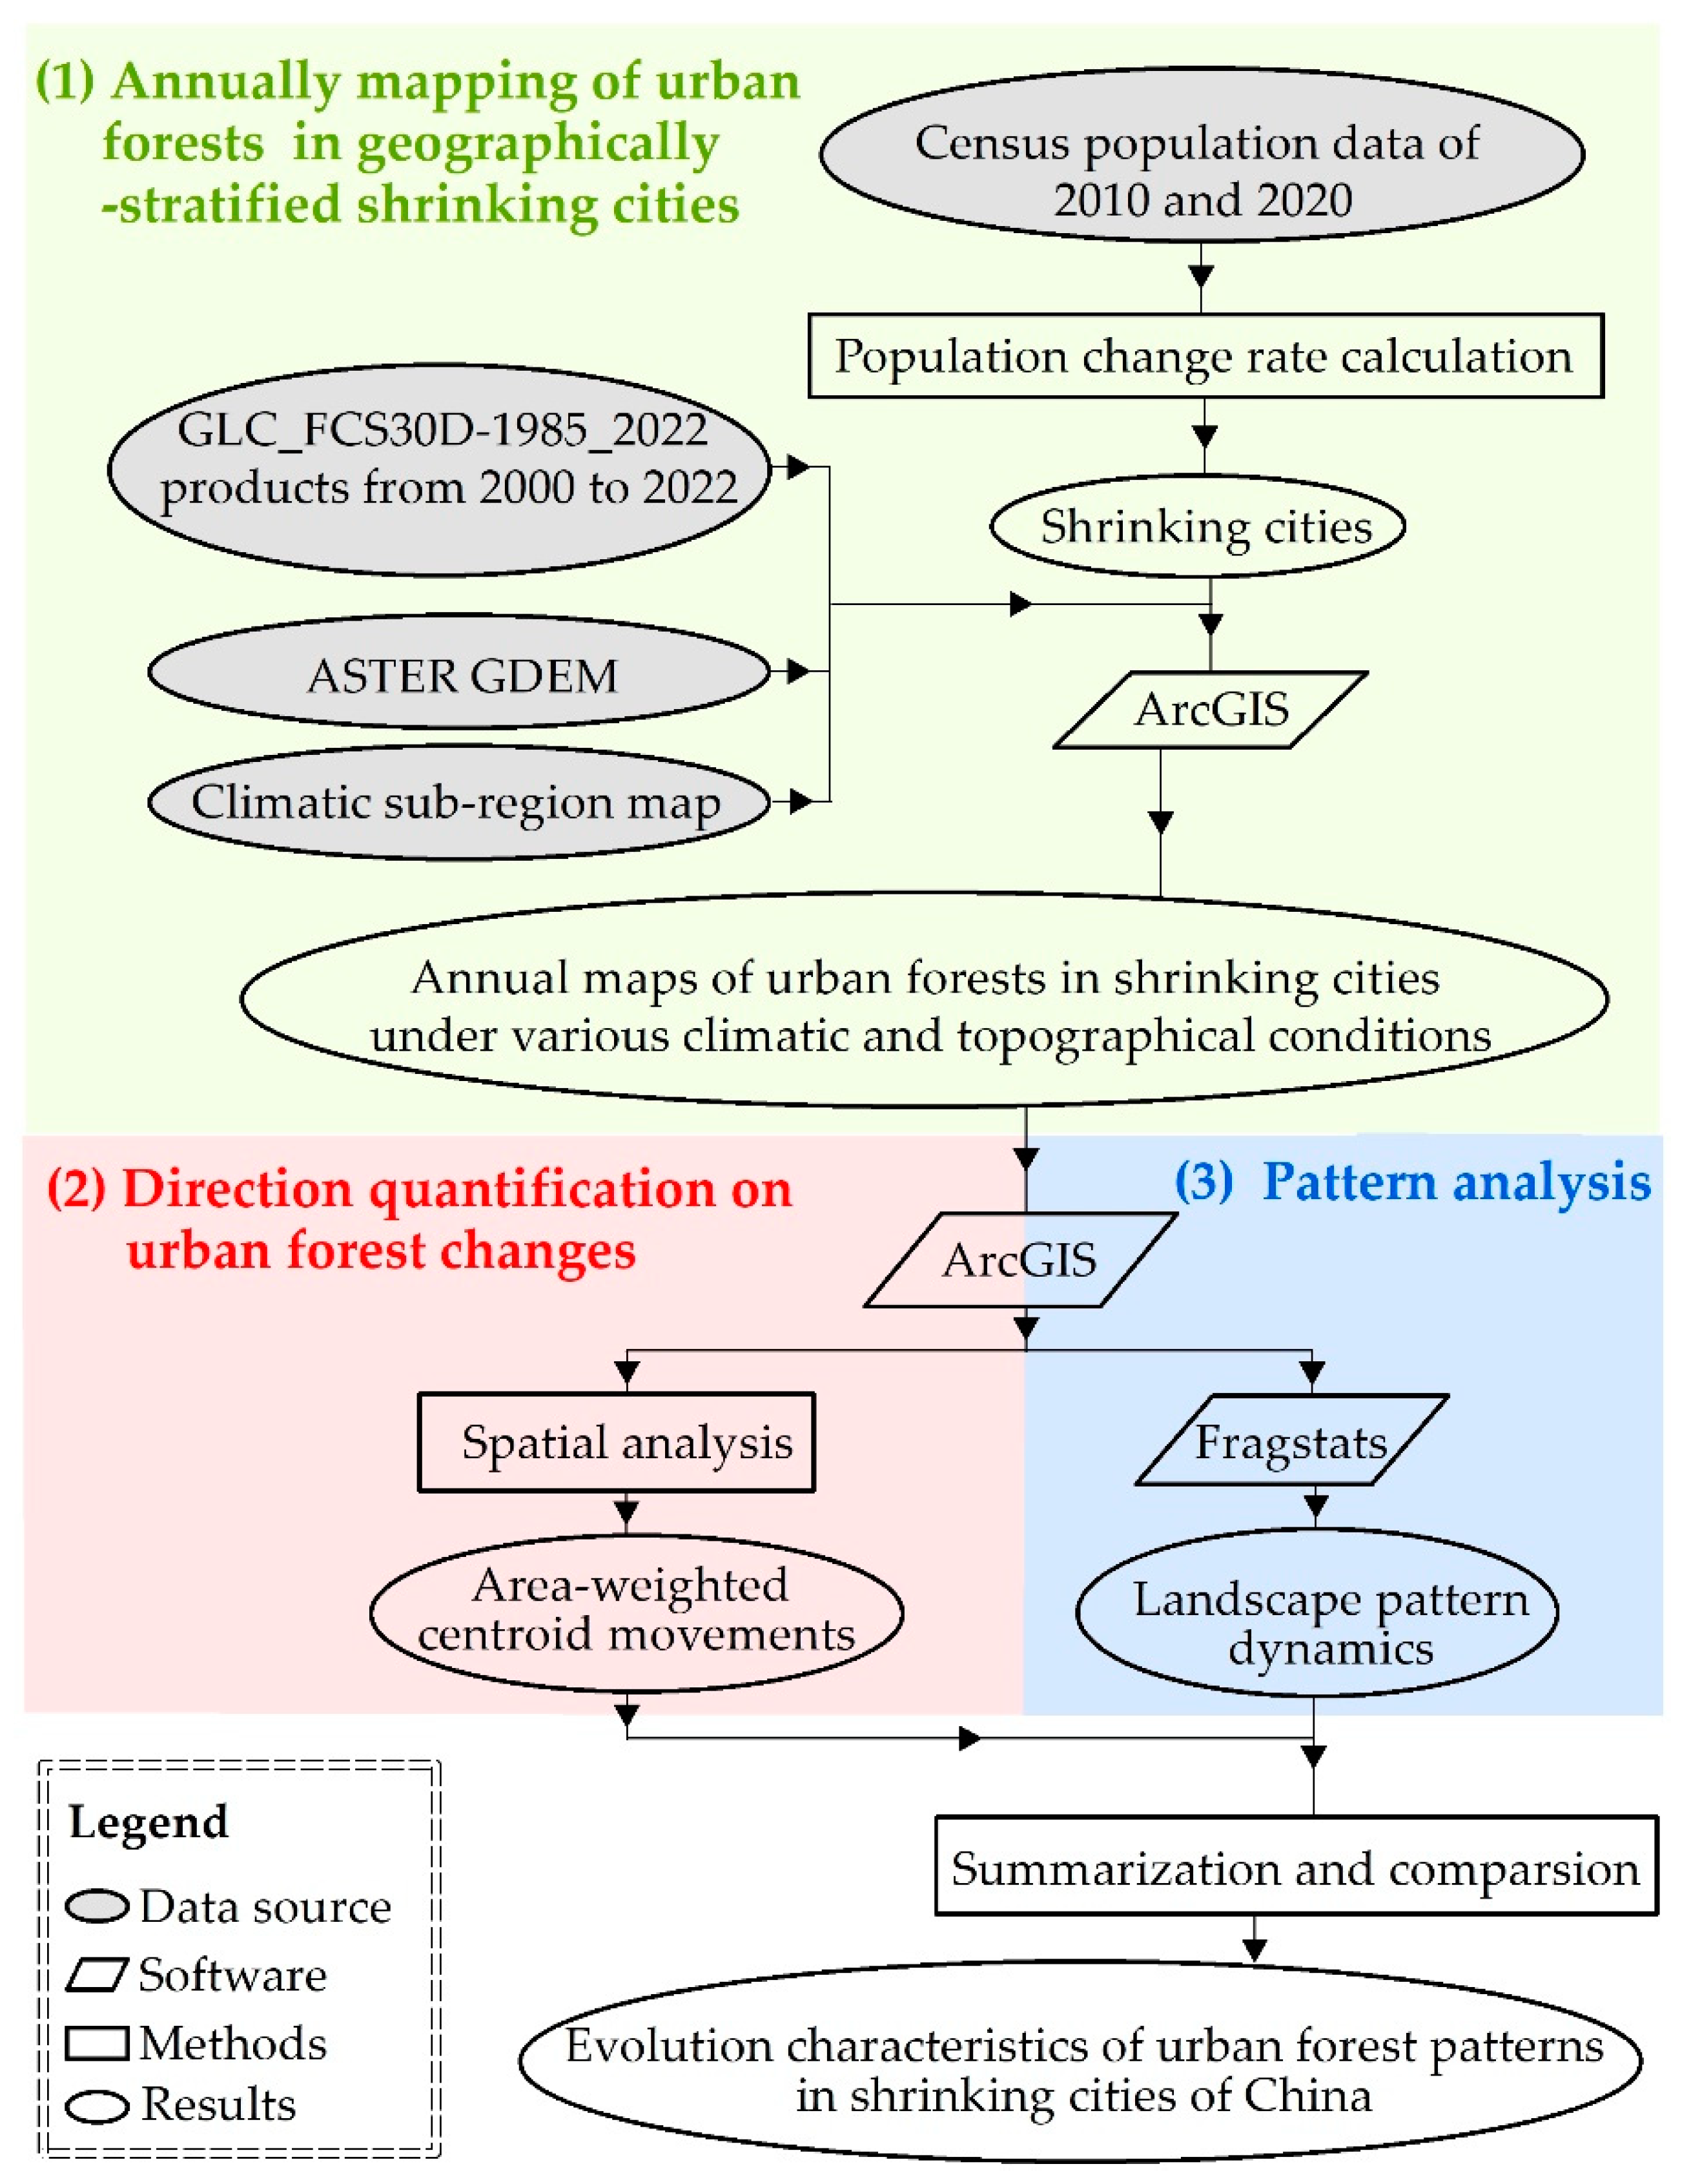
To identify shrinking cities based on urban population loss, the county-level population census data of China from the sixth (2010) and seventh censuses (2020) were collected [27,28]. A total of 1978 products covering all the shrinking cities were downloaded and preprocessed in this study, as listed in Table 1, including 1702 land-use maps from the global 30 m land-cover products with a fine classification system (GLC_FCS30D) and 276 images from the Advanced Spaceborne Thermal Emission and Reflection Radiometer (ASTER) Global Digital Elevation Model (GDEM) Version 3. The classification system was reclassified according to the needs of this study. The forests defined in this study included the following classes in GLC_FCS30D products: open/closed broadleaved evergreen forests, deciduous broadleaved forests, needle-leaved evergreen forests, needle-leaved deciduous forests, and mixed-leaf forests [29]. Indeed, annual forest maps were acquired by merging the above 10 forest classes (Figure S1). The topography based on GDEM images was also reclassified, as reported in Section 2.1, into five types (Figure 1c). All products were re-projected into Albers equal-area projection, and then they were mosaicked and extracted via a mask of the study area. To further elucidate evolution characteristics, the preprocessed land-use products were clipped via the sub-regions of seven climate types and five topographies.

2.3. Methods

In order to reveal the evolution characteristics of urban forest patterns in shrinking cities, the framework shown in Figure 2 was designed. This framework consists of the following three sections: (1) annual quantifications of urban forests in shrinking cities and the summarizing of forest areas by different climatic and topographical sub-regions; (2) mapping the direction of urban forest changes by employing the spatial centroid and carrying out comparisons among those sub-regions; and (3) analyzing the spatial pattern dynamics of urban forests derived from landscape pattern indexes and extrapolating by geographical condition.

2.3.1. Population Change Rate

In this study, the population change rate (PCR) was calculated based on demographic datasets to identify shrinking cities in China [30,31]. To assume the validity and continuity of demographic data, PCR was constructed by the year-end total population on a county scale as follows:
PCR i = P t 2 P t 1 P t 1 × 100 %
where P t 1 and P t 2 represent the total population at the terminals t1 and t2 of the year in a city i, respectively. If the PCR is below zero within a special period, this county is identified as a shrinking city, with a smaller value indicating more intense shrinkage. In total, 195 county-level cities were identified based on a negative PCR between the two censuses, as shown in Figure 1a.

2.3.2. Direction Quantification of Forest Dynamics

The area-weighted centroid, as a pair of coordinates calculated on the basis of the area-weighted geometric center of polygons, is commonly used to carry out the valid quantification of spatial change orientations [32,33]. Based on the forest polygons extracted from preprocessed GLC_FCS30D products in 195 shrinking cities, the spatial centroids were mapped by means of spatial analysis tools in ArcGIS 10.2 software as follows:
X t = i = 1 N ( C ti · X i ) / i = 1 N C ti Y t = i = 1 N ( C ti · Y i ) / i = 1 N C ti
where Xt and Yt refer to the longitude and latitude of an area-weighted centroid of urban forests in year t, respectively; Cti is the area of patch i in year t; Xi and Yi are the longitude and latitude of urban forest patch i, respectively; and N is the total patch number of forests. If urban forests expand or contract similarly in every direction, this area-weighted centroid remains constant; otherwise, this centroid turns to the orientation by which the forests expand or contract more.

2.3.3. Landscape Pattern Indexes

Generally, the soaring populations residing in urbanized areas exert a substantial force on forests, resulting in diversity fragmentation and damage [34,35]. To delineate the landscape configuration of urban forests in shrinking cities, indexes from the relevant literature were calculated using the Fragstats 4.2 software, as shown in Table 2 [36,37,38]. Dominance, complexity, aggregation, and fragmentation were depicted via these typical indexes at a forest landscape level [39,40].

3. Results

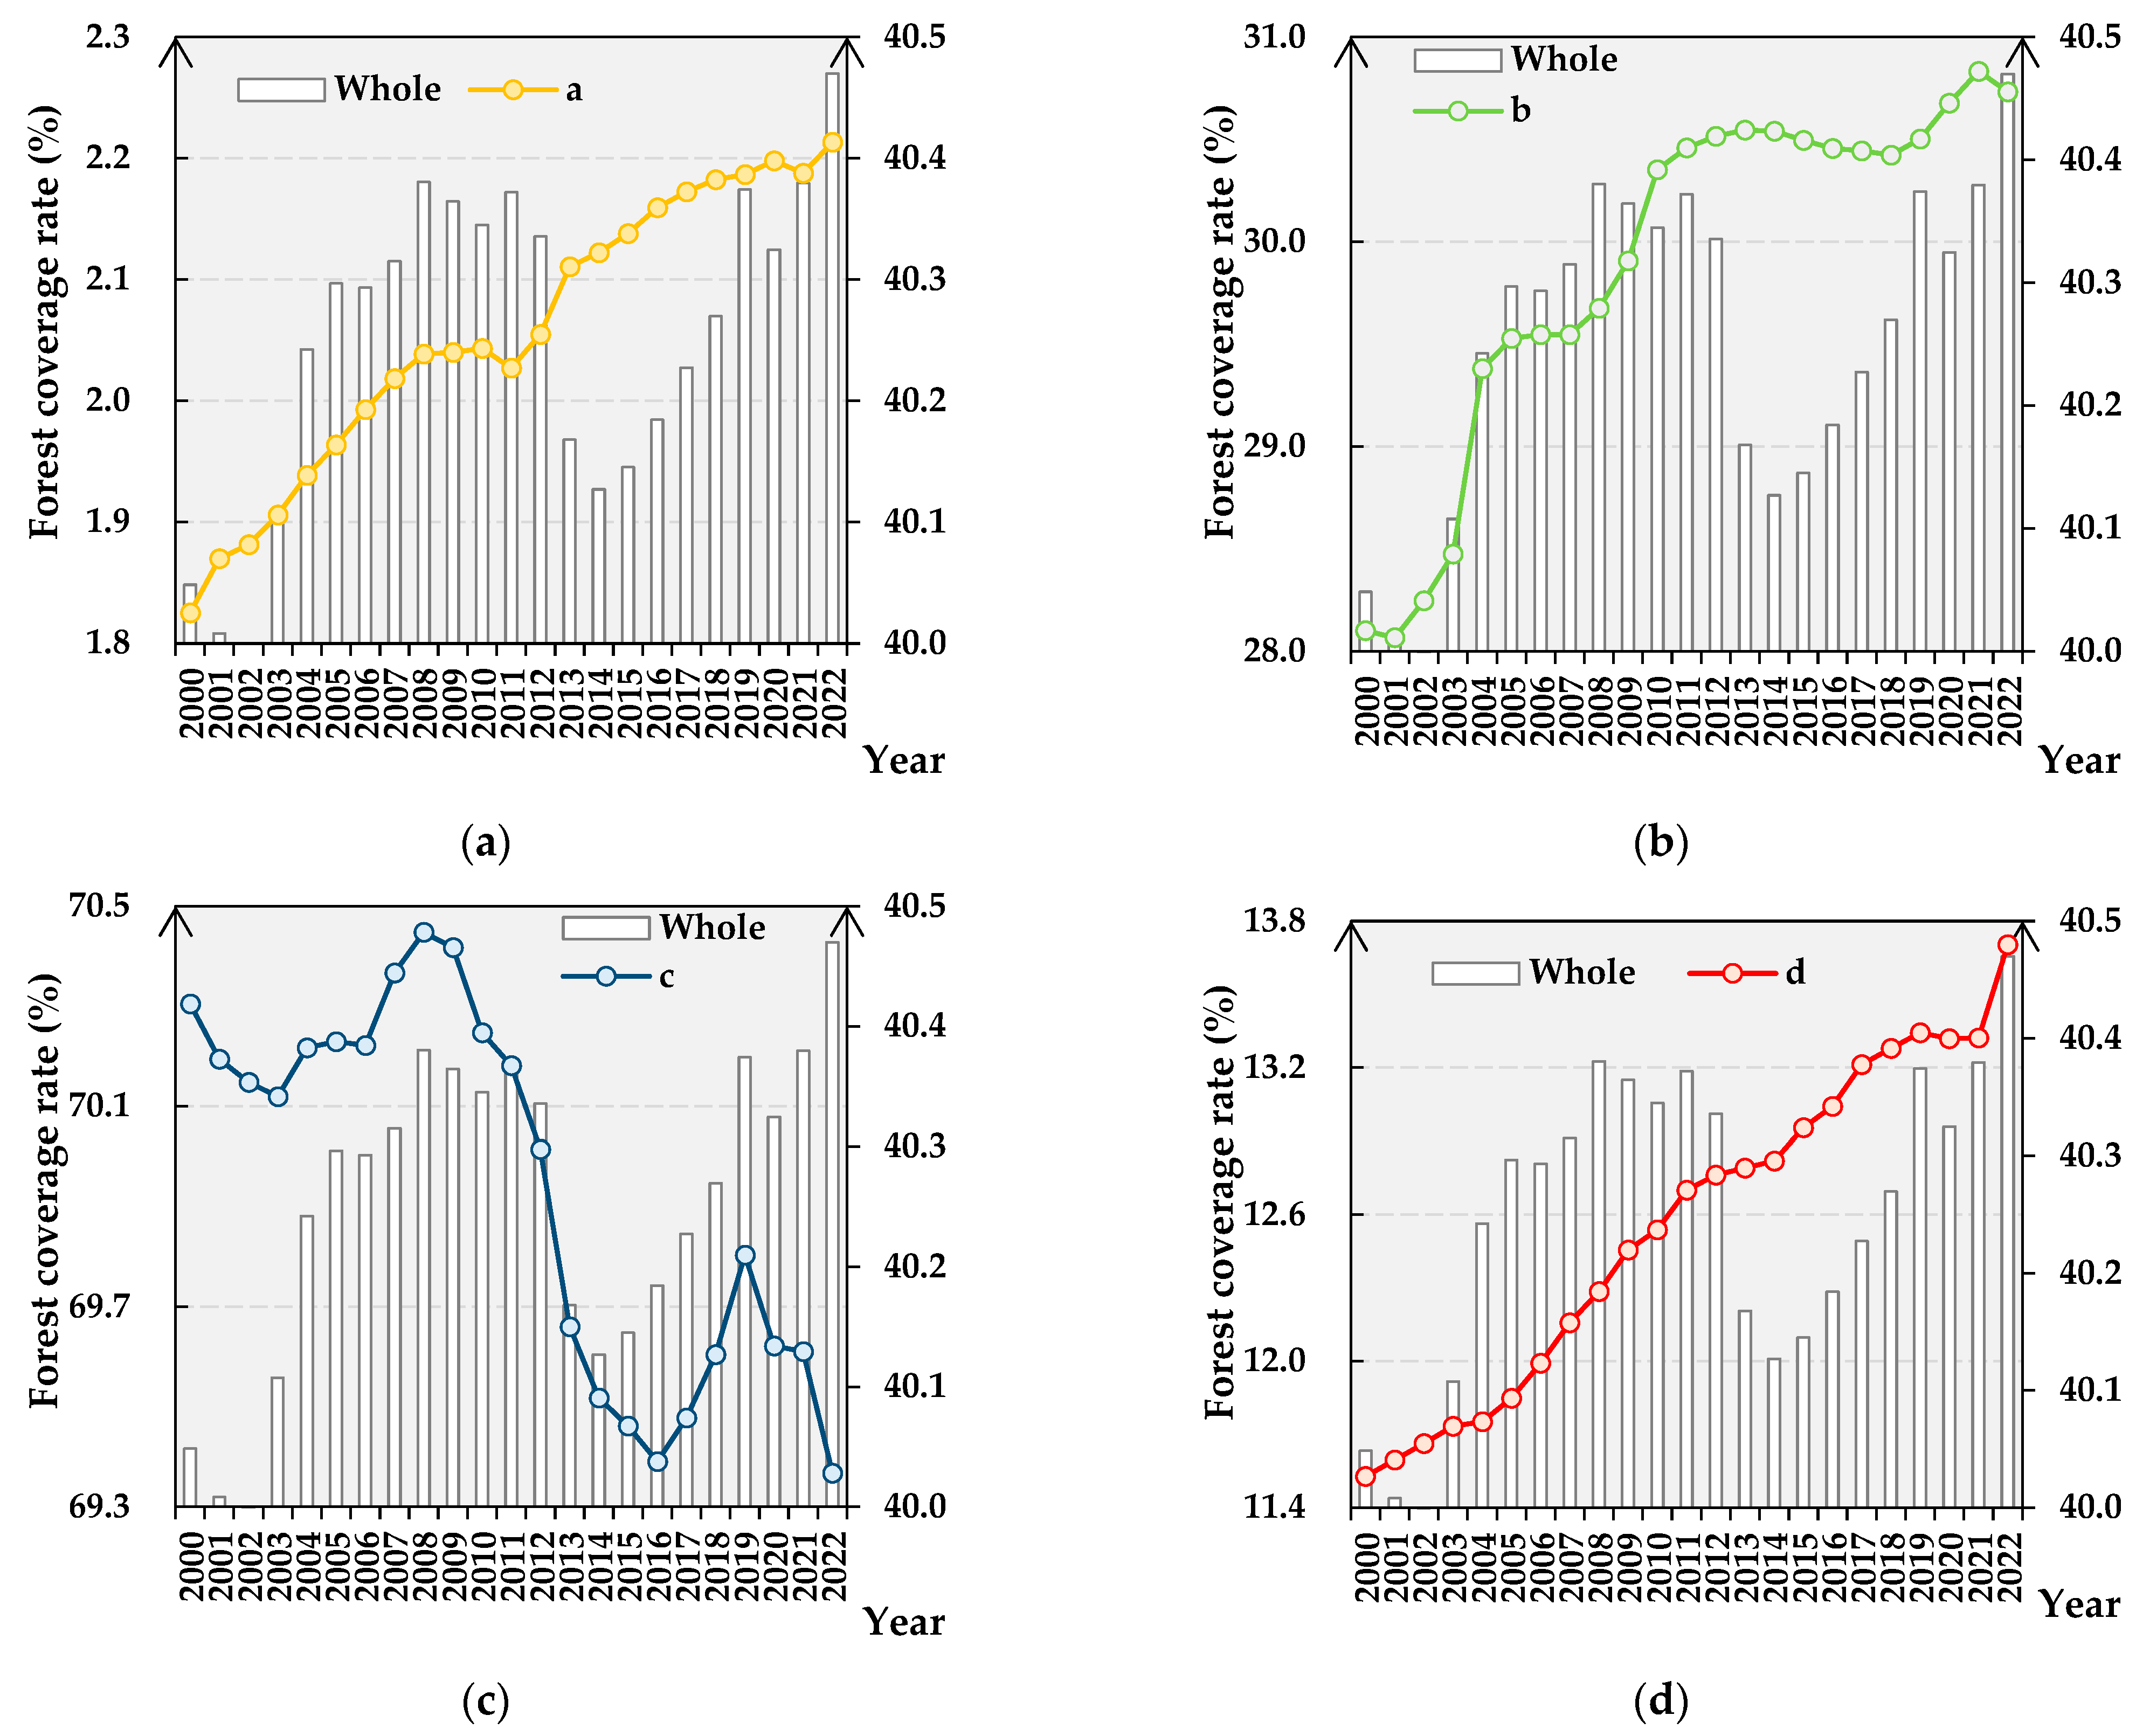
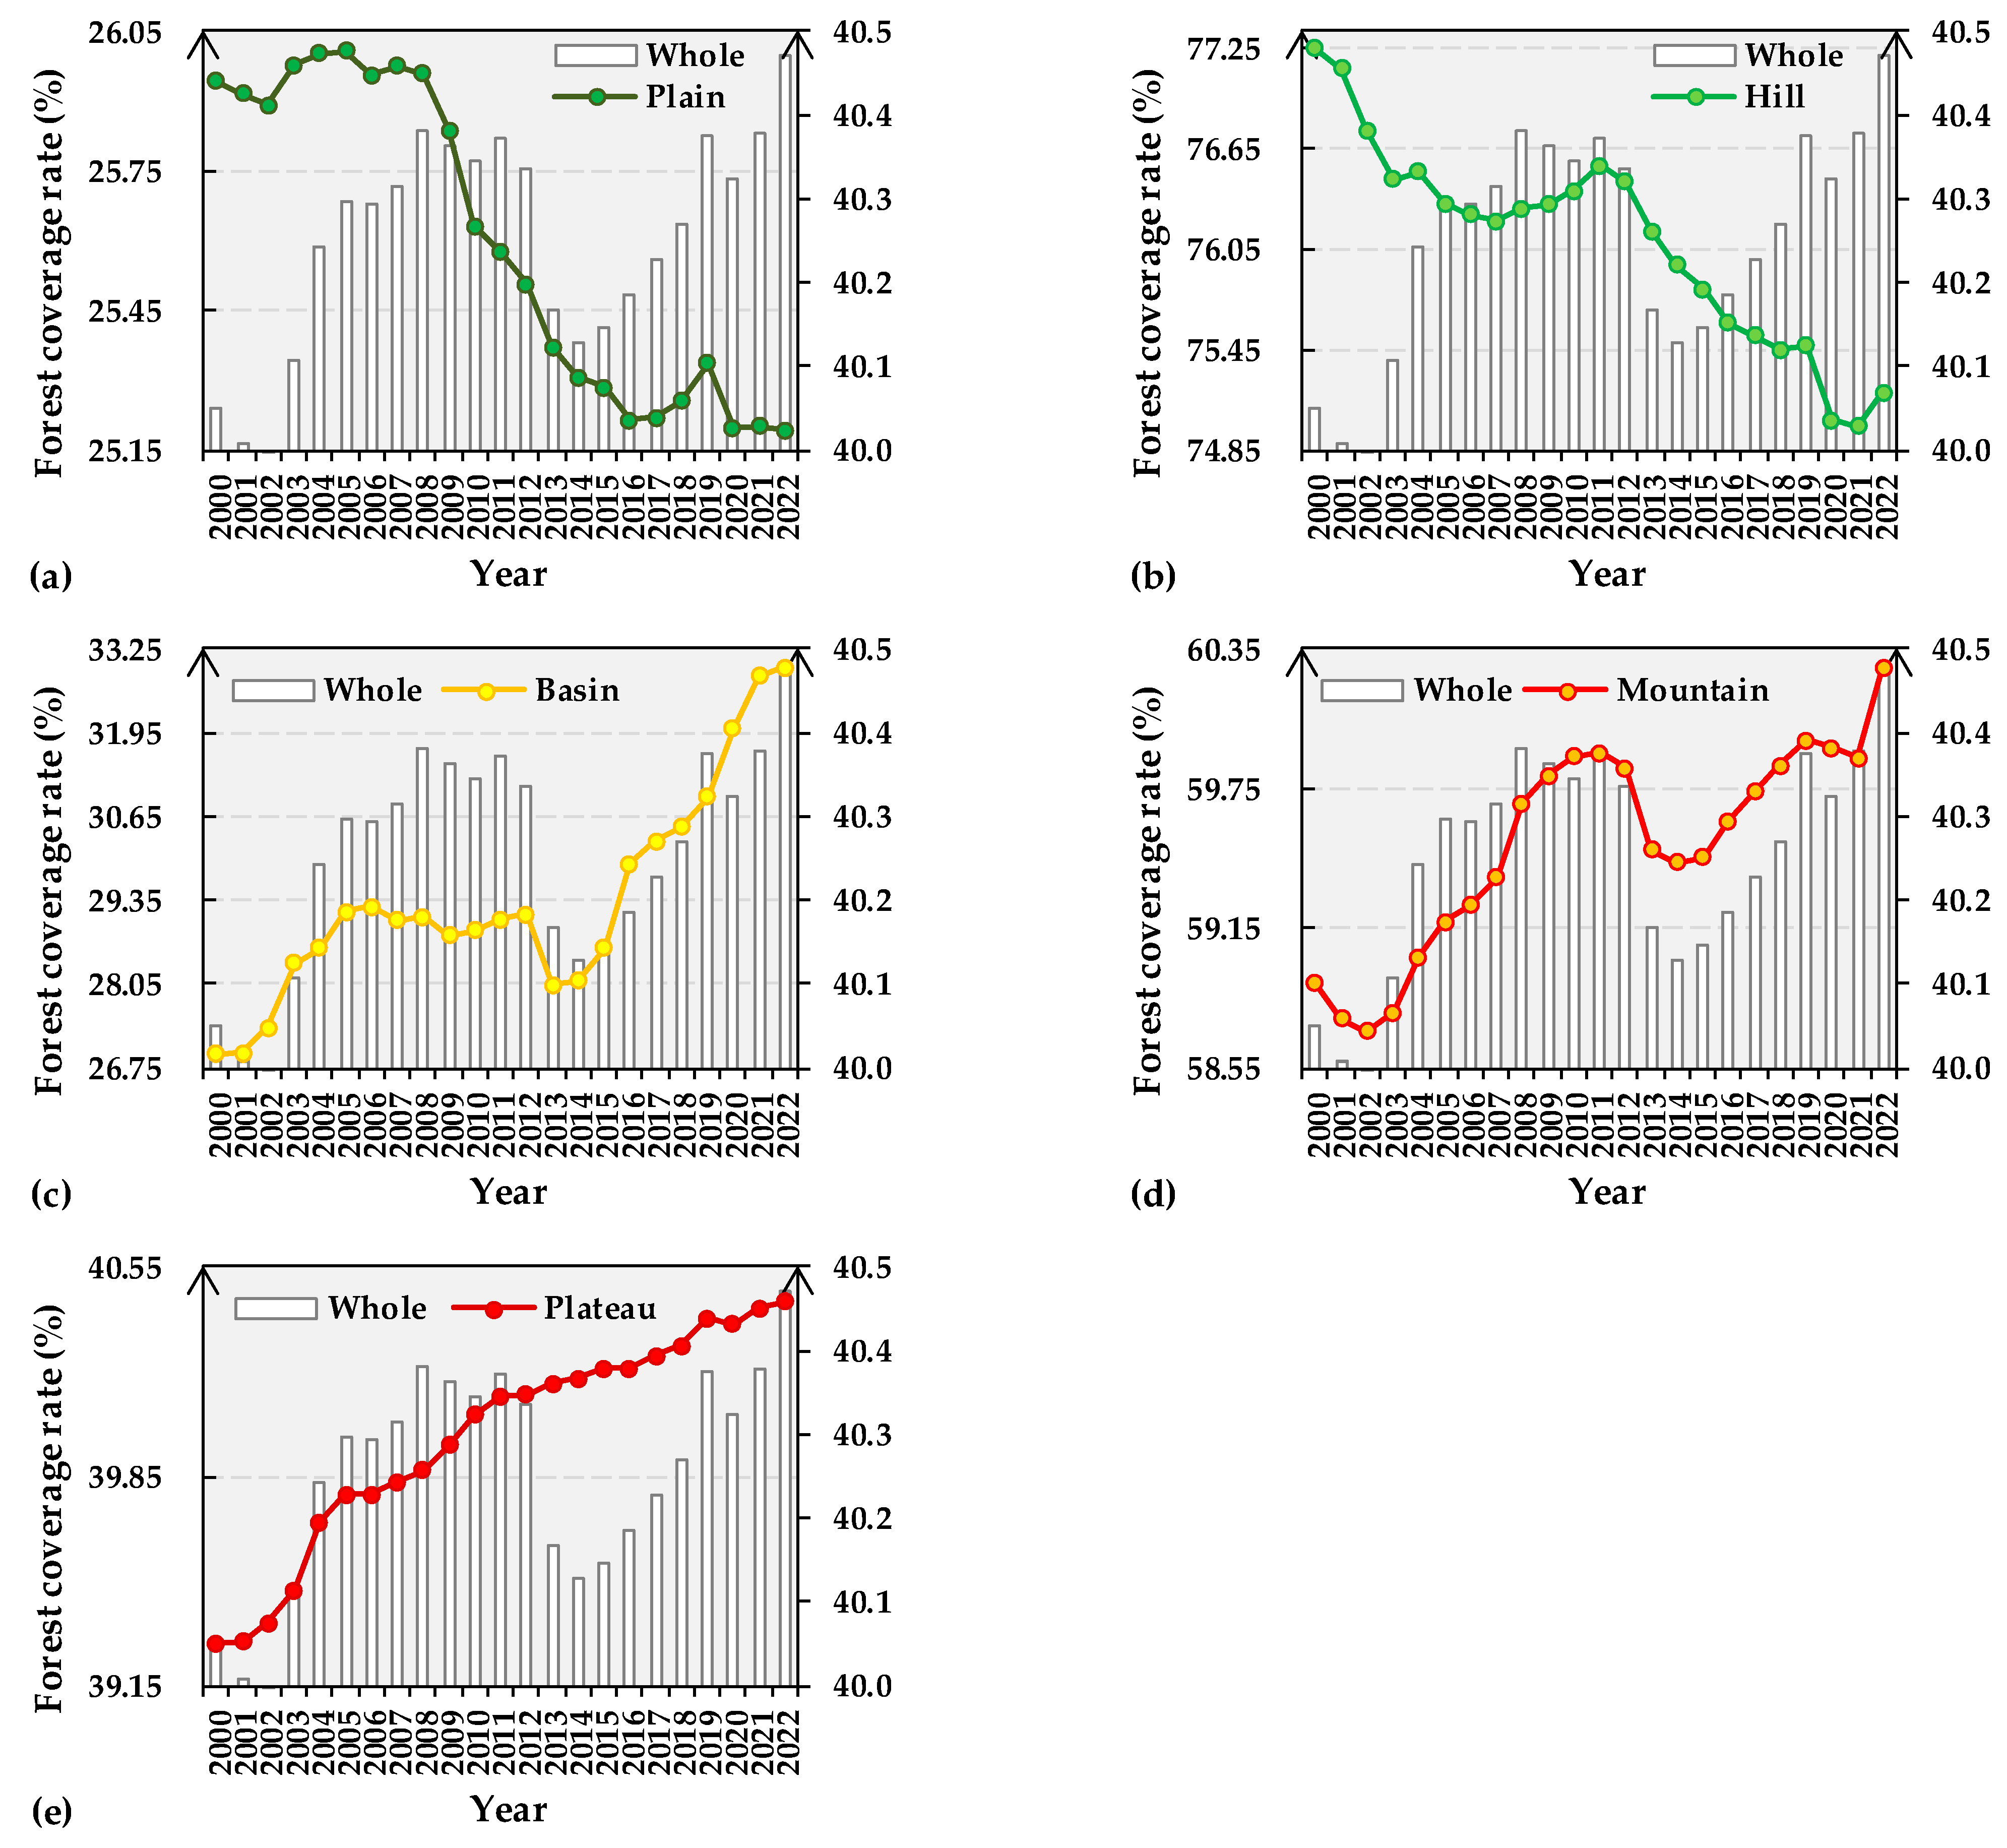
3.1. Annual Forest Dynamics within Geographically Stratified Shrinking Cities

Between 2000 and 2022, urban forests covered an increasing area from 251,535.74 to 254,183.36 km2 in the shrinking cities of China, with a change rate of 120.35 km2/year (Table 3). The urban forest area has fluctuated widely over 23 years under the background of a shrinking population, which occurred in a majority of the study periods. The fastest and most frequent decrease appeared from 2010 to 2015, especially between 2012 and 2013. In general, the urban forest area has recently increased at a steady rate.
The coverage rate of urban forests increased slightly from 40.05 to 40.47% in the shrinking cities in China (Figure 3). Nevertheless, stratified by climate conditions, urban forests generally displayed more coverage change regularity in shrinking cities, with fewer functions in a more consistent manner, especially in TWTD, TG, and WTHSH (Figure 3). The cover rate dynamics of the urban forests of shrinking cities were most dramatic in STH among seven climatic sub-regions. Overall, the coverage rate of urban forests in shrinking cities increased between 2000 and 2022, with the exception of THSH. Among those, the shrinking cities within TH had the largest urban forest cover, with values of 80.75 to 82.45%, followed by THSH, SH, TG, WTHSH, TWTD, and QTP with values below 0.1%. However, the rank from the largest to the most effective cover rate change degree differed as follows: TWTD, WTHSH, TG, STH, TH, THSH, and QTP.
Furthermore, stratified by topography, the area variations in urban forests also present sharper features (Figure 4). The coverage dynamics of urban forests of the shrinking cities were most turbulent in the basin among five topographical sub-regions. In lower-elevation shrinking cities, the coverage rate of urban forests was reduced, while it increased in the basins, mountains, and plateaus. Among these, the shrinking cities within the hill had the largest urban forest cover, with values from 74.99 to 77.25%, followed by cities in the mountains, plateaus, basins, and plains, with values from 25.19 to 26%. However, the highest to lowest occupation shift degree values differed with respect to the basins, plateaus, plains, hills, and mountains.

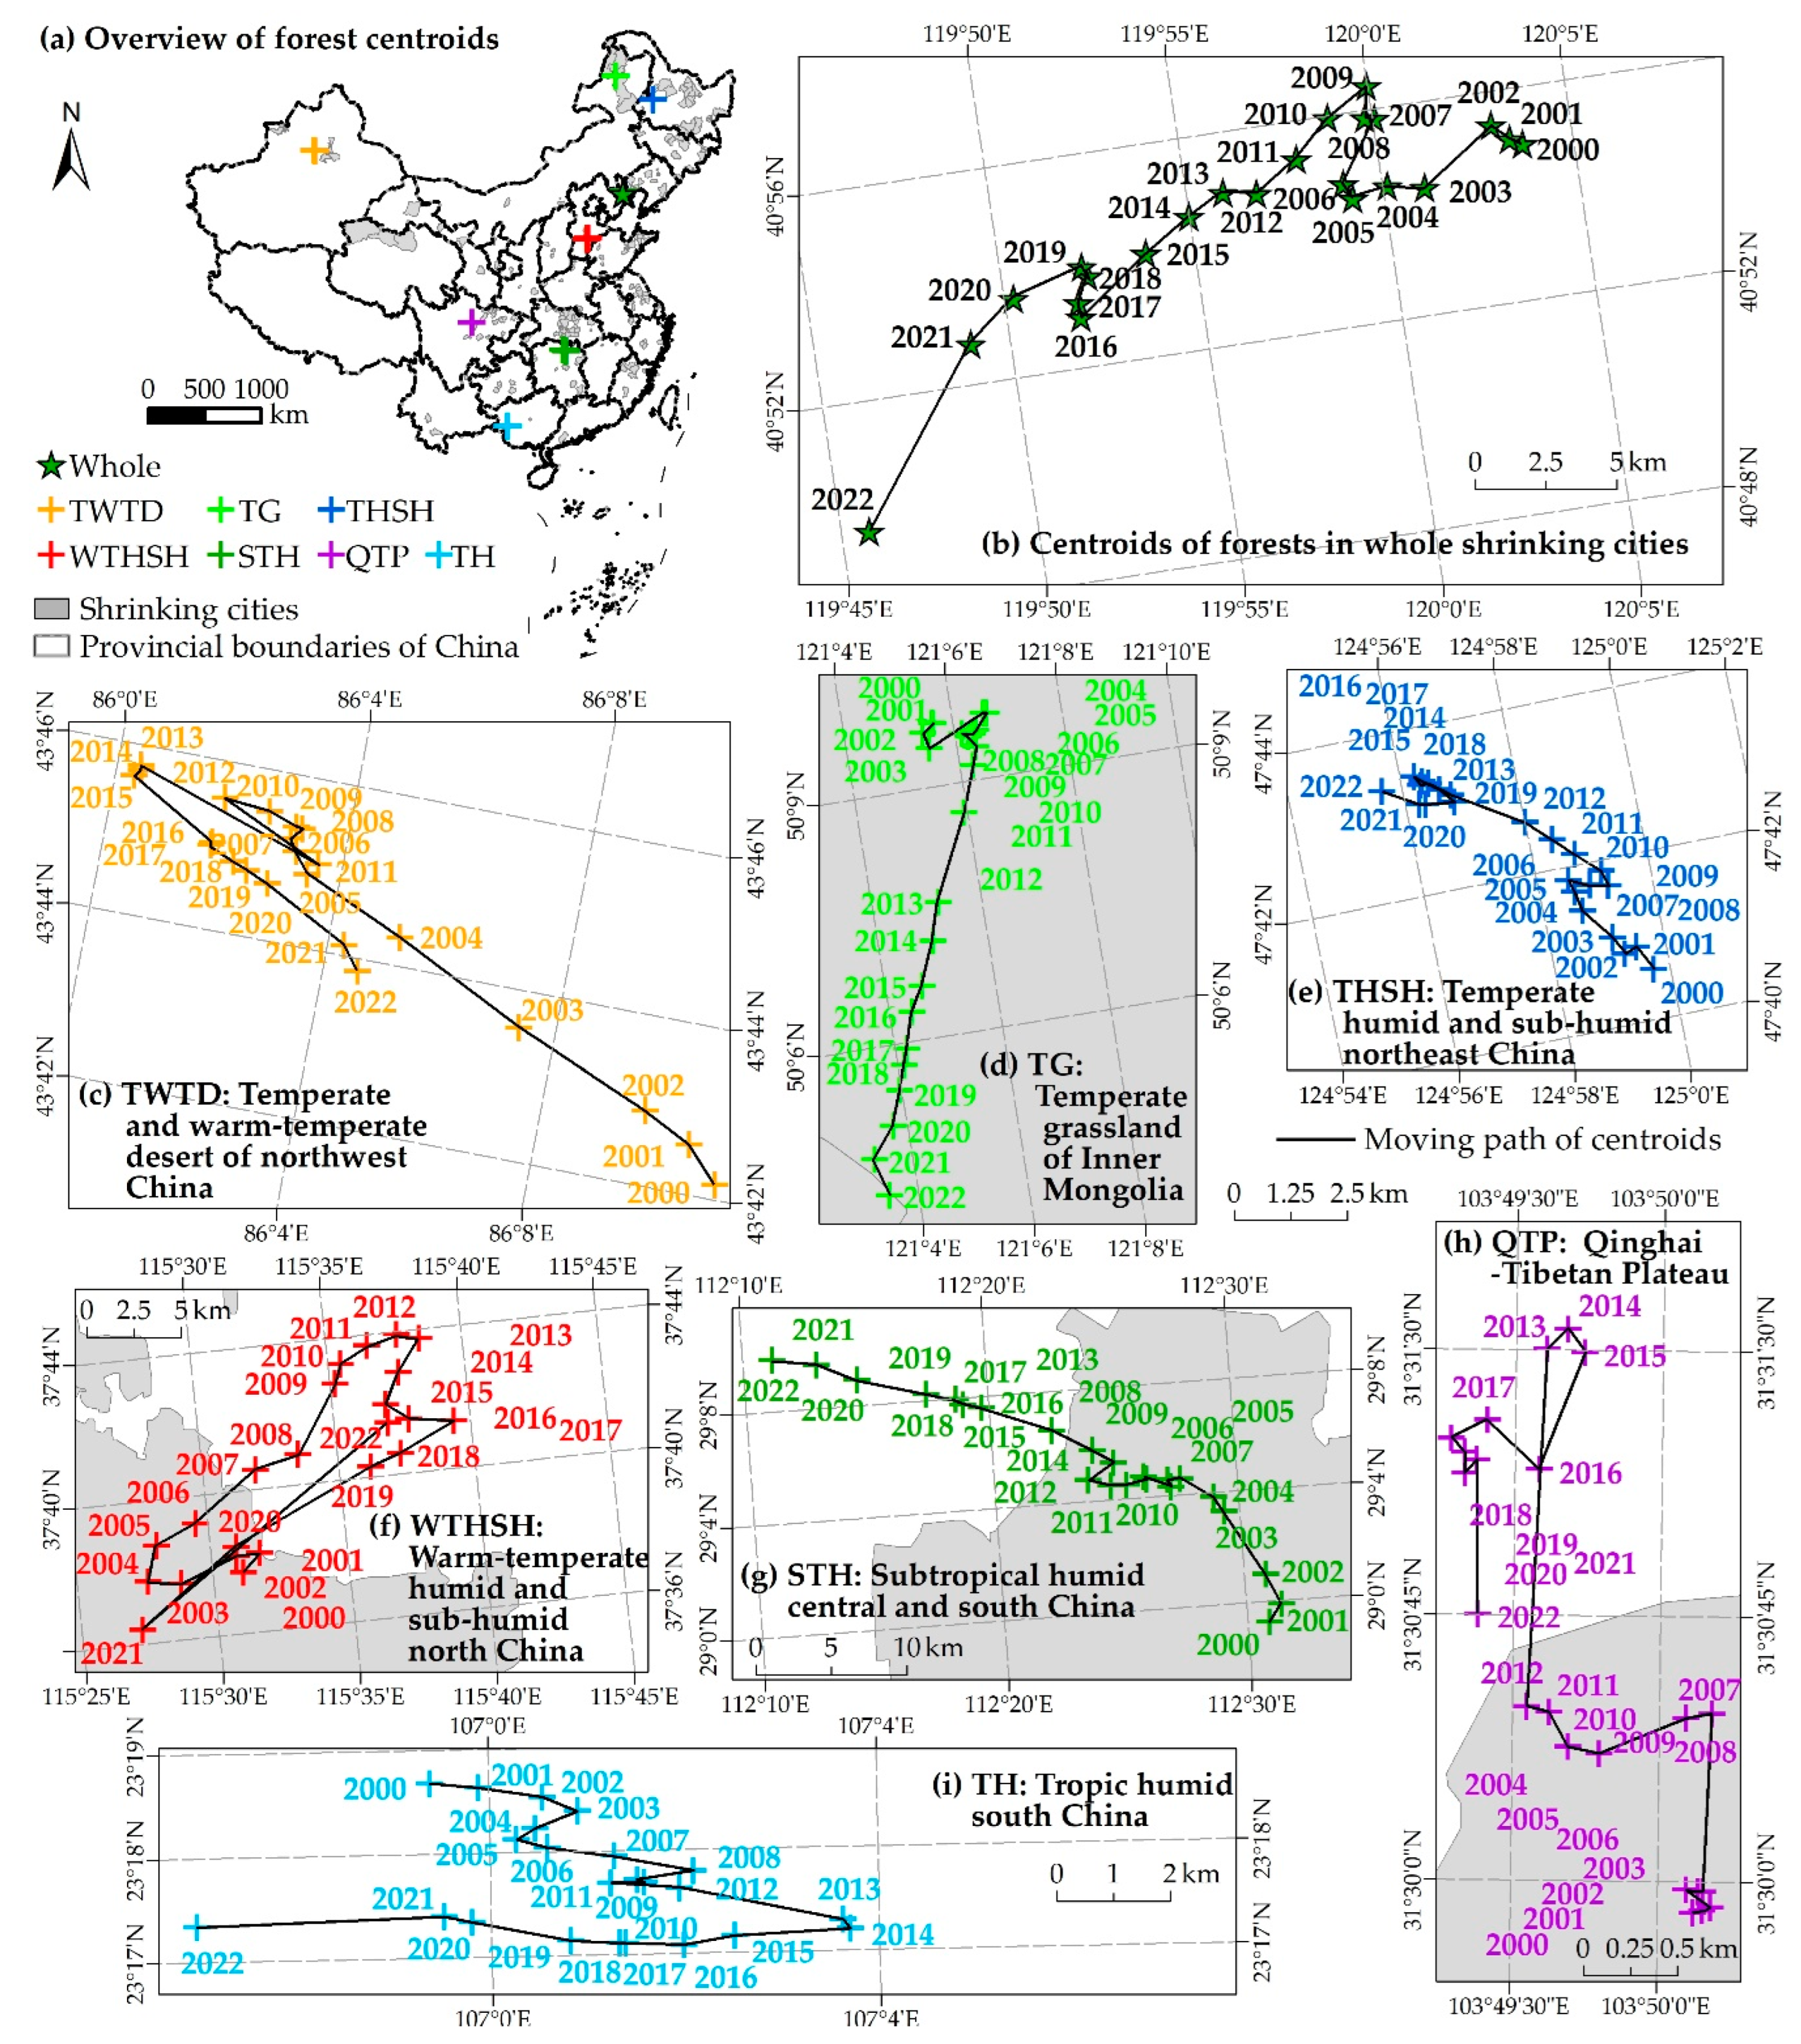
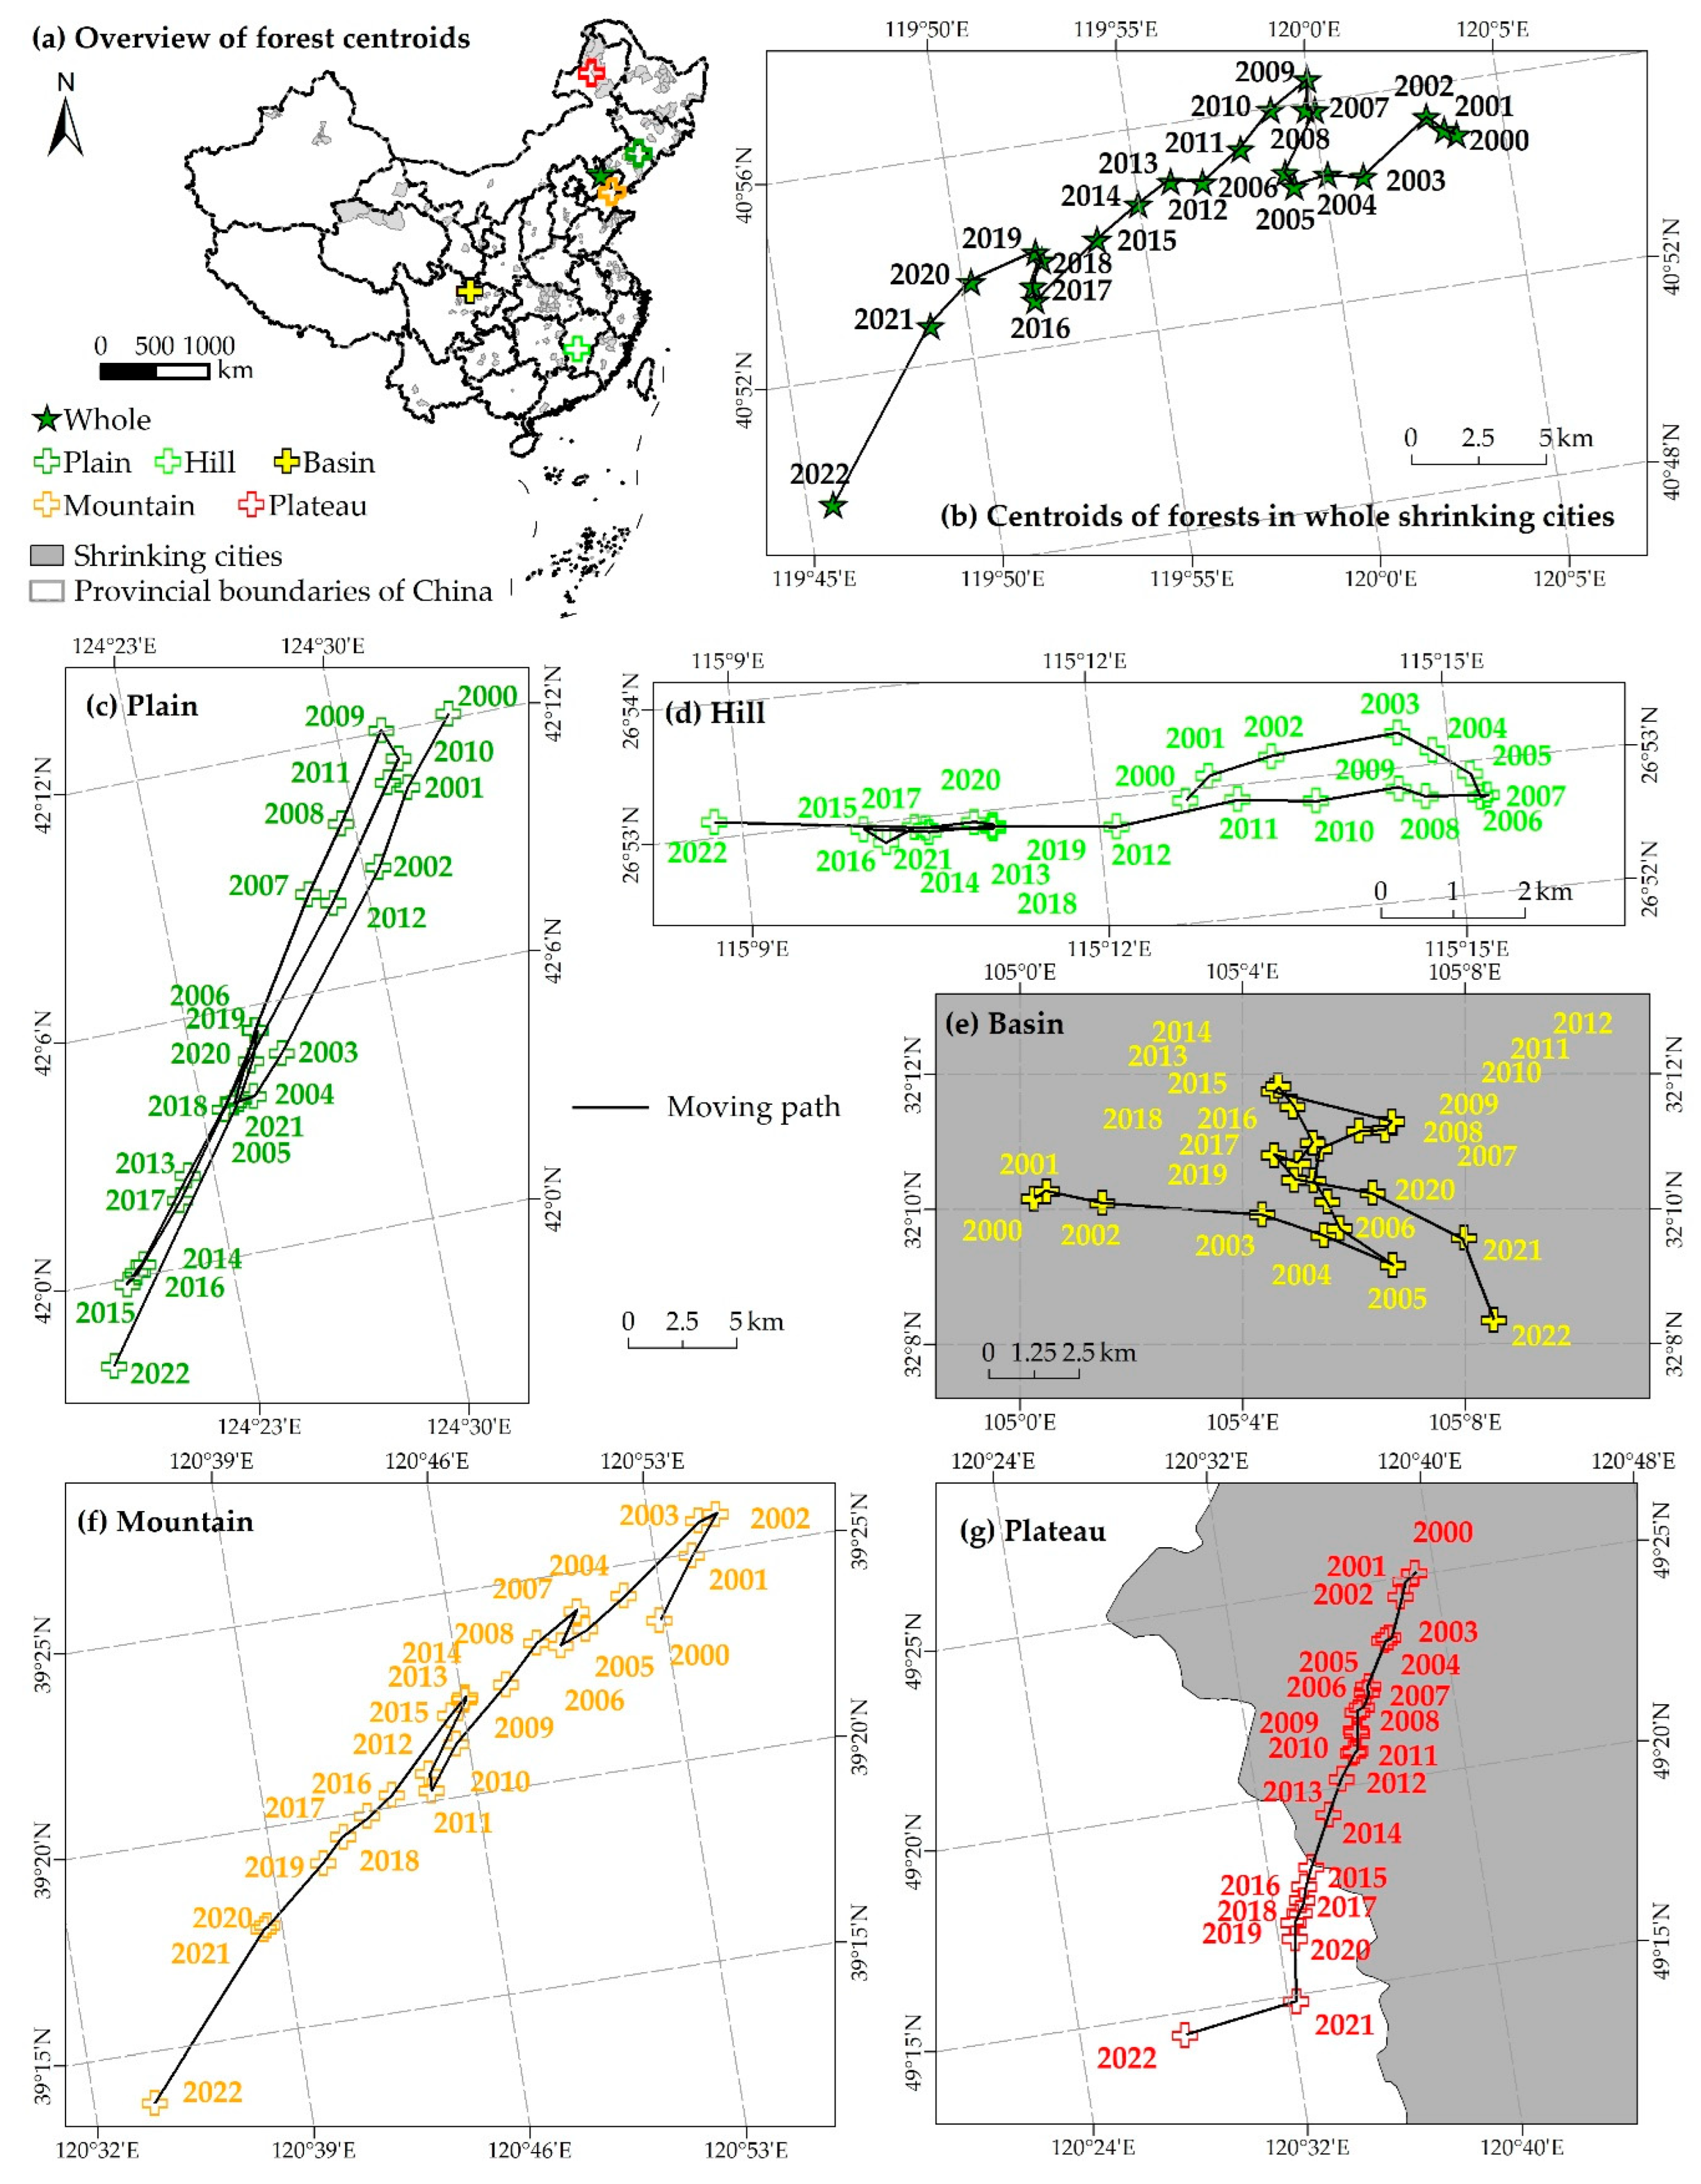
3.2. Directions of Urban Forest Changes in Geographically Stratified Shrinking Cities

The area-weighted centroids of urban forests in all the shrinking cities of China from 2000 to 2022 were determined and then depicted in Figure 5, and they were located in the western margins of the Liaoning province. In the aggregate, the southwest-oriented movements of 27.03 km were delineated. It was shown that the centroid of all the shrinking cities’ urban forests first moved northwestward and then shifted to the southwest between 2000 and 2005. After this event, this centroid moved to the north and then toward the southwest up until 2016. This centroid moved to the north again and finally moved to the southwest.
Nonetheless, the centroid movement directions of shrinking cities’ forests within seven climatic sub-regions exhibited evident variations over 23 years (Figure 5). Indeed, the urban forest centroids of shrinking cities within WTHSH performed the most dramatic movements, with frequently changing directions, and these were in Hebei province. The centroids of TG, THSH, and STH had relatively stable movement directions. Specifically, the urban forests in TG’s shrinking cities had south-oriented centroids in the Inner Mongolia Autonomous Region, while the centroids of THSH and STH exhibited northwestward movements in the Heilongjiang and Hunan provinces, respectively. The remaining centroids of TWTD, QTP, and TH moved under some turbulence. The centroids of TWTD moved northwestward and then southeastward in the Xinjiang Uygur Autonomous Region. The movements of QTP’s centroids in the Sichuan province were first directed toward the north and west and then the north and south; then, they were finally directed toward the west and south. The directional changes in TH in the Guangxi Zhuang Autonomous Region presented alternating cycles as they moved toward the southeast and then southwestern direction. Among the seven climatic stratifications, within these 23 years, the forest centroids of STH’s shrinking cities moved the most at 37.27 km, followed by WTHSH, TG, TWTD, THSH, TH, and QTP at distances of 11.05, 9.72, 9.19, 7.18, 4.83, and 1.95 km, respectively.
On the other hand, under topographical stratification, changes in the direction of the shrinking cities’ forests exhibited less spatial heterogeneity (Figure 6). The urban forest centroids of shrinking cities located at lower elevations exhibited more fluctuant directional changes, and the forest centroids of shrinking cities on plateaus exhibited the simplest southwestward movements in the Inner Mongolia Autonomous Region. The centroids of plains in the Liaoning province exhibited the most directional moving variations, and those of the hills and basins exhibited westward movements in the Jiangxi and Sichuan provinces, respectively. Directional changes in the mountains appeared in alternating cycles with respect to the northeast–southwestward directions. The order from the most to least forest centroid movement exhibited with respect to topography type is as follows: plains, mountains, plateaus, basins, and hills at 33.98, 32.62, 23.93, 13.42, and 6.49 km, respectively.

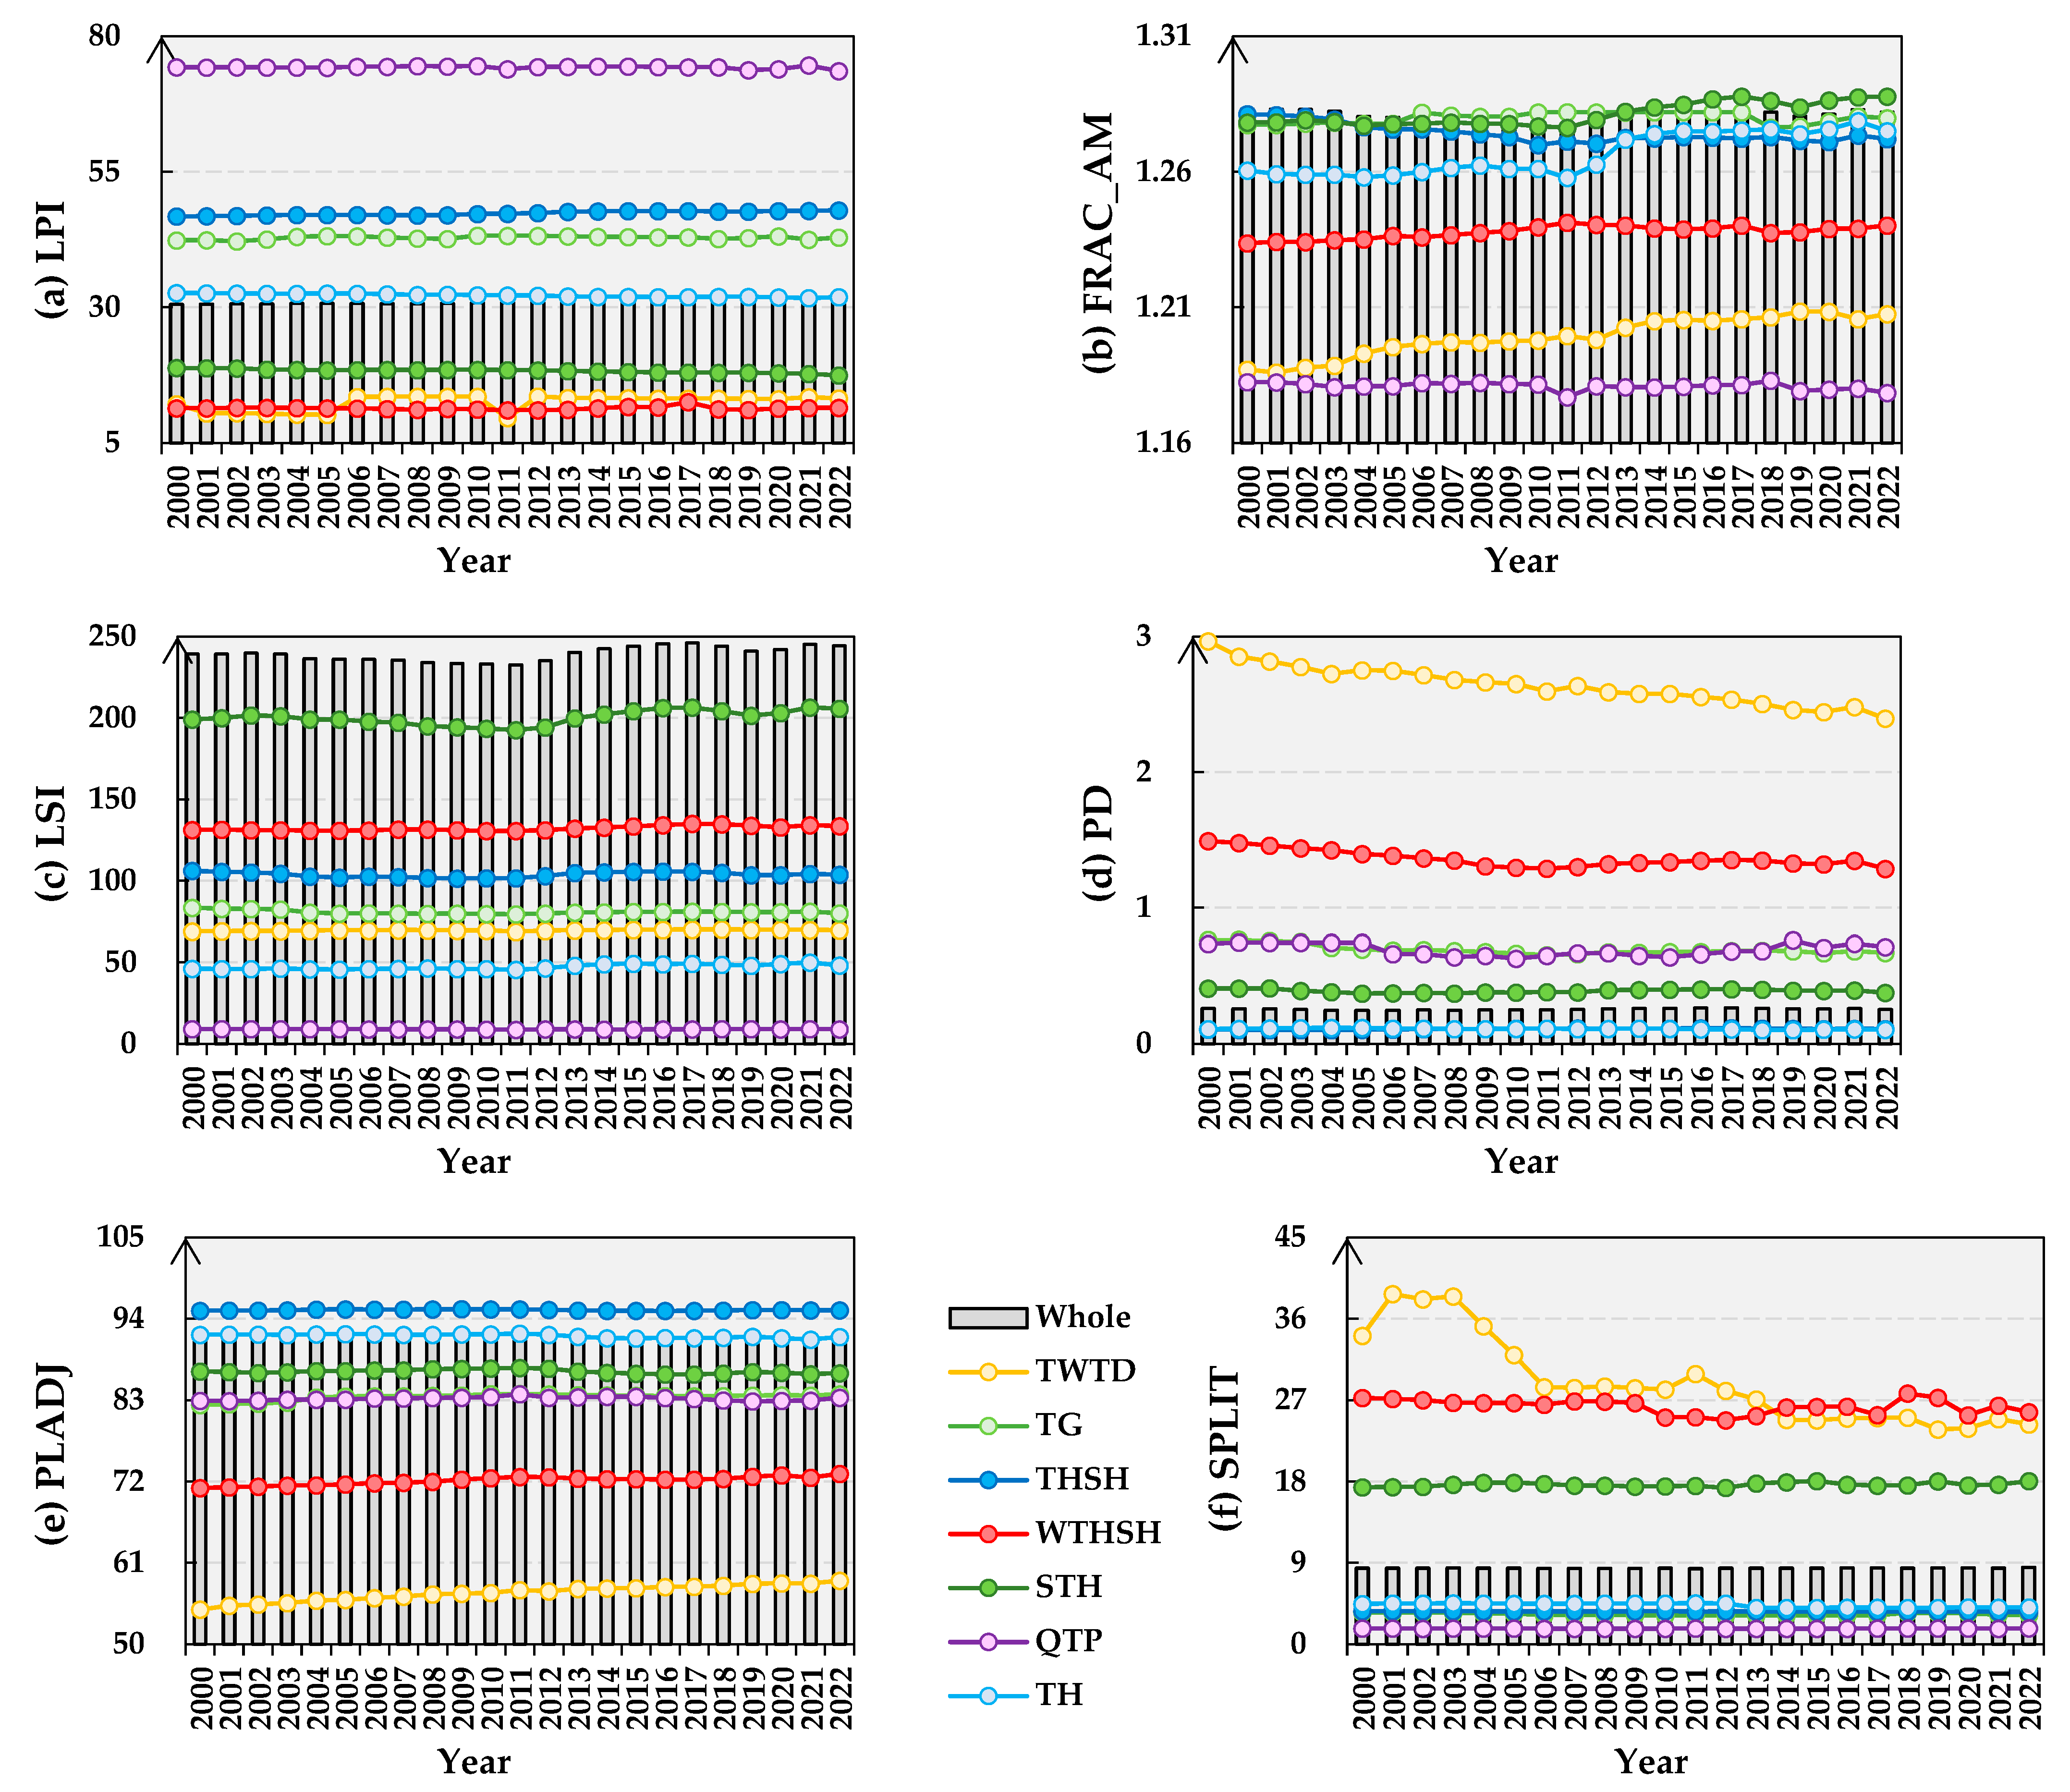
3.3. Landscape Patterns of Urban Forests in Geographically Stratified Shrinking Cities

The landscape-level indexes of an urban forest landscape were computed, as shown in Figure 7. For all the shrinking cities’ forests, the landscape patterns, i.e., dominance, complexity, fragmentation, and aggregation, fluctuated. In particular, the LPI values of urban forests in the shrinking cities of China increased from 30.56 to the maximum of 31.01 in 2014 and then slightly declined, reaching 30.81 with some fluctuations over 23 years. It was demonstrated that the FRAC_AM values decreased from 2000 to 2022, reduced to the minimum in 2010, and then increased. As for the LSI values, they experienced decreases and increases twice, and they were ultimately larger over 23 years. The PD values decreased from 0.26 to 0.25, beginning with a reduction and then increasing to the maximum of 0.27 in 2017, which decreased again in the end. Meanwhile, PLADJ values increased and decreased several times and generally decreased from 2000 to 2022. Conversely, SPLIT values increased from 8.43 to 8.50, and they also increased and then decreased within 23 years.
These landscape pattern indexes were distinguished by climatic stratification, as shown in Figure 7. As for urban forests in TWTD, the LPI and FRAC_AM values exhibited a fluctuating increase ranging from 9.64 to 13.60 and 1.19 to 1.21, respectively, with a comparatively steady increase in the PLADJ values. Inversely, the values of LSI and PD exhibited a relatively stable decrease, and that of SPLIT was reduced with several highs and lows. In terms of TG, these index values slightly changed with some fluctuations. In detail, the values of LPI, FRAC_AM, and PLADJ increased, whereas those of LSI, PD, and SPLIT decreased. Along with this phenomenon, the index values of urban forests in THSH’s shrinking cities also had slight variations. Namely, the values of PD, LPI, and PLADJ increased and that of LSI, FRAC_AM, and SPLIT decreased. For WTHSH, the values of PD and SPLIT exhibited a fluctuant reduction, with an up-and-down trend with respect to the other four indexes. The temporal variations of the index values of STH were fairly similar to all the shrinking cities, with the exception of LPI. The LPI values of STH decreased against the background of the general increase in LPI values of all the shrinking cities. The PLADJ and SPLIT values of forests in QTP’s shrinking cities roughly increased over 23 years, and the remaining four indexes exhibited generally decreasing values. The temporal changes in the index values of TH exhibited fewer fluctuations among seven climatic sub-regions in 23 years, with increasing values of FRAC_AM and LSI and decreasing values of the other four indexes. The rank of index values also varied by climatic stratification. Specifically, QTP had the highest LPI, followed by THSH, THSH, TG, TH, STH, TWTD, and WTHSH (Figure 7a). Urban forests in the shrinking cities of the STH, TG, THDH, and TH regions exhibited higher FRAC_AM values, followed by that of WTHSH and TWTD districts, and QTP exhibited the minimum value (Figure 7b). The rank from the highest to lowest values of LSI was STH, WTHSH, THSH, TG, TWTD, TH, and QTP (Figure 7c). This type of PD comprised TWTD, WTHSH, QTP, TG, STH, TH, and THSH, whereas that of PLADJ was the opposite (Figure 7d,e). Moreover, TWTD also obtained the highest SPLIT, followed by WTHSH, STH, TH, THSH, TG, and QTP (Figure 7f).
Differentiated by five topographical types, these indexes were computed and separately shown in Figure 8. For plains, the values of LSI, PD, and SPLIT presented an increase, whereas the values of LPI and PLADJ decreased, with a fluctuant reduction in the FRAC values. The elevation increased to 500 m, i.e., within hills, these index values became steady. The values of LPI and PLADJ decreased, whereas those of the other four increased. However, urban forests in the basin exhibited dramatic change indexes, with broadly increasing LPI, FRAC_AM, and PLADJ values. The temporal variations of these mountain region index values returned to comparative stability; the PLADJ and SPLIT values increased, but the remaining four decreased. Urban forests in shrinking cities with the highest elevation, i.e., in the plateau, had the most stable changing index, and they also only had increasing values with respect to PLADJ and SPLIT. In terms of the type of index values, the plateaus had the highest LPI, followed by basins, hills, mountains, and plains (Figure 8a). Urban forests in shrinking cities of the plateau and basin regions exhibited higher FRAC_AM values, followed by that of the hill and plain districts, and the mountain areas exhibited the minimum value (Figure 8b). The rank order from the largest to smallest values of LSI was as follows: plains, basins, hills, plateaus, and mountain (Figure 8c). The order of PD was the basins, plains, hills, mountains, and plateaus, while that of PLADJ was inverse (Figure 8d,e). Plains exhibited the greatest SPLIT value, followed by hills, mountains, basins, and plateaus (Figure 8f).

4. Discussion

4.1. Temporal Dynamics of Urban Forest Patterns in Shrinking Cities

Different from published large-scale urban forest research, this pioneering study focused the evolution characteristics in cities relative to a depopulated background and explored the potential effects of population reduction on forest fragmentation mitigation. The increase in forest area between 2000 and 2022 in shrinking cities was generally consistent with the previous results of ‘greening’ Chinese cities [41,42]; hence, it was not specifically discussed in this study. Nonetheless, it was shown that the urban forest areas of shrinking cities first increased at a slow speed, followed by a decrease from 2010 to 2015; then, an accelerated growth was observed (Table 3). This is in contrast with the slowing forest dynamics in Chinese cities [17,43,44]. This indicates that government efforts with respect to afforestation, such as the “National Forest City”, were delayed in these shrinking cities [8,45]. However, the landscape patterns of urban forests in shrinking cities have slightly changed and now tend to stabilize, with generally increasing dominance and fragmentation, as well as decreasing complexity and aggregation (Figure 7). This finding revealed that the fragmentation of urban forests slowed down with respect to population loss, which can supplement published papers on socioeconomic factors, such as high population densities with respect to urban forest shrinkage in China [46,47]. The temporal dynamics of urban forest patterns in the shrinking cities of China were expounded not only as a whole but also with respect to seven climatic zones and five topographical sub-regions. These results, obtained from geographical stratification, also demonstrated accelerating changes with respect to the area and centroid movements of urban forests in the context of recent population loss (Figure 3, Figure 4, Figure 5 and Figure 6) and against more stable landscape patterns (Figure 7 and Figure 8). This implied the following discovery: the temporal dynamics of urban forests in the shrinking cities of China intensified with respect to the more dominant direction but exhibited stabilized patterns.
In summary, this study determined and compared the temporal dynamics of urban forest patterns against population shrinkage, and we observed that urban forests increased with a general southwestern orientation. The weakened forest fragmentation in the shrinking cities of China identified by decelerating fragmentation further sheds light on the effects of population densities on urban forests. The time lag of afforestation projects in shrinking cities can be inferred from these distinct temporal variations compared to entire urban forests in China, and they can support effective forest management from a fresh perspective.

4.2. Geographical Variations in Urban Forest Evolutions under Population Loss

Stratified by geographical condition, i.e., climatic or topographical sub-regions, the characteristics of urban forests in shrinking cities exhibited more apparent spatiotemporal patterns (Figure 3, Figure 4, Figure 5, Figure 6, Figure 7 and Figure 8). Disassembling urban forests in shrinking cities in accordance with the conditions of temperature, precipitation, and moisture, the comparatively extreme area dynamics of STH, THSH, and TH were observed, in which forest coverage was fairly substantial. On the contrary, the centroid movement variations in these three sub-regions were smoother than the other four. Furthermore, the centroids of shrinking cities’ forests within WTHSH not only exhibited the most stable area changes but also the most complicated movements (Figure 3, Figure 4 and Figure 5). It was revealed that urban forests in shrinking cities with dense forest coverage and substantial moisture contents dramatically changed within the area but remained stable in terms of the directional changes. The turbulent directions of forest centroids in WTHSH over 23 years might result from their specific location around a political center [48,49]. The variations in seven climatic sub-regions with respect to the dominance and aggregation of urban forests in shrinking cities were relatively more stable with respect to complexity and fragmentation. The effects of population shrinkage on urban forests’ complexity and fragmentation were highlighted in various temperature, precipitation, and moisture data. The landscape indexes of seven climatic sub-regions showed that in humid shrinking cities with a large forest coverage, there was less degradation of urban forests, as they had a stronger complexity and weaker fragmentation (Figure 7). The spatiotemporal patterns among five topographical sub-regions revealed that lower-altitude shrinking cities exhibited stronger forest fragmentation with respect to decreasing coverage and more substantial fragmentation. In other words, despite population shrinkage, cities at lower elevations were still more easily exposed to human disturbance [50,51]. Due to the increase in forest coverage in the basin, with an increase in complexity and reduction in fragmentation, the forest condition in the shrinking cities of China turned out to be mitigated (Figure 4 and Figure 8).
In short, moisture and altitude greatly influenced the spatiotemporal pattern dynamics of urban forests relative to population loss. Shrinking cities with a high humidity and elevation had stable patterns. The urban forests of shrinking cities in WTHSH and the basin regions exhibited the most pattern variations.

4.3. Uncertainties and Urban Management

The uncertainty of this study was minimized by the recognition of the shrinking cities, the maps of the urban forests, and the analysis of the spatiotemporal patterns. Due to the absence of a unified definition, shrinking cities were identified using various methods. This study used an extensively acknowledged demographic index, i.e., PCR, to determine 195 shrinking cities in China. This identification will be more precise in the future for further spatiotemporally explicit analyses with respect to the availability of annual population distributions. The annual forest maps of shrinking cities in China were acquired from widely accepted global land-use products, with an overall accuracy of above 80%. To comprehensively determine the yearly spatial response of urban forests to population loss, this study integrated centroid movements and landscape indexes. To further delve into clustering or the dispersion of urban forest changes, spatial autocorrelation indices, such as Moran’s I or Getis–Ord Gi*, will be quantified and visualized in accordance with the spatial clustering or dispersion of urban forest changes in future studies. The inconsistent findings from multiple temporal intervals and geographical stratification instances in this study revealed that the optimal spatiotemporal unit should be explored further.
After controlling the above uncertainty, credible spatiotemporal patterns with respect to urban forest fragmentation in China relative to population shrinkage were determined. Based on the above results and discussion, regional development planning and afforestation projects substantially affected urban forests in shrinking cities in spite of the time lag compared to other cities with population growth. China’s governments launched several policies to address the degradation of the urban landscape in order to improve residents’ quality of life [52]. Between 2000 and 2010, urban forests in China became a countermeasure relative to environmental stresses [53]. The “Forest City” initiative was launched by the State Forestry and Grass Administration in 2004 to promote healthy development [45]. Since 2010, urban forests in China have become a visual manifestation of ecological civilization [53]. In 2012, President Xi Jinping attended a voluntary tree-planting campaign in Beijing and supported construction; simultaneously, the national standard “Indicators for National Forest City” was legitimized [45]. However, shrinking cities have made weaker efforts, with a lag in time with respect to responding to these national calls and policies, except for the WTHSH and basin regions (Figure 3, Figure 4, Figure 5, Figure 6, Figure 7 and Figure 8). It was indicated that monitoring the implementation of policies in shrinking cities within humid low-altitude regions is essential. Shrinking cities have a relatively high forest cover, and values above 40% within these humid regions are recommended in order to implement the urban development strategy. Concretely, shrinking cities in Northeast China should be strictly controlled with respect to transformations from urban forests to impervious areas [53,54]. Urban forests in low-altitude shrinking cities in Central and South China should be more aggregated and complex, and this can be realized by constructing green ecological corridors and planting a wide range of trees [55].
In conclusion, this study considered the uncertainty generated from each step to explicitly illustrate urban forest variations in shrinking cities. Particular measures must be implemented to improve urban forest fragmentation despite population loss, especially within Northeastern China and low-altitude regions.

5. Conclusions

To explore deforestation mitigation against a depopulated background, this pioneering study explicitly delineated the spatiotemporal patterns of urban forests in shrinking cities between 2000 and 2022 using area-weighted centroids and landscape pattern indexes derived from GLC_FCS30 products. The following results were observed:
  • Between 2000 and 2022, the forest coverage rate in 195 shrinking cities of China increased from 40.05 to 40.47%, with the area increasing from 251,535.74 to 254,183.36 km2. Decreases appeared most frequently from 2010 to 2015. With the exception of one climatic sub-region in THSH and two topographical sub-regions in plains and hills, other geographical sub-regions of shrinking cities exhibited growing urban forests.
  • Urban forests increased with a generally southwestern orientation between 2000 and 2020. Comparatively steady directional dynamics with respect to forest centroid movements and dramatic area changes in STH, THSH, and TH were observed. The urban forest centroids of shrinking cities at lower elevations exhibited more fluctuant changes in terms of direction.
  • Urban forests in the shrinking cities of China slightly fragmented over 23 years, whereas a weakened condition was identified via decelerating fragmentation. The urban forests of shrinking cities in the WTHSH and basin regions exhibited the most pattern variations.
It was emphasized that monitoring policy implementation is essential due to the afforestation project’s lag in time with respect to shrinking cities, especially within humid and low-altitude regions. This study provided results at multiple temporal scales and geographical stratification instances; however, optimal spatiotemporal units should be studied more in future studies. It was concluded that the relationship between forest fragmentation and urban shrinkage in China is differentiated by moisture and altitude.

Supplementary Materials

The following supporting information can be downloaded at https://www.mdpi.com/article/10.3390/f15091522/s1. Figure S1: Annual urban forest maps of shrinking cities in China between 2000 and 2022.

Author Contributions

J.Z.: Data curation, formal analysis, investigation, methodology, validation, visualization, and writing—original draft. W.M.: Investigation, software, validation, and writing—review and editing. M.L.: Investigation, software, validation, and writing—review and editing. L.C.: Conceptualization, funding acquisition, supervision, project administration, resources, and writing—original draft. All authors have read and agreed to the published version of the manuscript.

Funding

This research was funded by the National Natural Science Foundation of China (No. 42101323) and the Natural Science Foundation of Zhejiang province, China (No. LQ22D010001).

Data Availability Statement

The ASTER GDEMV3 products were downloaded from the Geospatial Data Cloud (https://www.gscloud.cn, accessed on 4 February 2024). The GLC_FCS30 products were downloaded from the Big Earth Data Science Engineering Program (CASEarth) (https://data.casearth.cn, accessed on 7 January 2024).

Acknowledgments

The authors are grateful to the National Earth System Science Data Center, National Science and Technology Infrastructure of China (http://www.geodata.cn, accessed on 4 January 2024).

Conflicts of Interest

The authors declare no conflicts of interest.

References

  1. Ren, Q.; He, C.; Huang, Q.; Shi, P.; Zhang, D.; Güneralp, B. Impacts of urban expansion on natural habitats in global drylands. Nat. Sustain. 2022, 5, 869–878. [Google Scholar] [CrossRef]
  2. McDonald, R.I.; Aronson, M.F.J.; Beatley, T.; Beller, E.; Bazo, M.; Grossinger, R.; Jessup, K.; Mansur, A.V.; Puppim de Oliveira, J.A.; Panlasigui, S.; et al. Denser and greener cities: Green interventions to achieve both urban density and nature. People Nat. 2023, 5, 84–102. [Google Scholar] [CrossRef]
  3. Urban, M.C.; Alberti, M.; De Meester, L.; Zhou, Y.; Verrelli, B.C.; Szulkin, M.; Schmidt, C.; Savage, A.M.; Roberts, P.; Rivkin, L.R.; et al. Interactions between climate change and urbanization will shape the future of biodiversity. Nat. Clim. Chang. 2024, 14, 436–447. [Google Scholar] [CrossRef]
  4. Khan, N.; Jhariya, M.K.; Raj, A. Urban greening toward sustainable development and sustainability. In Biodiversity, Conservation and Sustainability in Asia; Öztürk, M., Khan, S.M., Altay, V., Efe, R., Egamberdieva, D., Khassanov, F.O., Eds.; Springer: Cham, Switzerland, 2022; Volume 3, pp. 345–373. [Google Scholar]
  5. Zhang, S.; Zhou, Y.; Yu, R.; Xu, X.; Xu, M.; Li, G.; Wang, W.; Yang, Y. China’s biodiversity conservation in the process of implementing the sustainable development goals (SDGs). J. Clean. Prod. 2022, 338, 130595. [Google Scholar] [CrossRef]
  6. Tate, C.; Wang, R.; Akaraci, S.; Burns, C.; Garcia, L.; Clarke, M.; Hunter, R. The contribution of urban green and blue spaces to the United Nation’s Sustainable Development Goals: An evidence gap map. Cities 2024, 145, 104706. [Google Scholar] [CrossRef]
  7. Barona, C.O.; Devisscher, T.; Dobbs, C.; Aguilar, L.O.; Baptista, M.D.; Navarro, N.M.; da Silva Filho, D.F.; Escobedo, F.J. Trends in urban forestry research in Latin America & The Caribbean: A systematic literature review and synthesis. Urban For. Urban Green. 2020, 47, 126544. [Google Scholar]
  8. Wang, C.; Jin, J.; Davies, C.; Chen, W.Y. Urban forests as nature-based solutions: A comprehensive overview of the national forest city action in China. Curr. For. Rep. 2024, 10, 119–132. [Google Scholar] [CrossRef]
  9. Yang, M.; Zhou, X.; Liu, Z.; Li, P.; Tang, J.; Xie, B.; Peng, C. A review of general methods for quantifying and estimating urban trees and biomass. Forests 2022, 13, 616. [Google Scholar] [CrossRef]
  10. Ocón, J.P.; Stavros, E.N.; Steinberg, S.J.; Robertson, J.; Gillespie, T.W. Remote sensing approaches to identify trees to species-level in the urban forest: A review. Prog. Phys. Geog. Earth Environ. 2024, 48, 438–453. [Google Scholar] [CrossRef]
  11. Baines, O.; Wilkes, P.; Disney, M. Quantifying urban forest structure with open-access remote sensing data sets. Urban For. Urban Green. 2020, 50, 126653. [Google Scholar] [CrossRef]
  12. Shahtahmassebi, A.R.; Li, C.; Fan, Y.; Wu, Y.; Lin, Y.; Gan, M.; Wang, K.; Malik, A.; Blackburn, G.A. Remote sensing of urban green spaces: A review. Urban For. Urban Green. 2021, 57, 126946. [Google Scholar] [CrossRef]
  13. Kowe, P.; Mutanga, O.; Dube, T. Advancements in the remote sensing of landscape pattern of urban green spaces and vegetation fragmentation. Int. J. Remote Sens. 2021, 42, 3797–3832. [Google Scholar] [CrossRef]
  14. Yankovich, E.P.; Yankovich, K.S.; Baranovskiy, N.V. Dynamics of forest vegetation in an urban agglomeration based on Landsat remote sensing data for the period 1990–2022: A case study. Remote Sens. 2023, 15, 1935. [Google Scholar] [CrossRef]
  15. Hu, M.; Li, X.; Xu, Y.; Huang, Z.; Chen, C.; Chen, J.; Du, H. Remote sensing monitoring of the spatiotemporal dynamics of urban forest phenology and its response to climate and urbanization. Urban Clim. 2024, 53, 101810. [Google Scholar] [CrossRef]
  16. Kowe, P.; Mutanga, O.; Odindi, J.; Dube, T. A quantitative framework for analysing long term spatial clustering and vegetation fragmentation in an urban landscape using multi-temporal landsat data. Int. J. Appl. Earth Obs. Geoinf. 2020, 88, 102057. [Google Scholar] [CrossRef]
  17. Yang, K.; Sun, W.; Luo, Y.; Zhao, L. Impact of urban expansion on vegetation: The case of China (2000–2018). J. Environ. Manag. 2021, 291, 112598. [Google Scholar] [CrossRef]
  18. Huang, D.; Cao, S.; Zhao, W.; Zhao, P.; Chen, J.; Yu, M.; Zhu, Z. Urban greening amidst global change: A comparative study of vegetation dynamics in two urban agglomerations in China under climatic and anthropogenic pressures. Ecol. Indic. 2024, 159, 111739. [Google Scholar] [CrossRef]
  19. Chen, J.; Kinoshita, T.; Li, H.; Luo, S.; Su, D.; Yang, X.; Hu, Y. Toward green equity: An extensive study on urban form and green space equity for shrinking cities. Sustain. Cities Soc. 2023, 90, 104395. [Google Scholar] [CrossRef]
  20. Rudincová, K.Ž.; Ženka, J.; Bosák, V.; Slach, O.; Istrate, A.; Nováček, A. Perception and preferred reuse of vegetated vacant lots along main streets in a shrinking city. Urban For. Urban Green. 2023, 85, 127956. [Google Scholar] [CrossRef]
  21. Peng, X.; Zhou, Y.; Fu, X.; Xu, J. Study on the spatial-temporal pattern and evolution of surface urban heat island in 180 shrinking cities in China. Sustain. Cities Soc. 2022, 84, 104018. [Google Scholar] [CrossRef]
  22. Zhu, R.; Newman, G.; Li, D.; Song, Y.; Zou, L. Associations between vacant urban lands and public health outcomes in growing and shrinking cities. Urban For. Urban Green. 2023, 89, 128127. [Google Scholar] [CrossRef] [PubMed]
  23. Yao, N.; Li, Y.; Lei, T.; Peng, L. Drought evolution, severity and trends in mainland China over 1961–2013. Sci. Total Environ. 2018, 616–617, 73–89. [Google Scholar] [CrossRef]
  24. Ding, Y.; Lu, Z.; Wu, L.; Zhou, L.; Ao, T.; Xu, J.; Wei, R. Evaluating the spatiotemporal dynamics of driving factors for multiple drought types in different climate regions of China. J. Hydrol. 2024, 640, 131710. [Google Scholar] [CrossRef]
  25. Yao, N.; Li, Y.; Li, N.; Yang, D.; Ayantobo, O.O. Bias correction of precipitation data and its effects on aridity and drought assessment in China over 1961–2015. Sci. Total Environ. 2018, 639, 1015–1027. [Google Scholar] [CrossRef]
  26. GB/T 12343-2008; Compilation Specifications for National Fundamental Scale Maps. Institute of Surveying and Mapping Standardization of National Bureau of Surveying and Mapping: Beijing, China, 2008.
  27. National Bureau of Statistics. Communiqué of the sixth National Population Census. 2011. Available online: http://www.stats.gov.cn/tjsj/ (accessed on 4 April 2023). (In Chinese)
  28. National Bureau of Statistics. Communiqué of the seventh National Population Census. 2021. Available online: http://www.stats.gov.cn/tjsj/ (accessed on 4 April 2023). (In Chinese)
  29. Zhang, X.; Liu, L.; Chen, X.; Gao, Y.; Xie, S.; Mi, J. GLC_FCS30: Global land-cover product with fine classification system at 30 m using time-series Landsat imagery. Earth Syst. Sci. Data 2021, 13, 2753–2776. [Google Scholar] [CrossRef]
  30. Mallach, A.; Haase, A.; Hattori, K. The shrinking city in comparative perspective: Contrasting dynamics and responses to urban shrinkage. Cities 2017, 69, 102–108. [Google Scholar] [CrossRef]
  31. Ma, Z.; Zhou, G.; Zhang, J.; Liu, Y.; Zhang, P.; Li, C. Urban shrinkage in the regional multiscale context: Spatial divergence and interaction. Sustain. Cities Soc. 2024, 100, 105020. [Google Scholar] [CrossRef]
  32. Cengiz, S.; Görmüş, S.; Oğuz, D. Analysis of the urban growth pattern through spatial metrics; Ankara City. Land Use Pol. 2022, 112, 105812. [Google Scholar] [CrossRef]
  33. Dennis, M.; Huck, J.J.; Holt, C.D.; da Conceição Bispo, P.; McHenry, E.; Speak, A.; James, P. Land-cover gradients determine alternate drivers of mammalian species richness in fragmented landscapes. Landsc. Ecol. 2024, 39, 146. [Google Scholar] [CrossRef]
  34. Borges, E.R.; Dexter, K.G.; Bueno, M.L.; Pontara, V.; Carvalho, F.A. The evolutionary diversity of urban forests depends on their land-use history. Urban Ecosyst. 2020, 23, 631–643. [Google Scholar] [CrossRef]
  35. Mitchell, M.G.E.; Devisscher, T. Strong relationships between urbanization, landscape structure, and ecosystem service multifunctionality in urban forest fragments. Landsc. Urban Plan. 2022, 228, 104548. [Google Scholar] [CrossRef]
  36. Mas, J.F.; Gao, Y.; Pacheco, J.A.N. Sensitivity of landscape pattern metrics to classification approaches. Forest Ecol. Manag. 2010, 259, 1215–1224. [Google Scholar] [CrossRef]
  37. Karimi, J.D.; Corstanje, R.; Harris, J.A. Understanding the importance of landscape configuration on ecosystem service bundles at a high resolution in urban landscapes in the UK. Landsc. Ecol. 2021, 36, 2007–2024. [Google Scholar] [CrossRef]
  38. Li, Y.; Ren, C.; Ho, J.Y.; Shi, Y. Landscape metrics in assessing how the configuration of urban green spaces affects their cooling effect: A systematic review of empirical studies. Landsc. Urban Plan. 2023, 239, 104842. [Google Scholar] [CrossRef]
  39. Cushman, S.A.; McGarigal, K.; Neel, M.C. Parsimony in landscape metrics: Strength, universality, and consistency. Ecol. Indic. 2008, 8, 691–703. [Google Scholar] [CrossRef]
  40. Hu, C.; Wu, W.; Zhou, X.; Wang, Z. Spatiotemporal changes in landscape patterns in karst mountainous regions based on the optimal landscape scale: A case study of Guiyang City in Guizhou Province, China. Ecol. Indic. 2023, 150, 110211. [Google Scholar] [CrossRef]
  41. Chen, C.; Park, T.; Wang, X.; Piao, S.; Xu, B.; Chaturvedi, R.K.; Fuchs, R.; Brovkin, V.; Ciais, P.; Fensholt, R.; et al. China and India lead in greening of the world through land-use management. Nat. Sustain. 2019, 2, 122–129. [Google Scholar] [CrossRef]
  42. Zhang, J.; Fu, B.; Stafford-Smith, M.; Wang, S.; Zhao, W. Improve forest restoration initiatives to meet Sustainable Development Goal 15. Nat. Ecol. Evol. 2021, 5, 10–13. [Google Scholar] [CrossRef]
  43. Ji, Y.; Jin, J.; Zhu, Q.; Zhou, S.; Wang, Y.; Wang, P.; Xiao, Y.; Guo, F.; Lin, X.; Xu, J. Unbalanced forest displacement across the coastal urban groups of eastern China in recent decades. Sci. Total Environ. 2020, 705, 135900. [Google Scholar] [CrossRef]
  44. Zhu, Z.; Zhu, X. Study on spatiotemporal characteristic and mechanism of forest loss in urban agglomeration in the middle reaches of the Yangtze River. Forests 2021, 12, 1242. [Google Scholar] [CrossRef]
  45. Shen, G. Three decades of urban forestry in China. Urban For. Urban Green. 2023, 82, 127877. [Google Scholar] [CrossRef]
  46. Ren, Y.; Deng, L.; Zuo, S.; Luo, Y.; Shao, G.; Wei, X.; Hua, L.; Yang, Y. Geographical modeling of spatial interaction between human activity and forest connectivity in an urban landscape of southeast China. Landsc. Ecol. 2014, 29, 1741–1758. [Google Scholar] [CrossRef]
  47. Duan, Q.; Tan, M. Using a geographical detector to identify the key factors that influence urban forest spatial differences within China. Urban For. Urban Green. 2020, 49, 126623. [Google Scholar] [CrossRef]
  48. Cheshmehzangi, A.; Tang, T. Beijing-Tianjin-Hebei city cluster: From a political center to a major industrial and innovation chain. In China’s City Cluster Development in the Race to Carbon Neutrality; Springer: Singapore, 2022; pp. 35–46. [Google Scholar]
  49. Chen, C.; Deng, W.; Ignatieva, M.; Bi, L.; Du, A.; Yang, L. Synergy of urban green space planning and ecosystem services provision: A longitudinal exploration of China’s development. Urban For. Urban Green. 2023, 86, 127997. [Google Scholar] [CrossRef]
  50. Nickel, B.A.; Suraci, J.P.; Allen, M.L.; Wilmers, C.C. Human presence and human footprint have non-equivalent effects on wildlife spatiotemporal habitat use. Biol. Conserv. 2020, 241, 108383. [Google Scholar] [CrossRef]
  51. Wei, Y.; Lu, H.; Wang, J.; Wang, X.; Sun, J. Dual influence of climate change and anthropogenic activities on the spatiotemporal vegetation dynamics over the Qinghai-Tibetan Plateau from 1981 to 2015. Earth’s Future 2022, 10, e2021EF002566. [Google Scholar]
  52. Chen, W.Y.; Li, X. Urban forests’ recreation and habitat potentials in China: A nationwide synthesis. Urban For. Urban Green. 2021, 66, 127376. [Google Scholar] [CrossRef]
  53. Chen, W.Y.; Wang, C.; Su, Y. Urban forest planning and policy in China. In Green Infrastructure in Chinese Cities; Springer: Berlin/Heidelberg, Germany, 2022; pp. 55–68. [Google Scholar]
  54. Tian, S.; Wu, W.; Shen, Z.; Wang, J.; Liu, X.; Li, L.; Li, X.; Liu, X.; Chen, H. A cross-scale study on the relationship between urban expansion and ecosystem services in China. J. Environ. Manag. 2022, 391, 115774. [Google Scholar] [CrossRef]
  55. Wang, G.; Yue, D.; Yu, Q.; Yang, D.; Xu, C.; Wang, F. Study on Forest and Grassland Ecological Space Structure in Eyu Mining Area and Potential Alternatives for Enhancing Carbon Sequestration. Forests 2023, 14, 1587. [Google Scholar] [CrossRef]
Figure 1. Location (a) of the shrinking cities studied in this paper within the climatic (b) and topographical (c) sub-regions of China.
Forests 15 01522 g001
Figure 2. Outline of the method to determine the spatiotemporally explicit characteristics of urban forest patterns in shrinking cities of China. The version numbers of the software are ArcGIS 10.2 and Fragstats 4.2.
Forests 15 01522 g002
Figure 3. Annual changes in forest coverage rate in the shrinking cities of various climatic sub-regions. The sub-y-axis represents the forest coverage rate in all shrinking cities. (a) Temperate and warm-temperate desert of Northwest China (TWTD). (b) Temperate grassland of Inner Mongolia (TG). (c) Temperate humid and sub-humid Northeast China (THSH). (d) Warm-temperate humid and sub-humid North China (WTHSH). (e) Subtropical humid Central and South China (STH). (f) Qinghai–Tibetan Plateau (QTP). (g) Tropic humid South China (TH).
Forests 15 01522 g003aForests 15 01522 g003b
Figure 4. Annual changes in forest coverage rate in the shrinking cities of various topographical sub-regions. The sub-y-axis represents the forest coverage rate in all shrinking cities. (a) Plain. (b) Hill. (c) Basin. (d) Mountain. (e) Plateau.
Forests 15 01522 g004
Figure 5. Centroid movements of urban forests in the shrinking cities of different climate sub-regions.
Forests 15 01522 g005
Figure 6. Centroid movements of urban forests in shrinking cities of various topographical sub-regions.
Forests 15 01522 g006
Figure 7. Variations in the landscape pattern indexes of urban forests in shrinking cities within different climate sub-regions. The abbreviations of LPI (a), FRAC_AM (b), LSI (c), PD (d), PLADJ (e), and SPLIT (f) represent the largest patch index, area-weighted fractal dimension index, landscape shape index, patch density, percentage of like adjacencies, and splitting index, respectively.
Forests 15 01522 g007
Figure 8. Variations in landscape pattern indexes of urban forests in shrinking cities within different topographical sub-regions. The abbreviations of LPI (a), FRAC_AM (b), LSI (c), PD (d), PLADJ (e), and SPLIT (f) have the same meaning as those in Figure 7.
Forests 15 01522 g008
Table 1. GLC_FCS30D-1985_2022 and ASTER GDEMV3 products were adopted in this study.
ProductsRowColumnYearUsage
GLC_FCS30DN20E105/110Every year between 2000 and 2022 Urban forest mapping
N25E95/100/105/110/115/120/125
N30E80/85/90/95/100/105/110/115/120/125
N35E75/80/85/90/95/100/105/110/115/120/125
N40E70/75/80/85/90/95/100/105/110/115/120/125
N45E70/75/80/85/90/95/100/105/110/115/120/125/130/135
N50E80/85/90/95/100/110/115/120/125/130/135/140
N55E85/115/120/125/130/135
ASTER GDEMV3N21E1112019Topographical stratification
N22E100/101/111/112
N23E99/100/108/109
N24E99/100/112/113/114/117
N25E105/106/107/112/113/114/117
N26E103/105/106/107/112/113/117/118/119
N27E103/104/105/107/111/112/113/117/118
N28E105/106/109/112/113/114/119/120/121
N29E108/109/112/115/117/119/120/121
N30E103/104/105/106/108/109/111/112/113/114/115/118/119
N31E103/104/105/106/107/108/111/112/113/114/115/118/119/120
N32E104/105/106/107/108/110/111/112/113/114/117/118/119/120
N33E109/110/114/115/116/117/118/119/120
N34E108/109/110/111/112/114/115/117/118
N35E104/105/106/107/113/114/116
N36E104/105/106/111/112/113/114/116/118/119/120/121
N37E93/94/95/96/102/103/105/106/110/111/115/116/119/120/121
N38E93/94/95/100/102/103/105/106/115/120
N39E96/97/98/100
N40E96/97/98/107/112/113/118/119/121/123/124/125/126
N41E107/E113/118/119/120/121/122/123/124/125/126/127/128
N42E87/120/121/122/123/124/125/126/127/128/129
N43E86/87/88/125/126/127/129
N44E80/81/82/87/88/125/126/127/128/129/130/131
N45E81/82/87/88/121/122/123/126/127/128/129/130/131/132/133
N46E121/127/128/129/132/133
N47E120/121/122/123/124/126/127/128/129/130
N48E120/121/122/123/124/125/126/127/128/129/130
N49E119/120/121/122/129
N50E119/120/121/122
N51E119/120/121
N52E120/121
Table 2. Descriptions of adopted landscape pattern indexes.
TypeIndexesFormulaDescription
Area and edgeLargest Patch Index (LPI) max ( a ij ) A   ×   100 ; aij is the area of patch ij; n is the total patch number of class i; A is the total landscape area.The greater LPI indicates that the dominance is more highlighted.
ShapeArea-Weighted Fractal Dimension Index (FRAC_AM) FRAC = 2 ln ( 0.25 p ij ) ln a ij ; pij is the perimeter of patch ij; the others present the same as the above; FRAC_AM is the area-weighted mean of FRAC.It describes the shape complexity.
Aggregation Landscape Shape Index (LSI) 0.25 E * A ; E* is the total length of the edge in the landscape; the others present the same as the above.It evaluates the overall geometric fragmentation.
Patch Density (PD) N A × 10 , 000   ×   100 ; N is the total patch number in the landscape; the others present the same as the above.It describes the landscape fragmentation.
Percentage of Like Adjacencies (PLADJs) i = 1 m g ii i = 1 m k = 1 m g ik × 100 ; gii is the number of like adjacencies (joins) between pixels of class i based on the double-count method; gik is the number of adjacencies (joins) between pixels of classes i and k based on the double-count method.The greater PLADJ represents more aggregation.
Splitting Index (SPLIT) A 2 i = 1 m j = 1 n a ij 2 ; parameters present the same as the above.It describes the landscape fragmentation.
Table 3. Annual forest area changes in shrinking cities with symbols: − denotes decrease and + denotes increase.
YearForest Area (km2)Change TypeAbsolute Change Rate (km2/Year)
AnnualEvery Five YearsTotalAnnualEvery Five YearsTotal
2000251,535.74/++/311.94120.35
2001251,282.61253.13
2002251,229.41+53.20
2003251,907.02+677.60
2004252,753.18+846.16
2005253,095.46+342.28
+60.44
2006253,072.9322.53
2007253,210.24+137.31
2008253,620.08+409.84
2009253,520.4499.64
2010253,397.67122.77
250.87
2011253,568.31+170.64
2012253,338.51229.80
2013252,286.271052.24
2014252,028.70257.57
2015252,143.31+114.61
+225.40
2016252,388.93+245.63
2017252,659.38+270.45
2018252,925.45+266.07
2019253,580.98+655.53
2020253,270.31310.66
+456.52
2021253,615.01+344.70
2022254,183.36+568.35
Disclaimer/Publisher’s Note: The statements, opinions and data contained in all publications are solely those of the individual author(s) and contributor(s) and not of MDPI and/or the editor(s). MDPI and/or the editor(s) disclaim responsibility for any injury to people or property resulting from any ideas, methods, instructions or products referred to in the content.

