Article

A Multi-Scale Deep Learning Algorithm for Enhanced Forest Fire Danger Prediction Using Remote Sensing Images

by
Jixiang Yang
1,2,
Huiping Jiang
1,2,*,
Sen Wang
1,2 and
Xuan Ma
1,2
1
Key Laboratory of Ethnic Language Intelligent Analysis and Security Governance of MOE, Minzu University of China, Beijing 100081, China
2
School of Information Engineering, Minzu University of China, Beijing 100081, China
*
Author to whom correspondence should be addressed.
Forests 2024, 15(9), 1581; https://doi.org/10.3390/f15091581
Submission received: 4 August 2024 / Revised: 1 September 2024 / Accepted: 7 September 2024 / Published: 9 September 2024
(This article belongs to the Special Issue Forest Fires Prediction and Detection—2nd Edition)

Abstract

:
Forest fire danger prediction models often face challenges due to spatial and temporal limitations, as well as a lack of universality caused by regional inconsistencies in fire danger features. To address these issues, we propose a novel algorithm, squeeze-excitation spatial multi-scale transformer learning (SESMTML), which is designed to extract multi-scale fire danger features from remote sensing images. SESMTML includes several key modules: the multi-scale deep feature extraction module (MSDFEM) captures global visual and multi-scale convolutional features, the multi-scale fire danger perception module (MFDPM) explores contextual relationships, the multi-scale information aggregation module (MIAM) aggregates correlations of multi-level fire danger features, and the fire danger level fusion module (FDLFM) integrates the contributions of global and multi-level features for predicting forest fire danger. Experimental results demonstrate the model’s significant superiority, achieving an accuracy of 83.18%, representing a 22.58% improvement over previous models and outperforming many widely used deep learning methods. Additionally, a detailed forest fire danger prediction map was generated using a test study area at the junction of the Miyun and Pinggu districts in Beijing, further confirming the model’s effectiveness. SESMTML shows strong potential for practical application in forest fire danger prediction and offers new insights for future research utilizing remote sensing images.

1. Introduction

Forest fire danger has long been a global environmental and social problem that disrupts the balance of ecosystems and threatens human lives [1,2]. Given the serious threat posed by forest fires, predicting forest fire danger has become an important topic in environmental science and public safety [3]. The current dominant approach to predicting forest fire danger relies primarily on environmental data obtained through ground-based observations, meteorological data, and manually collected historical fire records. These data sources include factors such as forest density, topography, temperature conditions, drought, land use type, gross domestic product, proximity to roads, population density, and historical fire intensity [4,5,6,7].
By integrating and analyzing diverse data sources, countries have developed comprehensive fire danger rating systems to enhance prediction accuracy and support effective fire management strategies. For example, the Canadian Forest Fire Danger Rating System (CFFDRS) [8] utilizes meteorological data—such as temperature, humidity, wind speed, and precipitation—to calculate the Fire Weather Index (FWI) and predict fire behavior through the Fire Behavior Prediction (FBP) system, which takes into account fuel moisture, fuel types, topography, and weather variables [9,10]. Similarly, the U.S. National Fire Danger Rating System (NFDRS) [11] combines weather and fuel data to assess daily fire danger levels and uses sub-models to simulate fuel moisture and fire behavior, providing updates to guide forest management and firefighting efforts [12]. The European Forest Fire Information System (EFFIS) [13] integrates satellite remote sensing data and meteorological forecasts to compute fire danger indices, generate fire danger maps, and issue warnings, thereby supporting fire prevention and emergency response across Europe [14]. In Russia, the ISDM-Rosleshoz system [15,16] uses satellite imagery, meteorological data, and ground observations to monitor and predict forest fires, incorporating real-time data to support fire prevention and firefighting strategies.
In the academic field, forest fire danger prediction has traditionally relied on deterministic, deterministic/probabilistic, empirical, physically-based, and statistical approaches, each with its own strengths and limitations. Recently, advances in machine learning and deep learning have introduced new methods that have significantly enhanced prediction capabilities.
Traditional methods for predicting forest fire danger are based on deterministic, deterministic/probabilistic, empirical, and physical models, each with its own strengths and limitations. Deterministic approaches rely on physical models to directly simulate and predict fire behavior based on precise input conditions such as fuel type, wind speed, temperature, and humidity [17]. These models can provide detailed forecasts of fire spread, flame height, and fireline intensity, making them suitable for high-resolution, short-term predictions. Deterministic/probabilistic approaches combine deterministic models with probabilistic frameworks, allowing for the modeling of fire behavior under specific conditions while accounting for uncertainties in input parameters [18,19,20]. Empirical approaches use historical fire data and statistical analysis to predict future events by establishing relationships between fire probability and environmental variables such as weather conditions, vegetation types, and human activities [21,22,23,24]. Physical-based approaches utilize the fundamental laws of physics that govern fire behavior, including heat conduction, convection, radiation, and combustion reactions, to simulate the dynamic processes of fire spread [25,26]. While these models provide detailed simulations of fire dynamics across complex terrains and varying fuel conditions, they require significant computational resources due to their complexity.
Statistic-based methods, once the dominant approach to forest fire danger prediction, focus on understanding the spatial relationships between forest fires and their drivers, assessing their impacts, and predicting forest fire danger in a given area. Techniques such as frequency ratio models and multi-criteria decision analysis are commonly used to establish relationships between historical fire data and contributing factors, often incorporating expert domain knowledge [27,28,29,30]. For example, Ref. [31] utilized a frequency ratio model to analyze burned areas in the Atlantic Forest using MODIS data from 2001 to 2019, extracting climatic, topographic, human, and landscape variables to identify high-danger areas. Similarly, Ref. [32] applied multi-criteria decision analysis in southeastern China to weigh various geographic indicators and predict forest fire danger. In the Eastern Mediterranean region of Turkey, Ref. [33] employed hierarchical analysis to determine the relative importance of different fire-influencing factors. To address uncertainties in these factors [34], used fuzzy hierarchical analysis with a weighted linear combination method to predict fire-prone areas based on topographic, climatic, biophysical, and anthropogenic variables. Additionally, Ref. [35] combined spatial superposition analysis, Kriging interpolation, and logistic regression to mitigate overfitting or underfitting in model performance. Other approaches, such as those by [36], used linear and quadratic discriminant analysis, frequency ratio, and weight-of-evidence methods to map forest fire danger by extracting factors like slope, elevation, and land use. However, the limitations of statistical approaches—including poor learning ability, weak fault tolerance, and inadequate error handling—often lead to inaccurate predictions.
With advancements in technology, researchers have increasingly adopted machine learning methods to model the complex relationships between forest fires and their influencing factors using artificial intelligence [37,38]. These methods leverage various algorithms to enhance prediction accuracy by adjusting model parameters based on large datasets. For example, fuzzy logic algorithms have been used to integrate bioclimatic, geomorphological, and anthropogenic factors for predicting forest fire danger [39]. Other approaches, such as Random Forests and Back Propagation Neural Networks, have been employed to identify high-danger areas by analyzing diverse environmental data [40]. Support Vector Machines (SVMs) have been applied to pinpoint key factors contributing to fires, while Gradient Boosting Decision Trees (GBDTs) effectively quantify potential fire danger using a combination of topographical, meteorological, socio-economic, and vegetation data [41,42]. Ensemble methods, such as regression tree classifiers, and neural networks like multi-layer perceptrons (MLPs), have shown high accuracy in mapping burned areas and predicting fire probabilities using satellite imagery and other spatial data [43,44,45]. These machine learning models have the advantage of handling complex, non-linear interactions and can be adapted for real-time fire danger predictions through advanced techniques such as spatiotemporal knowledge mapping [46].
Building on the foundations of machine learning, deep learning-based approaches have significantly advanced forest fire prediction by leveraging complex neural network architectures to analyze and understand the multimodal drivers of fires and their interrelationships. These methods can extract detailed spatial features such as fire area morphology, vegetation cover, and topography, while also capturing spatiotemporal patterns of fire occurrence, including propagation paths, seasonal fluctuations, and dynamic meteorological responses [47,48,49]. For instance, fully connected networks have been employed to analyze the spatial correlations of active fire hotspots with high accuracy [50]. Dynamic convolutional neural networks have been utilized to identify fire danger from UAV-captured images, thereby enhancing prediction accuracy [51]. Transformer architectures and time series prediction methods have been developed to analyze temporal patterns in fire data, achieving impressive prediction accuracies [52,53]. Additionally, advanced models like deep convolutional inverse graphical networks and sparse autoencoder-based deep neural networks have been applied to predict fire patterns and manage imbalances in key fire drivers, further refining fire danger assessments [54,55]. Techniques combining U-Net architectures with specialized frameworks like FU-NetCast have been used to predict wildfire spread and monitor progression using satellite imagery [56,57]. These deep learning methods provide a comprehensive and nuanced understanding of forest fire dynamics, offering high precision in predicting fire danger.
Recently, the use of remote sensing images for forest fire danger prediction is gradually becoming a hot method [58,59,60]. Remote sensing images provided by various publicly available satellite products can provide surface information with wide coverage, high resolution, and fast update frequency, allowing researchers to monitor the condition of large forest areas in real time [61]. By analyzing these images, important surface features related to fire danger, such as vegetation cover, type of vegetation, burnable materials, and distance from roads, can be extracted to identify potential danger areas for fire occurrence and provide critical information to support fire management and emergency response [62].
Although the current forest fire danger prediction models have made some progress, there are several remaining key challenges:
  • Spatial and temporal limitations: Most existing models rely on localized data or data from specific time periods, limiting their applicability across different geographic regions and climatic conditions. Given the complexity of forest fires and the diversity of their driving factors, models need broader spatial coverage and longer temporal scales to improve prediction accuracy and generalizability.
  • Inconsistency of fire danger characteristics across regions: Factors such as vegetation type, topography, climate conditions, and human activities can vary greatly from one region to another, leading to models that perform well in one area but poorly in another. To enhance prediction performance across diverse environmental conditions, models must be adaptable to this heterogeneity.
  • Inability to extract fire danger-related information from remote sensing images: Current models struggle to accurately extract and interpret spatial information from remote sensing images, such as vegetation cover, vegetation types, ground object information, spatial information, and topography, which are crucial for assessing fire danger levels. This limitation prevents models from fully utilizing remote sensing data to detect subtle variations in the landscape, leading to less precise and reliable fire danger assessment.
In order to enhance the ability to extract semantic information within remote sensing images, especially in the context of forest fire danger, and to achieve accurate mapping between remote sensing images and fire danger levels, we propose a forest fire danger prediction model named SESMTML (squeeze-excitation spatial multi-scale transformer learning) to address the above challenges. The major contributions of this article are summarized as follows:
  • “Forest fire danger prediction network SESMTML”: A novel method for predicting forest fire danger using computer vision, which leverages the strengths of convolutional neural networks (CNNs) and Transformer [63,64] to extract both local and global features, as well as contextual information from remote sensing images. This approach allows for comprehensive mining and aggregation of multi-level visual features related to fire danger, enhancing prediction accuracy and reliability. Extensive experiments on the FireRisk [65] dataset demonstrate that SESMTML achieves superior performance in forest fire danger prediction.
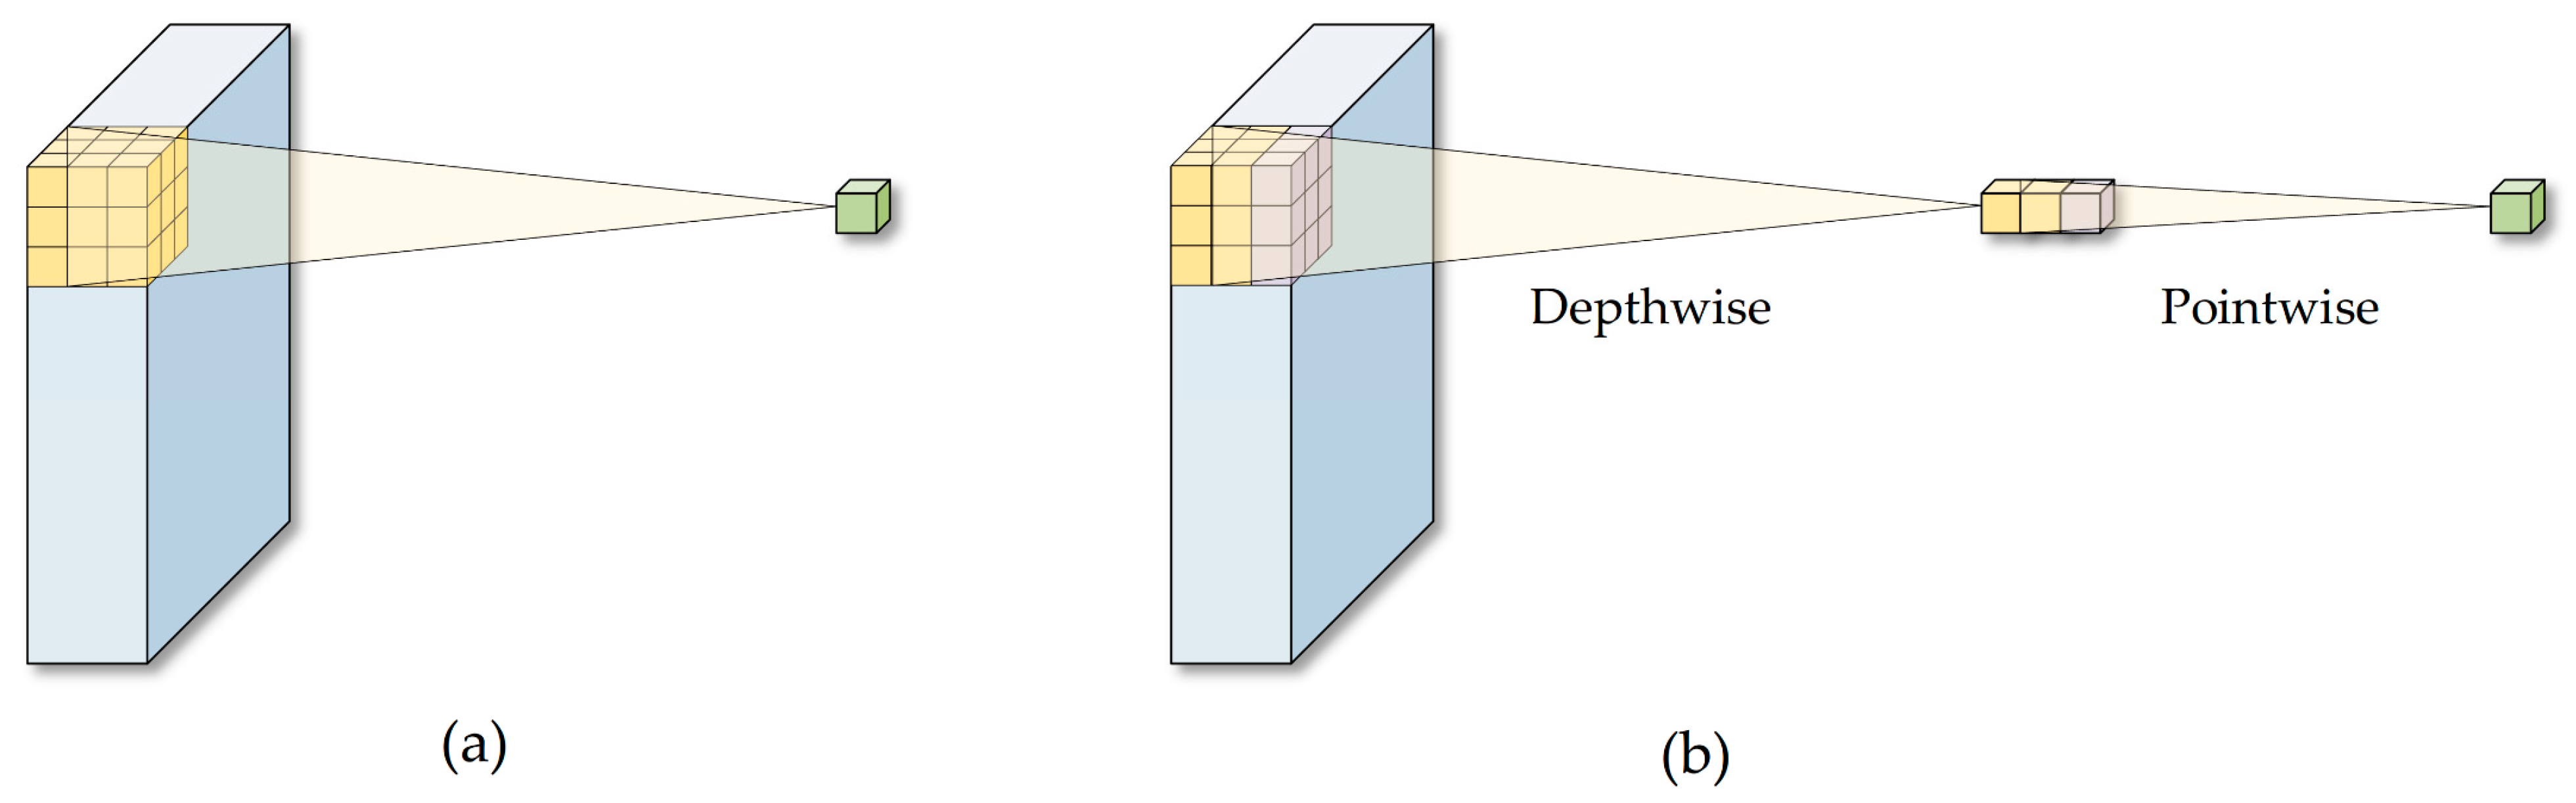
  • “Multi-scale depth feature extraction module”: To improve computational efficiency and adaptability for high-resolution remote sensing image processing, we introduce depth separable convolution [66,67] in place of the standard convolution within the residual blocks of the ResNet34 [68] backbone network, forming the DSConvBlock component. This modification allows for more focused and efficient spatial feature extraction and channel feature fusion, leading to enhanced feature extraction capabilities and improved performance in predicting forest fire danger.
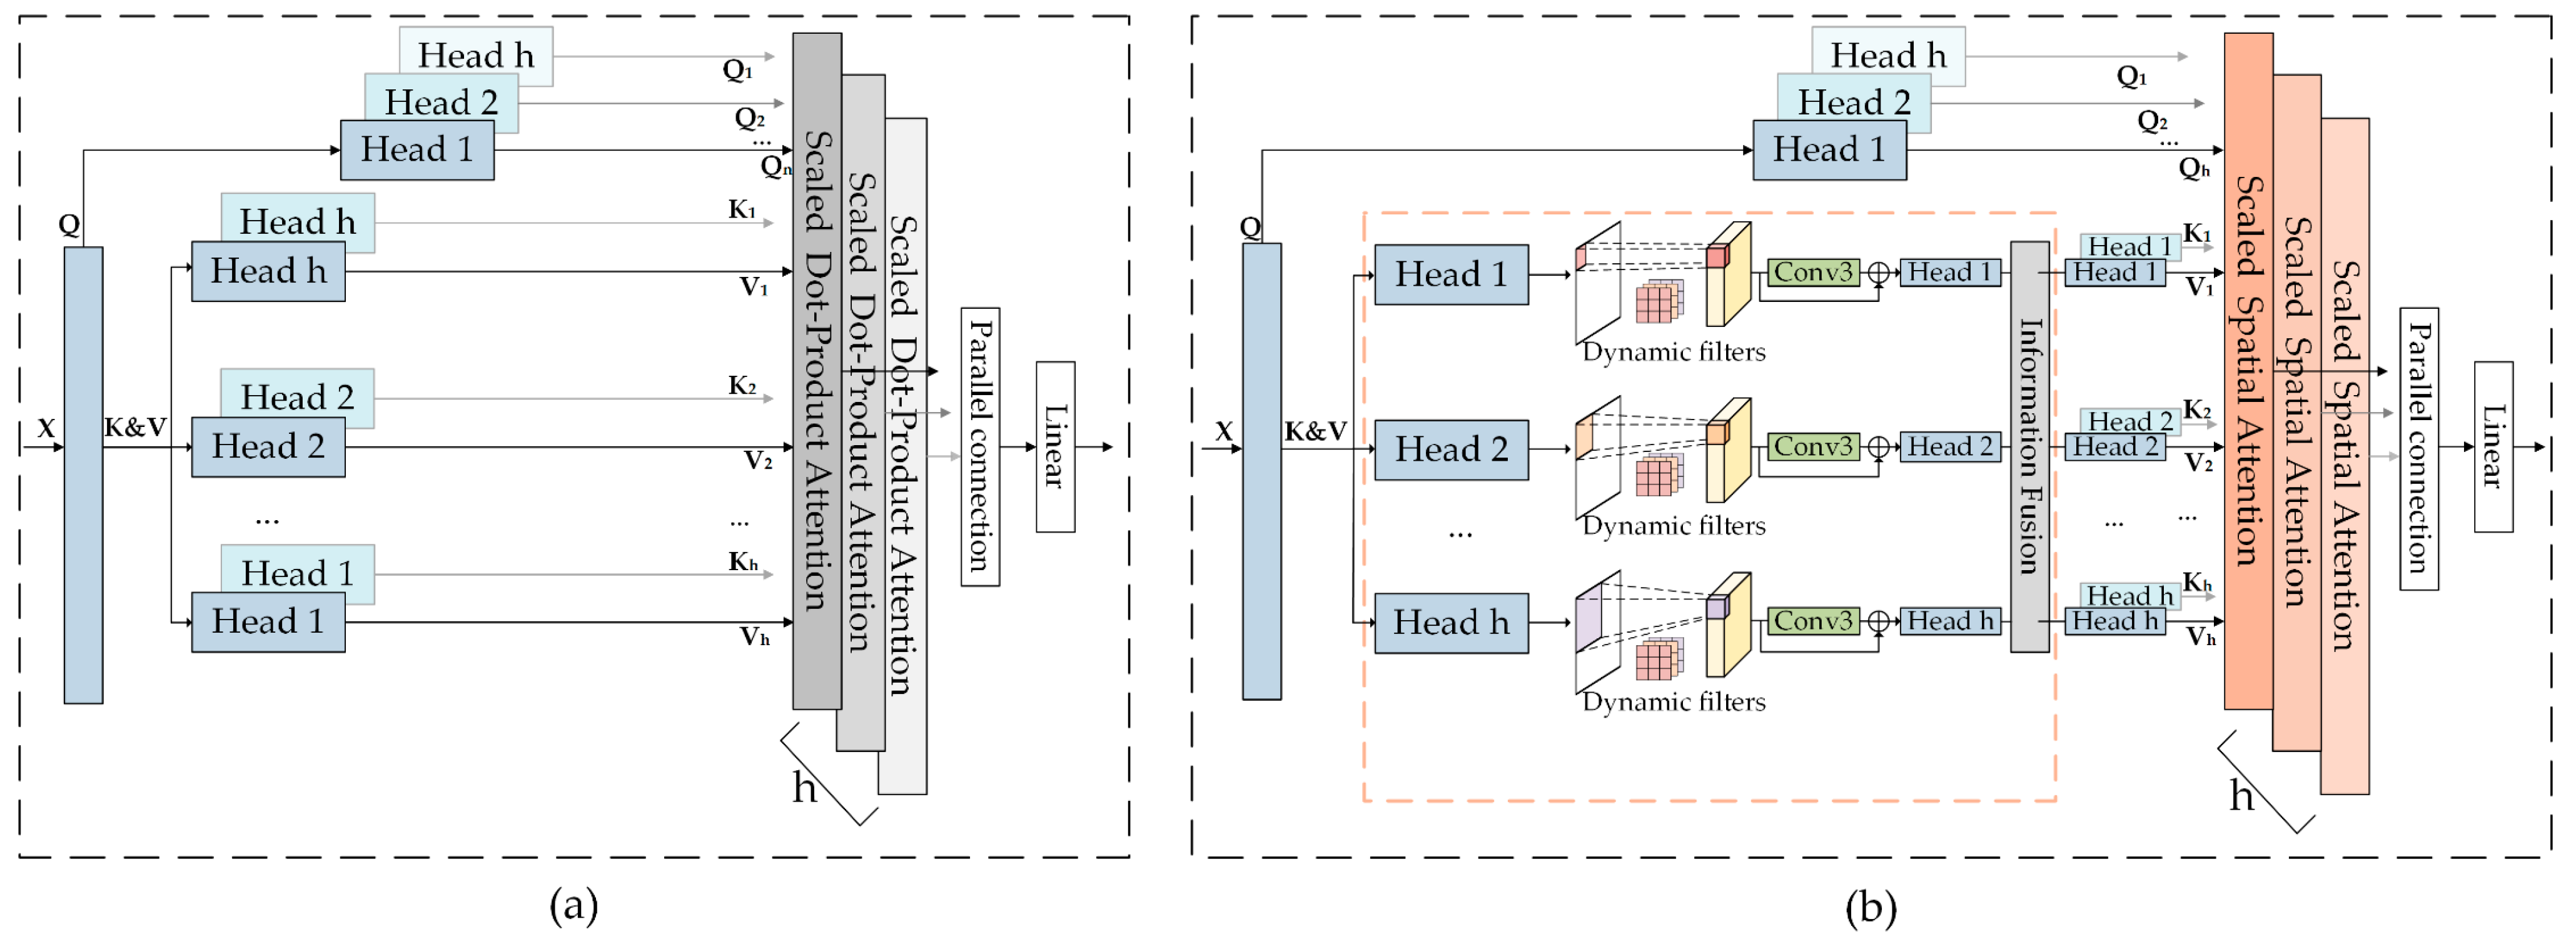
  • “Multi-scale fire danger perception module”: The multi-scale fire danger perception module utilizes the multi-scale multi-headed self-attention (SMMSA) mechanism to capture complex patterns and background information at various scales, which are crucial for identifying fire hazards in remotely sensed imagery. Additionally, incorporating the spatial attention mechanism (SAM) [69] further improves the model’s ability to focus on critical areas in the input features, enhancing sensitivity and accuracy in spatial information processing. The squeeze-excite multi-layer perceptron (SE-MLP) module, combining SENet [70] with MLP, enables dynamic feature reweighting by modeling dependencies between convolutional feature channels, thereby improving the model’s representation efficiency and robustness.

2. Materials and Methods
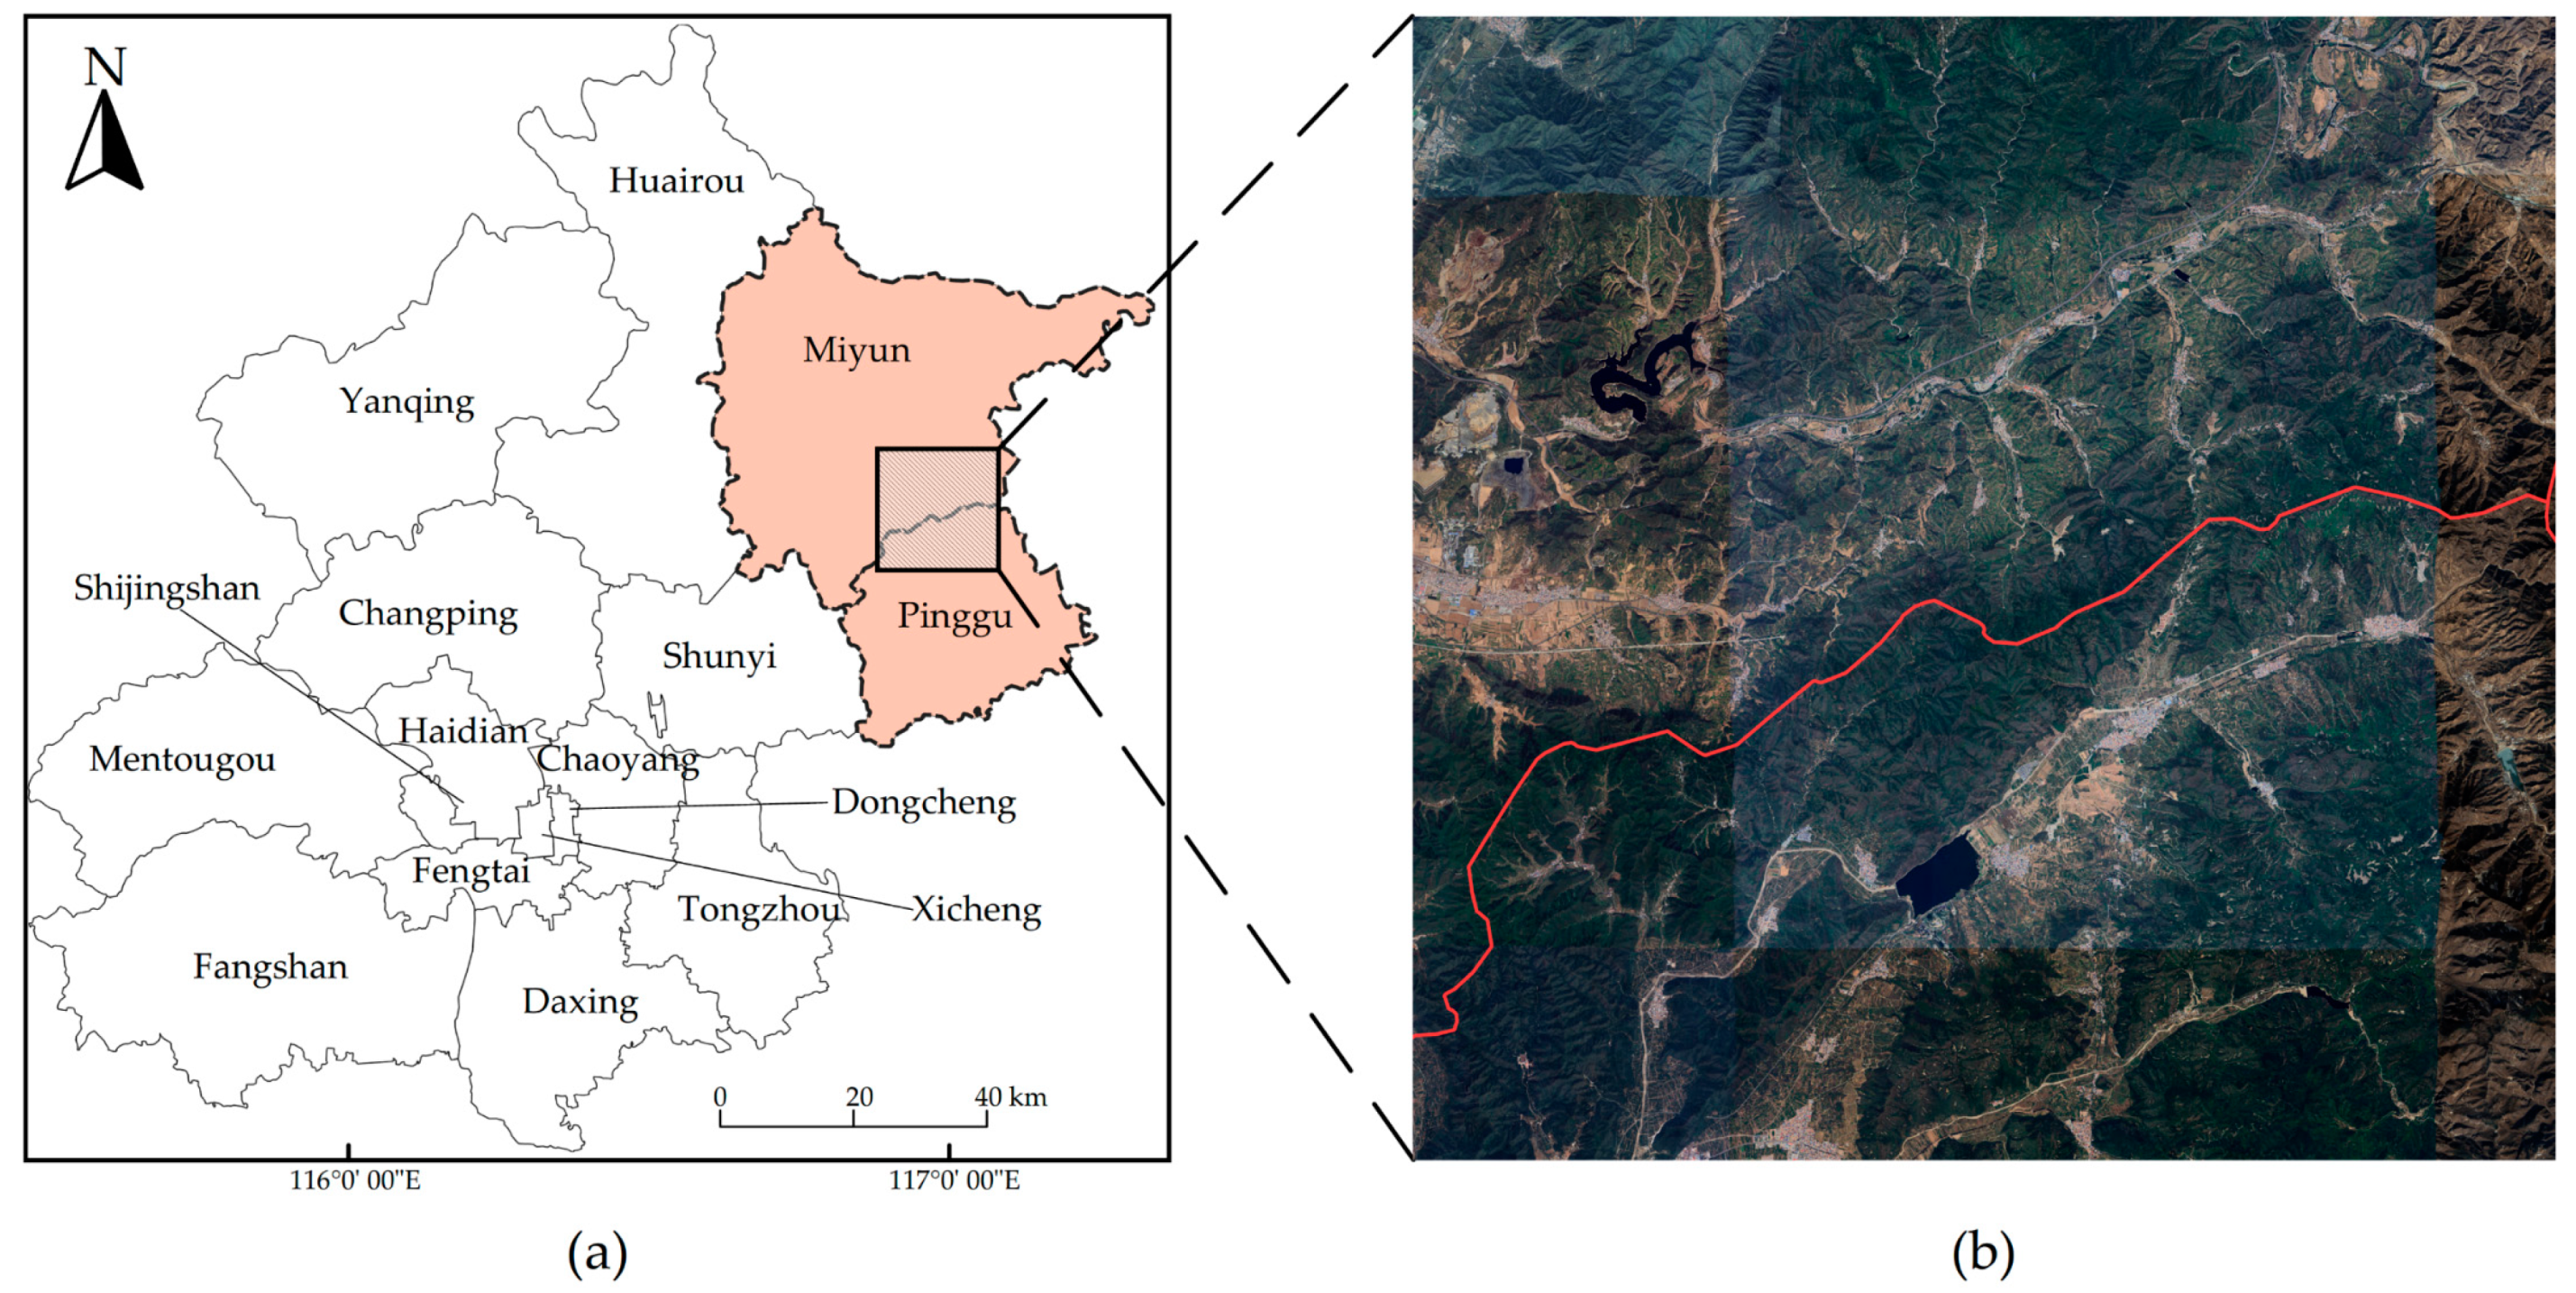
2.1. Study Area

In an effort to thoroughly assess the practicality and regional applicability of SESMTML in forest fire danger prediction, the area at the border of the Miyun and Pinggu districts in Beijing was selected as a test study case. This region, with geographic coordinates ranging from 40°6′24.4″ N to 40°27′28.3″ N and from 116°59′21.6″ E to 117°13′35.6″ E, covers an approximate area of 300 km2. The topography is complex, predominantly characterized by mountains and hills, with elevations ranging from approximately 100 to 800 m above sea level, contributing to a diverse array of microclimates and ecological conditions [71].
The study area experiences a temperate continental monsoon climate, characterized by distinct seasonal variations. Summers are typically warm and humid, while winters are cold and dry. The average annual temperature is approximately 11 °C, with January being the coldest month, averaging −5 °C, and July the warmest, averaging 25 °C. Most precipitation occurs between July and September, contributing to an average annual rainfall of 600 mm [72]. This precipitation pattern influences the region’s seasonal fire danger, as increased moisture promotes vegetation growth, which can subsequently serve as fuel for fires.
In terms of land cover, the study area is predominantly forested, with interspersed shrubs and patches of sparse grasslands [73,74]. The forests consist of a mix of coniferous and deciduous species, such as Pinus tabuliformis, Quercus variabilis, and Betula platyphylla, which are well adapted to the local climatic and topographical conditions. The understory vegetation is diverse, featuring shrubs like Vitex negundo and Ziziphus jujuba, along with various herbaceous plants [75,76,77]. This diversity in vegetation types and structure provides a range of fuel sources that can influence fire behavior, making the region particularly suitable for studying fire danger and validating SESMTML. The study area and its remote sensing images are depicted in Figure 1.

2.2. Feature Extraction Strategy for Fire Danger in SESMTML

The core idea of SESMTML is to model the dependencies between feature channels mapped from remotely sensed imagery to forest fire danger classes, as interactions between different feature channels are crucial. This complex dependency structure needs to be captured effectively and expressed explicitly to enhance the model’s understanding of the intrinsic patterns of fire danger derived from remotely sensed imagery.
To effectively extract fire danger features from remotely sensed images and understand the importance and contribution of information at different scales to fire danger assessment, SESMTML has been improved in feature extraction and the fusion of multi-scale details. This is achieved by adopting a strategy that combines CNN and transformer architectures to explore the contextual relationships between global spatial information and local details. While CNNs excel at extracting local features, they struggle to understand global spatial relationships because they primarily focus on localized regions of an image through convolutional kernels, neglecting the long-range contextual associations between these regions. For instance, a remotely sensed image from the FireRisk dataset labeled with a Very low fire danger rating (see Figure 2) may contain numerous elements such as ‘trees’, ‘roads’, ‘grassland’, and ‘building’. Due to the high inter-class similarity among remotely sensed images of different fire danger levels, a model that focuses solely on local structural information, such as densely forested areas, might incorrectly classify a Very low fire danger image as High. Therefore, accurate forest fire danger prediction based on remotely sensed images necessitates a global perspective and an understanding of the contextual correlations between local features, enhancing both the accuracy and reliability of the predictions.

2.3. SESMTML Overall Architecture

Figure 3 illustrates the architecture of the proposed SESMTML framework, where the raw images are fused to the fully connected (FC) layer through a series of convolution, pooling, and nonlinear transformations throughout the process. The FC then integrates all the previously extracted features to generate a fixed-length global feature vector, which condenses all the information in the remotely sensed image that is highly relevant to the forest fire danger, which is then used as the classifier’s input for generating predictive scores for fire danger, thus enabling mapping from raw images to danger assessment. The model integrates four key components: MDFEM, MFDPM, MIAM, and FDLFM. The MDFEM, as the first link, is responsible for extracting the extracted global visual features and multi-level convolutional features related to forest fire danger from the remotely sensed images. The MFDPM then focuses on the deep mining of contextual information about the fire danger at different scales from the images. The MIAM is introduced through the cross-level attention mechanism and strengthens inter-feature interactions while promoting multi-level feature fusion, making the information extracted from remote sensing images more coherent and complete. Finally, FDLFM, as the integration link of the whole framework, is committed to integrating global and local features to construct a set of highly predictive feature representations. Next, the working principle and specific details of each module will be discussed in depth in the following section.

2.3.1. Multi-Scale Depth Feature Extraction Module

ResNet34, a variant of the ResNet (Residual Networks) architecture, is widely recognized for its capability to handle complex image recognition tasks by addressing the vanishing gradient problem. Unlike traditional deep networks, ResNet34 employs residual connections, which allow gradients to flow directly through the network by adding skip connections. This structure not only stabilizes the training process but also enables the network to learn deeper representations by effectively capturing hierarchical features at multiple scales. The inherent design of ResNet34, which excels at extracting multi-scale and multi-level information, makes it an ideal choice for applications like forest fire danger prediction.
In this study, the improved ResNet34, as shown in Figure 3, is utilized as the feature extractor in MDFEM. It consists of four residual blocks and a fully connected (FC) layer, enabling the model to capture various levels of features effectively. The residual blocks at different levels are responsible for extracting features from low to high levels. The shallow convolutional layer focuses on capturing the visual elements of the image, such as color, texture, and edges. These primary features form the basis for understanding the content related to fire hazards within the image. In contrast, as the depth of the network increases, the higher-level convolutional layers can extract more abstract semantic information, such as specific feature types, image layouts, and vegetation cover patterns associated with different fire danger levels. To equip the model with the ability to interpret the image content of fire danger at different levels of abstraction and enrich its depth of understanding, as shown in Figure 4, the outputs of the last three residual blocks in ResNet34 are considered as low, medium, and high-level features. The global average pooling (GAP) layer then generates the global visual feature g .
Meanwhile, to enhance the efficiency of feature extraction, we replaced the original BasicBlock in the backbone with DSConvBlock. The specific structure of this block is shown in Figure 4.
As depicted in Figure 5, depth-separable convolution achieves efficient feature extraction and fusion by decomposing the standard convolution into two independent steps: depthwise convolution and pointwise convolution. Specifically, depthwise convolution performs the convolution operation independently on each input channel, thus preserving the spatial information of each channel. This independent operation enables the model to thoroughly capture local features of each channel, such as fine-grained information of edges and textures, which contributes to bolstering the fineness and completeness of the feature representation. Subsequently, pointwise convolution performs convolution operations on all input channels by 1 × 1 convolution to achieve a linear combination of cross-channel features. This step effectively integrates feature information from different channels to construct a more advanced feature representation, thus enhancing the expressive power of the model. Through this linear combination, the model can capture cross-channel correlations and generate richer and higher-level feature representations.

2.3.2. Multi-Scale Fire Danger Perception Module

Multi-level convolutional features contain rich local information about fire danger in remotely sensed images. However, they do not cover the remote contextual information within the image, which is important for forest fire danger prediction based on remotely sensed images. For the purpose of fully understanding the fire danger-related feature information within the remotely sensed images, we propose MFDPM to extract the contextual fire danger information, and its core part is a hybrid multi-scale transformer (HMT).
As shown in Figure 3, HMT consists of spatial multi-scale multi-head self-attention (SMMSA) blocks and SE-MLP blocks. In addition, layer norm (LN) layers are used before each block and residual connections are used after each block. The multi-layer perceptron (MLP) enhances the feature selection capability by incorporating the SE mechanism, the structure of which is shown in Figure 6, to improve the feature selection capability by adaptively adjusting the significance of each feature channel to highlight features that are important in contributing to the prediction of the fire danger, strengthen the expressive ability of the model, enhance the model’s understanding of complex spatial and fire danger information, and improve the robustness of the model, making it more stable and reliable in the face of noise or incomplete data.
Taking X 1 as the low-level feature input, the output after HMT can be written as:
X 1 S M M S A = S M M S A ( L N ( X 1 ) ) + X 1
Y 1 = S E M L P ( L N ( X 1 S M M S A ) ) + X 1 S M M S A
where Y 1 is the encoded image feature. The processing here is different from the conventional practice of traditional vision transformers that directly convert the input remote sensing image into a series of patch embeddings, and we chose to flatten the convolutional feature map X 1 into a sequence of one-dimensional marker embeddings X 1 as the input. The advantage of this strategy is that it captures crucial local structural information from the convolutional features. After completing the serialisation process via HMT, the output one-dimensional feature Y 1 is reshaped to the two-dimensional image domain and is subjected to a superposition operation with the original feature map X 1 , resulting in an enhanced discriminative feature representation Y 1 . Following the same processing logic, the mid-level feature representation Y 2 and the high-level feature representation Y 3 are also obtained sequentially.
Specifically, the key advantage of the SMMSA design, as shown in Figure 7b, lies in its ability to learn multi-scale properties related to fire danger accurately. The process starts by reconstructing the input X into a two-dimensional spatial representation X , and subsequently, unlike the standard MSA (as shown if Figure 7a) which only uses fixed-scale attention heads, SMMSA utilizes dynamic convolution [78], which enables the h attention heads to dynamically adjust the morphology and parameters of their convolution kernels based on the intrinsic properties of the input data, thereby extracting multi-scale information from X . Compared to the standard convolution kernel, the advantage of dynamic convolution is that it can flexibly adjust the size of the receptive field while keeping the number of parameters relatively low. As a result, the features extracted through h attention heads present a pyramidal hierarchical structure, effectively covering the multi-scale perspective from low-level to high-level features.
For X , the step can be expressed as:
D i = D y n a m i c C o n v i ( X i )
where D i is the feature generated by dynamic convolution and D y n a m i c C o n v i ( · ) denotes the dynamic convolution function of the i th head. We then use learnable position encoding (LPE) to preserve positional information. Learnable position encoding can be achieved with only a standard convolution of kernel size 3 × 3. The process can be expressed as:
D i L P E = C o n v 3 × 3 ( D i ) + D i
Next, we spread and connect these features.
D = L N ( C o n c a t ( D 1 L P E , , D h L P E ) )
Moreover, D is utilized as an input and is projected into the key matrix K and the value matrix V during the attention computation. This method integrates and amplifies the communication of information between different heads within the SMMSA. Consequently, the output features of each head encompass multi-scale information, followed by multi-head attention computation.
h e a d i = A t t e n t i o n ( X W i Q , D W i K , D W i V )
where W i Q , W i K , and W i V are the learned parameter matrix and a t t e n t i o n ( · ) is the self-attention head function.
This is done to improve the model’s attention to key spatial locations and thus enhance the feature representation. We used a spatial attention mechanism (SAM) to replace the scaled dot product attention mechanism. The SAM can take a convolutional layer to generate an attention map and then use that attention map to enhance the spatial representation of the input features. The spatial attention mechanism is shown in Figure 8. The formula is:
A t t e n t i o n ( Q , K , V ) = s o f t m a x ( Q K T d k ) = F σ ( C o n v 7 × 7 ( [ A v g P o o l ( F ) ; M a x P o o l ( F ) ] ) )
where { Q ,   K ,   V } denotes the input data, d k is the scaling factor, d k is the dimension of K , s o f t m a x ( · ) denotes the softmax function that generates the attention score, A v g P o o l ( F ) and M a x P o o l ( F ) denote the average pooling and maximum pooling operations, respectively, σ denotes the sigmoid activation function, and denotes the element-by-element multiplication.

2.3.3. Multi-Scale Information Aggregation Module

Building on previous work, we have thoroughly explored how to utilize multi-scale information to enhance the accuracy of forest fire danger prediction. Although MFDPM has extracted rich local features and contextual information on fire danger from remotely sensed images, these features are still confined to the field of view of a single convolutional layer, failing to adequately fuse feature information from different depths. To overcome this bottleneck, we introduce MIAM, whose core objective is to capture and exploit the long-range dependencies between features at different spatial scales, and to develop a comprehensive understanding of the content of remotely sensed images with fire hazards by aggregating features at multiple levels. The core of MIAM’s design focuses on fusing features at different scales. Considering that high-level features ( Y 3 ) are rich in semantic information, while mid- and low-level features ( Y 1 and Y 2 ) carry rich shallow details, inspired by the cross-level intentionality (CLA) mechanism, we adopt an approach that integrates global and aggregated multi-level features. This ensures the effective interaction and integration of features at different levels, to facilitate the fusion of the contributing information for predicting the forest fire danger, significantly enhancing feature representation capability, enabling the model to provide deeper insights into potential fire danger in remotely sensed images. MIAM enhances the semantic representation of high-level features, supplements the detailed information from the middle and low levels, and produces a more comprehensive and detailed feature representation for subsequent forest fire danger analysis and prediction. The architecture of MIAM is shown in Figure 3.
Specifically, MIAM receives three different levels of feature tensor as input, namely, Y 1 B × C 1 × H 1 × W 1 , Y 2 B × C 2 × H 2 × W 2 and Y 3 B × C 3 × H 3 × W 3 . In order to make these features comparable, we first need to unify their spatial dimensions and number of channels. This is done by applying average pooling and a 1 × 1 convolution operation is applied to reduce the spatial dimensions of the low-level feature Y 1 and the mid-level feature Y 2 to the same size and to standardize the number of channels. Following this adjustment, Y 1 and Y 2 are transformed into two new features. Y 1 l B × N 3 × C 3 and Y 2 m B × N 3 × 2 C 3 , where N = H × W . Next, with the aim of build up the attention mechanism across the hierarchical levels, we convert Y 1 l into Q by linear transformation and convert Y 2 m into K and V . This process can be described mathematically as follows:
Q = Y 1 l W Q ,   K = Y 2 m W K ,   V = Y 3 m W V
Subsequently, the dot product operation and softmax function are employed to quantify the phase correlation between Q and K after transposition, and the necessary scaling and softmax normalisation steps are implemented. Based on this, dropout is introduced to enhance the robustness of the model, followed by weighted averaging of V based on the computed attentional weights, resulting in the fusion feature Y M . Next, Y M is passed to the linear layer, and the dropout operation is applied again to ensure the expressive power of the feature and, at the same time, suppress the overfitting phenomenon. Finally, Y M is adjusted to match the initial morphology, i.e., Y M B × C 3 × H 3 × W 3 , by a reshaping operation. The superposition of this fusion feature Y M with the input tensor Y 3 constitutes our final aggregated feature output, and the process can be mathematically formalised as follows:
Y M = Y 3 + s o f t m a x   ( ( Y 1 l W Q ) ( Y 2 m W K ) T d k ) ( Y 2 m W V )
It is worth noting that unlike the self-attentive mechanism that relies only on a single level feature X to generate Q , K , and V , these vectors of MIAM are independently derived from the multi-level features Y 1 l , Y 2 m , and Y 3 . As a result, Y M is able to capture a richer and more diverse representation of fire danger information.

2.3.4. Fire Danger Level Fusion Module

In the FDLFM module, we will illustrate how to combine the multi-level convolutional feature Y M B × C 3 × H 3 × W 3 with the global visual feature g to optimise the efficacy of the forest fire danger prediction model. The specific implementation steps are as follows:
First, the spatial dimension of Y M is compressed using a GAP operation to produce a more compact convolutional expression Y M C 3 , which not only reduces the computational complexity but also effectively preserves the important information in the feature map. Subsequently, Y M is normalised via the L2 Norm layer to enhance the convergence stability of the network and avoid the gradient explosion or vanishing problem. Immediately after that, via the FC layer, Y M and g are converted into classification score vectors S Y C c l a s s and S g C c l a s s , respectively, where C c l a s s denotes the number of target classes. Finally, for the purpose of combining the contributions from two different information sources, we fuse S Y and S g by a simple arithmetic averaging strategy to obtain the fused classification score S . The fused classification score S is obtained as follows:
S = S Y + S g 2

2.4. Datasets and Preprocessing

The publicly available dataset FireRisk, which is used in this paper, contains a total of 91,872 high-resolution remotely sensed images at a resolution of 320 × 320 pixels. These images were collected using the national agricultural images program (NAIP) [79], a high-resolution remote sensing images program, and cover the U.S.‘s diverse geographic and climatic regions, providing a rich sample of surface orthorectified remote sensing images. This broad geographic coverage ensures that the developed model can demonstrate excellent adaptability and robustness in the face of complex and changing environmental conditions, providing a strong guarantee of the model’s generalization capability. The remote sensing dataset is annotated with fire danger classes provided by the wildfire hazard potential (WHP) raster data [80], which are subdivided into seven detailed forest fire danger classes: Non-burnable, Very low, Low, Moderate, High, Very high, and Water. The FireRisk dataset provides an indispensable empirical basis for researchers to construct accurate mapping relationships between remote sensing images and forest fire danger classes and promotes research progress in forest fire danger assessment.
The data preprocessing stage is critical to ensure the quality and effectiveness of model training. First, we cleaned the original dataset comprehensively to eliminate images with non-sunlight orthophotos, heavy shadow coverage, ambiguous surface information, and low recognition of ground texture. After this screening process, 70,314 high-quality remote sensing images were finally retained as valid samples. However, considering that some of the annotations in the dataset (e.g., Non-burnable and Water) have limited direct application value in practical forest fire management, and in order to improve the training efficiency and prediction performance of the model, we decided to reasonably simplify the original seven-level danger classification. Specifically, we reclassified the danger levels into a standard five more practical tiers: Very Low, Low, Moderate, High, and Extreme (corresponding to the original Very high). This aims to strengthen the decision support function of the model and make it more relevant to forest fire danger monitoring and prevention. This classification adjustment aims to strengthen the decision support function of the model, make it closer to the actual needs of forest fire danger monitoring and prevention, reduce the complexity of model training, and improve the practicability and interpretability of the model. An example of the processed image is shown in Figure 9.
To meet the experimental requirements, the dataset was divided into training and test sets with a ratio of 7:3. A total of 49,221 images were selected for the training set, and 21,093 images were selected for the test set. Detailed annotations of the dataset are provided in Table 1.

2.5. Evaluation of Indicators

The evaluation metrics adopt the widely used evaluation criteria within computer vision: Accuracy, Precision, Recall, Sample-weighted F1 score, and Confusion Matrix (CM), as the judging criteria for the model.
Overall accuracy (OA), defined as the number of correctly classified images divided by the total number of test images, reflects the general performance of the classification model. Precision is the ratio of true positive samples to all positive samples predicted by the model. Recall measures the proportion of true positive samples correctly identified by the model. The formulas for accuracy, precision, and recall are given below:
O A = T P + T N T P + F P + F N + T N
P r e c i s i o n = T P T P + F P
R e c a l l = T P T P + F N
where TP refers to instances correctly identified as the positive class, FP refers to instances incorrectly identified as the positive class, FN refers to instances incorrectly identified as the negative class, and TN refers to instances correctly identified as the negative class.
The sample-weighted F1 score is suitable for class-imbalanced data. It is a weighted average of the class F1 scores, with weights determined by the number of samples in each class, and is calculated using the following formula:
W e i g h t e d   F 1   S c o r e = i = 1 N w i × F 1   S c o r e i
F 1   Score = ( 2 Recall 1 + Precision 1 ) = 2 Precision · Recall Precision + Recall
w i = N o .   o f   s a m p l e s   i n   c l a s s   i T o t a l   n u m b e r   o f   s a m p l e s
The confusion matrix is used to analyze the detailed classification errors and the level of confusion between different forest fire danger categories. Each row and column represent the true and predicted categories, respectively, in the confusion matrix.

3. Results

3.1. Training and Experimental Comparison Platform

All experiments were conducted using PyTorch 2.10 [81] on Ubuntu 20.04 workstations equipped with a single GeForce RTX 4090 GPU. The specific hardware configurations are detailed in Table 2, and Table 3 lists the hyperparameters used during training. SESMTML’s backbone, ResNet34, was initialized with pre-trained parameters from the ImageNet dataset [82].
During the experiments, data augmentation techniques such as random rotations, horizontal flips, and vertical flips were applied. The training process primarily utilized the GPU for computations, particularly for tasks involving large matrix operations and deep learning model training. However, some pre-processing tasks and certain operations, such as data loading and augmentation, were managed by the CPU. Additionally, a cosine scheduler was employed to adjust the learning rate, which gradually decreased after a specified number of training epochs, following a stepwise decay pattern.

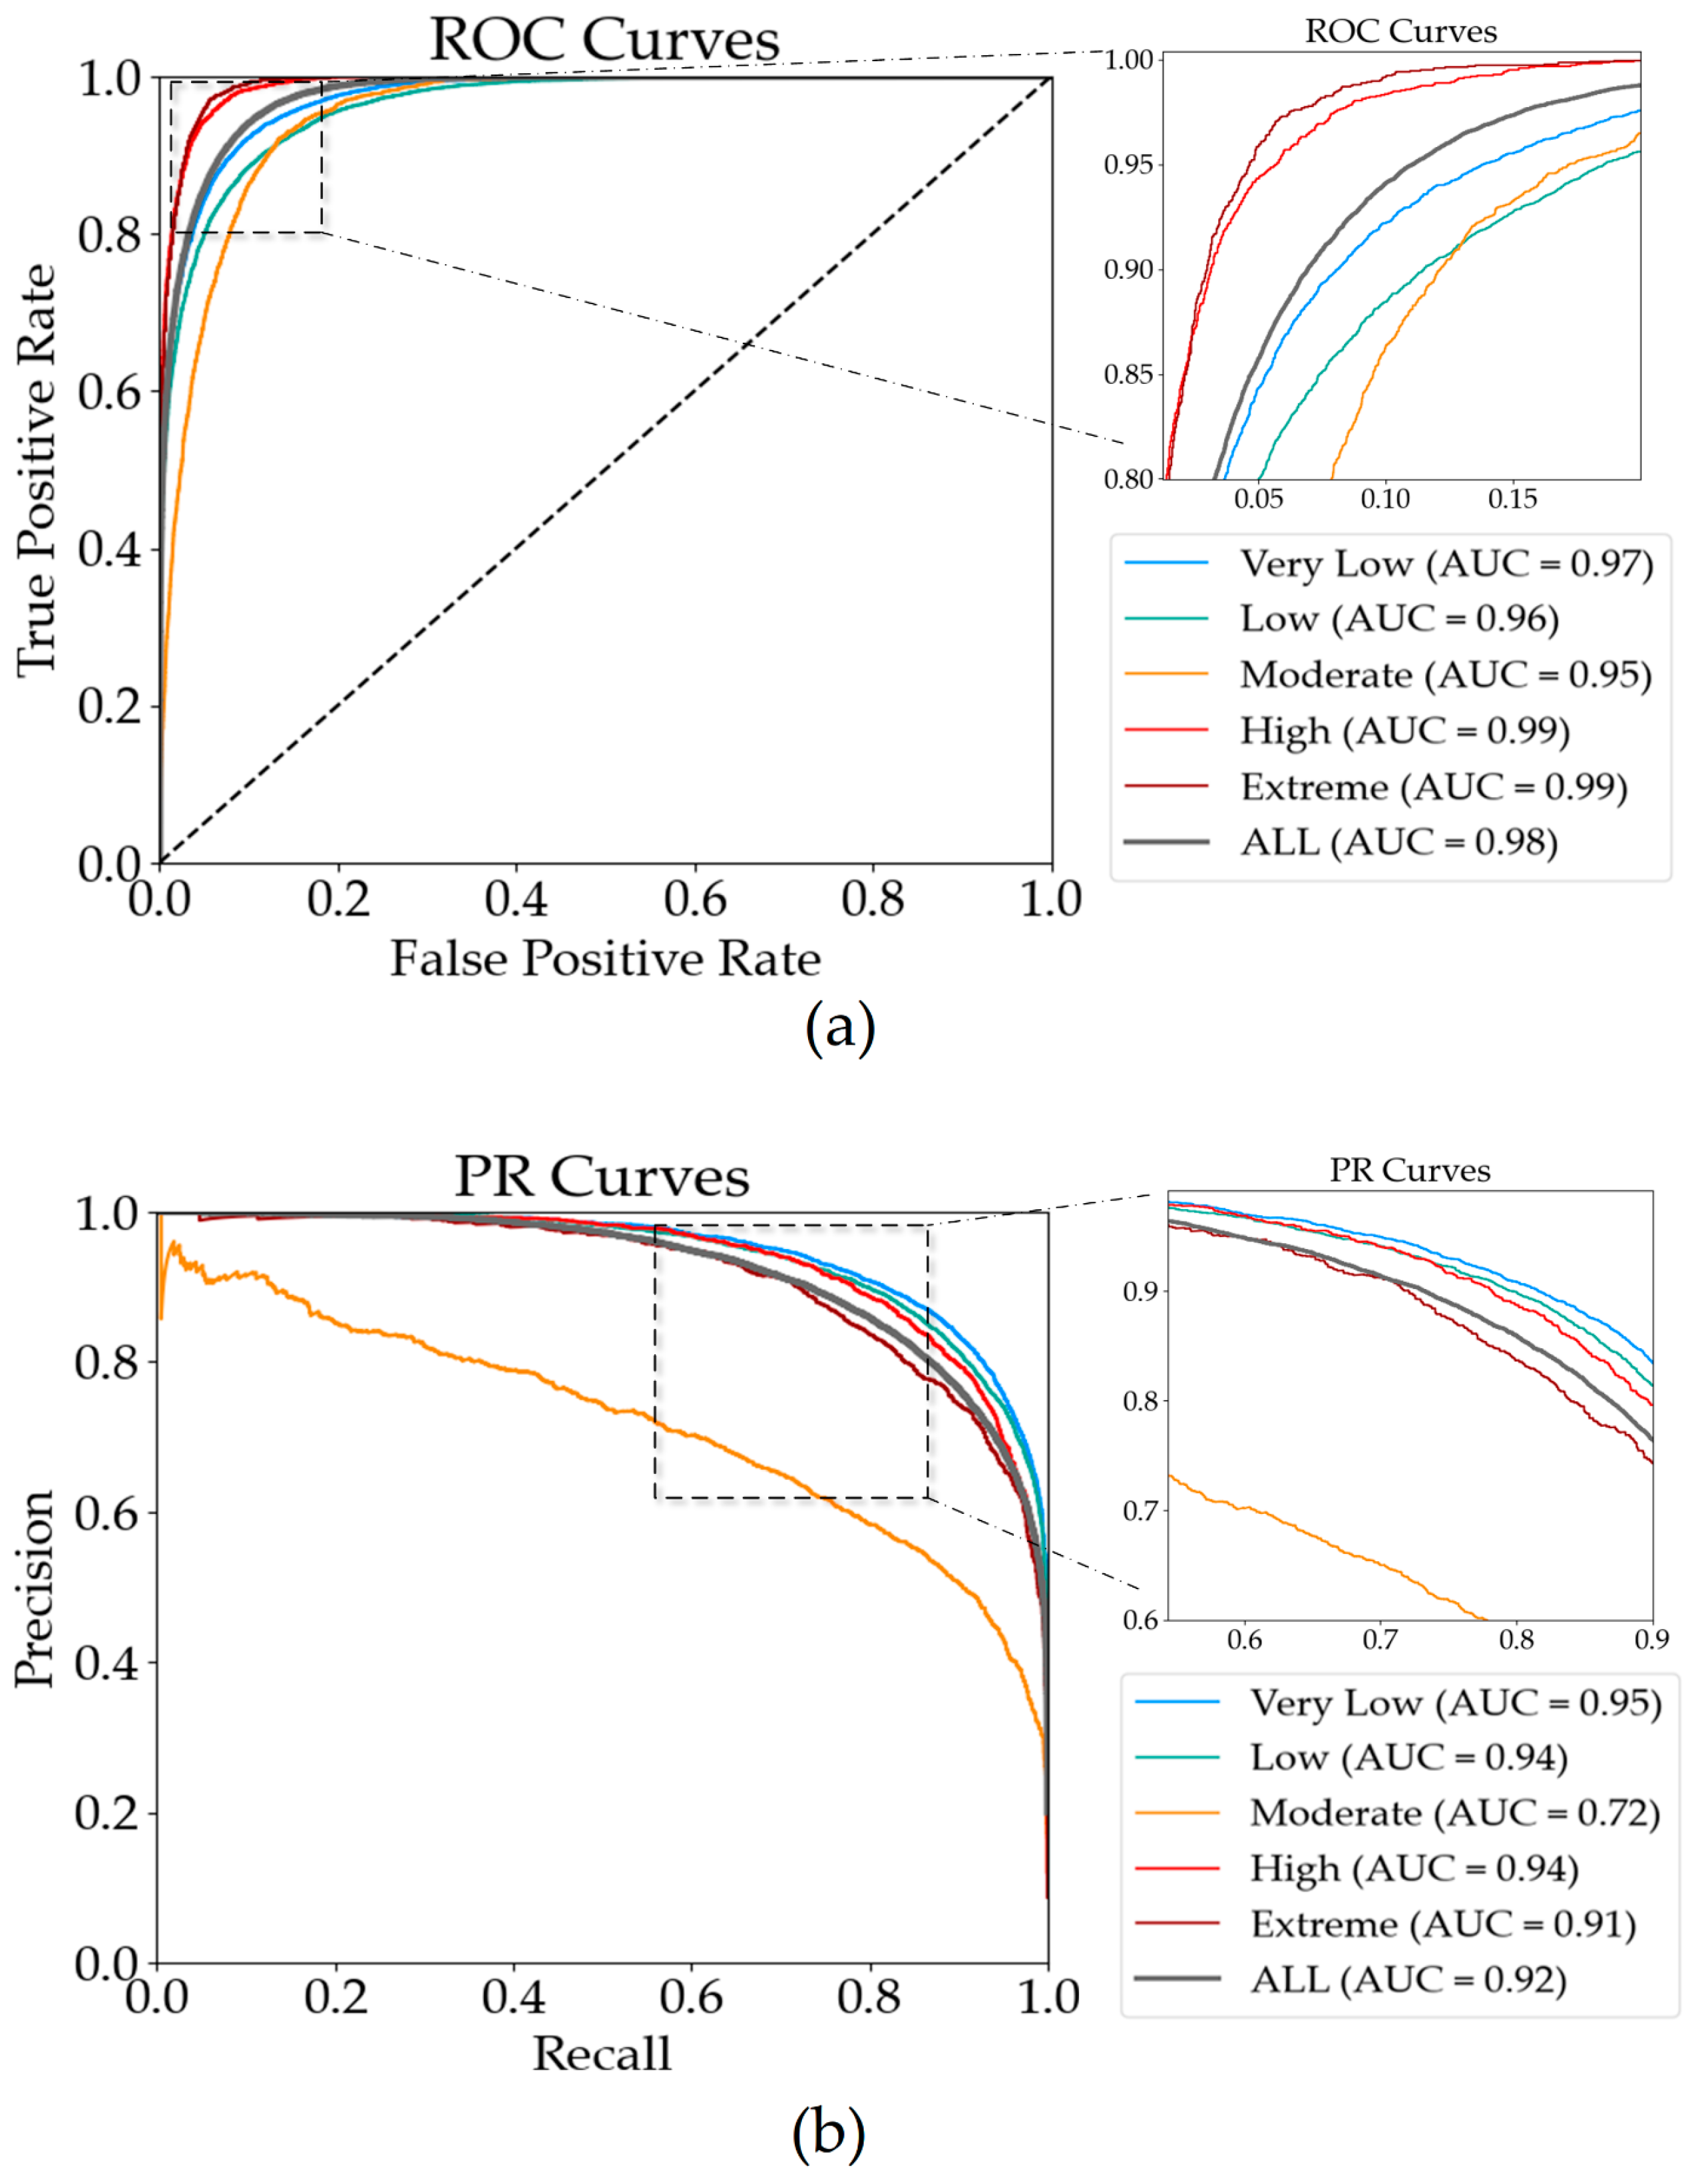
3.2. Comprehensive Study of SESMTML

Table 4 shows the predictive performance of SESMTML for forest fire danger. Overall, the model achieved an accuracy (OA) of 83.18%, a precision of 83.05%, a recall of 83.18%, and an F1 score of 83.10%, demonstrating its strong capability in predicting forest fire danger using remote sensing images. Notably, the prediction results in the Low category exhibited the highest performance, with an accuracy of 86.39%, precision of 84.95%, recall of 86.39%, and an F1 score of 85.67%. This suggests that SESMTML is particularly effective in identifying areas with low fire danger, providing reliable predictions for this category.
On the other hand, the model’s performance in the Moderate category is relatively weaker, with an accuracy of 63.43%, precision of 68.29%, recall of 63.43%, and an F1 score of 65.77%. This lower performance may be attributed to several factors. Firstly, the Moderate category has a smaller sample size (2557 instances), which might limit the model’s ability to learn distinguishing features effectively during training. Additionally, the characteristics of the Moderate category likely overlap significantly with those of the Low and High categories, resulting in a blurred boundary that complicates the model’s classification task, leading to frequent misclassifications.
Despite these challenges, SESMTML showed commendable performance in the High category, achieving an accuracy of 85.27%, precision of 84.24%, recall of 85.27%, and an F1 score of 84.76%. This indicates the model’s robustness and reliability in predicting high-danger fire areas, which is crucial for early warning and prevention measures. Similarly, the model performed well in the Extreme category, with an accuracy of 83.28%, precision of 80.78%, recall of 83.29%, and an F1 score of 82.02%. These results suggest that SESMTML can effectively identify extremely high-danger fire areas, further highlighting its potential utility in scenarios requiring urgent and precise fire danger assessments. Overall, SESMTML provides a promising approach to forest fire danger prediction, with particularly strong performance in the Very Low, Low, High, and Extreme categories.
To evaluate SESMTML’s ability to predict forest fire danger, we visualized several assessment metrics, as shown in Figure 10. The performance curves for each category continue to demonstrate the strong predictive capabilities of SESMTML. In the ROC plot (Figure 10a), the model’s combined performance is outstanding, with area under the curve (AUC) values of 0.97 for the Very Low category, 0.96 for the Low category, 0.95 for the Moderate category, 0.99 for the High category, and 0.99 for the Extreme category, along with a combined AUC value of 0.98. These high AUC values indicate that the model is highly effective at distinguishing between different fire danger categories, particularly in more severe categories such as High and Extreme.
In the PR plot (Figure 10b), the model also performs well, particularly in the Very Low and High categories, with AUC values of 0.95 and 0.94, respectively, showing high precision and recall in these areas. The Low category has an AUC of 0.94, which is on par with the High category, indicating that the model maintains a strong performance across these different levels of fire danger. However, the Moderate category shows a significantly lower AUC value of 0.72, suggesting that the model’s capability to correctly identify instances in this category is weaker, leading to a higher rate of misclassification. The Extreme category, with an AUC of 0.91 in the PR curve, also indicates strong model performance but shows slightly reduced precision and recall compared to the High category.
Figure 11 shows SESMTML’s precision–confidence curve, accuracy–confidence curve, F1–confidence curve, and recall–confidence curve under different confidence thresholds. The results show that all categories except the Moderate category demonstrate excellent performance.

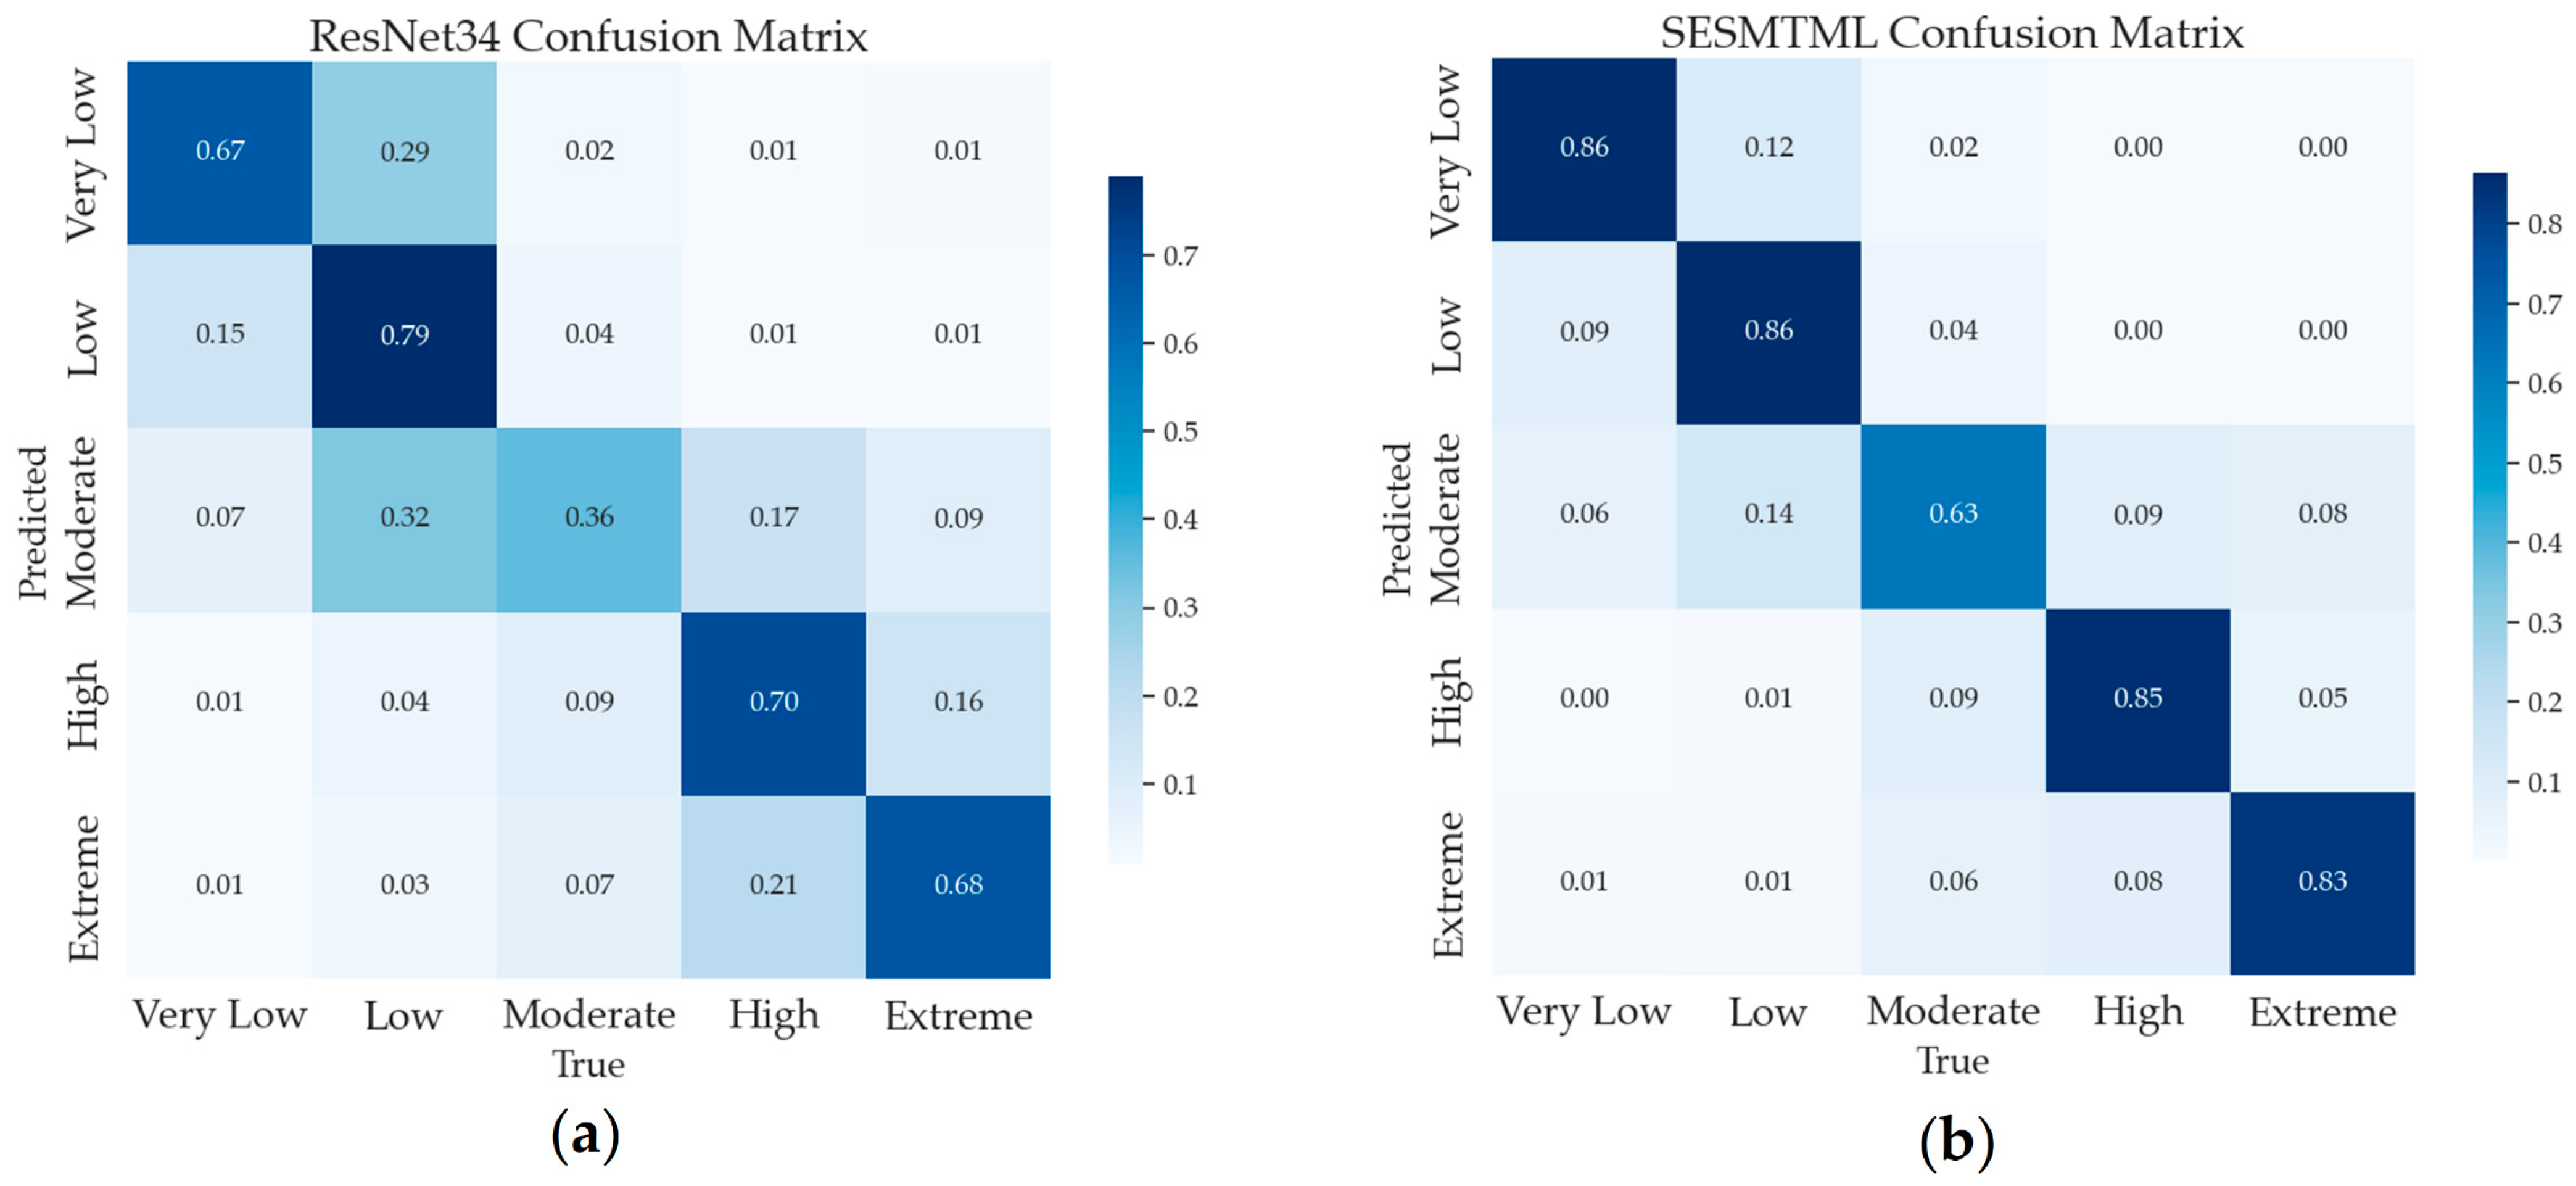
3.3. Comparisons of Other Model

The confusion matrices of SESMTML and pre-optimization ResNet34 at their respective best performances are shown in Figure 12. From the visual comparison, it is clear that SESMTML outperforms the original ResNet34 across all fire danger categories. Specifically, the accuracy of SESMTML in the Very Low and High categories is 86% and 85%, respectively, significantly higher than the original’s 67% and 70%. Similarly, SESMTML’s predictive accuracy for the Low and Extreme categories improves to 86% and 83%, respectively, compared to ResNet34’s 79% and 68%. Moreover, SESMTML demonstrates a notable improvement in the Moderate category, achieving an accuracy of 63%, which is significantly higher than the 36% accuracy achieved by ResNet34. This indicates a substantial reduction in the misclassification rate for this category, highlighting SESMTML’s stronger generalization and classification performance. As a result, SESMTML substantially outperforms the ResNet34 model in terms of integrated prediction ability and robustness for the task of forest fire danger prediction based on remote sensing images, which indicates its greater potential for application in fire danger early prediction systems.
In addition, we selected ResNet34, VGG16 [84], DenseNet-121 [85], ConvNext [86], MobileNetV2 [87], EfficientNetV2 [88], and Swin-Transformer [89] as the comparative models to fully evaluate the performance of proposed squeeze-excitation spatial multi-scale transformer learning (SESMTML). These models cover classical and modern convolutional neural networks, lightweight convolutional neural networks, and visual Transformer models, and the detailed results are shown in Table 5. SESMTML demonstrates superior performance compared to various popular deep learning models, significantly outperforming the other models with an overall accuracy (OA) of 83.18%, which represents a notable improvement over the pre-improvement model. In comparison, the other models showed lower performance levels. For example, while MobileNetV2 achieved a relatively high OA of 75.19% among the tested models, it still falls significantly short of SESMTML’s performance. Similarly, DenseNet-121, known for its deep convolutional architecture, achieved an OA of 72.09%, but there remains a considerable gap compared to SESMTML. Furthermore, Swin-Transformer, based on the visual Transformer architecture, exhibited an even lower OA of 68.53%. Overall, by integrating the strengths of CNN and Transformer architectures, SESMTML not only surpasses the other models in accuracy, precision (83.05%), recall (83.18%), and F1 score (83.10%) but also maintains a moderate parameter count (30.08 M). This balance between performance and model complexity highlights its effectiveness and applicability in the forest fire danger prediction task.

3.4. Ablation Study

For the sake of analyzing how much the proposed modules in SESMTML contribute to the overall performance, we conducted six sets of ablation experiments. As described in Section 3, SESMTML consists of four modules including multi-scale depth feature extraction module (MDFEM), multi-Scale fire danger perception module (MFDPM), multi-scale information aggregation module (MIAM), and fire danger level fusion module (FDLFM). MDFEM is used to extract global and convolutional features, MFDPM is used to mine contextual information, MIAM aggregates multi-level features, and FDLFM focuses on fusing global and aggregated features, and generating classification results. First, we will analyze the effect of MDFEM, i.e., using DSConvBlock to replace the original BasicBlock of the backbone network. Secondly, given that FDLFM has a key classification function, we choose to treat it as an invariant and thus focus on analyzing the effectiveness and contribution of the three modules: MDFEM, MFDPM, and MIAM. The experiments were conducted by successively adding each improvement module, and the results are shown in Table 6.
It can be observed that each module has different positive contributions in enhancing the model performance, especially the MFDPM module, which plays a key role in improving the accuracy. Firstly, without any additional modules, the base model exhibits the weakest performance, and the introduction of DSConvBlock to replace the original BasicBlock of the backbone network effectively enhances the feature extraction, improving the model’s base performance. Secondly, the introduction of the MFDPM module results in a significant performance gain, bringing OA up to 79.44%. This improvement directly confirms the critical role of contextual information in the deep understanding of the semantic content of remote sensing images. The MFDPM module captures the associations between objects in the images and enhances the model’s understanding of the spatial layout of remote sensing images with forest fire danger, leading to more accurate predictions. Thirdly, the inclusion of MIAM; although the performance improvement due to the inclusion of MIAM is relatively small, it also shows that aggregating different levels of features enhances the discriminative power of the feature representation and helps the model to understand the image details more comprehensively. Finally, the performance was optimal when all modules were integrated into the model, suggesting that although each module individually contributes differently, the synergistic effect they create together is key to achieving optimal model performance.

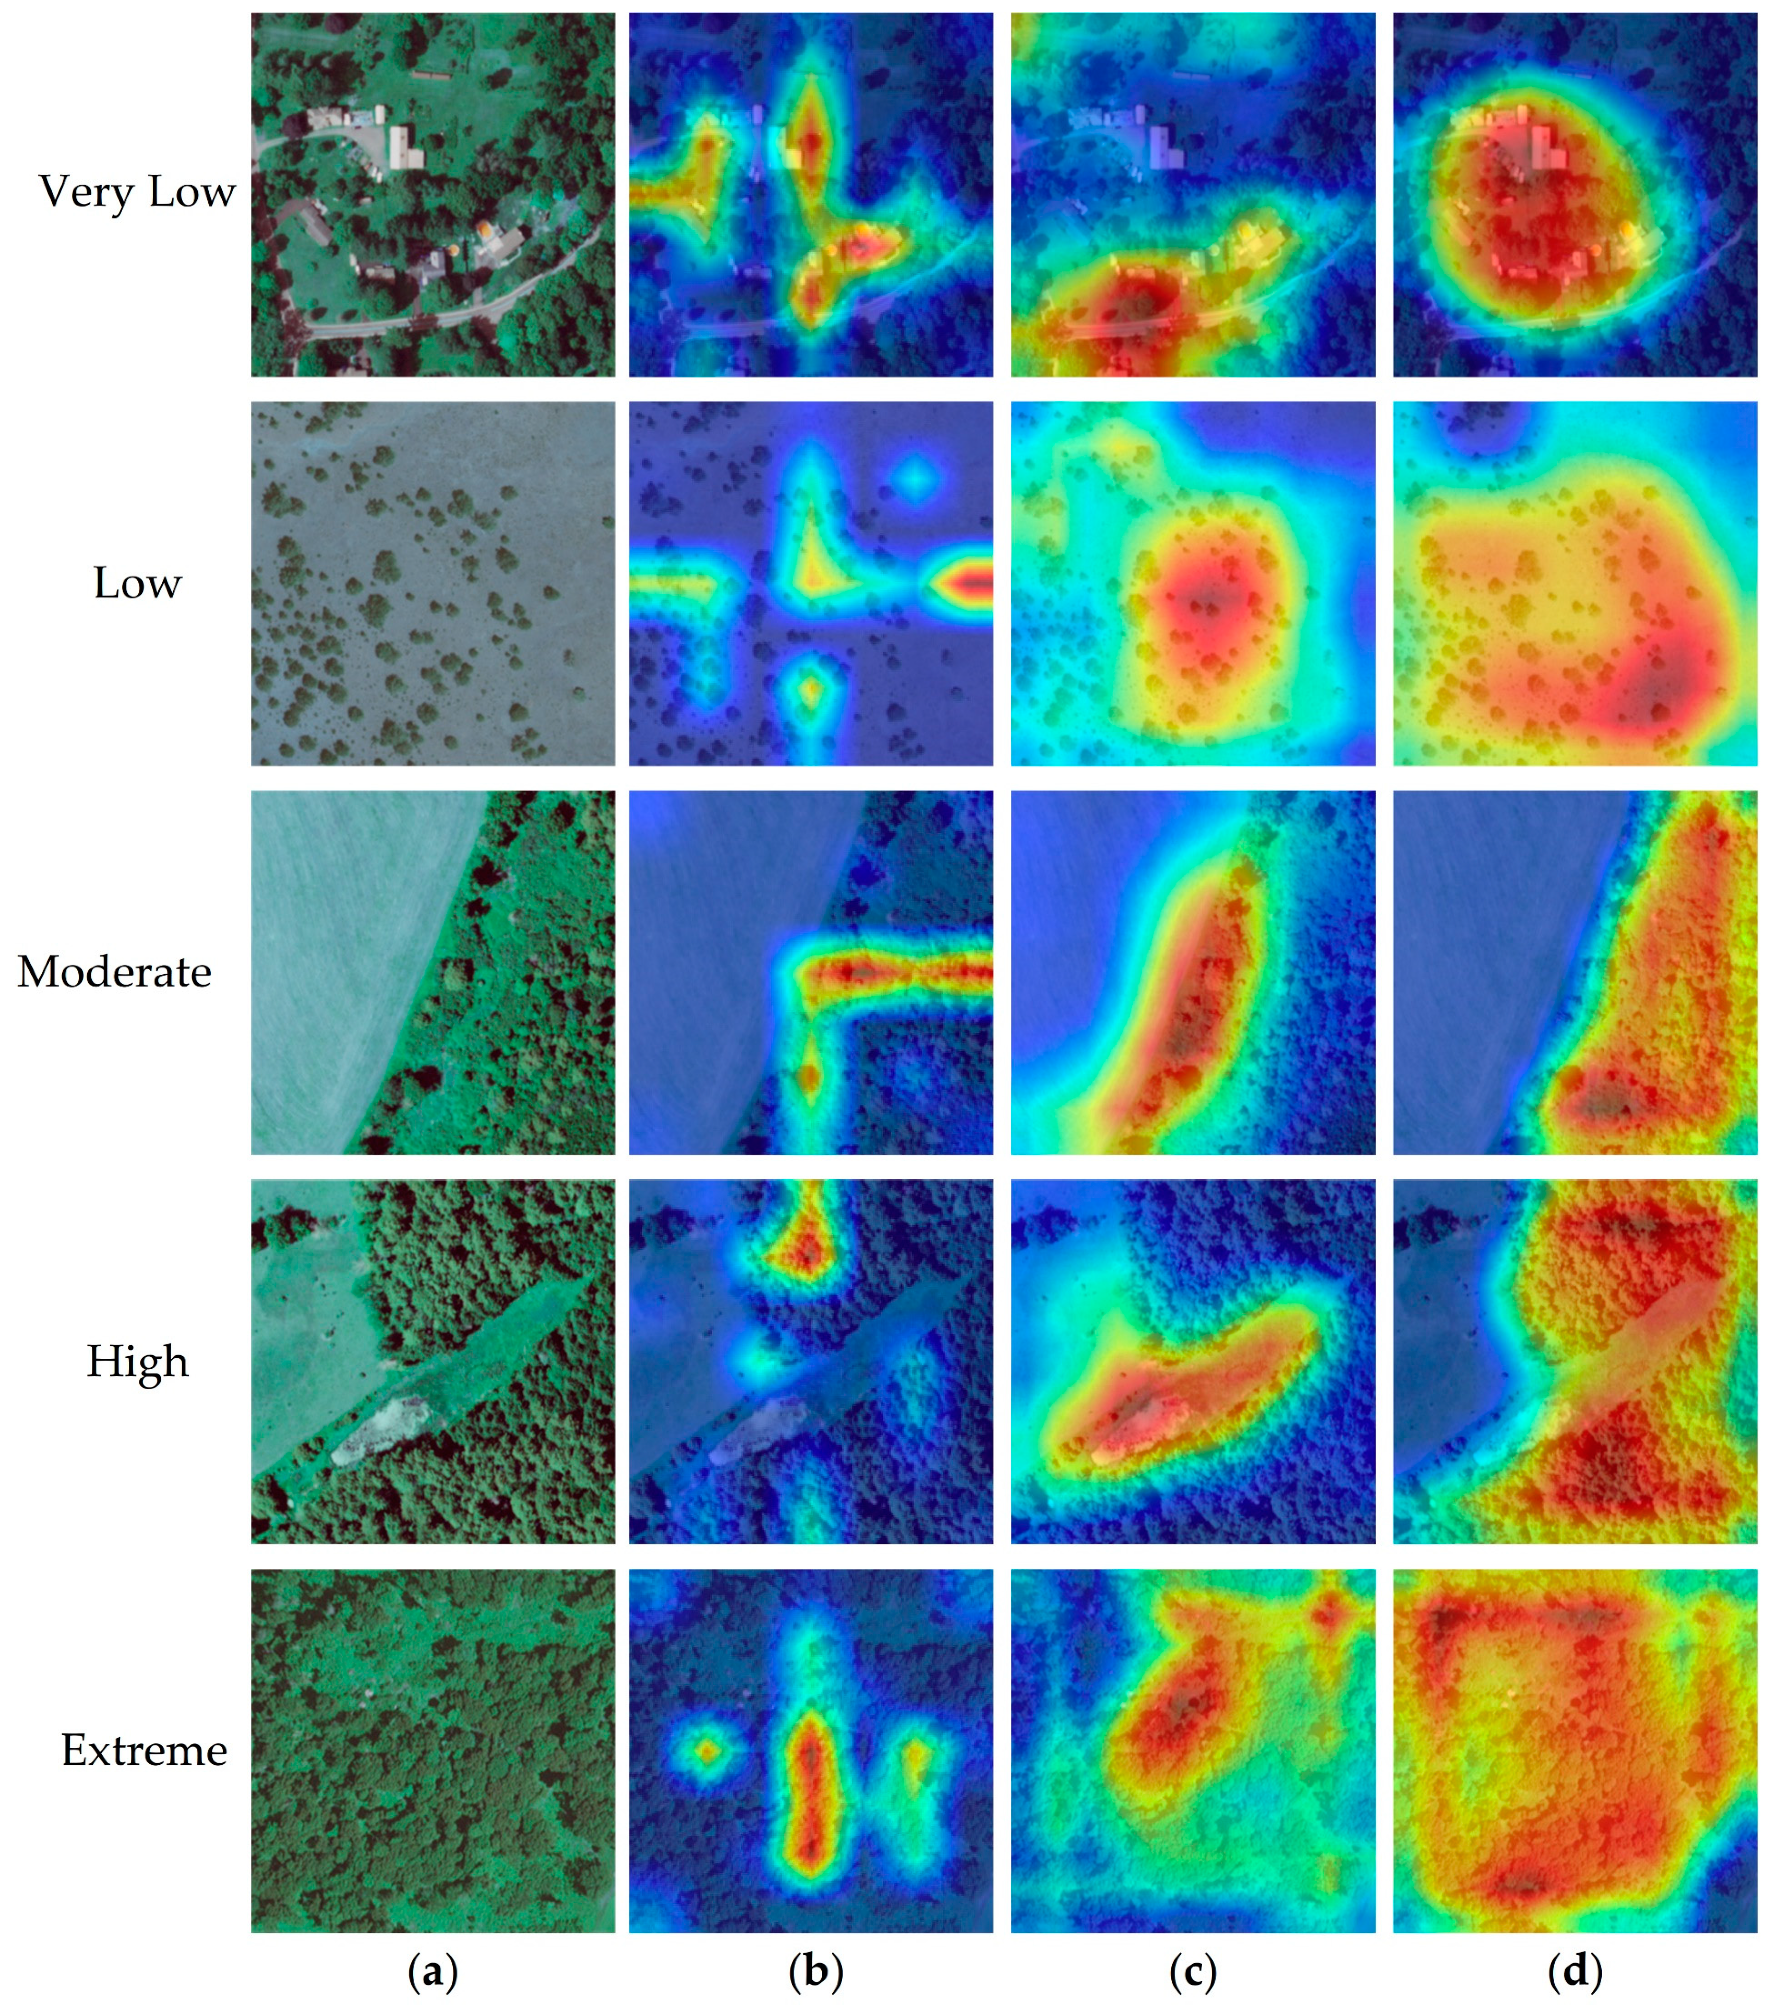
3.5. Visual Analysis

To comprehensively evaluate SESMTML’s decision-making process, assess the re-liability and robustness, identify potential weaknesses or biases, and provide a visual explanation of model predictions across various fire danger levels, this study conducted a detailed comparative analysis using remote sensing images from the FireRisk dataset, which includes five distinct forest fire danger categories. We utilized Grad-CAM [90] to generate heat maps for these fire danger classes, visualizing the prediction differences among the models. Swin-Transformer, ResNet34, and SESMTML were selected for this purpose, allowing us to observe and compare their focus areas and prediction accuracy for each danger category. The specific results of this analysis are presented in Figure 13.
In the Very low category, Swin-Transformer presents a dispersed heatmap activation pattern focusing on buildings and vegetation, demonstrating its ability to recognize but lacking focus. In contrast, ResNet34’s heatmap has a more concentrated activation near roads and buildings, showing greater confidence in identifying very low areas, although it is less sensitive to surrounding vegetation. SESMTML, on the other hand, covers buildings and their surroundings with strong, highly concentrated activation, highlighting its accurate identification and definition of very low features. In the Low category, Swin-Transformer’s heatmap shows broad, non-concentrated activation in vegetation areas. This indicates that the model can identify low-danger zones but is not localized precisely enough. ResNet34 has more concentrated activation on specific vegetation patches, reflecting a more accurate identification of low-danger features. SESMTML has the highest and most concentrated activation within vegetation areas, highlighting its precise identification and definition of low-danger features. In the Moderate category, Swin-Transformer shows scattered activations in dense vegetation areas, revealing its ability to identify moderate-danger features but focusing on a range of too wide areas. ResNet34 shows more explicit and concentrated activations in the same areas, reflecting better localization accuracy. SESMTML shows the most focused activations in high-density vegetation areas, reflecting its highly accurate identification of moderate-danger features. In the High category, Swin-Transformer shows extensive activation in dense vegetation areas, indicating that the model can identify high-danger features, but the activation area is widely distributed. ResNet34 has concentrated activation in this area, showing its excellent localization accuracy. SESMTML produces the strongest and most concentrated activation in the densest vegetation areas, proving its accurate grasp and high accuracy in identifying high-danger features. In the Extreme category, Swin-Transformer’s heatmap indicates a scattered activation pattern across various dense vegetation regions, showing its ability to detect extreme danger zones, but with less specificity. ResNet34 shows a more targeted activation in the core areas of extreme danger, demonstrating a higher localization capability. SESMTML, however, provides the most intense and concentrated activation, clearly highlighting the extreme danger zones with high accuracy and focus, indicating its superior capability in identifying features contributing to the highest fire danger. Overall, SESMTML shows the highest feature-focusing ability and accuracy in all danger classes and can highlight the areas contributing to forest fire danger factors, showing high potential for application.

3.6. Fire Danger Zoning Map of Study Area

To construct a high-quality dataset suitable for SESMTML training, we used the Google Earth [91] platform to download high-resolution remote sensing images of the study area in 2023 with a spatial resolution of 1 m × 1 m. The remote sensing image size of the whole study area is 25,600 × 25,600 pixels. According to the processing requirements of the model, the large-scale image was uniformly divided into small image blocks of 320 × 320 pixels. A total of 6400 image samples were obtained. Each image block was used to predict the danger of forest fires. Figure 14a presents the land cover map of the study area, which was derived from the Esri Land Cover 2050-Country [92] dataset. This map categorizes the land into various types, including mostly cropland, grassland, scrub or shrub, deciduous forest, needleleaf/evergreen forest, artificial surfaces or urban areas, and surface water. This classification is crucial for understanding the vegetation distribution and other land characteristics that may influence fire danger. After predictions using SESMTML, we generated a forest fire danger zoning map for the test study area, as shown in Figure 14b.
The map adopts five different codes to represent the five levels of fire danger in specific zones: Very low, Low, Moderate, High, and Extreme, which achieves an accurate classification and visual display of fire danger at different locations in the study area. In the Very Low zone, which accounts for 29.86% of the samples (1911 samples), SESMTML performs well, successfully identifying very low feature areas such as buildings and water bodies, effectively eliminating non-fire danger factors, and demonstrating its ability to predict forest fire danger in non-forested areas. Conversely, in Low areas, which represent the largest proportion of the dataset at 36.97% (2366 samples), the prediction results of SESMTML were mainly concentrated in areas with low vegetation cover or adjacent to water bodies, which aligns with the actual fire danger assessment criteria. Low vegetation density and geographic proximity to water sources both naturally reduce the probability of fire occurrence, and this predictive trend of the model is consistent with reality. Meanwhile, in Moderate areas, which constitute a smaller portion of the dataset at 2.25% (144 samples), the locations identified by the model are typically relatively vegetated areas but have not reached extreme drought conditions, such as valleys and slopes. These areas have more vegetation, but their fire danger is relatively low due to higher soil moisture or proximity to water sources. The model’s ability to accurately differentiate between these moderate-danger areas avoids over-warning and ensures effective monitoring of potential danger.
Most notably, in High areas, which account for 29.89% of the samples (1913 samples), SESMTML performed particularly well. It can accurately identify areas with highly dense vegetation, dry climate, and locations far from water sources, which are the high-danger zones for frequent forest fires. The prediction results of the model closely match the actual geographic and climatic conditions, showing its efficiency and accuracy in identifying high-danger areas, which is of great value for early warning of forest fires and resource deployment. Additionally, SESMTML also identifies Extreme areas, which make up 1.03% of the samples (66 samples). These areas, characterized by extreme conditions such as dense vegetation and severe dryness, are critical for fire management and require urgent attention. The model’s ability to accurately pinpoint these zones demonstrates its robustness and precision in extreme fire danger prediction.
In summary, SESMTML shows excellent performance in forest fire danger prediction. Whether it is in the accurate identification of very low-danger areas, the reasonable judgment of low-danger areas, the detailed differentiation of moderate-danger areas, or the efficient identification of high-danger and extreme-danger areas, the model exhibits a high level of predictive ability and practicality. This performance indirectly verifies its generalization and robustness in cross-regional forest fire danger prediction under complex environments.

4. Discussion

4.1. Comparison of Key Findings with Previous Studies

In this section, we discuss the key findings of this study in relation to previous research on forest fire danger prediction.
Unlike traditional methods, SESMTML introduces several advancements in predicting forest fire danger. Deterministic methods provide detailed, high-resolution predictions but are limited by their dependence on accurate input data and their inability to account for variability in real-world conditions [17]. Deterministic/probabilistic methods attempt to address this by incorporating uncertainties, allowing for multiple potential outcomes. However, these methods still rely on predefined scenarios and may not fully capture the dynamic nature of fire behavior across diverse landscapes [18,19,20]. Empirical methods use historical data to establish predictive relationships, but their effectiveness is constrained by the quality of past data, which may not accurately reflect current or future conditions [21,22,23,24]. Physical-based methods offer comprehensive simulations based on the laws of physics but require significant computational resources and detailed inputs, which limits their feasibility for large-scale, real-time applications [25,26]. In contrast, SESMTML leverages deep learning and remote sensing technologies to dynamically analyze and predict fire danger, providing a more adaptable, scalable, and accurate approach that addresses many of the limitations inherent in traditional methods.
While SESMTML excels in many areas, statistic-based methods provide a foundational understanding of fire danger by identifying correlations between fire occurrences and environmental variables [26,27,28,29,30,31]. However, these methods have several limitations. They often suffer from poor learning ability, weak fault tolerance, and difficulties in handling errors, which can lead to inaccurate predictions when faced with new or complex scenarios. While statistical methods can quickly establish patterns from historical data [33,34], they are less effective in adapting to dynamic and evolving fire conditions, particularly in regions with limited historical records or changing environmental factors. Additionally, their reliance on predefined variables and expert input may restrict their flexibility and scalability in real-time applications. In contrast, SESMTML leverages advanced deep learning techniques and high-resolution remote sensing imagery to overcome these limitations. By automatically extracting and analyzing multi-scale features, SESMTML provides more accurate and adaptive predictions of forest fire danger across diverse landscapes and conditions.
Compared to machine learning methods, SESMTML demonstrates enhanced predictive capabilities for forest fire danger by effectively modeling the intricate relationships between various environmental factors and fire occurrences [37,38]. While machine learning methods offer improved accuracy and flexibility over traditional statistical approaches, they still have certain limitations. Machine learning models often require extensive datasets for training, which may not always be available or might be incomplete, leading to potential biases in predictions [43,44,45]. Additionally, although methods such as Random Forests [40], Support Vector Machines (SVMs) [41], and Gradient Boosting Decision Trees (GBDTs) [42] can handle a variety of data types and capture complex patterns, they may struggle with the high dimensionality and multi-scale nature of remote sensing data. In contrast, SESMTML integrates the strengths of machine learning with advanced deep learning architectures and remote sensing technologies, allowing it to automatically extract and analyze relevant features from high-resolution images. This approach not only improves accuracy but also enhances adaptability and scalability in predicting fire danger across various landscapes and environmental conditions.
Like SESMTML, other deep learning-based methods utilize advanced neural network architectures to capture the complex spatial and temporal patterns associated with forest fire danger, providing a robust framework for analyzing fire danger. These methods have significantly improved the accuracy of fire predictions by effectively extracting multimodal features and understanding their interrelationships, which are crucial for accurately assessing fire danger [47,48]. However, SESMTML effectively overcomes certain limitations that are common in other deep learning models. First, SESMTML distinguishes itself by incorporating feature extraction techniques from the field of computer vision into forest fire danger prediction, thereby expanding the traditional boundaries of fire prediction models. This innovative approach allows SESMTML to capture multi-scale and multi-level features from remote sensing images more effectively, identifying subtle indicators of fire danger that might be overlooked by other models, resulting in more accurate danger assessments. Second, SESMTML uses remote sensing imagery as the primary data source, simplifying the fire prediction process and effectively overcoming the spatial and temporal limitations that hinder traditional models. While other models often use remote sensing images merely as supplementary data [59,60,61,62,63], SESMTML fully leverages the advantages of remote sensing—such as extensive spatial coverage, high resolution, and frequent updates—to provide more flexible and precise assessments of fire danger across large areas, enhancing the speed and accuracy of predictions. Moreover, SESMTML combines the strengths of both convolutional neural networks (CNNs) and Transformers, taking advantage of each model’s ability to handle different aspects of remote sensing data. CNNs are particularly effective at extracting local features, while Transformers excel at capturing global information and intricate spatial relationships. Other models typically rely on a single deep learning architecture [51,52,53,54,55,56], failing to integrate recent advancements in deep learning that could enhance their ability to process the rich and varied information in remote sensing images. By merging these two approaches, SESMTML significantly boosts its feature extraction capabilities and overall predictive performance, enabling it to better address the complexities and variability inherent in forest fire danger.

4.2. Limitations and Future Perspectivess

Despite SESMTML’s robust performance in forest fire danger prediction based on remote sensing images, several limitations must be acknowledged, which present opportunities for further investigation.
  • Performance on moderate-danger categories: A key limitation of SESMTML is its relatively lower predictive accuracy for the moderate fire danger category. This could be attributed to data imbalance, where the smaller sample size for moderate-danger images may have restricted the model’s learning capacity. Additionally, the overlap in feature characteristics between different fire danger categories might have contributed to misclassification. Future work could focus on addressing these issues through advanced data augmentation techniques or by integrating cost-sensitive learning approaches to enhance the model’s predictive consistency across all danger categories.
  • Generalizability across regions: SESMTML’s generalizability across diverse geographic regions and environmental conditions remains to be rigorously validated. Although promising results were achieved in the selected study areas, the model’s applicability to other regions characterized by varying climatic conditions, vegetation types, or topographic features has yet to be comprehensively assessed. Future studies should aim to extend the model’s testing and refinement across different environments to establish its universal applicability.
  • Computational complexity: Despite the integration of multiple deep learning modules, SESMTML’s computational complexity could pose challenges for real-time deployment, particularly in resource-constrained settings. Future work could investigate the development of more lightweight model variants or the application of model compression techniques to reduce computational overhead while preserving high predictive performance.
  • Model interpretability: Similar to many deep learning models, SESMTML tends to be less interpretable than traditional statistical methods, making it difficult to understand the underlying reasons for its predictions. This lack of transparency can impede trust and limit its practical application in decision-making processes. Future research could focus on enhancing model interpretability by incorporating explainable AI techniques. These techniques could provide clearer insights into the factors driving the model’s predictions, thereby facilitating more informed decision-making in forest fire management.

5. Conclusions

In this paper, we introduce the squeeze-excitation spatial multi-scale transformer learning (SESMTML), a multi-step deep learning algorithm designed for enhanced forest fire danger prediction using remote sensing images. SESMTML achieves an overall accuracy of 83.18% based on extensive experimental results on the FireRisk dataset, significantly outperforming several state-of-the-art deep learning models. Additionally, forest fire danger prediction maps were generated using large data rasters for a test study area located at the border of the Miyun and Pinggu districts in Beijing, demonstrating relatively strong overall prediction performance within these image rasters. These findings broaden the future direction of forest fire prediction based on remote sensing images and hold significant value for enhancing predictive capabilities in this domain.
SESMTML effectively integrates CNN and Transformer architectures, allowing the model to more efficiently extract local and global features from high-resolution remote sensing imagery. This dual approach enables a comprehensive analysis of the spatial patterns contributing to fire danger, improving the model’s ability to predict fire danger levels and addressing the limitations of previous methods regarding the temporal and spatial requirements of data sources. SESMTML’s innovative structure enhances its robustness and accuracy, particularly in identifying high-danger fire areas.
However, while SESMTML demonstrated strong performance in the studied area, its generalizability to other regions with different climatic conditions, vegetation types, or topographic features has yet to be verified. Future research should, therefore, focus on testing and refining the model in diverse environments to determine its broader applicability. To further enhance the effectiveness of SESMTML, future studies could explore advanced data augmentation techniques and cost-sensitive learning methods to address data imbalances and improve performance in the moderate hazard category. Additionally, developing lightweight model variants or applying model compression techniques could reduce computational complexity, making the model more suitable for real-time applications in resource-constrained environments. Finally, there is a need to enhance the interpretability of SESMTML by incorporating interpretable artificial intelligence techniques that provide clearer insights into the factors influencing its predictions. These improvements will help expand the model’s applicability and utility across various environmental contexts, ensuring it remains a valuable tool for forest fire danger prediction and management.

Author Contributions

Conceptualization, J.Y.; methodology, J.Y.; software, J.Y.; validation, J.Y., S.W. and X.M.; formal analysis, J.Y.; investigation, J.Y., S.W. and X.M.; resources, J.Y.; data curation, J.Y.; writing—original draft preparation, J.Y., S.W. and X.M.; writing—review and editing, J.Y., S.W., X.M. and H.J.; visualization, J.Y.; supervision, J.Y.; project administration, J.Y.; funding acquisition, H.J. All authors have read and agreed to the published version of the manuscript.

Funding

This research was funded by the Graduate Research and Practice Projects of Minzu University of China, grant No. SJCX2024015.

Data Availability Statement

The raw data supporting the conclusions of this article will be made available by the authors on request.

Acknowledgments

We would like to express our sincere gratitude to the Key Laboratory of Ethnic Language Intelligent Analysis and Security Governance of MOE for their generous support.

Conflicts of Interest

The authors declare no conflicts of interest.

References

  1. Carta, F.; Zidda, C.; Putzu, M.; Loru, D.; Anedda, M.; Giusto, D. Advancements in forest fire prevention: A comprehensive survey. Sensors 2023, 23, 6635. [Google Scholar] [CrossRef] [PubMed]
  2. Saleh, A.; Zulkifley, M.A.; Harun, H.H.; Gaudreault, F.; Davison, I.; Spraggon, M. Forest fire surveillance systems: A review of deep learning methods. Heliyon 2024, 10, 23127. [Google Scholar] [CrossRef] [PubMed]
  3. Barmpoutis, P.; Papaioannou, P.; Dimitropoulos, K.; Grammalidis, N. A review on early forest fire detection systems using optical remote sensing. Sensors 2020, 20, 6442. [Google Scholar] [CrossRef]
  4. Wu, X.; Zhang, G.; Yang, S.; Tan, Y.; Yang, Z.; Pang, Z. Machine learning for predicting forest fire occurrence in Changsha: An innovative investigation into the introduction of a forest fuel factor. Remote Sens. 2023, 15, 4208. [Google Scholar] [CrossRef]
  5. Meng, Q.; Huai, Y.; You, J.; Nie, X. Visualization of 3D forest fire spread based on the coupling of multiple weather factors. Comput. Graph. 2023, 110, 58–68. [Google Scholar] [CrossRef]
  6. Sevinç, V. Mapping the forest fire risk zones using artificial intelligence with risk factors data. Environ. Sci. Pollut. Res. 2023, 30, 4721–4732. [Google Scholar] [CrossRef]
  7. Das, J.; Mahato, S.; Joshi, P.K.; Liou, Y.A. Forest fire susceptibility zonation in Eastern India using statistical and weighted modelling approaches. Remote Sens. 2023, 15, 1340. [Google Scholar] [CrossRef]
  8. Stocks, B.J.; Lynham, T.J.; Lawson, B.D.; Alexander, M.E.; Wagner, C.V.; McAlpine, R.S.; Dube, D.E. Canadian forest fire danger rating system: An overview. For. Chron. 1989, 65, 258–265. [Google Scholar] [CrossRef]
  9. Mölders, N. Comparison of Canadian forest fire danger rating system and national fire danger rating system fire indices derived from Weather Research and Forecasting (WRF) model data for the June 2005 Interior Alaska wildfires. Atmos. Res. 2010, 95, 290–306. [Google Scholar] [CrossRef]
  10. Hanes, C.C.; Wotton, M.; Bourgeau-Chavez, L.; Woolford, D.G.; Bélair, S.; Martell, D.; Flannigan, M.D. Evaluation of new methods for drought estimation in the Canadian Forest Fire Danger Rating System. Int. J. Wildland Fire 2023, 32, 836–853. [Google Scholar] [CrossRef]
  11. Deeming, J.E.; Burgan, R.E.; Cohen, J.D. The National Fire-Danger Rating System, 1978; US Department of Agriculture, Forest Service, Intermountain Forest and Range Experiment Station: Ogden, UT, USA, 1977; Volume 39, pp. 1–16. [Google Scholar]
  12. Andrews, P.L.; Bradshaw, L.S. FIRES: Fire Information Retrieval and Evaluation System: A Program for Fire Danger Rating Analysis; U.S. Department of Agriculture, Forest Service, Intermountain Research Station: Missoula, MT, USA, 1997; Volume 367, pp. 1–10. [Google Scholar]
  13. San-Miguel-Ayanz, J.; Barbosa, P.M.; Schmuck, G.; Libertà, G.; Meyer-Roux, J. The European forest fire information system (EFFIS). In Proceedings of the Joint Workshop of Earsel SIG and GOFC/GOLD: Innovative Concepts and Methods in Fire Danger Estimation, Ghent, Belgium, 5–7 June 2003; pp. 183–187. [Google Scholar]
  14. San-Miguel-Ayanz, J.; Barbosa, P.; Liberta, G.; Schmuck, G.; Schulte, E.; Bucella, P. The European forest fire information system: A European strategy towards forest fire management. In Proceedings of the 3rd International Wildland Fire Conference, Sydney, Australia, 3–6 October 2003; pp. 1–12. [Google Scholar]
  15. Loupian, E.A.; Bartalev, S.A.; Ershov, D.V.; Kotel’nikov, R.V.; Balashov, I.V.; Bourtsev, M.A.; Egorov, V.A.; Efremov, V.Y.; Zharko, V.O.; Kovganko, K.A.; et al. Satellite data processing management in Forest Fires Remote Monitoring Information System (ISDM-Rosleskhoz) of the Federal Agency for Forestry. Sovr. Probl. Distantsionnogo Zondirovaniya Zemli Iz Kosmosa 2015, 12, 222–250. [Google Scholar]
  16. Kotel’Nikov, R.V.; Lupyan, E.A.; Bartalev, S.A.; Ershov, D.V. Space monitoring of forest fires: History of the creation and development of ISDM-Rosleskhoz. Contemp. Probl. Ecol. 2020, 13, 795–802. [Google Scholar] [CrossRef]
  17. Baranovskiy, N.V.; Vyatkina, V.A.; Chernyshov, A.M. Deterministic–Probabilistic Prediction of Forest Fires from Lightning Activity Taking into Account Aerosol Emissions. Atmosphere 2022, 14, 29. [Google Scholar] [CrossRef]
  18. Baranovskiy, N.V. (Ed.) Forest Fire Danger Prediction Using Deterministic-Probabilistic Approach; IGI Global: Hershey, PA, USA, 2021; Volume 4, pp. 54–60. [Google Scholar]
  19. Baranovskiy, N.V. Predicting Forest Fire Numbers Using Deterministic-Probabilistic Approach. In Predicting, Monitoring, and Assessing Forest Fire Dangers and Risks; IGI Global: Hershey, PA, USA, 2020; pp. 89–100. [Google Scholar]
  20. Baranovskiy, N. Deterministic-Probabilistic Approach to Predict Lightning-Caused Forest Fires in Mounting Areas. Forecasting 2021, 3, 695–715. [Google Scholar] [CrossRef]
  21. Eden, J.M.; Krikken, F.; Drobyshev, I. An Empirical Prediction Approach for Seasonal Fire Risk in the Boreal Forests. Int. J. Climatol. 2020, 40, 2732–2744. [Google Scholar] [CrossRef]
  22. O’Connor, C.D.; Calkin, D.E.; Thompson, M.P. An Empirical Machine Learning Method for Predicting Potential Fire Control Locations for Pre-Fire Planning and Operational Fire Management. Int. J. Wildland Fire 2017, 26, 587–597. [Google Scholar] [CrossRef]
  23. Anderson, W.R.; Cruz, M.G.; Fernandes, P.M.; McCaw, L.; Vega, J.A.; Bradstock, R.A.; Fogarty, L.; Gould, J.; McCarthy, G.; Marsden-Smedley, J.B.; et al. A generic, empirical-based model for predicting rate of fire spread in shrublands. Int. J. Wildland Fire 2015, 24, 443–460. [Google Scholar] [CrossRef]
  24. Cruz, M.G.; Gould, J.S.; Alexander, M.E.; Sullivan, A.L.; McCaw, W.L.; Matthews, S. Empirical-based models for predicting head-fire rate of spread in Australian fuel types. Aust. For. 2015, 78, 118–158. [Google Scholar] [CrossRef]
  25. Koo, E.; Pagni, P.; Woycheese, J.; Stephens, S.; Weise, D.; Huff, J. A simple physical model for forest fire spread rate. Fire Saf. Sci. 2005, 8, 851–862. [Google Scholar] [CrossRef]
  26. Bodrožić, L.; Marasović, J.; Stipaničev, D. Fire Modeling in Forest Fire Management. In Proceedings of the CEEPUS Spring School, Kielce, Poland, 29 August–11 September 2005; pp. 1–6. [Google Scholar]
  27. Taylor, S.W.; Woolford, D.G.; Dean, C.B.; Martell, D.L. Wildfire Prediction to Inform Fire Management: Statistical Science Challenges. Stat. Sci. 2013, 28, 586–615. [Google Scholar] [CrossRef]
  28. Bianchini, G.; Caymes-Scutari, P.; Méndez-Garabetti, M. Evolutionary-Statistical System: A parallel method for improving forest fire spread prediction. J. Comput. Sci. 2015, 6, 58–66. [Google Scholar] [CrossRef]
  29. Han, J.G.; Ryu, K.H.; Chi, K.H.; Yeon, Y.K. Statistics based predictive geo-spatial data mining: Forest fire hazardous area mapping application. In Proceedings of the Web Technologies and Applications: 5th Asia-Pacific Web Conference, APWeb 2003, Xian, China, 23–25 April 2003; pp. 370–381. [Google Scholar]
  30. Bianchini, G. Wildland Fire Prediction Based on Statistical Analysis of Multiple Solutions; Universitat Autònoma de Barcelona: Barcelona, Spain, 2006. [Google Scholar]
  31. de Santana, R.O.; Delgado, R.C.; Schiavetti, A. Modeling susceptibility to forest fires in the Central Corridor of the Atlantic Forest using the frequency ratio method. J. Environ. Manag. 2021, 296, 113343. [Google Scholar] [CrossRef] [PubMed]
  32. Hong, H.; Jaafari, A.; Zenner, E.K. Predicting spatial patterns of wildfire susceptibility in the Huichang County, China: An integrated model to analysis of landscape indicators. Ecol. Indic. 2019, 101, 878–891. [Google Scholar] [CrossRef]
  33. Sivrikaya, F.; Küçük, Ö. Modeling forest fire risk based on GIS-based analytical hierarchy process and statistical analysis in Mediterranean region. Ecol. Inform. 2022, 68, 101537. [Google Scholar] [CrossRef]
  34. Parajuli, A.; Manzoor, S.A.; Lukac, M. Areas of the Terai Arc landscape in Nepal at risk of forest fire identified by fuzzy analytic hierarchy process. Environ. Dev. 2023, 45, 100810. [Google Scholar] [CrossRef]
  35. Si, L.; Shu, L.; Wang, M.; Zhao, F.; Chen, F.; Li, W.; Li, W. Study on forest fire danger prediction in plateau mountainous forest area. Nat. Hazards Res. 2022, 2, 25–32. [Google Scholar] [CrossRef]
  36. Hong, H.; Naghibi, S.A.; Moradi Dashtpagerdi, M.; Pourghasemi, H.R.; Chen, W. A comparative assessment between linear and quadratic discriminant analyses (LDA-QDA) with frequency ratio and weights-of-evidence models for forest fire susceptibility mapping in China. Arab. J. Geosci. 2017, 10, 167. [Google Scholar] [CrossRef]
  37. Arif, M.; Alghamdi, K.K.; Sahel, S.A.; Alosaimi, S.O.; Alsahaft, M.E.; Alharthi, M.A.; Arif, M. Role of machine learning algorithms in forest fire management: A literature review. J. Robot. Autom. 2021, 5, 212–226. [Google Scholar]
  38. Yang, S.; Lupascu, M.; Meel, K.S. Predicting forest fire using remote sensing data and machine learning. In Proceedings of the AAAI Conference on Artificial Intelligence, Menlo Park, CA, USA, 2–9 February 2021. [Google Scholar]
  39. Soualah, L.; Bouzekri, A.; Chenchouni, H. Hoping the best, expecting the worst: Forecasting forest fire risk in Algeria using fuzzy logic and GIS. Trees For. People 2024, 17, 100614. [Google Scholar] [CrossRef]
  40. Gao, C.; Lin, H.; Hu, H. Forest-fire-risk prediction based on random forest and backpropagation neural network of Heihe area in Heilongjiang province, China. Forests 2023, 14, 170. [Google Scholar] [CrossRef]
  41. Tan, C.; Feng, Z. Mapping forest fire risk zones using machine learning algorithms in Hunan province, China. Sustainability 2023, 15, 6292. [Google Scholar] [CrossRef]
  42. Shao, Y.; Feng, Z.; Sun, L.; Yang, X.; Li, Y.; Xu, B.; Chen, Y. Mapping China’s forest fire risks with machine learning. Forests 2022, 13, 856. [Google Scholar] [CrossRef]
  43. Pourghasemi, H.R.; Gayen, A.; Lasaponara, R.; Tiefenbacher, J.P. Application of learning vector quantization and different machine learning techniques to assessing forest fire influence factors and spatial modelling. Environ. Res. 2020, 184, 109321. [Google Scholar] [CrossRef]
  44. Shmuel, A.; Heifetz, E. Global wildfire susceptibility mapping based on machine learning models. Forests 2022, 13, 1050. [Google Scholar] [CrossRef]
  45. Singh, S.S.; Jeganathan, C. Using ensemble machine learning algorithm to predict forest fire occurrence probability in Madhya Pradesh and Chhattisgarh, India. Adv. Space Res. 2024, 73, 2969–2987. [Google Scholar] [CrossRef]
  46. Ge, X.; Yang, Y.; Peng, L.; Chen, L.; Li, W.; Zhang, W.; Chen, J. Spatio-temporal knowledge graph based forest fire prediction with multi source heterogeneous data. Remote Sens. 2022, 14, 3496. [Google Scholar] [CrossRef]
  47. Khennou, F.; Ghaoui, J.; Akhloufi, M.A. Forest fire spread prediction using deep learning. In Proceedings of the Geospatial Informatics XI, Online, FL, USA, 12–17 April 2021. [Google Scholar]
  48. Yandouzi, M.; Grari, M.; Idrissi, I.; Moussaoui, O.; Azizi, M.; Ghoumid, K.; Elmiad, A.K. Review on forest fires detection and prediction using deep learning and drones. J. Theor. Appl. Inf. Technol. 2022, 100, 4565–4576. [Google Scholar]
  49. Omar, N.; Al-Zebari, A.; Sengur, A. Deep learning approach to predict forest fires using meteorological measurements. In Proceedings of the 2021 2nd International Informatics and Software Engineering Conference (IISEC), Ankara, Turkey, 16–17 December 2021. [Google Scholar]
  50. Shao, Y.; Wang, Z.; Feng, Z.; Sun, L.; Yang, X.; Zheng, J.; Ma, T. Assessment of China’s forest fire occurrence with deep learning, geographic information and multisource data. J. For. Res. 2023, 34, 963–976. [Google Scholar] [CrossRef]
  51. Zheng, S.; Gao, P.; Wang, W.; Zou, X. A highly accurate forest fire prediction model based on an improved dynamic convolutional neural network. Appl. Sci. 2022, 12, 6721. [Google Scholar] [CrossRef]
  52. Miao, X.; Li, J.; Mu, Y.; He, C.; Ma, Y.; Chen, J.; Wei, W.; Gao, D. Time Series Forest Fire Prediction Based on Improved Transformer. Forests 2023, 14, 1596. [Google Scholar] [CrossRef]
  53. Hodges, J.L.; Lattimer, B.Y. Wildland fire spread modeling using convolutional neural networks. Fire Technol. 2019, 55, 2115–2142. [Google Scholar] [CrossRef]
  54. Lin, X.; Li, Z.; Chen, W.; Sun, X.; Gao, D. Forest fire prediction based on long-and short-term time-series network. Forests 2023, 14, 778. [Google Scholar] [CrossRef]
  55. Lai, C.; Zeng, S.; Guo, W.; Liu, X.; Li, Y.; Liao, B. Forest fire prediction with imbalanced data using a deep neural network method. Forests 2022, 13, 1129. [Google Scholar] [CrossRef]
  56. Ananthi, J.; Sengottaiyan, N.; Anbukaruppusamy, S.; Upreti, K.; Dubey, A.K. Forest fire prediction using IoT and deep learning. Int. J. Adv. Technol. Eng. Explor. 2022, 9, 246–256. [Google Scholar]
  57. McCarthy, N.F.; Tohidi, A.; Aziz, Y.; Dennie, M.; Valero, M.M.; Hu, N. A deep learning approach to downscale geostationary satellite images for decision support in high impact wildfires. Forests 2021, 12, 294. [Google Scholar] [CrossRef]
  58. Xu, C.; Zhu, G.; Shu, J. A combination of lie group machine learning and deep learning for remote sensing scene classification using multi-layer heterogeneous feature extraction and fusion. Remote Sens. 2022, 14, 1445. [Google Scholar] [CrossRef]
  59. Cheng, W.; Feng, Y.; Song, L.; Wang, X. DMF2Net: Dynamic multi-level feature fusion network for heterogeneous remote sensing image change detection. Knowl. Based Syst. 2024, 300, 112159. [Google Scholar] [CrossRef]
  60. Wang, D.; Zhang, C.; Han, M. MLFC-net: A multi-level feature combination attention model for remote sensing scene classification. Comput. Geosci. 2022, 160, 105042. [Google Scholar] [CrossRef]
  61. Fassnacht, F.E.; White, J.C.; Wulder, M.A.; Næsset, E. Remote sensing in forestry: Current challenges, considerations and directions. For. Int. J. For. Res. 2024, 97, 11–37. [Google Scholar] [CrossRef]
  62. Tavakol Sadrabadi, M.; Innocente, M.S. Vegetation cover type classification using cartographic data for prediction of wildfire behaviour. Fire 2023, 6, 76. [Google Scholar] [CrossRef]
  63. Vaswani, A.; Shazeer, N.; Parmar, N.; Uszkoreit, J.; Jones, L.; Gomez, A.N.; Kaiser, L.; Polosukhin, I. Attention is all you need. In Proceedings of the Advances in Neural Information Processing Systems 30 (NIPS 2017), Long Beach, CA, USA, 4–6 December 2017. [Google Scholar]
  64. Lin, T.; Wang, Y.; Liu, X.; Qiu, X. A survey of transformers. AI Open 2022, 3, 111–132. [Google Scholar] [CrossRef]
  65. Shen, S.; Seneviratne, S.; Wanyan, X.; Kirley, M. Firerisk: A remote sensing dataset for fire risk assessment with benchmarks using supervised and self-supervised learning. In Proceedings of the 2023 International Conference on Digital Image Computing: Techniques and Applications (DICTA), Gold Coast, Australia, 29 November–1 December 2023. [Google Scholar]
  66. Guo, Y.; Li, Y.; Wang, L.; Rosing, T. Depthwise convolution is all you need for learning multiple visual domains. In Proceedings of the AAAI Conference on Artificial Intelligence, Vancouver, BC, Canada, 20–27 February 2024. [Google Scholar]
  67. Chollet, F. Xception: Deep learning with depthwise separable convolutions. In Proceedings of the IEEE Conference on Computer Vision and Pattern Recognition, Honolulu, HI, USA, 21–26 July 2017. [Google Scholar]
  68. He, K.; Zhang, X.; Ren, S.; Sun, J. Deep residual learning for image recognition. In Proceedings of the IEEE Conference on Computer Vision and Pattern Recognition, Las Vegas, NV, USA, 26 June–1 July 2016. [Google Scholar]
  69. Woo, S.; Park, J.; Lee, J.Y.; Kweon, I.S. CBAM: Convolutional block attention module. In Proceedings of the European Conference on Computer Vision (ECCV), Munich, Germany, 8–14 September 2018. [Google Scholar]
  70. Hu, J.; Shen, L.; Sun, G. Squeeze-and-excitation networks. In Proceedings of the IEEE Conference on Computer Vision and Pattern Recognition, Salt Lake City, UT, USA, 18–22 June 2018; pp. 7132–7141. [Google Scholar]
  71. Zheng, J.; Sun, G.; Li, W.; Yu, X.; Zhang, C.; Gong, Y.; Tu, L. Impacts of land use change and climate variations on annual inflow into the Miyun Reservoir, Beijing, China. Hydrol. Earth Syst. Sci. 2016, 20, 1561–1572. [Google Scholar] [CrossRef]
  72. Fu, L.; Zhao, D.; Wu, B.; Xu, Z.; Zeng, Y. Variations in forest aboveground biomass in Miyun Reservoir of Beijing over the past two decades. J. Soils Sediments 2017, 17, 2080–2090. [Google Scholar] [CrossRef]
  73. Wang, X.; Gong, W.; Huang, X.; Liu, T.; Zhou, Y.; Li, H. Assessment of eco-environmental quality on land use and land cover changes using remote sensing and GIS: A case study of Miyun county. Nat. Environ. Pollut. Technol. 2018, 17, 739–746. [Google Scholar]
  74. Xie, S.; Liu, L.; Zhang, X.; Yang, L. Mapping the annual dynamics of land cover in Beijing from 2001 to 2020 using Landsat dense time series stack. ISPRS J. Photogramm. Remote Sens. 2022, 185, 201–218. [Google Scholar] [CrossRef]
  75. Sun, T.; Wu, J.; Xiao, C.; Teng, W. Effect of different types of vegetations on soil and water conservation in the Miyun Reservoir buffer zone. J. Nat. Resour. 2009, 24, 1146–1154. [Google Scholar]
  76. Cheng, L.; Zhang, Y.; Sun, H. Vegetation cover change and relative contributions of associated driving factors in the ecological conservation and development zone of Beijing, China. Pol. J. Environ. Stud. 2020, 29, 53–65. [Google Scholar] [CrossRef] [PubMed]
  77. Li, X.; Jia, B.; Zhang, W.; Ma, J.; Liu, X. Woody plant diversity spatial patterns and the effects of urbanization in Beijing, China. Urban For. Urban Green. 2020, 56, 126873. [Google Scholar] [CrossRef]
  78. Chen, Y.; Dai, X.; Liu, M.; Chen, D.; Yuan, L.; Liu, Z. Dynamic convolution: Attention over convolution kernels. In Proceedings of the IEEE/CVF Conference on Computer Vision and Pattern Recognition, Seattle, WA, USA, 14–19 June 2020; pp. 11027–11036. [Google Scholar]
  79. Maxwell, A.E.; Warner, T.A.; Vanderbilt, B.C.; Ramezan, C.A. Land cover classification and feature extraction from national agriculture images program (NAIP) orthoimages: A review. Photogramm. Eng. Remote Sens. 2017, 83, 737–747. [Google Scholar] [CrossRef]
  80. Dillon, G.K.; Menakis, J.; Fay, F. Wildland fire potential: A tool for assessing wildfire risk and fuels management needs. In Proceedings of the Large Wildland Fires Conference, Missoula, MT, USA, 19–23 May 2014; pp. 60–76. [Google Scholar]
  81. Paszke, A.; Gross, S.; Massa, F.; Lerer, A.; Bradbury, J.; Chanan, G.; Killeen, T.; Lin, Z.; Gimelshein, N.; Antiga, L.; et al. Pytorch: An imperative style, high-performance deep learning library. In Proceedings of the Advances in Neural Information Processing Systems, Vancouver, BC, Canada, 8–14 December 2019. [Google Scholar]
  82. Deng, J.; Dong, W.; Socher, R.; Li, L.J.; Li, K.; Fei-Fei, L. ImageNet: A large-scale hierarchical image database. In Proceedings of the 2009 IEEE Conference on Computer Vision and Pattern Recognition, Miami Beach, FL, USA, 20–21 June 2009; pp. 248–255. [Google Scholar]
  83. Kingma, D.P.; Ba, J. Adam: A method for stochastic optimization. arXiv 2014, arXiv:1412.6980. [Google Scholar]
  84. Simonyan, K.; Zisserman, A. Very deep convolutional networks for large-scale image recognition. arXiv 2014, arXiv:1409.1556. [Google Scholar]
  85. Huang, G.; Liu, Z.; Van Der Maaten, L.; Weinberger, K.Q. Densely connected convolutional networks. In Proceedings of the IEEE Conference on Computer Vision and Pattern Recognition, Honolulu, HI, USA, 21–26 July 2017; pp. 4700–4708. [Google Scholar]
  86. Liu, Z.; Mao, H.; Wu, C.Y.; Feichtenhofer, C.; Darrell, T.; Xie, S. A convnet for the 2020s. In Proceedings of the IEEE/CVF Conference on Computer Vision and Pattern Recognition, New Orleans, LA, USA, 18–24 June 2022; pp. 11976–11986. [Google Scholar]
  87. Sandler, M.; Howard, A.; Zhu, M.; Zhmoginov, A.; Chen, L.C. Mobilenetv2: Inverted residuals and linear bottlenecks. In Proceedings of the IEEE Conference on Computer Vision and Pattern Recognition, Salt Lake City, UT, USA, 18–23 June 2018; pp. 4510–4520. [Google Scholar]
  88. Tan, M.; Le, Q. Efficientnetv2: Smaller models and faster training. In Proceedings of the International Conference on Machine Learning, PMLR, Virtual, 18–24 July 2021; pp. 10096–10106. [Google Scholar]
  89. Liu, Z.; Lin, Y.; Cao, Y.; Hu, H.; Wei, Y.; Zhang, Z.; Lin, S.; Guo, B. Swin transformer: Hierarchical vision transformer using shifted windows. In Proceedings of the IEEE/CVF International Conference on Computer Vision, Nashville, TN, USA, 20–25 June 2021; pp. 10012–10022. [Google Scholar]
  90. Selvaraju, R.R.; Cogswell, M.; Das, A.; Vedantam, R.; Parikh, D.; Batra, D. Grad-cam: Visual explanations from deep networks via gradient-based localization. In Proceedings of the IEEE International Conference on Computer Vision, Venice, Italy, 22–29 October 2017; pp. 618–626. [Google Scholar]
  91. Google Earth. Miyun and Pinggu Districts, Beijing, 40°16′24.4″ N 116°59′21.6″ W, Elevation 75m. Available online: https://earth.google.com/web/ (accessed on 1 July 2024).
  92. Esri. “Esri Land Use Land Cover LULC” [Web Map]. Land Cover 2050-Country. 2024. Available online: https://www.arcgis.com/apps/mapviewer/index.html?layers=cfcb7609de5f478eb7666240902d4d3d (accessed on 25 August 2024).
Figure 1. Illustration of study area; (a) represents the geographic location of the study area, and (b) shows remote sensing images of the study area. The red line indicates the boundary between Miyun District and Pinggu District in Beijing.
Forests 15 01581 g001
Figure 2. Images representing Very low forest fire danger classes selected from the FireRisk dataset. (a) Local features: grassland, road, trees, and buildings are highlighted using colored boxes; (b) remote contextual information: yellow arrows illustrate the relationships and interactions between the highlighted local features, providing insights into how the surrounding elements contribute to assessing forest fire danger.
Forests 15 01581 g002
Figure 3. SESMTML network structure, which consists of an MDFEM, a MFDPM, a MIAM, and a FDLFM.
Forests 15 01581 g003
Figure 4. Comparison of the proposed DSConvBlock with ResNet34’s BasicBlock. (a) ResNet34’s original BasicBlock; (b) the designed DSConvBlock.
Forests 15 01581 g004
Figure 5. Convolution mechanism in Conventional CNN and Depthwise Separable CNN. (a) Standard convolution; (b) depthwise separable convolution.
Forests 15 01581 g005
Figure 6. Illustration of the proposed SE-MLP.
Forests 15 01581 g006
Figure 7. Illustration of the proposed SMMSA in MFDPM. (a) Standard MSA; (b) SMMSA.
Forests 15 01581 g007
Figure 8. Spatial attention module.
Forests 15 01581 g008
Figure 9. Example images of the FireRisk dataset representing different forest fire danger levels. (a) Very Low; (b) Low; (c) Moderate; (d) High; (e) Extreme.
Forests 15 01581 g009
Figure 10. ROC and PR Curves with AUC Scores for SESMTML. (a) ROC curves; (b) PR curves.
Forests 15 01581 g010
Figure 11. Confidence–performance curves for SESMTML. (a) Accuracy–confidence curve; (b) precision–confidence curve; (c) recall–confidence curve; (d) F1–confidence curve.
Forests 15 01581 g011
Figure 12. Confusion matrix comparison plot of ResNet34 and SESMTML. (a) Backbone ResNet34; (b) SESMTML.
Forests 15 01581 g012
Figure 13. Comparison of heat maps visualized by different models for different forest fire danger categories. (a) Raw remote sensing images; (b) the heat map for Swin-Transformer; (c) the heat map for ResNet34; (d) the heat map for SESMTML.
Forests 15 01581 g013
Figure 14. Results of forest fire danger prediction in the test study area. (a) Land cover map; (b) fire danger zoning map.
Forests 15 01581 g014
Table 1. FireRisk dataset labelling information.
TypesNumberVery-LowLowModerateHighExtreme
Training49,22115,41217,645596760074190
Testing21,09366047562255725331837
Total70,31422,01625,207852485406027
Table 2. Training hardware configuration.
System ComponentsConfiguration
Operating systemUbuntu 22.04
Programming languagePython 3.10.1
FrameworkPyTorch 2.1.0
CPUIntel(R) Xeon(R) Gold 6430
GPUGeForce RTX 4090(24 GB)
CUDACUDA 12.1
CuDNN10.2
RAM120 GB
Table 3. Training hyperparameters.
Training HyperparametersValue
Batch size128
Epochs50
Image size320
OptimizerAdamw [83]
Optimizer epsilon1 × 10−8
Learning rate schedulercosine
Initial learning rate1 × 10−5
Warmup epochs5
Warmup learning rate1 × 10−6
Learning rate decay rate0.1
Table 4. Performance of the improved model in different danger levels.
ClassInstancesOA
(%)
Precision
(%)
Recall
(%)
F1 Score
(%)
All21,09383.1883.0583.1883.10
Very Low660486.3186.7686.3186.53
Low756286.3984.9586.3985.67
Moderate255763.4368.2963.4365.77
High253385.2784.2485.2784.76
Extreme183783.2880.7883.2982.02
Table 5. Performance comparison of various deep learning models.
MethodOA
(%)
Precision
(%)
Recall
(%)
F1 Score
(%)
Params
(M)
ResNet3467.8664.7063.8863.7221.80
VGG1673.5771.4970.2070.73138.36
DenseNet-12172.0969.9869.3069.577.98
ConvNext67.9664.7163.7164.0988.60
MobileNetV275.1973.4172.6572.993.50
EfficientNetV266.7363.8162.5863.0921.45
Swin-Transformer68.5366.0664.6265.2187.77
SESMTML (Ours)83.1883.0583.1883.1030.08
Table 6. Results of ablation experiments.
ModelMDFEMMFDPMMIAMFDLFMOA
(%)
Precision
(%)
Recall
(%)
F1 Score
(%)
1. base67.8664.7063.8863.72
271.5872.2471.5871.60
373.6773.4473.6773.30
479.4479.3979.4479.36
576.6676.6176.6676.59
6. ours83.1883.0583.1883.10
Note: the “√” symbol corresponds to an improvement in the ordinal structure, the “–” symbol corresponds that the module has not been added.
Disclaimer/Publisher’s Note: The statements, opinions and data contained in all publications are solely those of the individual author(s) and contributor(s) and not of MDPI and/or the editor(s). MDPI and/or the editor(s) disclaim responsibility for any injury to people or property resulting from any ideas, methods, instructions or products referred to in the content.

