

How Natural Regeneration After Severe Disturbance Affects Ecosystem Services Provision of Andean Forest Soils at Contrasting Timescales

 , , , , ,
  , and
, and
Abstract
:1. Introduction
2. Material and Methods
2.1. Study Area Description
2.2. Soil Sampling and Characterization
2.2.1. Physical Trials
2.2.2. Chemical Trials
2.2.3. Molecular Microbiome Analysis
2.3. Statistical Analysis
3. Results and Discussion
3.1. Physical Properties
3.2. Chemical Properties
3.3. Soil Organic C Sequestration (COq→SOC)
3.4. Interactions Among the Analyzed Soil Properties
3.5. Soil Microbial Communities
4. Conclusions
Author Contributions
Funding
Data Availability Statement
Acknowledgments
Conflicts of Interest
Appendix A

References
- Chaplin-Kramer, R.; Neugarten, R.A.; Sharp, R.P.; Collins, P.M.; Polasky, S.; Hole, D.; Schuster, R.; Strimas-Mackey, M.; Mulligan, M.; Brandon, C.; et al. Mapping the planet’s critical natural assets. Nat. Ecol. Evol. 2022, 7, 51–61. [Google Scholar] [CrossRef] [PubMed]
- van Bruggen, A.H.C.; Semenov, A.M. In search of biological indicators for soil health and disease suppression. Appl. Soil Ecol. 2000, 15, 13–24. [Google Scholar] [CrossRef]
- IPCC. Climate Change 2014: Mitigation of Climate Change. Working Group III Contribution to the Fifth Assessment Report of the Intergovernmental Panel on Climate Change; Edenhofer, O., Pichs-Madruga, R., Sokona, Y., Farahani, E., Kadner, S., Seyboth, K., Adler, A., Baum, I., Brunner, S., Eickemeier, P., et al., Eds.; Cambridge University Press: Cambridge, UK; New York, NY, USA, 2014. [Google Scholar]
- Sünnemann, M.; Beugnon, R.; Breitkreuz, C.; Buscot, F.; Cesarz, S.; Jones, A.; Lehmann, A.; Lochner, A.; Orgiazzi, A.; Reitz, T.; et al. Climate change and cropland management compromise soil integrity and multifunctionality. Commun. Earth Environ. 2023, 4, 394. [Google Scholar] [CrossRef]
- Don, A.; Seidel, F.; Leifeld, J.; Kätterer, T.; Martin, M.; Pellerin, S.; Emde, D.; Seitz, D.; Chenu, C. Carbon sequestration in soils and climate change mitigation—Definitions and pitfalls. Glob. Change Biol. 2024, 30, e16983. [Google Scholar] [CrossRef] [PubMed]
- Calvin, K.; Dasgupta, D.; Krinner, G.; Mukherji, A.; Thorne, P.W.; Trisos, C.; Romero, J.; Aldunce, P.; Barrett, K.; Blanco, G.; et al. IPCC, 2023: Climate Change 2023: Synthesis Report. Contribution of Working Groups I, II and III to the Sixth Assessment Report of the Intergovernmental Panel on Climate Change, 1st ed.; Core Writing Team, Lee, H., Romero, J., Eds.; IPCC: Geneva, Switzerland, 2023; Available online: https://www.ipcc.ch/report/ar6/syr/ (accessed on 12 March 2024).
- Ren, S.; Wang, T.; Guenet, B.; Liu, D.; Cao, Y.; Ding, J.; Smith, P.; Piao, S. Projected soil carbon loss with warming in constrained Earth system models. Nat. Commun. 2024, 15, 102. [Google Scholar] [CrossRef] [PubMed]
- Georgiou, K.; Jackson, R.B.; Vindušková, O.; Abramoff, R.Z.; Ahlström, A.; Feng, W.; Harden, J.W.; Pellegrini, A.F.A.; Polley, H.W.; Soong, J.L.; et al. Global stocks and capacity of mineral-associated soil organic carbon. Nat. Commun. 2022, 13, 3797. [Google Scholar] [CrossRef]
- Bramble, D.S.E.; Ulrich, S.; Schöning, I.; Mikutta, R.; Brandt, L.; Poll, C.; Kandeler, E.; Mikutta, C.; Konrad, A.; Siemens, J.; et al. Formation of mineral-associated organic matter in temperate soils is primarily controlled by mineral type and modified by land use and management intensity. Glob. Change Biol. 2024, 30, e17024. [Google Scholar] [CrossRef] [PubMed]
- Bossio, D.A.; Cook-Patton, S.C.; Ellis, P.W.; Fargione, J.; Sanderman, J.; Smith, P.; Wood, S.; Zomer, R.J.; von Unger, M.; Emmer, I.M.; et al. The role of soil carbon in natural climate solutions. Nat. Sustain. 2020, 3, 391–398. [Google Scholar] [CrossRef]
- Pan, Y.; Birdsey, R.A.; Fang, J.; Houghton, R.; Kauppi, P.E.; Kurz, W.A.; Phillips, O.L.; Shvidenko, A.; Lewis, S.L.; Canadell, J.G.; et al. A Large and Persistent Carbon Sink in the World’s Forests. Science 2011, 333, 988–993. [Google Scholar] [CrossRef]
- de Gouvenain, R.C.; Silander, J.A. Temperate Forests. In Reference Module in Life Sciences; Elsevier: Amsterdam, The Netherlands, 2017; p. 9780128096338022000. Available online: https://linkinghub.elsevier.com/retrieve/pii/B9780128096338023104 (accessed on 15 January 2024).
- Mayer, M.; Prescott, C.E.; Abaker, W.E.A.; Augusto, L.; Cécillon, L.; Ferreira, G.W.; James, J.; Jandl, R.; Katzensteiner, K.; Laclau, J.-P.; et al. Tamm Review: Influence of forest management activities on soil organic carbon stocks: A knowledge synthesis. For. Ecol. Manag. 2020, 466, 118127. [Google Scholar] [CrossRef]
- Currie, W.S.; Bergen, K.M. Temperate forest. In Ecosystem Ecology; Jorgenson, S.E., Ed.; Elsevier: Amsterdam, The Netherlands, 2008; pp. 607–626. [Google Scholar]
- McCarragher, S.; Rigg, L.S. Temperate Forest Ecosystems. In The International Encyclopedia of Geography, 1st ed.; Richardson, D., Castree, N., Goodchild, M.F., Kobayashi, A., Liu, W., Marston, R.A., Eds.; Wiley: Hoboken, NJ, USA, 2017; pp. 1–14. Available online: https://onlinelibrary.wiley.com/doi/10.1002/9781118786352.wbieg0508 (accessed on 19 January 2024).
- Amerongen-Madison, J.; Bulmer, C.; Trofymow, T.; Prescott, C.; Wallace, B.; Philpott, T.; Dymond, C.; Fredeen, A. Soil Carbon in Forest Ecosystems: Pools and Processes. Forest Carbon Initiative. 2021. Available online: https://a100.gov.bc.ca/pub/eirs/finishDownloadDocument.do;jsessionid=8F62A9315428CC8F653587E211134F7F?subdocumentId=21641 (accessed on 23 January 2024).
- Sollins, P.; Robertson, G.P.; Uehara, G. Nutrient mobility in variable- and permanent-charge soils. Biogeochemistry 1988, 6, 181–199. [Google Scholar] [CrossRef]
- Blanco-Canqui, H.; Lal, R. Soil and Water Conservation. In Principles of Soil Conservation and Management; Springer: Dordrecht, The Netherlands, 2010; pp. 1–19. Available online: http://link.springer.com/10.1007/978-1-4020-8709-7_1 (accessed on 13 January 2025).
- Juhos, K.; Madarász, B.; Kotroczó, Z.; Béni, Á.; Makádi, M.; Fekete, I. Carbon sequestration of forest soils is reflected by changes in physicochemical soil indicators—A comprehensive discussion of a long-term experiment on a detritus manipulation. Geoderma 2021, 385, 114918. [Google Scholar] [CrossRef]
- Gunina, A.; Kuzyakov, Y. From energy to (soil organic) matter. Glob. Change Biol. 2022, 28, 2169–2182. [Google Scholar] [CrossRef]
- Navarrete, A.A.; Aburto, F.; González-Rocha, G.; Guzmán, C.M.; Schmidt, R.; Scow, K. Anthropogenic degradation alter surface soil biogeochemical pools and microbial communities in an Andean temperate forest. Sci. Total Environ. 2023, 854, 158508. [Google Scholar] [CrossRef] [PubMed]
- Prăvălie, R.; Nita, I.A.; Patriche, C.; Niculiță, M.; Birsan, M.V.; Roșca, B.; Bandoc, G. Global changes in soil organic carbon and implications for land degradation neutrality and climate stability. Envr. Res. 2021, 201, 111580. [Google Scholar] [CrossRef]
- Seydewitz, E.; Mulrennan, M.; García, M. A tale of two trails: Lessons from a comparative account of the Trans Canada Trail and the Sendero de Chile. Can. Geogr./Géogr. Can. 2023, 67, 288–303. [Google Scholar] [CrossRef]
- Keenan, R.J.; Reams, G.A.; Achard, F.; de Freitas, J.V.; Grainger, A.; Lindquist, E. Dynamics of global forest area: Results from the FAO Global Forest Resources Assessment 2015. For. Ecol. Manag. 2015, 352, 9–20. [Google Scholar] [CrossRef]
- Miranda, A.; Altamirano, A.; Cayuela, L.; Lara, A.; González, M. Native forest loss in the Chilean biodiversity hotspot: Revealing the evidence. Reg. Environ. Change 2017, 17, 285–297. [Google Scholar] [CrossRef]
- Mohr Bell, D.; Díaz, G.; Príncipe, R.; González, C.; Bono, J.; Ciuffoli, L.; Strada, M.; Parmuchi, G.; Chomnalez, F.; Montenegro, C.; et al. Monitoreo de la Superficie de Bosque Nativo de la República Argentina, Región Forestal Bosque Andino Patagónico; Tomo I. Esquel; Secretaría de Ambiente y Desarrollo Sustentable de la Nación: Buenos Aires, Argentina, 2019. [Google Scholar]
- CONAF. Superficie de uso de Suelo Regional (Actualizado a Agosto 2017); CONAF: Santiago, Chile, 2021; Available online: https://www.conaf.cl/?s=Superficie+de+uso+de+Suelo+Regional+%28Actualizado+a+Agosto+2017%29 (accessed on 20 February 2024).
- Donoso, P.J.; Promis, A.; Loguercio, G.A.; Beltrán, H.A.; Casseli, M.; Chauchard, L.M.; Cruz, G.; Peñalba, M.G.; Pastur, G.M.; Navarro, C.; et al. Silviculture of South American temperate native forests. N. Z. J. For. Sci. 2022, 52. [Google Scholar] [CrossRef]
- Dube, F.; Sotomayor, A.; Loewe, V.; Müller-Using, B.; Stolpe, N.; Zagal, E.; Doussoulin, M. Silvopastoral Systems in Temperate Zones of Chile. In Silvopastoral Systems in Southern South America; Peri, P.L., Dube, F., Varella, A., Eds.; Advances in Agroforestry; Springer International Publishing: Cham, Switzerland, 2016; Volume 11, pp. 183–211. Available online: https://link.springer.com/chapter/10.1007/978-3-319-24109-8_8 (accessed on 28 January 2024).
- Valle, S.R.; Carrasco, J. Soil quality indicator selection in Chilean volcanic soils formed under temperate and humid conditions. CATENA 2018, 162, 386–395. [Google Scholar] [CrossRef]
- Nanzyo, M. Unique properties of ash volcanic soils. Glob. Environ. Res. 2002, 6, 99–112. [Google Scholar]
- Matus, F.; Rumpel, C.; Neculman, R.; Panichini, M.; Mora, M.L. Soil carbon storage and stabilisation in andic soils: A review. CATENA 2014, 120, 102–110. [Google Scholar] [CrossRef]
- San Martín, P. Reserva de la Biosfera Corredor Biológico Nevados de Chillán—Laguna del Laja: De la amenaza de la extinción al desarrollo sustentable. In Reservas de la Biosfera de Chile: Laboratorios para la Sustentabilidad; Moreira-Muñoz, A., Borsdorf, A., Eds.; Serie Geolibros; Academia de Ciencias Austriaca, Pontificia Universidad Católica de Chile, Instituto de Geografía: Santiago, Chile, 2014; Volume 17, pp. 146–160. [Google Scholar]
- Dube, F. Universidad de Concepción, Concepción, Chile. 2020; manuscript in preparation. [Google Scholar]
- Alfaro, M.; Dube, F.; Zagal, E. Soil quality indicators in an Andisol under different tree covers in disturbed Nothofagus forests. Chil. J. Agric. Res. 2018, 78, 106–116. [Google Scholar] [CrossRef]
- Muñoz, A.A.; González, M.E. Patrones de Regeneración Arbórea en Claros a una Década de la Floración y Muerte Masiva de Chusquea quila (Poaceae) en un Remanente de Bosque Antiguo del valle Central en el Centro-Sur de Chile. Rev. Chil. Hist. Nat. 2009, 82, 185–198. [Google Scholar] [CrossRef]
- United States Department of Agriculture (USDA). Soil Survey Staff: Keys to Soil Taxonomy; USDA: Washington, DC, USA, 2022.
- Stolpe, N. Descripciones de los Principales Suelos de la VIII Región de Chile; Departamento de Suelos y Recursos Naturales, Facultad de Agronomia, Universidad de Concepción: Chillán, Chile, 2006; pp. 17–18. [Google Scholar]
- Blake, G.R.; Hartge, K.H. Particle Density 1. In Methods of Soil Analysis: Part 1—Physical and Mineralogical Methods, 2nd ed.; Klute, A., Ed.; American Society of Agronomy; Soil Science Society of America Inc.: Madison, WI, USA, 1986; pp. 377–382. [Google Scholar]
- Zhang, R. Determination of soil sorptivity and hydraulic conductivity from the disk infiltrometer. Soil Sci. Soc. Am. J. 1997, 61, 1024–1030. [Google Scholar] [CrossRef]
- Zagal, E.; Longeri, L.; Vidal, I.; Hoffman, G.; González, R. Influencia de la Adición de Nitrógeno y Fósforo sobre la Descomposición de Paja de Trigo en un Suelo Derivado de Cenizas Volcánicas. Agric. Téc. 2003, 63, 403–415. [Google Scholar] [CrossRef]
- Kemper, W.D.; Rosenau, R.C. Aggregate Stability and Size Distribution; Klute, A., Ed.; SSSA Book Series; Soil Science Society of America, American Society of Agronomy: Madison, WI, USA, 2018; pp. 425–442. [Google Scholar]
- Sadzawka, A.; Carrasco, M.A.; Grez, R.; Mora, M.L.; Flores, H.; Neaman, A. Métodos de Análisis Recomendados para los Suelos Chilenos; Comisión de Normalización y Acreditación, Sociedad Chilena de la Ciencia del Suelo: Santiago, Chile, 2006; p. 113. [Google Scholar]
- Wright, A.F.; Bailey, J.S. Organic carbon, total carbon, and total nitrogen determinations in soils of variable calcium carbonate contents using a Leco CN-2000 dry combustion analyzer. Commun. Soil Sci. Plant Anal. 2001, 32, 3243–3258. [Google Scholar] [CrossRef]
- Brody, J.R.; Kern, S.E. Sodium boric acid: A Tris-free, cooler conductive medium for DNA electrophoresis. BioTechniques 2004, 36, 214–216. [Google Scholar] [CrossRef]
- Mallott, E.K.; Malhi, R.S.; Amato, K.R. Assessing the Comparability of Different DNA Extraction and Amplification Methods in Gut Microbial Community Profiling. Access Microbiol. 2019, 1, e000060. [Google Scholar] [CrossRef]
- Louca, S.; Parfrey, L.W.; Doebeli, M. Decoupling function and taxonomy in the global ocean microbiome. Science 2016, 353, 1272–1277. [Google Scholar] [CrossRef]
- Põlme, S.; Bahram, M.; Jacquemyn, H.; Kennedy, P.; Kohout, P.; Moora, M.; Oja, J.; Öpik, M.; Pecoraro, L.; Tedersoo, L. Host preference and network properties in biotrophic plant–fungal associations. New Phytol. 2018, 217, 1230–1239. [Google Scholar] [CrossRef] [PubMed]
- Kay, M.; Elkin, L.A.; Higgins, J.J.; Wobbrock, J.O. ARTool: Aligned Rank Transform. [R] Package with Documentation and Two Vignettes; CRAN: Wien, Austria, 2021. [Google Scholar]
- Reynolds, W.D.; Yang, X.M.; Drury, C.F.; Zhang, T.Q.; Tan, C.S. Effects of selected conditioners and tillage on the physical quality of a clay loam soil. Can. J. Soil Sci. 2003, 83, 381–393. [Google Scholar] [CrossRef]
- Clough, A.; Skjemstad, J.O. Physical and chemical protection of soil organic carbon in three agricultural soils with different contents of calcium carbonate. Soil Res. 2000, 38, 1005–1016. [Google Scholar] [CrossRef]
- Arshad, M.A.C.; Lowery, B.; Grossman, B. Physical Tests for Monitoring Soil Quality; Doran, J.W., Jones, A.J., Eds.; SSSA Special Publications; Soil Science Society of America: Madison, WI, USA, 2015; pp. 123–141. Available online: https://acsess.onlinelibrary.wiley.com/doi/abs/10.2136/sssaspecpub49.c7 (accessed on 26 February 2024).
- Geng, N.; Kang, X.; Yan, X.; Yin, N.; Wang, H.; Pan, H.; Yang, Q.; Lou, Y.; Zhuge, Y. Biochar mitigation of soil acidification and carbon sequestration is influenced by materials and temperature. Ecotoxicol. Environ. Saf. 2022, 232, 113241. [Google Scholar] [CrossRef] [PubMed]
- Nissen, J.; Quiroz, C.; Seguel, O.; Roberto Mac Donald, H.; Sch, A.E. Variación del potencial mátrico durante el movimiento de agua en andisoles. Agro Sur 2005, 33, 36–47. [Google Scholar] [CrossRef]
- Amacher, M.C.; O’Neil, K.P.; Perry, C.H. Soil Vital Signs: A New Soil Quality Index (SQI) for Assessing Forest Soil Health; RMRS-RP-65; U.S. Department of Agriculture, Forest Service, Rocky Mountain Research Station: Washington, DC, USA, 2007.
- Hu, W.; Yao, J.; He, Q.; Chen, J. Elevation-Dependent Trends in Precipitation Observed Over and Around the Tibetan Plateau from 1971 to 2017. Water 2021, 13, 2848. [Google Scholar] [CrossRef]
- Dahlgren, R.A.; Saigusa, M.; Ugolini, F.C. The Nature, Properties and Management of Volcanic Soils. In Advances in Agronomy; Elsevier: Amsterdam, The Netherlands, 2004; pp. 113–182. Available online: https://linkinghub.elsevier.com/retrieve/pii/S0065211303820035 (accessed on 25 February 2024).
- Takahashi, T.; Dahlgren, R.A. Nature, properties and function of aluminum–humus complexes in volcanic soils. Geoderma 2016, 263, 110–121. [Google Scholar] [CrossRef]
- Pérez, C.A.; Carmona, M.R.; Fariña, J.M.; Armesto, J.J. Selective logging of lowland evergreen rainforests in Chiloé Island, Chile: Effects of changing tree species composition on soil nitrogen transformations. For. Ecol. Manag. 2019, 258, 1660–1668. [Google Scholar] [CrossRef]
- Binkley, D.; Fisher, R.F. Soil Organic Matter. In Ecology and Management of Forest Soils, 4th ed.; Wiley-Blackwell: Hoboken, NJ, USA, 2013; p. 43. [Google Scholar]
- Rivas, Y.; Matus, F.; Rumpel, C.; Knicker, H.; Garrido, E. Black carbon contribution in volcanic soils affected by wildfire or stubble burning. Org. Geochem. 2012, 47, 41–50. [Google Scholar] [CrossRef]
- Liu, G.; Du, Q.; Li, J. Interactive effects of nitrate-ammonium ratios and temperatures on growth, photosynthesis, and nitrogen metabolism of tomato seedlings. Sci. Hortic. 2017, 214, 41–50. [Google Scholar] [CrossRef]
- Parfitt, R.L. Phosphate reactions with natural allophane, ferrihydrite and goethite. J. Soil Sci. 1989, 40, 359–369. [Google Scholar] [CrossRef]
- Borie, F.; Aguilera, P.; Castillo, C.; Valentine, A.; Seguel, A.; Barea, J.M.; Cornejo, P. Revisiting the Nature of Phosphorus Pools in Chilean Volcanic Soils as a Basis for Arbuscular Mycorrhizal Management in Plant P Acquisition. J. Soil Sci. Plant Nutr. 2019, 19, 390–401. [Google Scholar] [CrossRef]
- Villarroel, R.B. Diagnóstico de la Fertilidad del Suelo; Instituto de Investigaciones Agropecuarias–Centro Regional de Investigación Remehue Serie Acta: Osorno, Chile, 2000; p. 71. [Google Scholar]
- Lehmann, J.; Rillig, M.C.; Thies, J.; Masiello, C.A.; Hockaday, W.C.; Crowley, D. Biochar effects on soil biota—A review. Soil Biol. Biochem. 2011, 43, 1812–1836. [Google Scholar] [CrossRef]
- Qafoku, N.P.; Ranst, E.V.; Noble, A.; Baert, G. Variable Charge Soils: Their Mineralogy, Chemistry and Management. In Advances in Agronomy; Elsevier: Amsterdam, The Netherlands, 2004; pp. 159–215. Available online: https://linkinghub.elsevier.com/retrieve/pii/S0065211304840045 (accessed on 29 February 2024).
- Jia, Y.; Shi, S.; Liu, J.; Su, S.; Liang, Q.; Zeng, X.; Li, T. Study of the Effect of Pyrolysis Temperature on the Cd2+ Adsorption Characteristics of Biochar. Appl. Sci. 2018, 8, 1019. [Google Scholar] [CrossRef]
- Gillespie, C.J.; Antonangelo, J.A.; Zhang, H. The Response of Soil pH and Exchangeable Al to Alum and Lime Amendments. Agriculture 2021, 11, 547. [Google Scholar] [CrossRef]
- Oliveira, P.E.; Cunha, A.G.; Reyes, G.; Gacitúa, W.; Petit-Breuilh, X. Chusquea quila, a Natural Resource from Chile: Its Chemical, Physical, and Nanomechanical Properties. BioResources 2016, 11, 10057–10069. [Google Scholar] [CrossRef]
- Ortiz, J.; Dube, F.; Neira, P.; Panichini, M.; Stolpe, N.B.; Zagal, E.; Martínez-Hernández, P.A. Soil Quality Changes within a (Nothofagus obliqua) Forest Under Silvopastoral Management in the Andes Mountain Range, South Central Chile. Sustainability 2020, 12, 6815. [Google Scholar] [CrossRef]
- Ortiz, J.; Neira, P.; Panichini, M.; Curaqueo, G.; Stolpe, N.B.; Zagal, E.; Dube, F.; Gupta, S.R. Silvopastoral Systems on Degraded Lands for Soil Carbon Sequestration and Climate Change Mitigation. In Agroforestry for Sustainable Intensification of Agriculture in Asia and Africa; Dagar, J.C., Gupta, S.R., Sileshi, G.W., Eds.; Sustainability Sciences in Asia and Africa; Springer Nature: Singapore, 2023; pp. 207–242. Available online: https://link.springer.com/10.1007/978-981-19-4602-8_7 (accessed on 12 January 2024).
- Muñoz, C.; Torres, P.; Alvear, M.; Zagal, E. Physical protection of C and greenhouse gas emissions provided by soil macroaggregates from a Chilean cultivated volcanic soil. Acta Agric. Scand. Sect. B—Soil Plant Sci. 2012, 62, 739–748. [Google Scholar] [CrossRef]
- Li, X.; Zhang, Q.; Feng, J.; Jiang, D.; Zhu, B. Forest management causes soil carbon loss by reducing particulate organic carbon in Guangxi, Southern China. For. Ecosyst. 2023, 10, 100092. [Google Scholar] [CrossRef]
- Dube, F.; Thevathasan, N.V.; Zagal, E.; Gordon, A.M.; Stolpe, N.B.; Espinosa, M. Carbon Sequestration Potential of Silvopastoral and Other Land Use Systems in the Chilean Patagonia. In Carbon Sequestration Potential of Agroforestry Systems; Kumar, B.M., Nair, P.K.R., Eds.; Advances in Agroforestry; Springer: Dordrecht, The Netherlands, 2011; Volume 8, pp. 101–127. Available online: https://link.springer.com/10.1007/978-94-007-1630-8_6 (accessed on 25 February 2024).
- Alfaro, M.; Dube, F.; Zagal, E. The Influence of Overmature, Degraded Nothofagus Forests with Strong Anthropic Disturbance on the Quality of an Andisol and its Gradual Recovery with Silvopasture in Southwestern South America. In Agroforestry for Degraded Landscapes; Dagar, J.C., Gupta, S.R., Teketay, D., Eds.; Springer: Singapore, 2020; pp. 67–85. Available online: http://link.springer.com/10.1007/978-981-15-6807-7_3 (accessed on 15 January 2025).
- Neira, P.; Henríquez-Castillo, C.; Ortiz, J.; Stolpe, N.; Dube, F. Do different densities of tree cover affect pasture biomass and soil microbial communities? Agrofor. Syst. 2021, 95, 1465–1478. [Google Scholar] [CrossRef]
- Zerbe, S.; Storz, S.T.; Leitinger, G.; Joelson, N.Z.; Bava, J.; Heinrichs, S.; Leuschner, C.; Loguercio, G.; Simon, A.; Urretavizcaya, M.F.; et al. Regeneration of Nothofagus dombeyi (Mirb.) Ørst. in little to moderately disturbed southern beech forests in the Andes of Patagonia (Argentina). For. Ecosyst. 2023, 10, 100126. [Google Scholar] [CrossRef]
- Diao, J.; Liu, J.; Zhu, Z.; Wei, X.; Li, M. Active forest management accelerates carbon storage in plantation forests in Lishui, southern China. For. Ecosyst. 2022, 9, 100004. [Google Scholar] [CrossRef]
- Nicholson, W.L.; Fajardo-Cavazos, P.; Rebeil, R.; Slieman, T.A.; Riesenman, P.J.; Law, J.F.; Xue, Y. Bacterial endospores and their significance in stress resistance. Antonie van Leeuwenhoek 2002, 81, 27–32. [Google Scholar] [CrossRef] [PubMed]
- Checinska, A.; Paszczynski, A.; Burbank, M. Bacillus and Other Spore-Forming Genera: Variations in Responses and Mechanisms for Survival. Annu. Rev. Food Sci. Technol. 2015, 6, 351–369. [Google Scholar] [CrossRef]
- Ranawat, P.; Rawat, S. Radiation resistance in thermophiles: Mechanisms and applications. World J. Microbiol. Biotechnol. 2017, 33, 112. [Google Scholar] [CrossRef] [PubMed]
- Kozlowski, T.T.; Pallardy, S.G. Physiology of Woody Plants, 2nd ed.; Elsevier: Amsterdam, The Netherlands, 1996; 42332p. [Google Scholar]
- Epihov, D.Z.; Saltonstall, K.; Batterman, S.A.; Hedin, L.O.; Hall, J.S.; van Breugel, M.; Leake, J.R.; Beerling, D.J. Legume–microbiome interactions unlock mineral nutrients in regrowing tropical forests. Proc. Natl. Acad. Sci. USA 2021, 118, e2022241118. [Google Scholar] [CrossRef]
- Wu, D.; Wei, Z.; Mohamed, T.A.; Zheng, G.; Qu, F.; Wang, F.; Zhao, Y.; Song, C. Lignocellulose biomass bioconversion during composting: Mechanism of action of lignocellulase, pretreatment methods and future perspectives. Chemosphere 2022, 286, 131635. [Google Scholar] [CrossRef] [PubMed]
- McDaniel, M.D.; Tiemann, L.K.; Grandy, A.S. Does agricultural crop diversity enhance soil microbial biomass and organic matter dynamics? A meta-analysis. Ecol. Appl. 2014, 24, 560–570. [Google Scholar] [CrossRef]
- Zhou, Z.; Gao, T.; Van Zwieten, L.; Zhu, Q.; Yan, T.; Xue, J.; Wu, Y. Soil Microbial Community Structure Shifts Induced by Biochar and Biochar-Based Fertilizer Amendment to Karst Calcareous Soil. Soil Sci. Soc. Am. J. 2019, 83, 398–408. [Google Scholar] [CrossRef]
- Xue, Y.; Jonassen, I.; Øvreås, L.; Taş, N. Metagenome-assembled genome distribution and key functionality highlight importance of aerobic metabolism in Svalbard permafrost. FEMS Microbiol. Ecol. 2020, 96, fiaa057. [Google Scholar] [CrossRef]
- Scarlett, K.; Denman, S.; Clark, D.R.; Forster, J.; Vanguelova, E.; Brown, N.; Whitby, C. Relationships between nitrogen cycling microbial community abundance and composition reveal the indirect effect of soil pH on oak decline. ISME J. 2021, 15, 623–635. [Google Scholar] [CrossRef]
- Fierer, N. Embracing the unknown: Disentangling the complexities of the soil microbiome. Nat. Rev. Microbiol. 2017, 15, 579–590. [Google Scholar] [CrossRef]
- Allison, S.D.; Martiny, J.B.H. Resistance, resilience, and redundancy in microbial communities. Proc. Natl. Acad. Sci. USA 2008, 105 (Suppl. S1), 11512–11519. [Google Scholar] [CrossRef] [PubMed]
- Goldfarb, K.C.; Karaoz, U.; Hanson, C.A.; Santee, C.A.; Bradford, M.A.; Treseder, K.K.; Wallenstein, M.D.; Brodie, E.L. Differential Growth Responses of Soil Bacterial Taxa to Carbon Substrates of Varying Chemical Recalcitrance. Front. Microbio. 2011, 2, 94. [Google Scholar] [CrossRef] [PubMed]
- Lladó, S.; López-Mondéjar, R.; Baldrian, P. Forest Soil Bacteria: Diversity, Involvement in Ecosystem Processes, and Response to Global Change. Microbiol. Mol. Biol. Rev. 2017, 81, e00063-16. [Google Scholar] [CrossRef] [PubMed]
- Fierer, N.; Bradford, M.A.; Jackson, R.B. Toward an ecological classification of soil bacteria. Ecology 2007, 88, 1354–1364. [Google Scholar] [CrossRef] [PubMed]
- Treseder, K.K.; Lennon, J.T. Fungal Traits That Drive Ecosystem Dynamics on Land. Microbiol. Mol. Biol. Rev. 2015, 79, 243–262. [Google Scholar] [CrossRef] [PubMed]
- Shade, A.; Peter, H.; Allison, S.D.; Baho, D.L.; Berga, M.; Bürgmann, H.; Huber, D.H.; Langenheder, S.; Lennon, J.T.; Martiny, J.B.H. Fundamentals of Microbial Community Resistance and Resilience. Front. Microbio. 2012, 3, 417. [Google Scholar] [CrossRef] [PubMed]
- Evans, S.E.; Wallenstein, M.D. Climate change alters ecological strategies of soil bacteria. Ecol. Lett. 2014, 17, 155–164. [Google Scholar] [CrossRef]
- Schimel, J.P.; Schaeffer, S.M. Microbial control over carbon cycling in soil. Front. Microbio. 2012, 3, 348. [Google Scholar] [CrossRef] [PubMed]


| Condition | Location | Assessed Area (ha) | N° Plots and Area (ha) | Tree Density (No ha−1); Average Tree Height (m) and Diameter at Breast Height (DBH) (cm) | Forest Species | Understory-Herbaceous Strata Composition | Degradation Record |
|---|---|---|---|---|---|---|---|
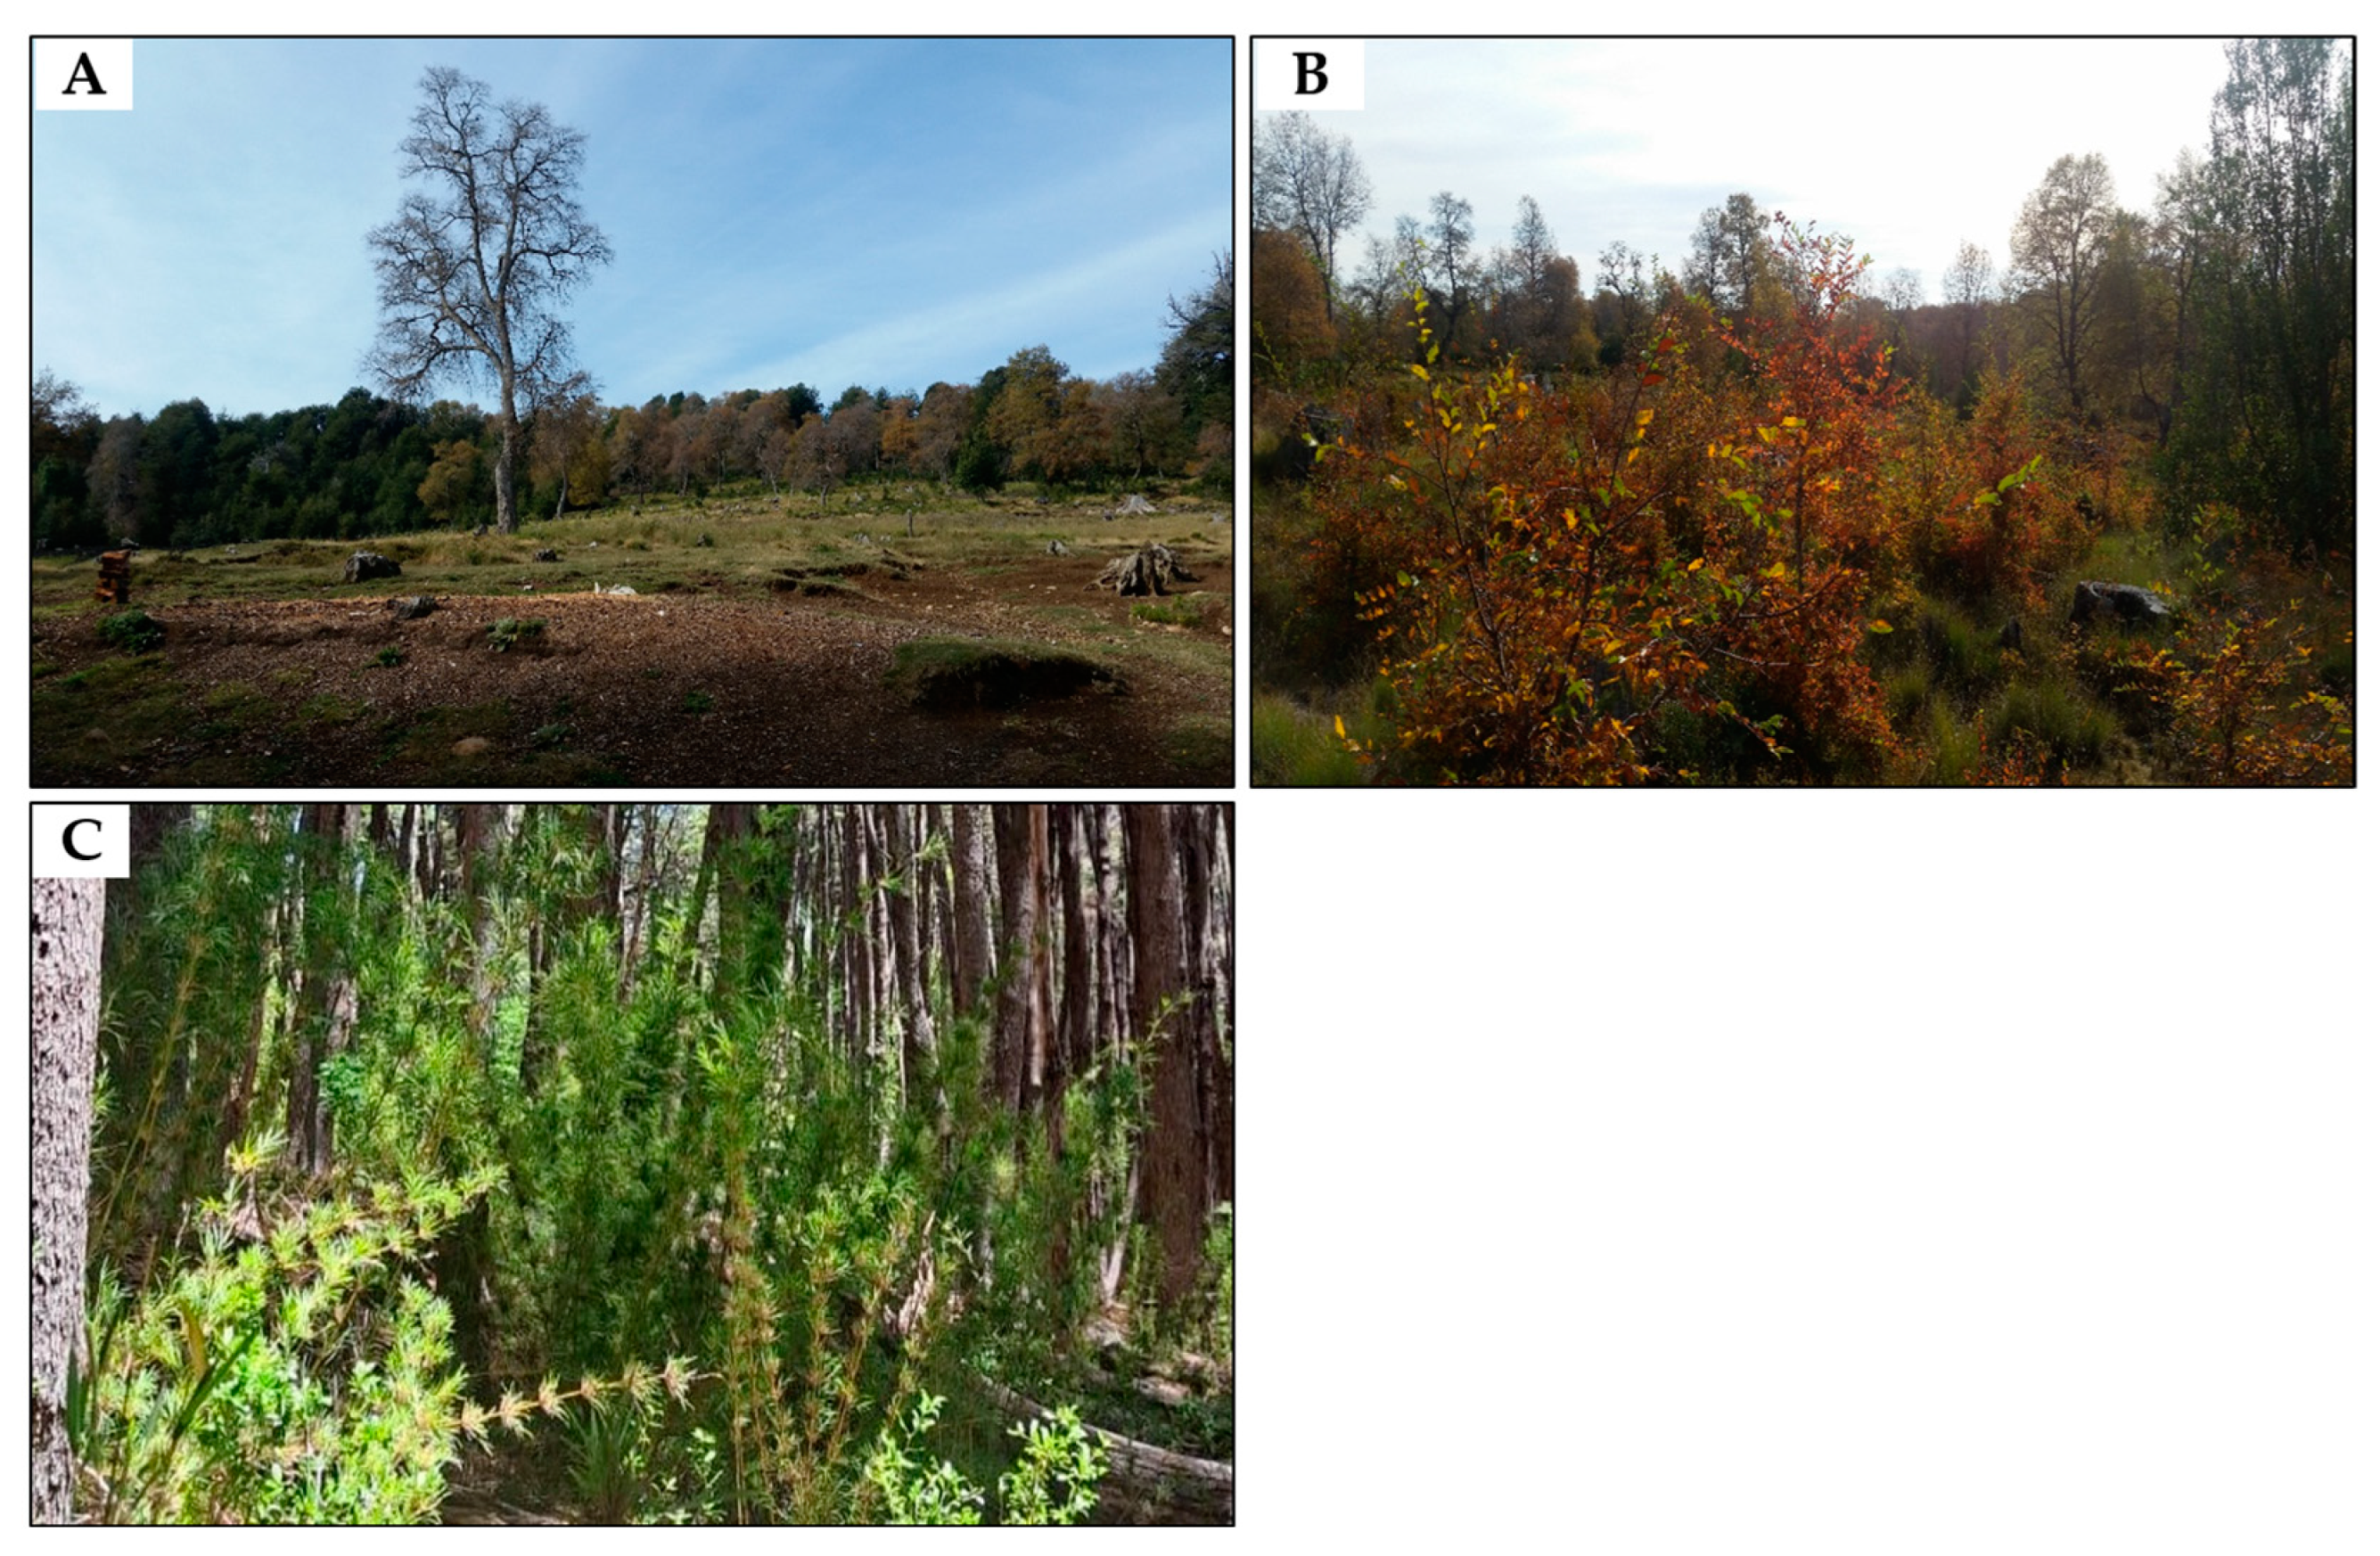
| FADIST | 37°03′31.87″ S, 71°38′21.76″ W 1367 m.a.s.l | 4 | 3 × 1.33 | 60; 15 and 34 | Roble (Nothofagus obliqua (Mirb.) Oerst. - coihue (Nothofagus dombeyi) (Mirb.) Oerst. (5:1) | Vetch (Fabaceae purpurea), clover (Trifolium incarnatum, T. subterraneum, and T. vesiculosum), Lolium multiflorum westerwoldicum, Phalaris acuatica, Lolium perenne, oats (Avena sativa), Festuca arundinacea, Dactylis glomerata L.), Chusquea sp., and there-sprouting of Radal (Lomatia hirsuta (Lam.) Diels) | Evidence of wildfire, agricultural burning, and intense logging. Testimony of use of intensive animal–mechanical loads; cattle grazing–browsing, prolonged commercial, and domestic timber harvesting |
| SECFORST | 37°4′43.01″ S, 71°39′25.32″ W 1250 m.s.n.m | 4 | 3 × 1.33 | 296; 33 and 46 | Roble (Nothofagus obliqua)- coihue (Nothofagus dombeyi) (8:3) | Primarily dominated by Chusquea sp., a circumstance that has been reported in the literature during regenerative dynamics processes post-disturbance (e.g., Muñoz and Gonzalez, 2009; Donoso et al., 2022 [28,36]) | Evidence of fire events. Testimony of use of intensive animal loads; cattle/goat/equine grazing and/or browsing, prolonged commercial and domestic timber harvesting |
| Property | FADIST 0–5 | FADIST 5–20 | SECFORST 0–5 | SECFORST 5–20 |
|---|---|---|---|---|
| A INFVk * | 13.05 ± 0.3 A | 13.05 ± 0.3 A | 18.1 ± 0.66 B | 18.1 ± 0.66 B |
| WHC ** | 40.42 ± 4.35 Aa | 38.05 ± 4.42 Aa | 39.30 ± 1.68 Aa | 34.86 ± 6.07 Aa |
| BD *** | 0.63 ± 0.02 Aa | 0.59 ± 0.02 Aa | 0.57 ± 0.02 Aa | 0.56 ± 0.01 Aa |
| PD *** | 1.94 ± 0.01 Aa | 1.92 ± 0.02 Aa | 1.95 ± 0.03 Aa | 1.93 ± 0.03 Aa |
| B POR (%) ** | 67.19 ± 0.69 Aa | 70.77 ± 1.18 Aa | 69.59 ± 1.61 Aa | 70.98 ± 0.89 Aa |
| WSA ** | 49.77 ± 0.36 Aa | 49.80 ± 0.14 Aa | 52.47 ± 4.77 Aa | 50.83 ± 1.64 Aa |
| PENRES **** | 350.0 ± 0.0 Aa | 316.67 ± 57.7 Ab | 250.0 ± 0.0 Bb | 250.0 ± 0.0 Bb |
| Condition | ||||
|---|---|---|---|---|
| Property | FADIST 0–5 | FADIST 5–20 | SECFORST 0–5 | SECFORST 5–20 |
| pH | 6.19 ± 0.05 Aa | 6.15 ± 0.05 Aa | 5.9 ± 0.06 Bb | 5.86 ± 0.07 Bb |
| SOC * | 10.10 ± 0.25 Aa | 8.47 ± 0.66 Bb | 11.03 ± 1.01 Cc | 10.46 ± 0.96 Dd |
| N * | 0.73 ± 0.06 Aa | 0.63 ± 0.06 Aa | 0.77 ± 0.06 Bb | 0.77 ± 0.06 Bb |
| C:N | 17.61 ± 1.34 Aa | 16.71 ± 1.64 Aa | 17.01 ± 1.67 Aa | 16.39 ± 2.55 Aa |
| NH4+ ** | 5.94 ± 0.32 Aa | 5.37 ± 0.66 Aa | 6.11 ± 0.27 Aa | 5.36 ± 0.41 Aa |
| NO3− ** | 5.4 ± 0.18 Aa | 4.43 ± 0.39 Bb | 3.72 ± 0.43 Bb | 3.02 ± 0.28 Cc |
| P+ ** | 2.25 ± 0.29 Ab | 1.91 ± 0.31 Aa | 2.62 ± 0.11 Bb | 1.91 ± 0.24 Aa |
| K ** | 0.34 ± 0.06 Aa | 0.19 ± 0.03 Bb | 0.71 ± 0.05 Cc | 0.59 ± 0.02 Cc |
| Ca2+ ** | 8.06 ± 2.11 Aa | 3.57 ± 0.91 Bb | 3.78 ± 0.23 Bb | 2.05 ± 0.61 Cc |
| Mg2+ ** | 0.84 ± 0.07 Aa | 0.30 ± 0.07 Bb | 0.68 ± 0.09 Aa | 0.33 ± 0.02 Bb |
| S ** | 2.83 ± 0.71 Aa | 5.86 ± 1.14 Bb | 12.70 ± 0.44 Cc | 11.97 ± 0.60 Cc |
| ECEC *** | 5.92 ± 0.73 Aa | 4.44 ± 0.68 Bb | 6.40 ± 0.80 Aa | 2.81 ± 0.29 Bb |
| AlEXCH *** | 0.09 ± 0.05 Aa | 0.08 ± 0.02 Aa | 0.18 ± 0.03 Bb | 0.22 ± 0.02 Bb |
| A AlSAT * | 1.52 ± 0.07 Aa | 1.80 ± 0.15 Bb | 0.43 ± 0.60 Cc | 7.83 ± 0.26 Dd |
| FADIST | SECFORST | |
|---|---|---|
| Previous SOC (%) | 8.2 * | 10.1 * |
| SOC2020 | 8.9 | 10.6 |
| A Previous SOC stock (Mg ha−1) | 81.18 * | 103.53 * |
| ASOC stock 2020 (Mg ha−1) | 106.53 | 120.07 |
| Theoretical annual CO2→SOC | 4.23 | 2.75 |
Disclaimer/Publisher’s Note: The statements, opinions and data contained in all publications are solely those of the individual author(s) and contributor(s) and not of MDPI and/or the editor(s). MDPI and/or the editor(s) disclaim responsibility for any injury to people or property resulting from any ideas, methods, instructions or products referred to in the content. |
© 2025 by the authors. Licensee MDPI, Basel, Switzerland. This article is an open access article distributed under the terms and conditions of the Creative Commons Attribution (CC BY) license (https://creativecommons.org/licenses/by/4.0/).
Share and Cite
Ortiz, J.; Panichini, M.; Neira, P.; Henríquez-Castillo, C.; Gallardo Jara, R.E.; Rodriguez, R.; Mutis, A.; Ramos, C.; Espejo, W.; Puc-Kauil, R.; et al. How Natural Regeneration After Severe Disturbance Affects Ecosystem Services Provision of Andean Forest Soils at Contrasting Timescales. Forests 2025, 16, 456. https://doi.org/10.3390/f16030456
Ortiz J, Panichini M, Neira P, Henríquez-Castillo C, Gallardo Jara RE, Rodriguez R, Mutis A, Ramos C, Espejo W, Puc-Kauil R, et al. How Natural Regeneration After Severe Disturbance Affects Ecosystem Services Provision of Andean Forest Soils at Contrasting Timescales. Forests. 2025; 16(3):456. https://doi.org/10.3390/f16030456
Chicago/Turabian StyleOrtiz, Juan, Marcelo Panichini, Pablo Neira, Carlos Henríquez-Castillo, Rocio E. Gallardo Jara, Rodrigo Rodriguez, Ana Mutis, Camila Ramos, Winfred Espejo, Ramiro Puc-Kauil, and et al. 2025. "How Natural Regeneration After Severe Disturbance Affects Ecosystem Services Provision of Andean Forest Soils at Contrasting Timescales" Forests 16, no. 3: 456. https://doi.org/10.3390/f16030456
APA StyleOrtiz, J., Panichini, M., Neira, P., Henríquez-Castillo, C., Gallardo Jara, R. E., Rodriguez, R., Mutis, A., Ramos, C., Espejo, W., Puc-Kauil, R., Zagal, E., Stolpe, N., Schoebitz, M., Sandoval, M., & Dube, F. (2025). How Natural Regeneration After Severe Disturbance Affects Ecosystem Services Provision of Andean Forest Soils at Contrasting Timescales. Forests, 16(3), 456. https://doi.org/10.3390/f16030456