
Cellular Uptake and Transport Mechanism Investigations of PEGylated Niosomes for Improving the Oral Delivery of Thymopentin
 , ,
, ,  , , and
Abstract
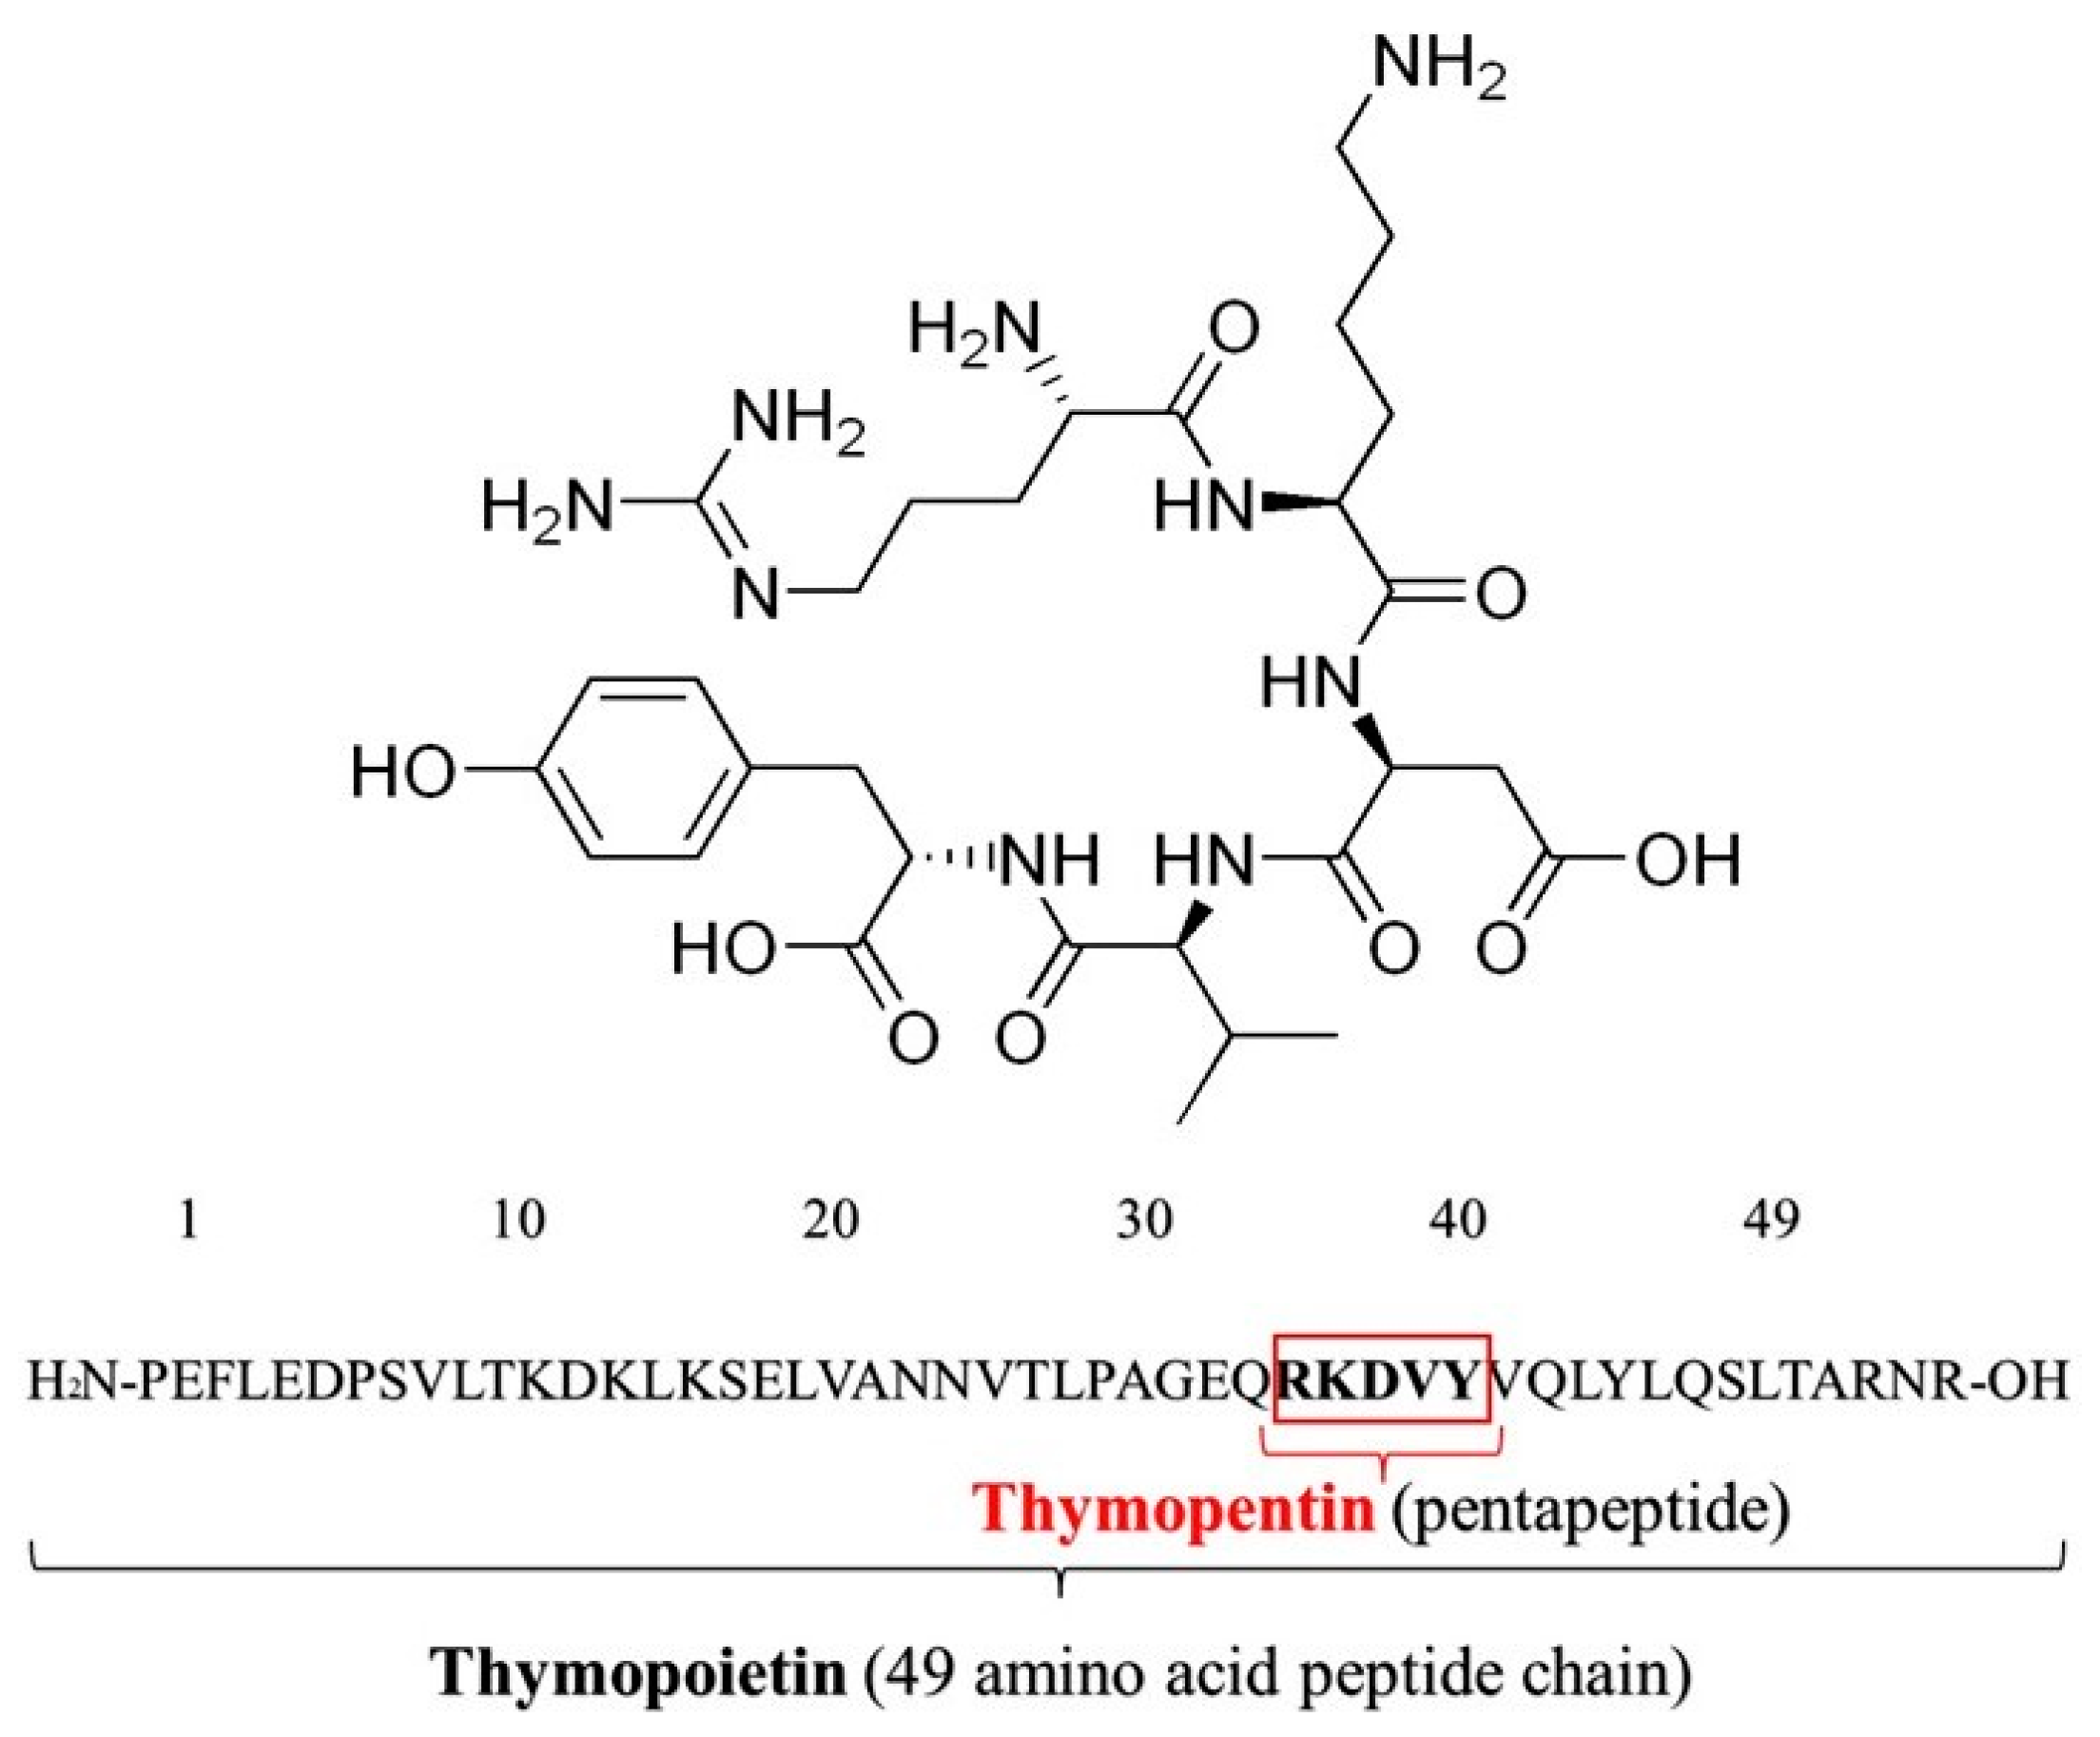
:1. Introduction
2. Materials and Methods
2.1. Materials
2.2. Analytical Method of TP5
2.3. In Vitro Cell Culture Investigation
2.3.1. Cell Co-Culture
2.3.2. Cell Line Integrity
2.3.3. Preparation of TP5 Stock Solution and TP5-PEG-Niosomes
2.3.4. Cytotoxicity Study
2.3.5. Cellular Uptake
Fluorescence and Confocal Microscopy Analysis
Quantitative Analysis of the Cellular Uptake of TP5 and TP5-PEG-Niosomes
Cellular Uptake Mechanisms of TP5 and TP5-PEG-Niosomes
2.3.6. Cellular Transport
Transwell Culture
Transepithelial Transport of TP5 and TP5-PEG-Niosomes
Cellular Transport Mechanism of TP5 and TP5-PEG-Niosomes
2.4. Data Analysis
3. Results and Discussion
3.1. Analytical Method of TP5
3.2. In Vitro Cell Culture Investigation
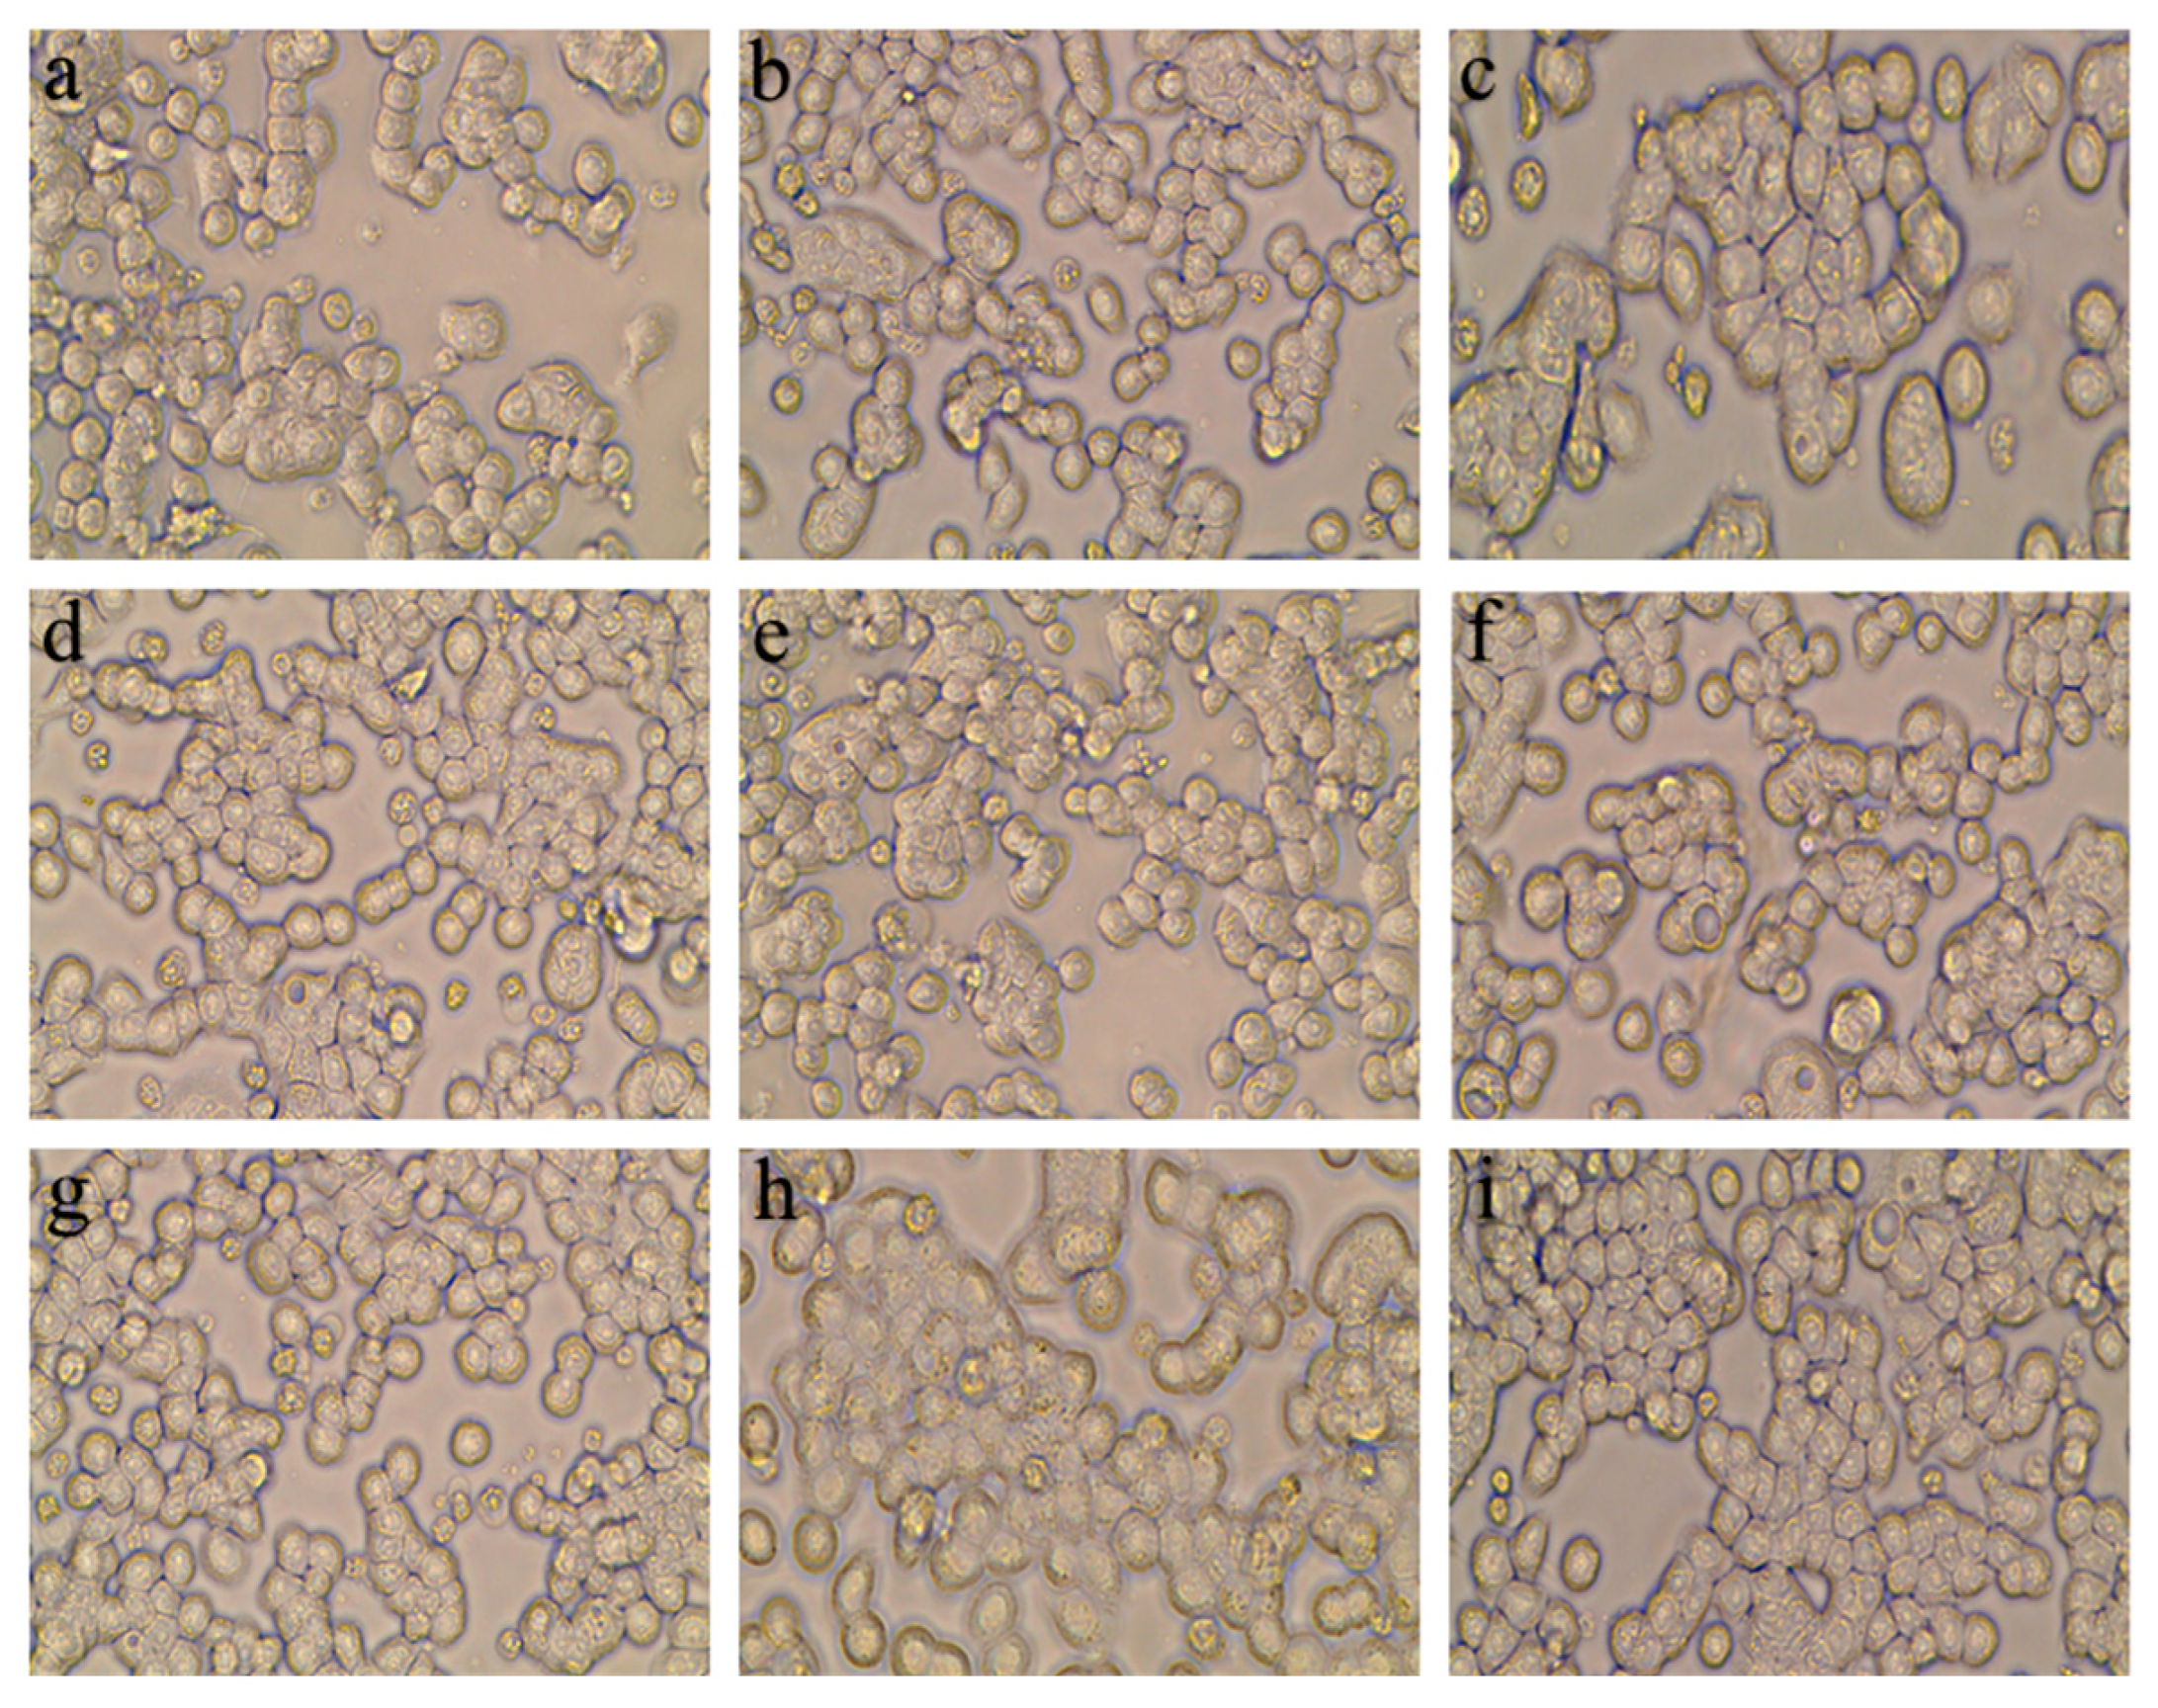
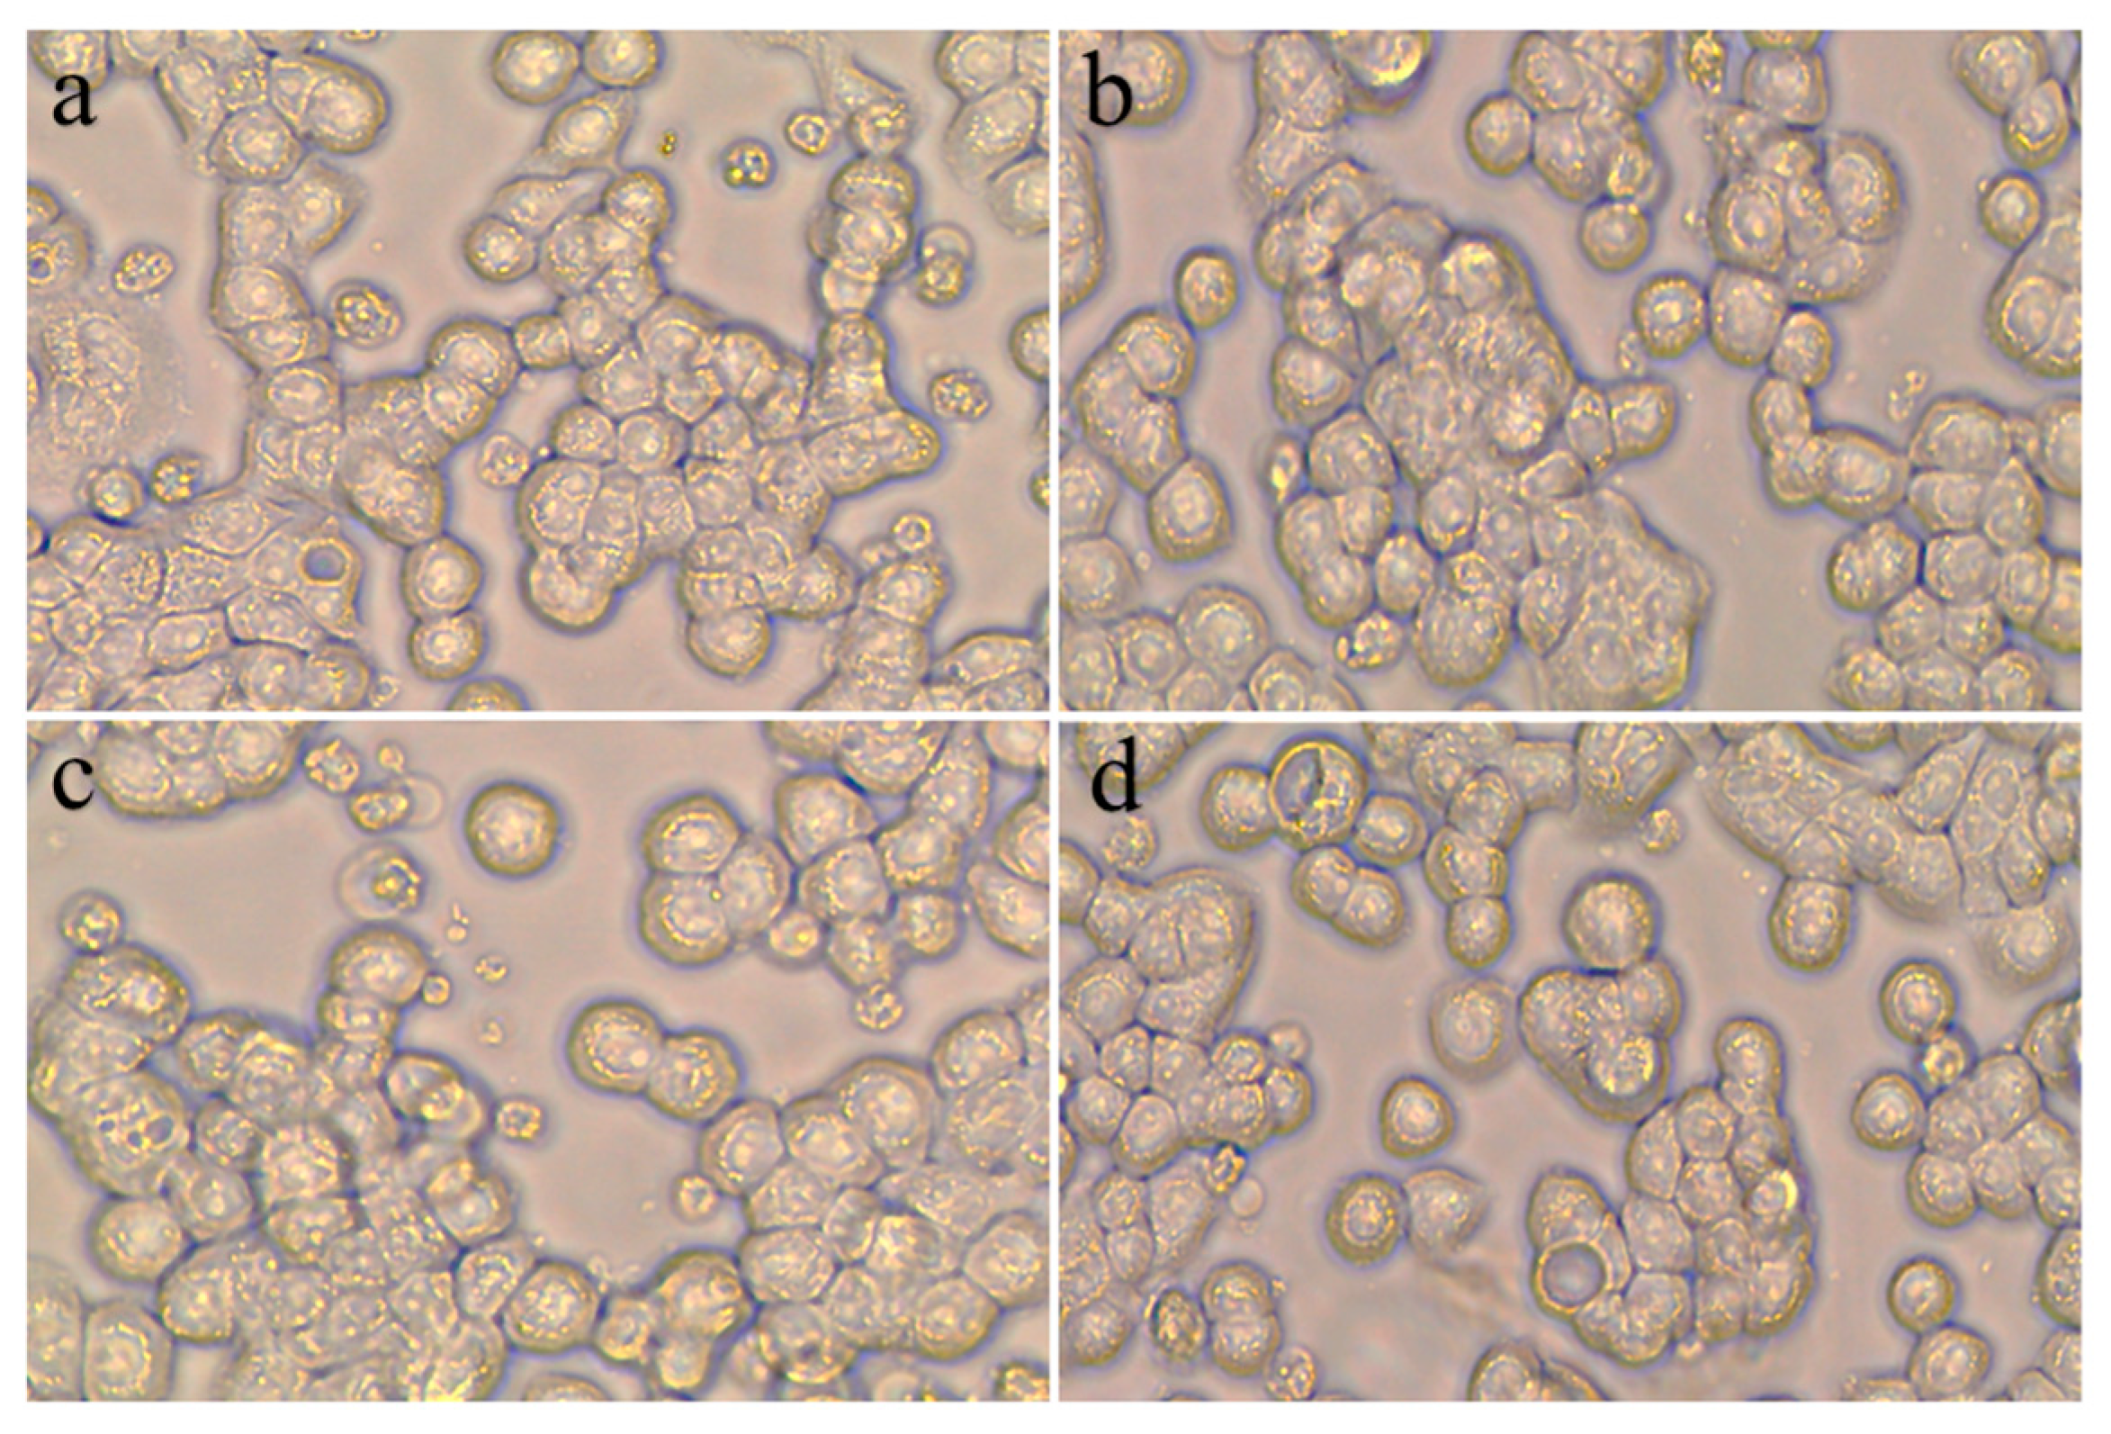
3.2.1. Cell Line Integrity
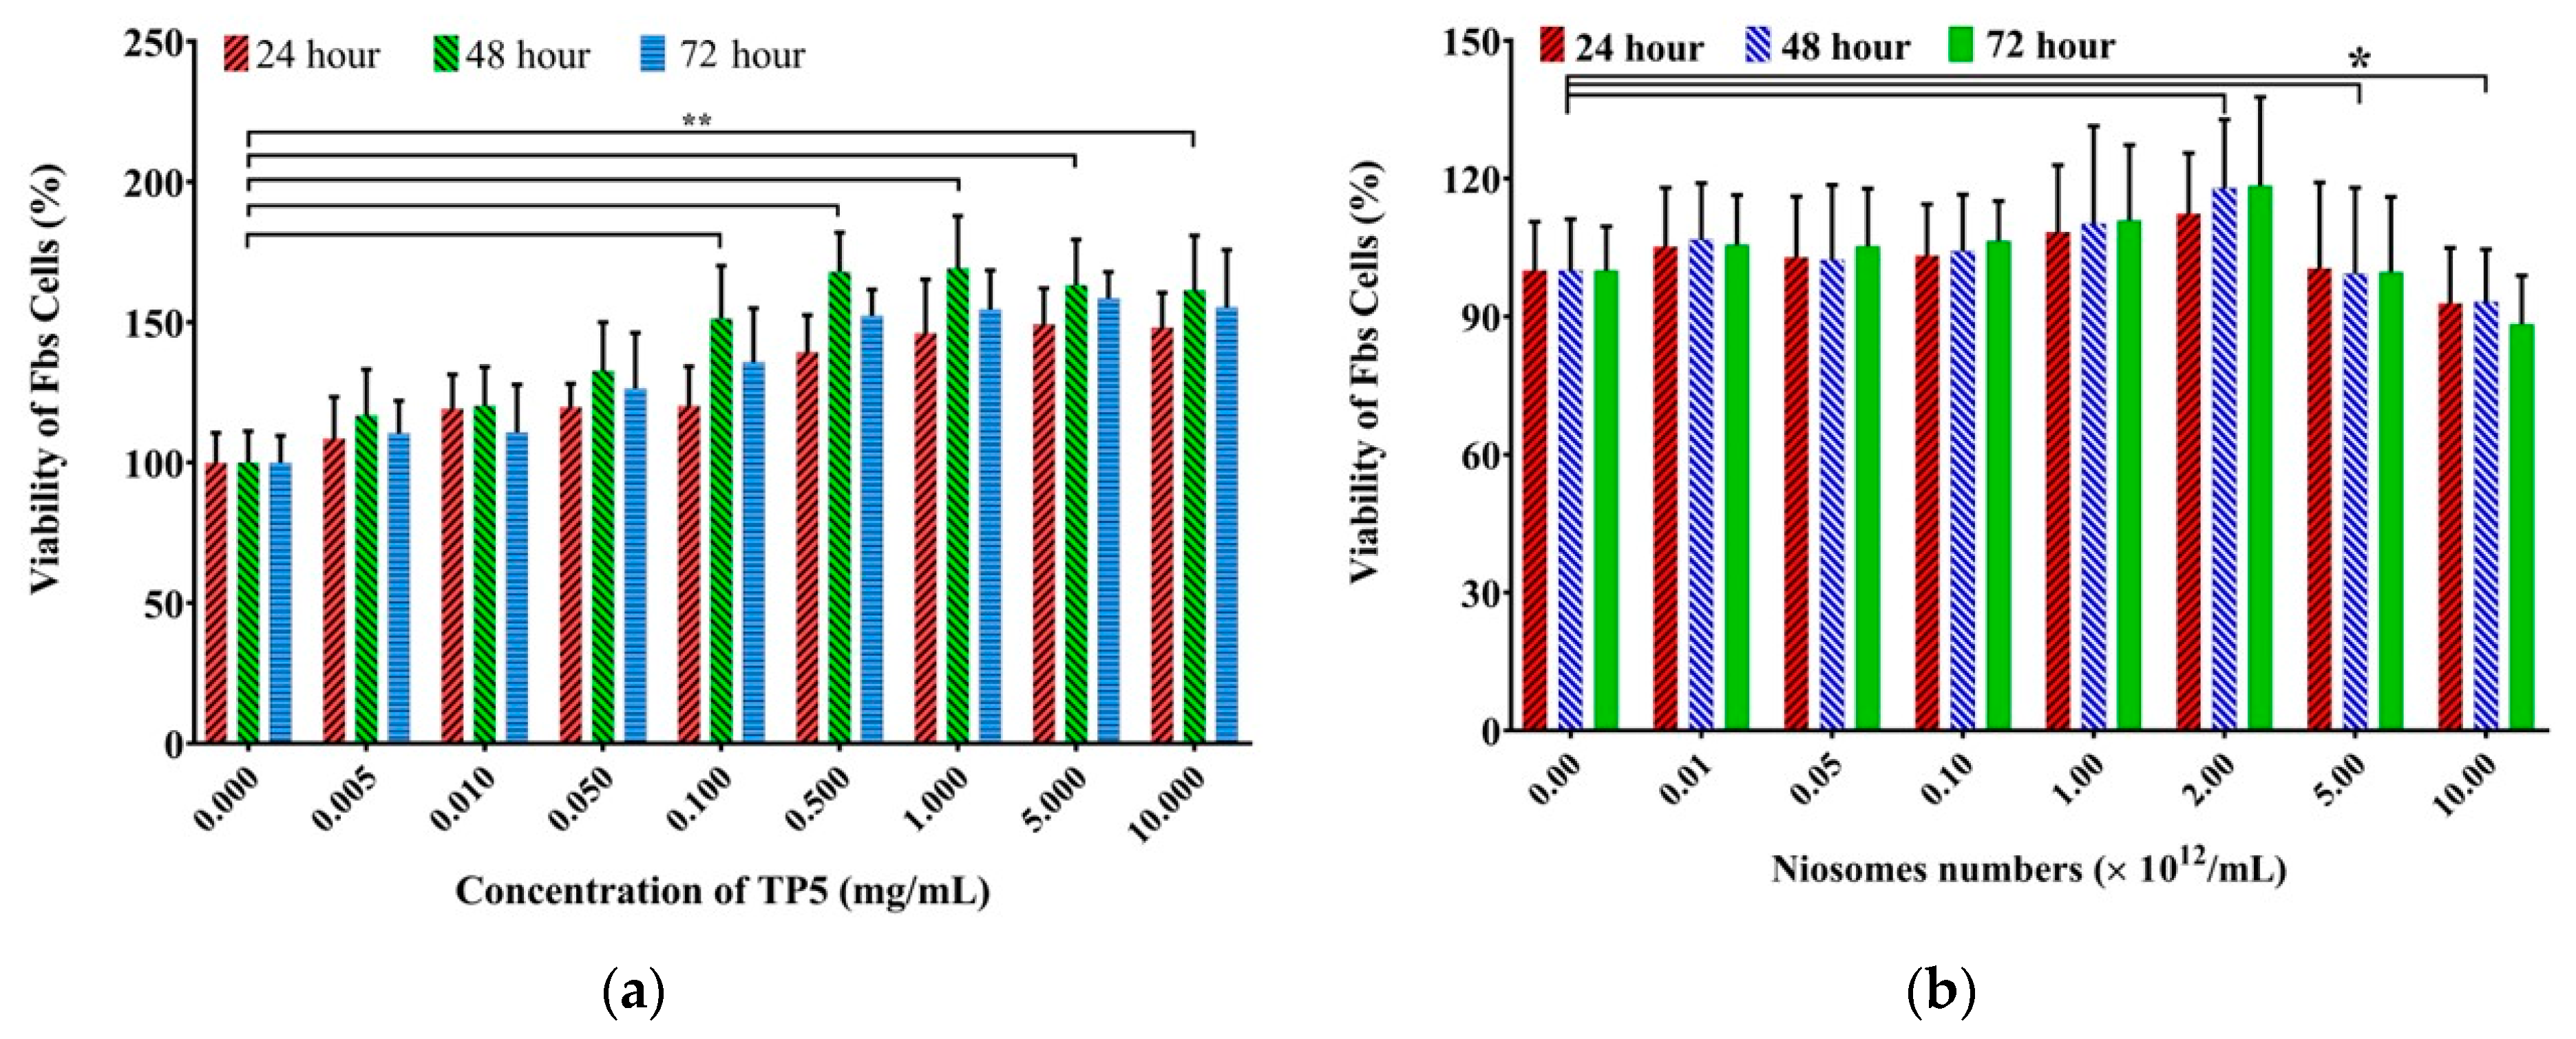
3.2.2. Cytotoxicity Study
3.2.3. Cellular Uptake
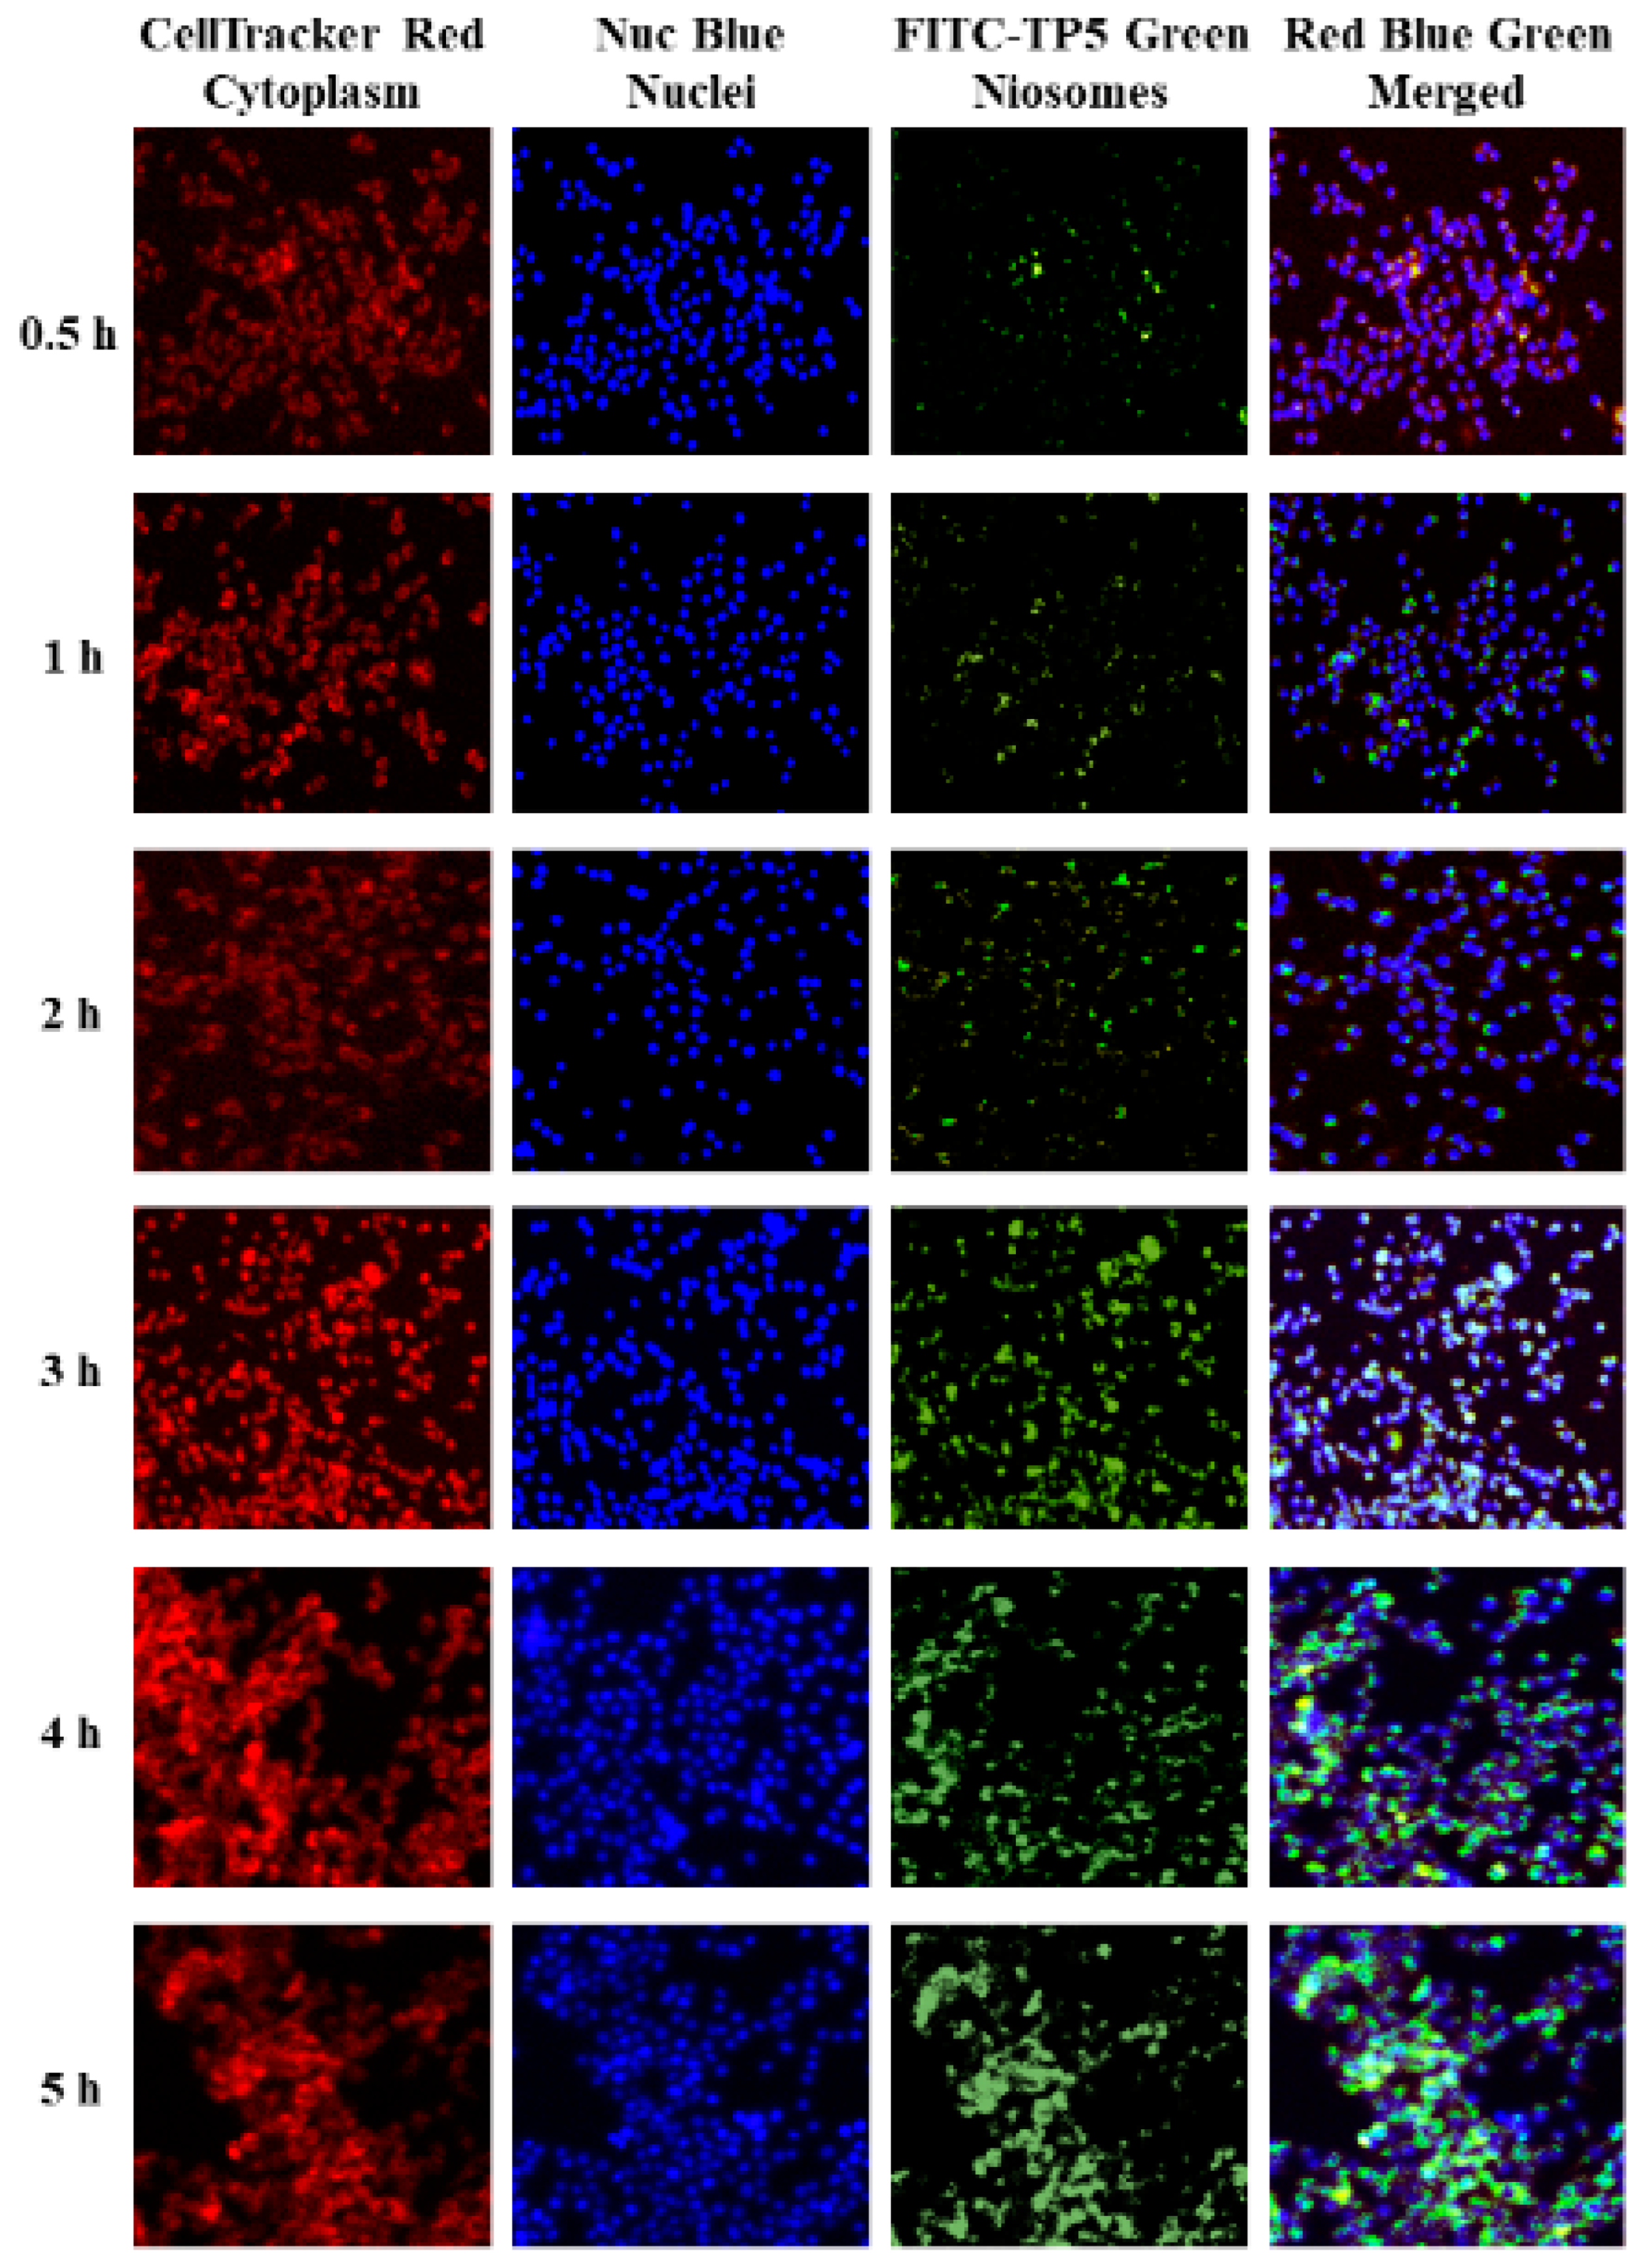
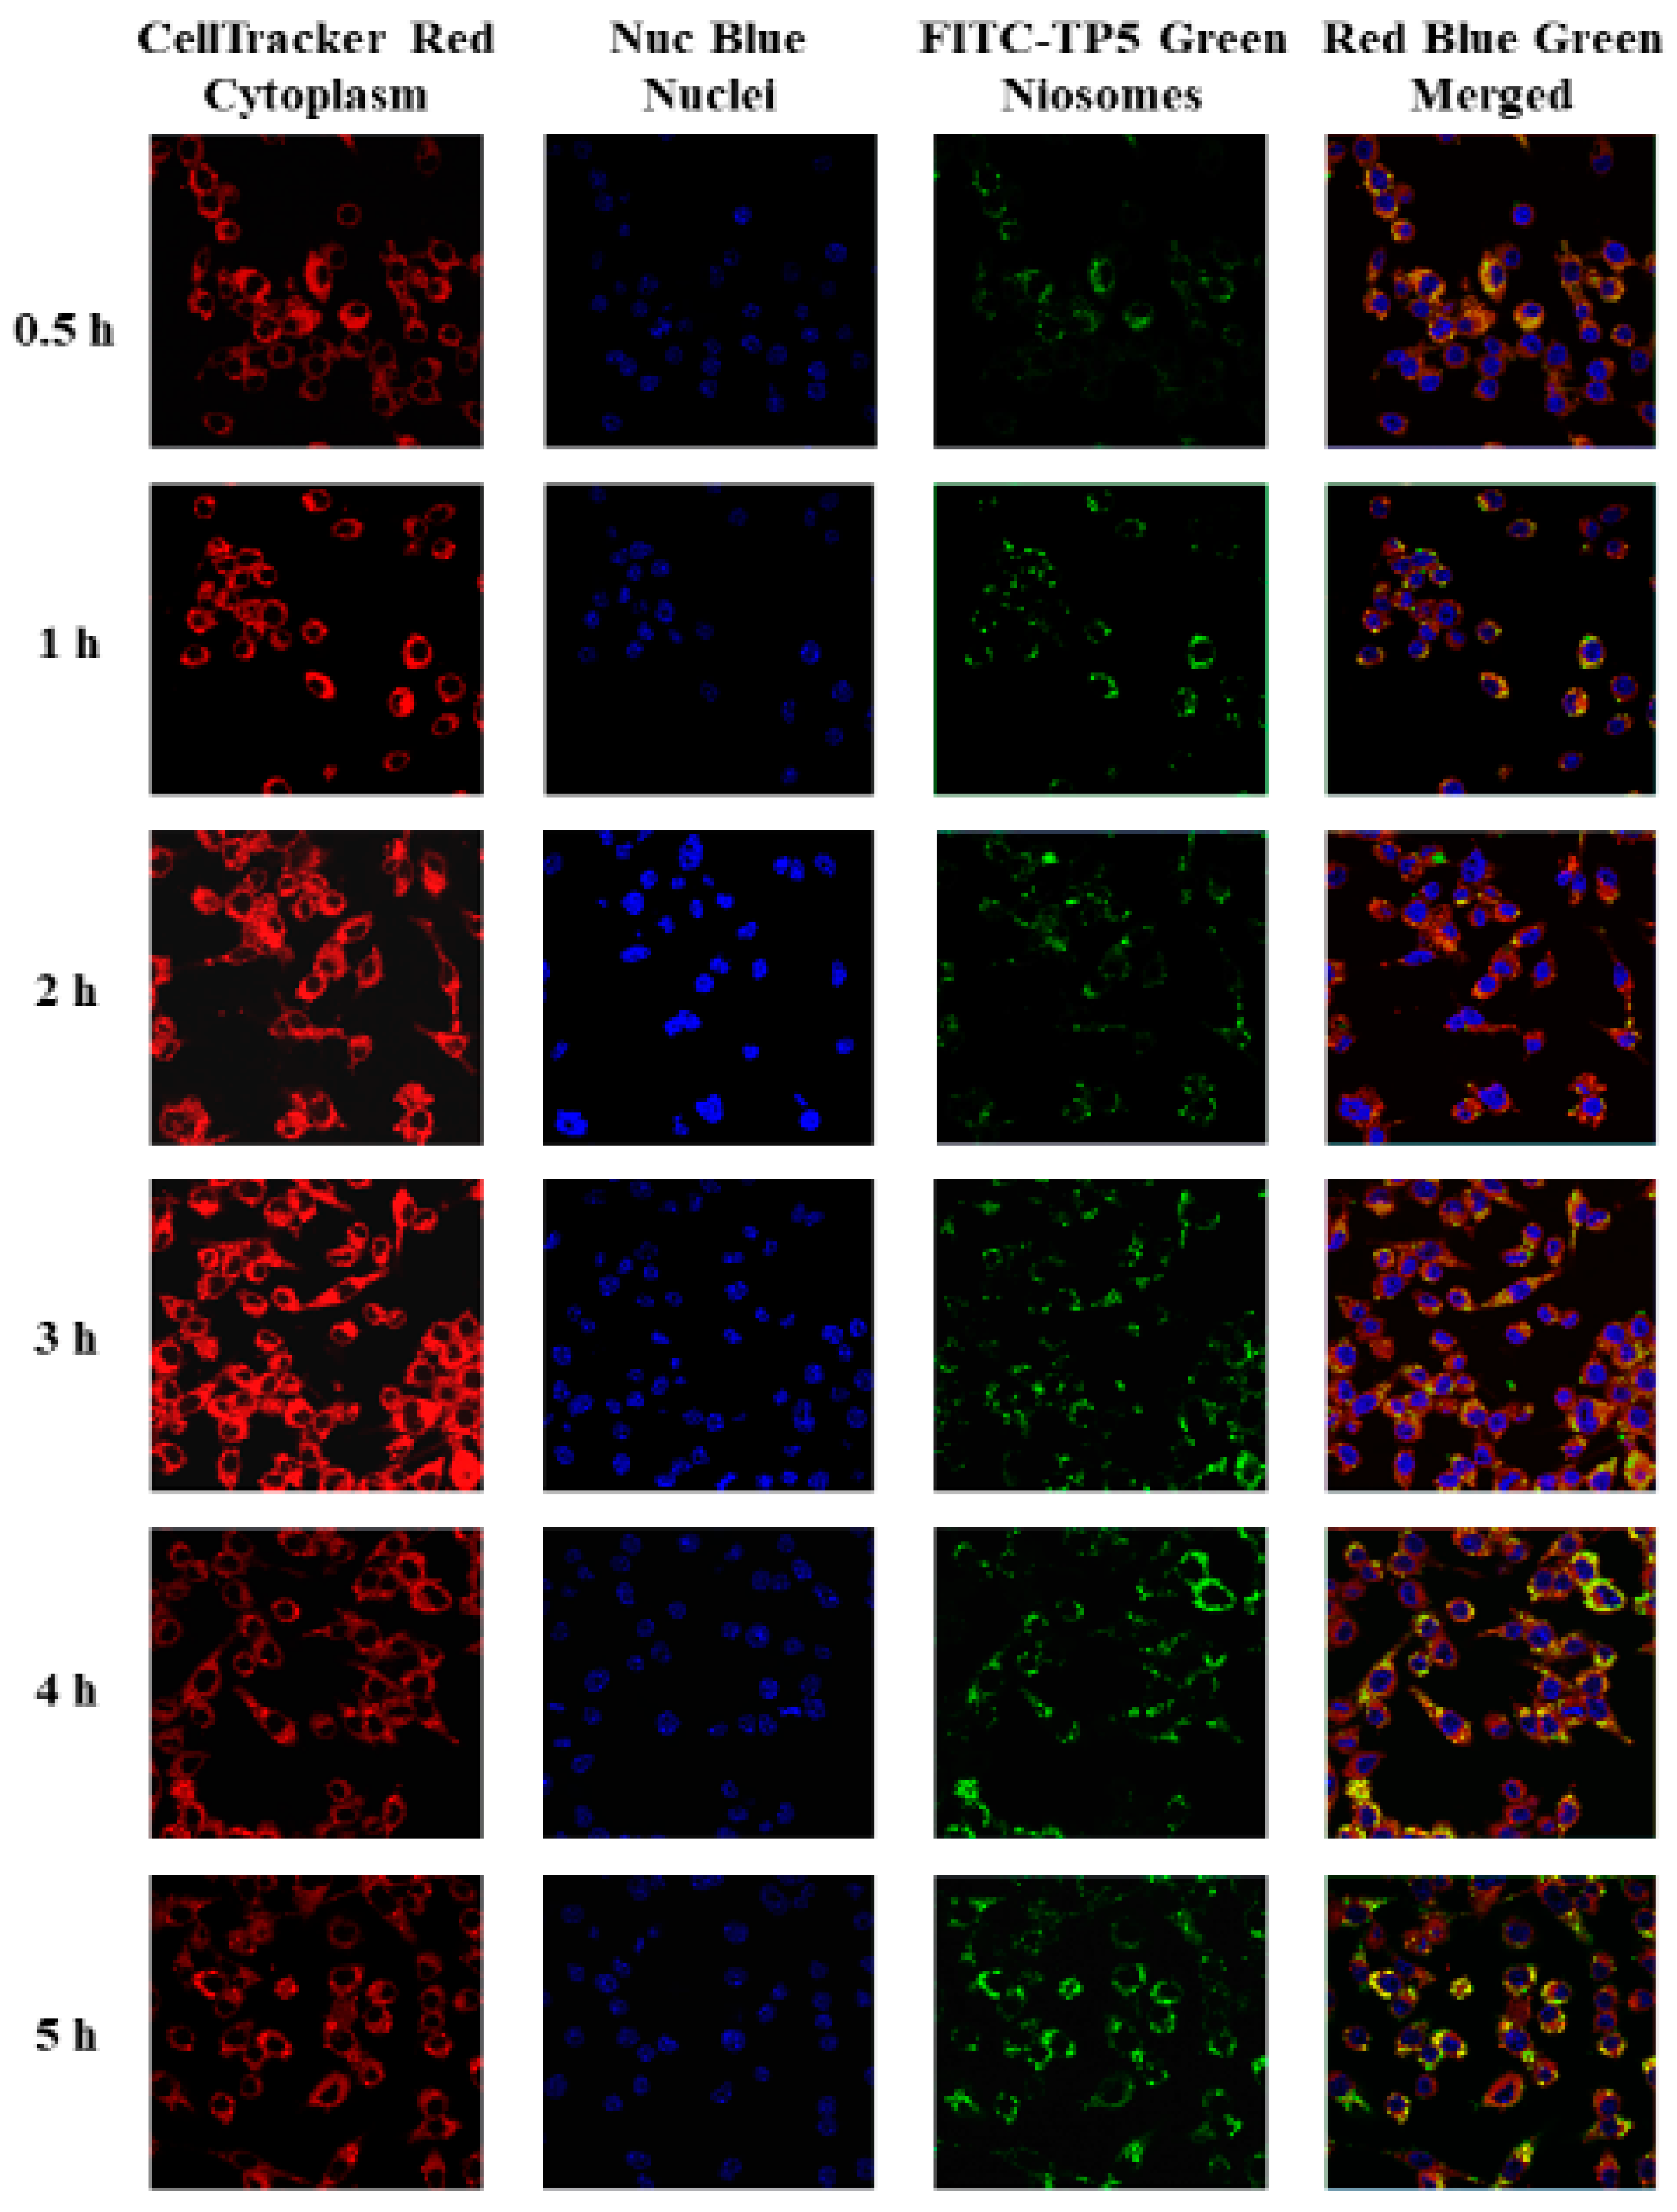
Fluorescence and Confocal Microscopy Analysis
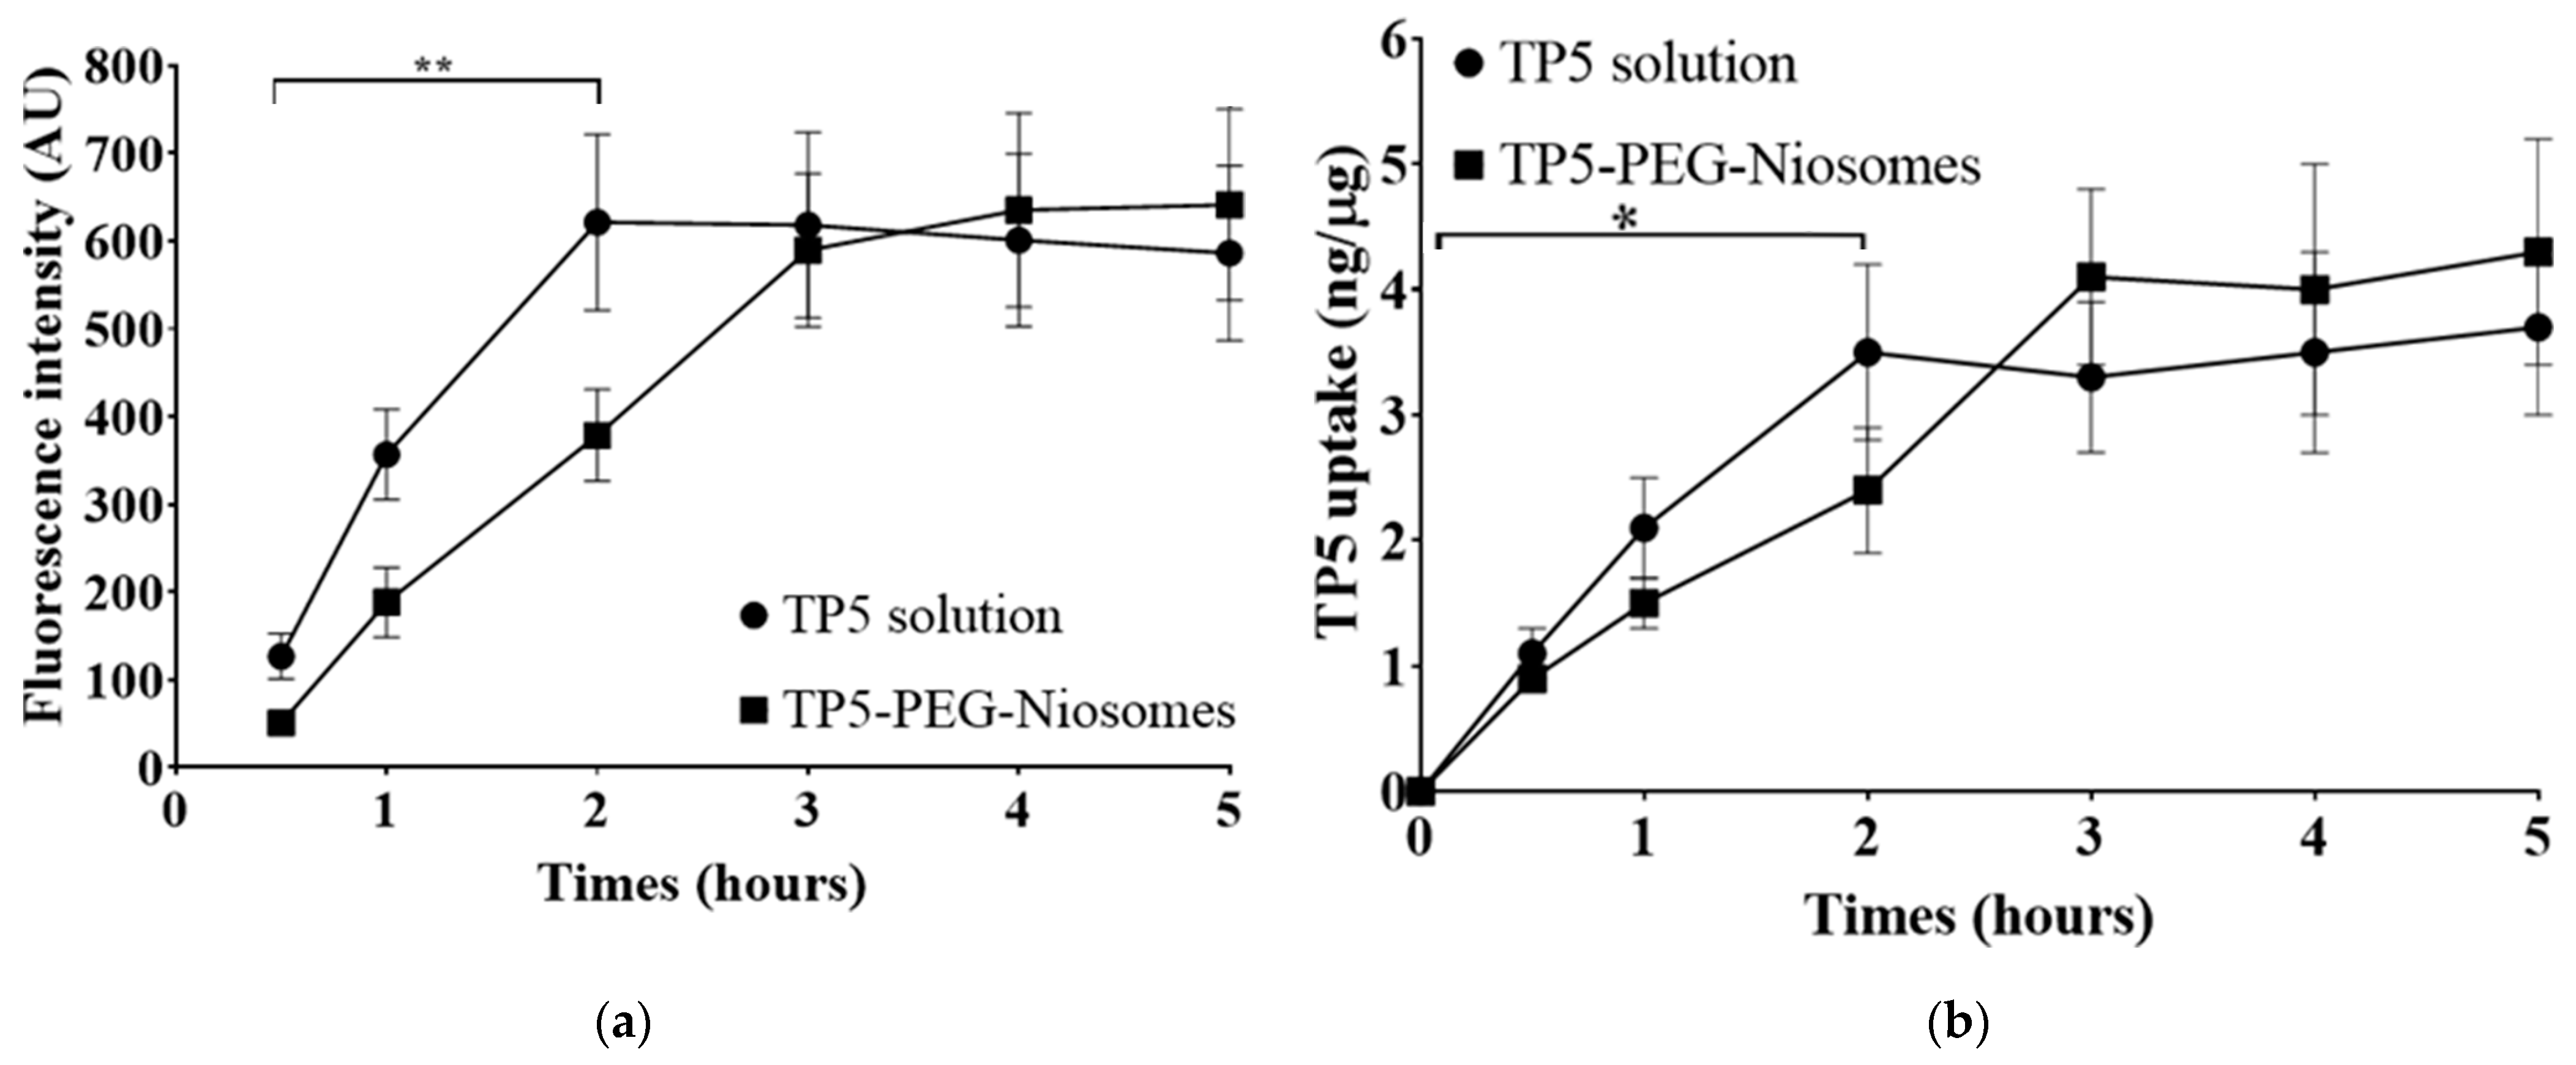
Quantitative Analysis of the Cellular Uptake of TP5 and TP5-PEG-Niosomes
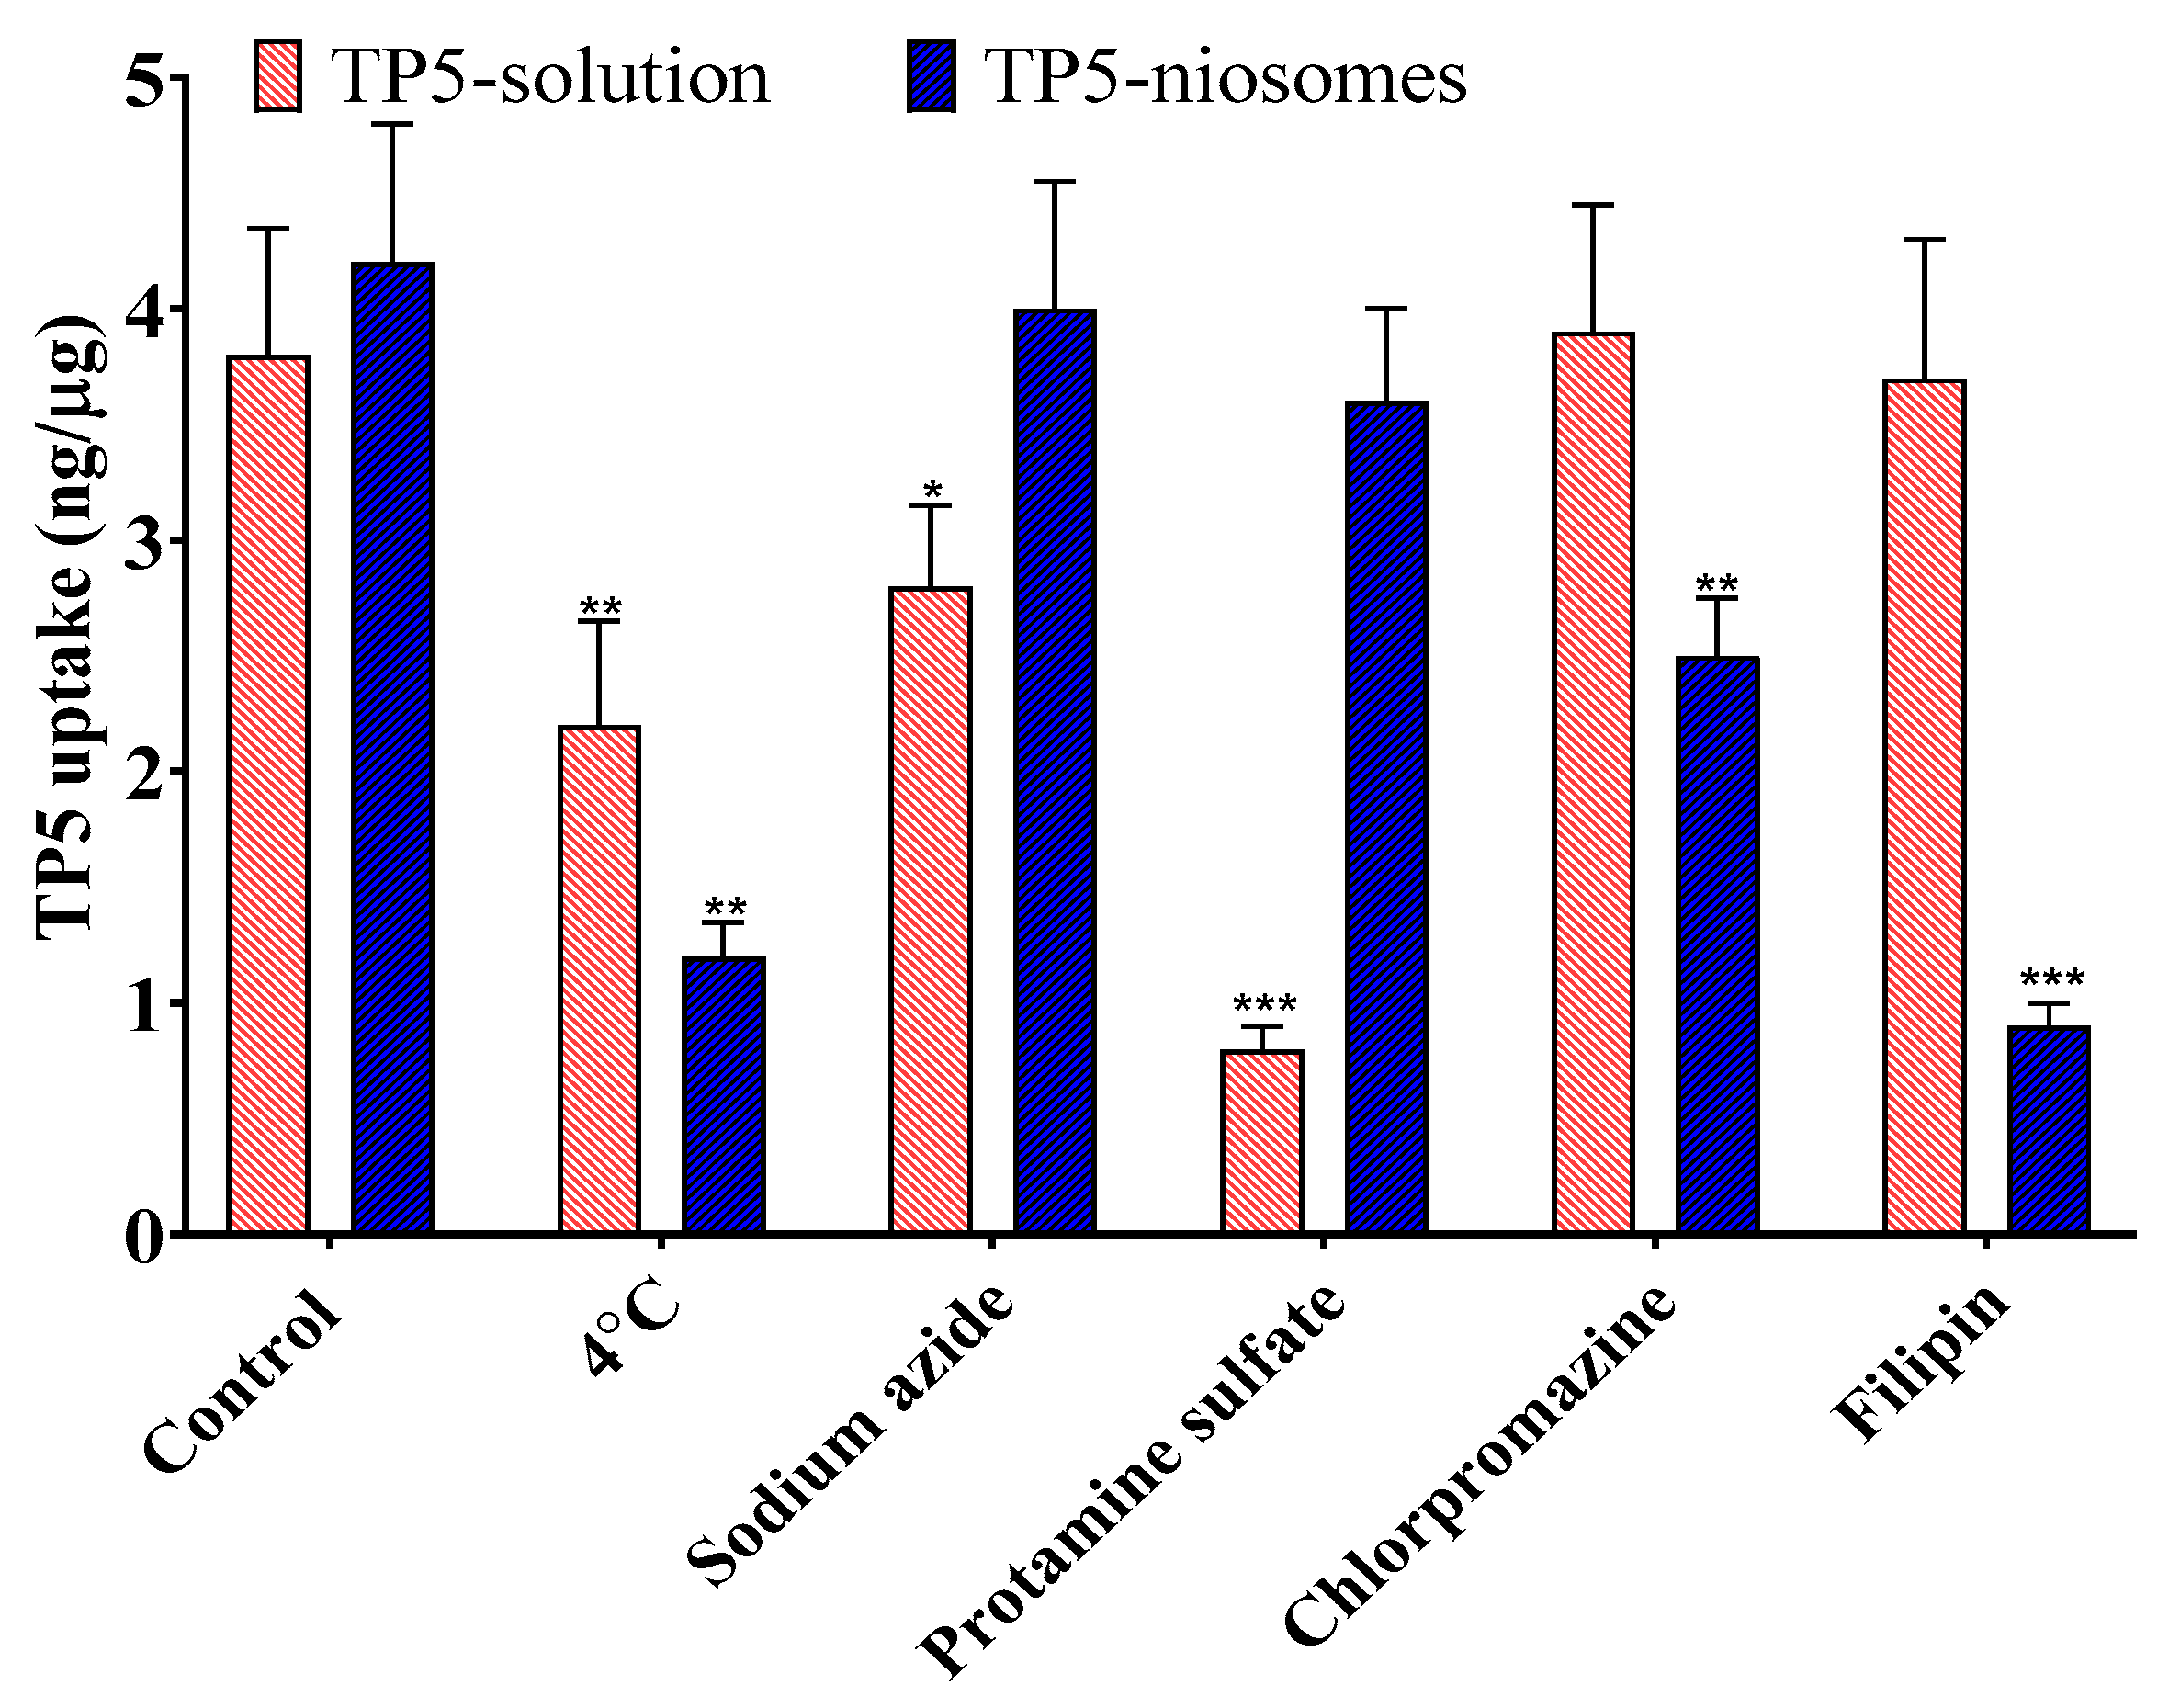
Cellular Uptake Mechanisms of TP5 and TP5-PEG-Niosomes
3.2.4. Cellular Transport
Transwell Culture and Cell Line Integrity
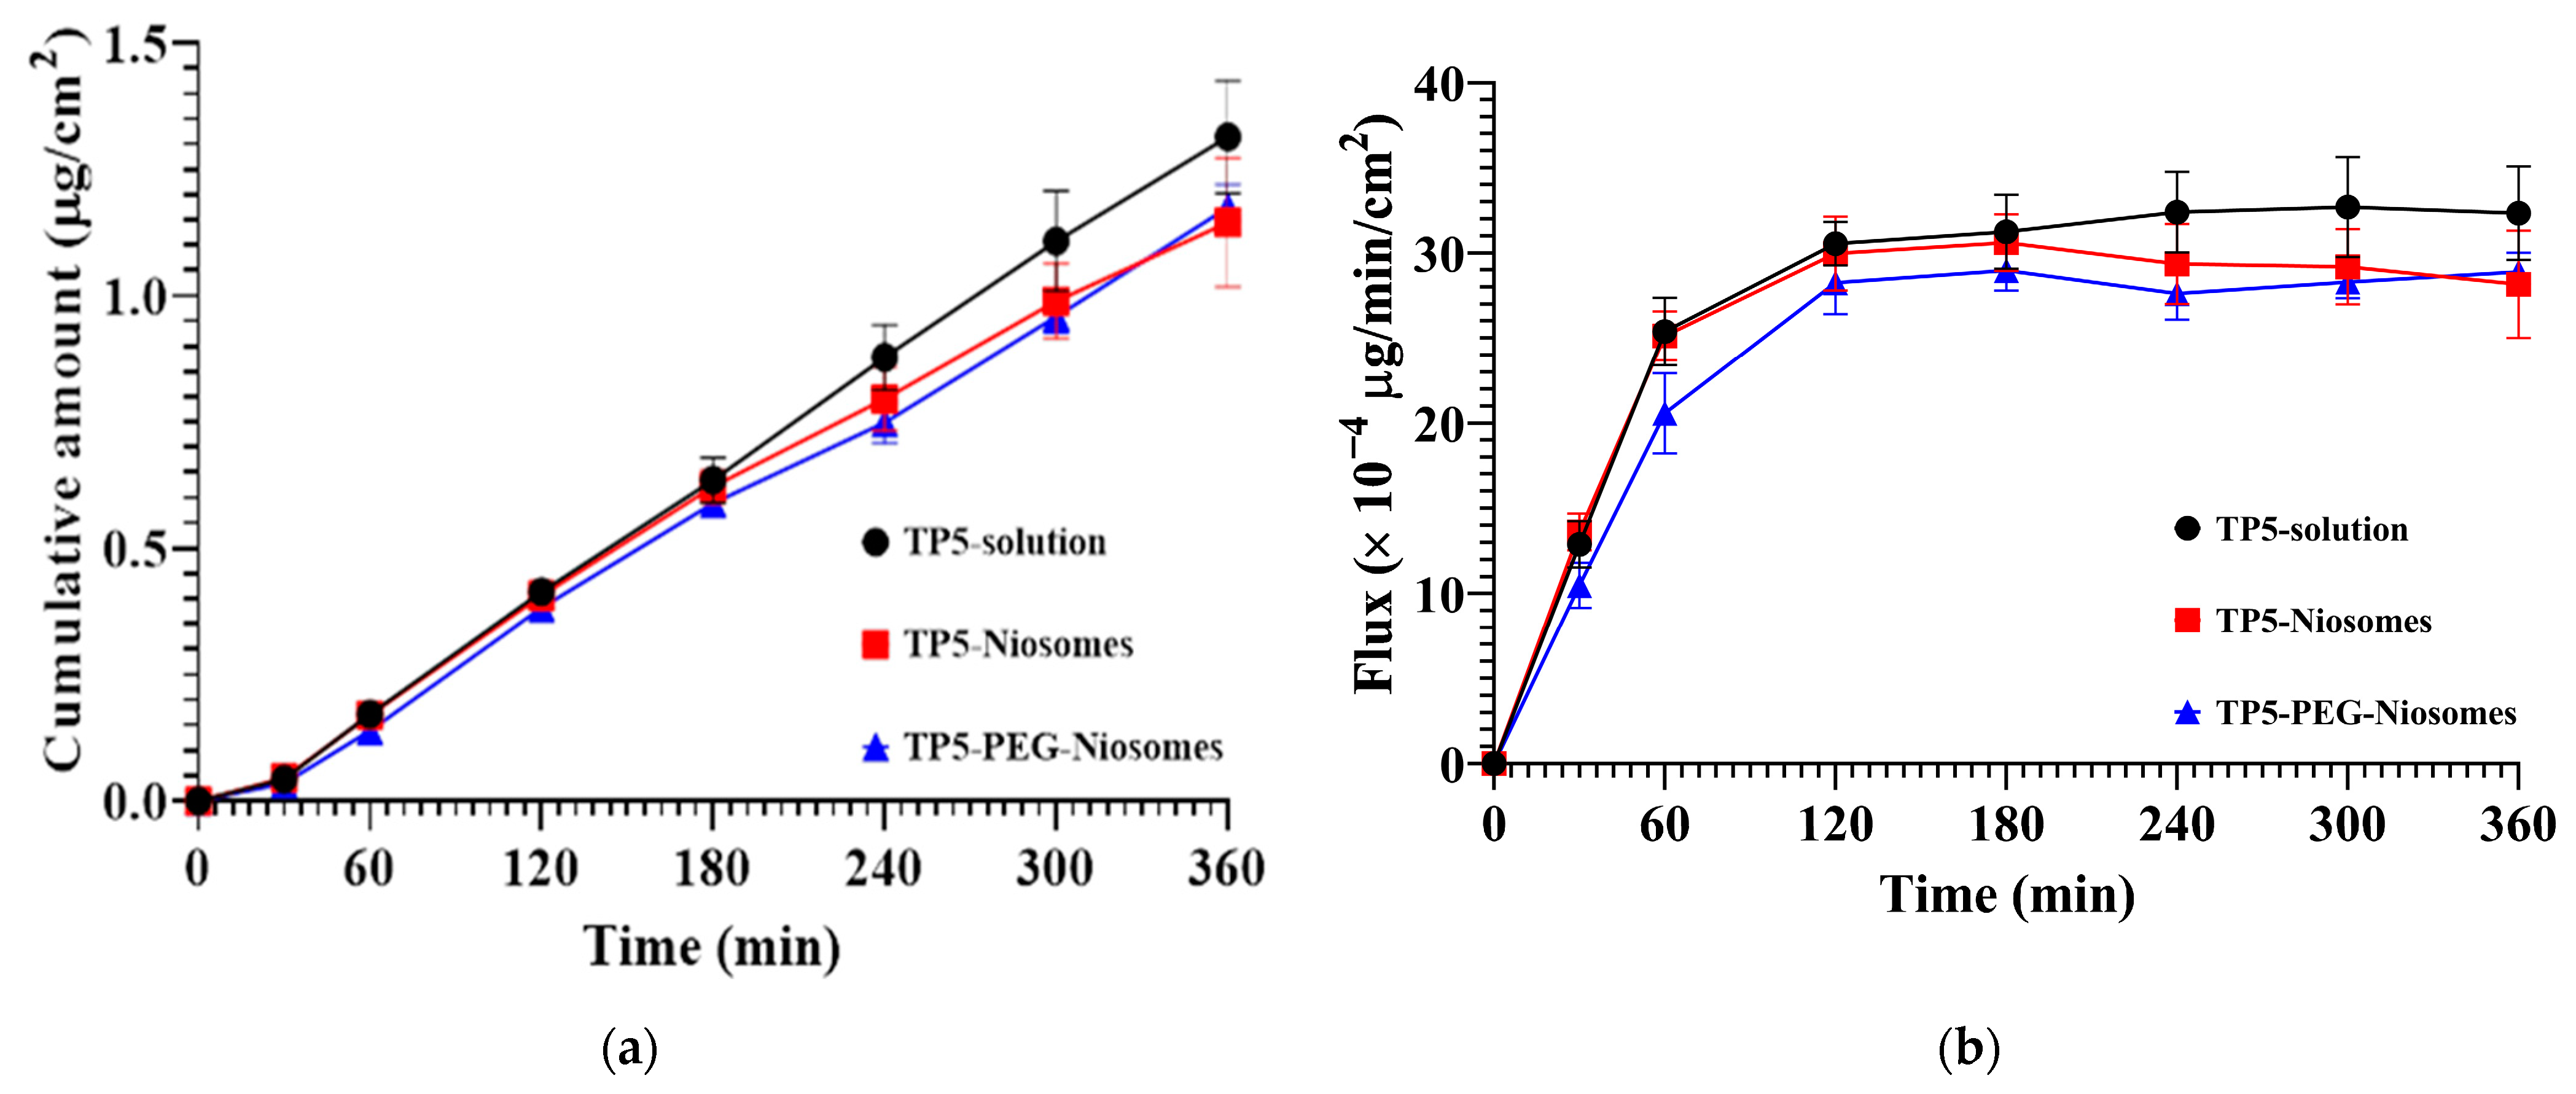
Transepithelial Transport of TP5 and TP5-PEG-Niosomes
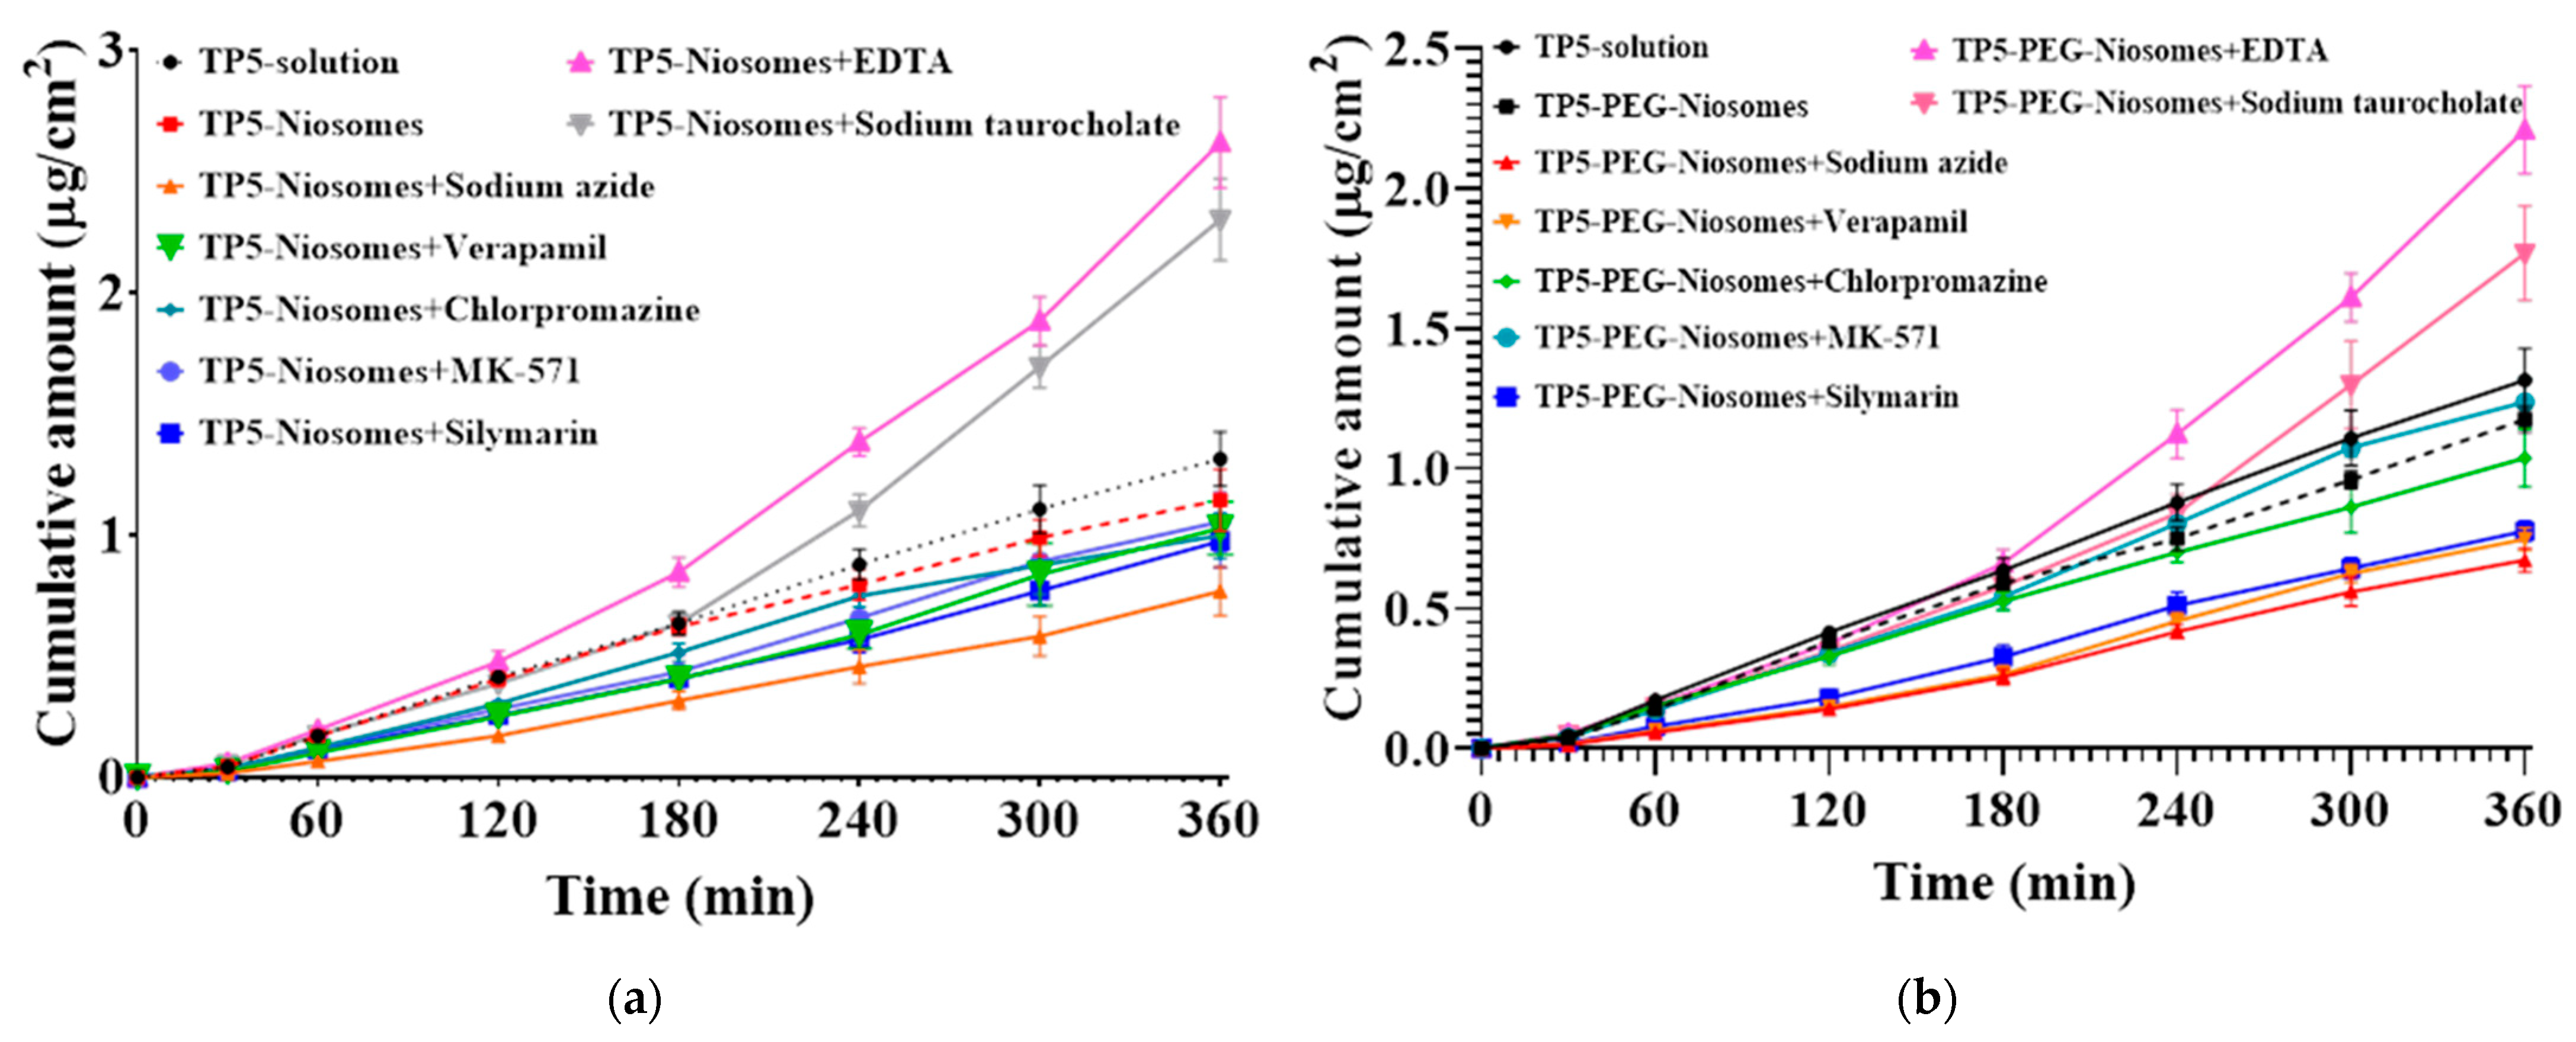
Cellular Transport Mechanism of TP5 and TP5-PEG-Niosomes
4. Conclusions
Author Contributions
Funding
Institutional Review Board Statement
Informed Consent Statement
Data Availability Statement
Conflicts of Interest
References
- Ferreira, S.A.; Gama, F.M.; Vilanova, M. Polymeric Nanogels as Vaccine Delivery Systems. Nanomed. Nanotechnol. Biol. Med. 2013, 9, 159–173. [Google Scholar] [CrossRef]
- Kim, Y.; Thapa, M.; Hua, D.H.; Chang, K. Biodegradable Nanogels for Oral Delivery of Interferon for Norovirus Infection. Antivir. Res. 2011, 89, 165–173. [Google Scholar] [CrossRef]
- Tischio, J.P.; Patrick, J.E.; Weintraub, H.S.; Chasin, M.; Goldstein, G. Short in Vitro Half-Life of Thymopoietin 32-36 Pentapeptide in Human Plasma. Int. J. Pept. Protein Res. 1979, 14, 479–484. [Google Scholar] [CrossRef]
- Garaci, C.R.; Torrisi, M.R.; Jezzi, T.; Frati, L.; Goldstein, A.L.; Garaci, E. Receptors for Thymosin Alpha 1 on Mouse Thymocytes. Cell. Immunol. 1985, 91, 289–293. [Google Scholar] [CrossRef]
- Singh, V.K.; Biswas, S.; Mathur, K.B.; Haq, W.; Garg, S.K.; Agarwal, S.S. Thymopentin and Splenopentin as Immunomodulators—Current Status. Immunol. Res. 1998, 17, 345–368. [Google Scholar] [CrossRef]
- Zhang, R.; Jiao, Q.; Wang, B. Controlled Clinical Study on 49 Patients of SARS Treated by Integrative Chinese and Western Medicine. Zhongguo Zhong Xi Yi Jie He Za Zhi Chin. J. Integr. Tradit. West. Med. 2003, 23, 654–657. [Google Scholar]
- Ahlstrom, L.A.; Cross, S.E.; Mills, P.C. The Effects of Freezing Skin on Transdermal Drug Penetration Kinetics. J. Vet. Pharmacol. Ther. 2007, 30, 456–463. [Google Scholar] [CrossRef]
- Shah, A.K.; Wei, G.; Lanman, R.C.; Bhargava, V.O.; Weir, S.J. Percutaneous Absorption of Ketoprofen from Different Anatomical Sites in Man. Pharm. Res. 1996, 13, 168–172. [Google Scholar] [CrossRef] [PubMed]
- Nielsen, J.B.; Plasencia, I.; Sørensen, J.A.; Bagatolli, L.A. Storage Conditions of Skin Affect Tissue Structure and Subsequent in Vitro Percutaneous Penetration. Skin. Pharmacol. Physiol. 2011, 24, 93–102. [Google Scholar] [CrossRef] [PubMed]
- Liu, M.; Svirskis, D.; Proft, T.; Loh, J.M.S.; Wen, J. Preformulation Studies of Thymopentin: Analytical Method Development, Physicochemical Properties, Kinetic Degradation Investigations and Formulation Perspective. Drug Dev. Ind. Pharm. 2022, 47, 1680–1692. [Google Scholar] [CrossRef] [PubMed]
- Liu, M.; Sharma, M.; Lu, G.; Zhang, Z.; Yin, N.; Wen, J. Full Factorial Design, Physicochemical Characterization, Ex Vivo Investigation, and Biological Assessment of Glutathione-Loaded Solid Lipid Nanoparticles for Topical Application. Int. J. Pharm. 2023, 630, 122381. [Google Scholar] [CrossRef]
- Liu, M.; Wen, J.; Sharma, M. Solid Lipid Nanoparticles for Topical Drug Delivery: Mechanisms, Dosage Form Perspectives, and Translational Status. Curr. Pharm. Des. 2020, 26, 3203–3217. [Google Scholar] [CrossRef] [PubMed]
- Liu, M.; Chen, S.; Zhang, Z.; Li, H.; Sun, G.; Yin, N.; Wen, J. Anti-Ageing Peptides and Proteins for Topical Applications: A Review. Pharm. Dev. Technol. 2022, 27, 108–125. [Google Scholar] [CrossRef] [PubMed]
- Li, D.; Martini, N.; Liu, M.; Falconer, J.R.; Locke, M.; Wu, Z.; Wen, J. Non-Ionic Surfactant Vesicles as a Carrier System for Dermal Delivery of (+)-Catechin and their Antioxidant Effects. J. Drug Target. 2021, 29, 310–322. [Google Scholar] [CrossRef] [PubMed]
- Wang, L.; Zhang, Y.; Tang, X. Characterization of a New Inhalable Thymopentin Formulation. Int. J. Pharm. 2009, 375, 1–7. [Google Scholar] [CrossRef] [PubMed]
- Wei, T.; Thakur, S.S.; Liu, M.; Wen, J. Oral Delivery of Glutathione: Antioxidant Function, Barriers and Strategies. Acta Mater. Medica 2022, 1, 177–192. [Google Scholar] [CrossRef]
- Al Gailani, M.; Liu, M.; Wen, J. Ligands for Oral Delivery of Peptides Across the Blood-Brain-Barrier. Acta Mater. Med. 2022, 1, 106–123. [Google Scholar] [CrossRef]
- Diwan, M.; Park, T.G. Pegylation Enhances Protein Stability during Encapsulation in PLGA Microspheres. J. Control. Release 2001, 73, 233–244. [Google Scholar] [CrossRef]
- Perry, J.L.; Reuter, K.G.; Kai, M.P.; Herlihy, K.P.; Jones, S.W.; Luft, J.C.; Napier, M.; Bear, J.E.; DeSimone, J.M. PEGylated PRINT Nanoparticles: The Impact of PEG Density on Protein Binding, Macrophage Association, Biodistribution, and Pharmacokinetics. Nano Lett. 2012, 12, 5304–5310. [Google Scholar] [CrossRef]
- Firozian, F.; Karami, S.; Ranjbar, A.; Azandaryani, M.T.; Nili-Ahmadabadi, A. Improvement of Therapeutic Potential N-Acetylcysteine in Acetaminophen Hepatotoxicity by Encapsulation in PEGylated Nano-Niosomes. Life Sci. 2020, 255, 117832. [Google Scholar] [CrossRef]
- Ruhnau, J.; Parczyk, J.; Danker, K.; Eickholt, B.; Klein, A. Synergisms of Genome and Metabolism Stabilizing Antitumor Therapy (GMSAT) in Human Breast and Colon Cancer Cell Lines: A Novel Approach to Screen for Synergism. BMC Cancer 2020, 20, 617. [Google Scholar] [CrossRef]
- Volpe, D.A. Advances in Cell-Based Permeability Assays to Screen Drugs for Intestinal Absorption. Expert Opin. Drug Discov. 2020, 15, 539–549. [Google Scholar] [CrossRef] [PubMed]
- Yao, X.; Bunt, C.; Liu, M.; Quek, S.; Shaw, J.; Cornish, J.; Wen, J. Enhanced Cellular Uptake and Transport of Bovine Lactoferrin using Pectin- and Chitosan-Modified Solid Lipid Nanoparticles. Pharmaceutics 2023, 15, 2168. [Google Scholar] [CrossRef] [PubMed]
- Liu, M.; Svirskis, D.; Proft, T.; Loh, J.; Chen, S.; Kang, D.; Wen, J. Exploring Ex Vivo Peptideolysis of Thymopentin and Lipid-Based Nanocarriers Towards Oral Formulations. Int. J. Pharm. 2022, 625, 122123. [Google Scholar] [CrossRef] [PubMed]
- Zhang, L.; Wei, X.; Zhang, R.; Petitte, J.N.; Si, D.; Li, Z.; Cheng, J.; Du, M. Design and Development of a Novel Peptide for Treating Intestinal Inflammation. Front. Immunol. 2019, 10, 1841. [Google Scholar] [CrossRef]
- Brunkard, J.O.; Xu, M.; Scarpin, M.R.; Chatterjee, S.; Shemyakina, E.A.; Goodman, H.M.; Zambryski, P. TOR Dynamically Regulates Plant Cell–cell Transport. Proc. Natl. Acad. Sci. USA 2020, 117, 5049–5058. [Google Scholar] [CrossRef]
- Wan, S.; Zhang, L.; Zhang, X. An ATP-Regulated Ion Transport Nanosystem for Homeostatic Perturbation Therapy and Sensitizing Photodynamic Therapy by Autophagy Inhibition of Tumors. ACS Cent. Sci. 2019, 5, 327–340. [Google Scholar] [CrossRef]
- Eom, H.; Choi, J. Clathrin-Mediated Endocytosis is Involved in Uptake and Toxicity of Silica Nanoparticles in Caenohabditis Elegans. Chem. Biol. Interact. 2019, 311, 108774. [Google Scholar] [CrossRef]
- Yu, Q.; Liu, M.; Wu, S.; Wei, X.; Xiao, H.; Yi, Y.; Cheng, H.; Wang, S.; Zhang, Q.; Qin, Q.; et al. Specific Aptamer-Based Probe for Analyzing Biomarker MCP Entry into Singapore Grouper Iridovirus-Infected Host Cells via Clathrin-Mediated Endocytosis. Front. Microbiol. 2020, 11, 1206. [Google Scholar] [CrossRef] [PubMed]
- Han, B.; Xie, W.; Zhang, Y.; Zhou, S.; Yang, J.; Wang, R.; Sun, Y.; Wang, X.; Xu, J.; Chen, D.; et al. The Influx/Efflux Mechanisms of D-Peptide Ligand of nAChRs Across the Blood–brain Barrier and its Therapeutic Value in Treating Glioma. J. Control. Release 2020, 327, 384–396. [Google Scholar] [CrossRef] [PubMed]
- Selo, M.A.; Delmas, A.; Springer, L.; Zoufal, V.; Sake, J.A.; Clerkin, C.G.; Huwer, H. Tobacco Smoke and Inhaled Drugs Alter Expression and Activity of Multidrug Resistance-Associated Protein-1 (MRP1) in Human Distal Lung Epithelial Cells in vitro. Front. Bioeng. Biotechnol. 2020, 8, 1030. [Google Scholar] [CrossRef] [PubMed]
- Xie, Y.; Zhang, D.; Zhang, J.; Yuan, J. Metabolism, Transport and Drug–Drug Interactions of Silymarin. Molecules 2019, 24, 3693. [Google Scholar] [CrossRef]
- Jaradat, A.; Macedo, M.H.; Sousa, F.; Arkill, K.; Alexander, C.; Aylott, J.; Sarmento, B. Prediction of the Enhanced Insulin Absorption Across a Triple Co-Cultured Intestinal Model using Mucus Penetrating PLGA Nanoparticles. Int. J. Pharm. 2020, 585, 119516. [Google Scholar] [CrossRef] [PubMed]
- Maruyama, M.; Nishida, Y.; Tanaka, H.; Minami, T.; Ogawara, K.; Miyake, M.; Takamura, Y.; Kakuta, H.; Higaki, K. Analysis of Absorption-Enhancing Mechanisms for Combinatorial use of Spermine with Sodium Taurocholate in Caco-2 Cells. Eur. J. Pharm. Biopharm. 2022, 180, 332–343. [Google Scholar] [CrossRef] [PubMed]
- Yoshida, S.; Miwa, H.; Kawachi, T.; Kume, S.; Takahashi, K. Generation of Intestinal Organoids Derived from Human Pluripotent Stem Cells for Drug Testing. Sci. Rep. 2020, 10, 5989. [Google Scholar] [CrossRef]
- Araujo, M.; Beekman, J.K.; Mapa, M.S.T.; MacMahon, S.; Zhao, Y.; Flynn, T.J.; Flannery, B.; Mossoba, M.E.; Sprando, R.L. Assessment of Intestinal Absorption/Metabolism of 3-Chloro-1,2-Propanediol (3-MCPD) and Three 3-MCPD Monoesters by Caco-2 Cells. Toxicol. Vitr. 2020, 67, 104887. [Google Scholar] [CrossRef]
- Tremmel, M.; Kiermaier, J.; Heilmann, J. In Vitro Metabolism of Six C-Glycosidic Flavonoids from Passiflora incarnata L. Int. J. Mol. Sci. 2021, 22, 6566. [Google Scholar] [CrossRef]
- Smit, B.; Chinaka, C.C.; Scott, A.A.; Gaiduschek, K.; Hatje, E.; Kuballa, A.; Coulson, S.; Finlayson, W.; Katouli, M. Efficacy of Selected Live Biotherapeutic Candidates to Inhibit the Interaction of an Adhesive-Invasive Escherichia Coli Strain with Caco-2, HT29-MTX Cells and their Co-Culture. Biomedicines 2022, 10, 2245. [Google Scholar] [CrossRef]
- Lv, Q.; He, Q.; Wu, Y.; Chen, X.; Ning, Y.; Chen, Y. Investigating the Bioaccessibility and Bioavailability of Cadmium in a Cooked Rice Food Matrix by using an 11-Day Rapid Caco-2/HT-29 Co-Culture Cell Model Combined with an in Vitro Digestion Model. Biol. Trace Elem. Res. 2019, 190, 336–348. [Google Scholar] [CrossRef] [PubMed]
- Lian, P.; Henricks, P.A.J.; Wichers, H.J.; Folkerts, G.; Braber, S. Differential Effects of Oligosaccharides, Antioxidants, Amino Acids and PUFAs on Heat/Hypoxia-Induced Epithelial Injury in a Caco-2/HT-29 Co-Culture Model. Int. J. Mol. Sci. 2023, 24, 1111. [Google Scholar] [CrossRef] [PubMed]
- Lian, P.; Braber, S.; Varasteh, S.; Wichers, H.J.; Folkerts, G. Hypoxia and Heat Stress Affect Epithelial Integrity in a Caco-2/HT-29 Co-Culture. Sci. Rep. 2021, 11, 13186. [Google Scholar] [CrossRef] [PubMed]
- Chen, X.; Elisia, I.; Kitts, D.D. Defining Conditions for the Co-Culture of Caco-2 and HT29-MTX Cells using Taguchi Design. J. Pharmacol. Toxicol. Methods 2010, 61, 334–342. [Google Scholar] [CrossRef] [PubMed]
- Alagawany, M.; Elnesr, S.S.; Farag, M.R.; Tiwari, R.; Yatoo, M.I.; Karthik, K.; Michalak, I.; Dhama, K. Nutritional Significance of Amino Acids, Vitamins and Minerals as Nutraceuticals in Poultry Production and Health—A Comprehensive Review. Vet. Q. 2021, 41, 1–29. [Google Scholar] [CrossRef]
- Guo, H.; Tong, Y.; Wang, H.; Zhang, J.; Li, Z.; Abbas, Z.; Yang, T.; Liu, M.; Chen, P.; Hua, Z.; et al. Novel Hybrid Peptide Cathelicidin 2 (1-13)-Thymopentin (TP5) and its Derived Peptides with Effective Antibacterial, Antibiofilm, and Anti-Adhesion Activities. Int. J. Mol. Sci. 2021, 22, 11681. [Google Scholar] [CrossRef]
- Mitina, N.; Riabtseva, A.; Paiuk, O.; Finiuk, N.; Slouf, M.; Pavlova, E.; Kobylinska, L.; Lesyk, R.; Hevus, O.; Garamus, V.; et al. Molecular Design, Synthesis, and Properties of Surface-Active Comb-Like PEG-Containing Polymers and Derived Supramolecular Structures for Drug Delivery. In Biomedical Nanomaterials; Springer International Publishing: Cham, Switzerland, 2021; pp. 17–57. [Google Scholar]
- Ogunjobi, J.K.; McElroy, C.R.; Clark, J.H.; Thornthwaite, D.; Omoruyi, O.E.; Farmer, T.J. A Class of Surfactants via PEG Modification of the Oleate Moiety of Lactonic Sophorolipids: Synthesis, Characterisation and Application. Green Chem. 2021, 23, 9906–9915. [Google Scholar] [CrossRef]
- Zietek, T.; Giesbertz, P.; Ewers, M.; Reichart, F.; Weinmüller, M.; Urbauer, E.; Haller, D. Organoids to Study Intestinal Nutrient Transport, Drug Uptake and Metabolism—Update to the Human Model and Expansion of Applications. Front. Bioeng. Biotechnol. 2020, 8, 577656. [Google Scholar] [CrossRef]
- Zhang, X.; Li, N.; Zhang, S.; Sun, B.; Chen, Q.; He, Z.; Luo, C.; Sun, J. Emerging Carrier-free Nanosystems Based on Molecular Self-assembly of Pure Drugs for Cancer Therapy. Med. Res. Rev. 2020, 40, 1754–1775. [Google Scholar] [CrossRef]
- Li, J.; Zhang, Y.; Yu, M.; Wang, A.; Qiu, Y.; Fan, W.; Hovgaard, L.; Yang, M.; Li, Y.; Wang, R.; et al. The Upregulated Intestinal Folate Transporters Direct the Uptake of Ligand-Modified Nanoparticles for Enhanced Oral Insulin Delivery. Acta Pharm. Sin. B 2022, 12, 1460–1472. [Google Scholar] [CrossRef]
- Wright, L.; Joyce, P.; Barnes, T.J.; Lundmark, R.; Bergström, C.A.S.; Hubert, M.; Prestidge, C.A. A Comparison of Chitosan, Mesoporous Silica and Poly(Lactic-Co-Glycolic) Acid Nanocarriers for Optimising Intestinal Uptake of Oral Protein Therapeutics. J. Pharm. Sci. 2021, 110, 217–227. [Google Scholar] [CrossRef]
- Salah, E.; Abouelfetouh, M.M.; Pan, Y.; Chen, D.; Xie, S. Solid Lipid Nanoparticles for Enhanced Oral Absorption: A Review. Colloids Surf. B Biointerfaces 2020, 196, 111305. [Google Scholar] [CrossRef]
- Arai, M.; Komori, H.; Fujita, D.; Tamai, I. Uptake Pathway of Apple-Derived Nanoparticle by Intestinal Cells to Deliver its Cargo. Pharm. Res. 2021, 38, 523–530. [Google Scholar] [CrossRef]
- Clausen, A.E.; Kast, C.E.; Bernkop-Schnürch, A. The Role of Glutathione in the Permeation Enhancing Effect of Thiolated Polymers. Pharm. Res. 2002, 19, 602–608. [Google Scholar] [CrossRef]
- Wingler, K.; Müller, C.; Schmehl, K.; Florian, S.; Brigelius-Flohé, R. Gastrointestinal Glutathione Peroxidase Prevents Transport of Lipid Hydroperoxides in CaCo-2 Cells. Gastroenterology 2000, 119, 420–430. [Google Scholar] [CrossRef]
- Chen, L.; Lin, X.; Teng, H. Emulsions Loaded with Dihydromyricetin Enhance its Transport through Caco-2 Monolayer and Improve Anti-Diabetic Effect in Insulin Resistant HepG2 Cell. J. Funct. Foods 2020, 64, 103672. [Google Scholar] [CrossRef]
- Ma, Z.; Lim, L.-Y. Uptake of Chitosan and Associated Insulin in Caco-2 Cell Monolayers: A Comparison between Chitosan Molecules and Chitosan Nanoparticles. Pharm. Res. 2003, 20, 1812–1819. [Google Scholar] [CrossRef]
- Chen, X.; Wang, J.; Yang, Y.; Li, J.; Chen, Z. Natural Product as Substrates of ABC Transporters: A Review. Recent Pat. Anti-Cancer Drug Discov. 2021, 16, 222–238. [Google Scholar] [CrossRef]
- Peng, Y.; Chen, L.; Ye, S.; Kang, Y.; Liu, J.; Zeng, S.; Yu, L. Research and Development of Drug Delivery Systems Based on Drug Transporter and Nano-Formulation. Asian J. Pharm. Sci. 2020, 15, 220–236. [Google Scholar] [CrossRef] [PubMed]
- Mayati, A.; Moreau, A.; Le Vée, M.; Stieger, B.; Denizot, C.; Parmentier, Y.; Fardel, O. Protein Kinases C-Mediated Regulations of Drug Transporter Activity, Localization and Expression. Int. J. Mol. Sci. 2017, 18, 764. [Google Scholar] [CrossRef] [PubMed]
- Pangeni, R.; Kang, S.; Jha, S.K.; Subedi, L.; Park, J.W. Intestinal Membrane Transporter-Mediated Approaches to Improve Oral Drug Delivery. J. Pharm. Investig. 2021, 51, 137–158. [Google Scholar] [CrossRef]
- Azman, M.; Sabri, A.H.; Anjani, Q.K.; Mustaffa, M.F.; Hamid, K.A. Intestinal Absorption Study: Challenges and Absorption Enhancement Strategies in Improving Oral Drug Delivery. Pharmaceuticals 2022, 15, 975. [Google Scholar] [CrossRef] [PubMed]
- Macedo, M.H.; Barros, A.S.; Martínez, E.; Barrias, C.C.; Sarmento, B. All Layers Matter: Innovative Three-Dimensional Epithelium-Stroma-Endothelium Intestinal Model for Reliable Permeability Outcomes. J. Control. Release 2022, 341, 414–430. [Google Scholar] [CrossRef]
- Husain, A.; Makadia, V.; Valicherla, G.R.; Riyazuddin, M.; Gayen, J.R. Approaches to Minimize the Effects of P-glycoprotein in Drug Transport: A Review. Drug Dev. Res. 2022, 83, 825–841. [Google Scholar] [CrossRef]
- Chambers, I.G.; Kumar, P.; Lichtenberg, J.; Wang, P.; Yu, J.; Phillips, J.D.; Kane, M.A.; Bodine, D.; Hamza, I. MRP5 and MRP9 Play a Concerted Role in Male Reproduction and Mitochondrial Function. Proc. Natl. Acad. Sci. USA 2022, 119, e21116171. [Google Scholar] [CrossRef] [PubMed]
- Yang, D.; Zhang, Y.; Lei, J.; Li, S.; He, L.; Tang, D.; Xu, C.; Zhang, L.; Wen, J.; Lin, H.; et al. Discovery of Fused Benzimidazole-Imidazole Autophagic Flux Inhibitors for Treatment of Triple-Negative Breast Cancer. Eur. J. Med. Chem. 2022, 240, 114565. [Google Scholar] [CrossRef] [PubMed]
- Chu, Y.; Zhu, Y.; Zhang, Y.; Liu, X.; Guo, Y.; Chang, L.; Yun, X.; Wei, Z.; Xia, Y.; Dai, Y. Tetrandrine Attenuates Intestinal Epithelial Barrier Defects Caused by Colitis through Promoting the Expression of Occludin via the AhR-miR-429 Pathway. FASEB J. 2021, 35, e21502. [Google Scholar] [CrossRef] [PubMed]
- Ren, Y.; Wu, W.; Zhang, X. The Feasibility of Oral Targeted Drug Delivery: Gut Immune to Particulates? Acta Pharm. Sin. B 2022, 13, 2544–2558. [Google Scholar] [CrossRef] [PubMed]
- Rao, R.; Liu, X.; Li, Y.; Tan, X.; Zhou, H.; Bai, X.; Yang, X.; Liu, W. Bioinspired Zwitterionic Polyphosphoester Modified Porous Silicon Nanoparticles for Efficient Oral Insulin Delivery. Biomater. Sci. 2021, 9, 685–699. [Google Scholar] [CrossRef]


| Transporters | Inhibitors | Function | Refs. |
|---|---|---|---|
| Active transport | Sodium azide (10–20 mM) | Adenosine triphosphate (ATP) inhibitor | [26,27] |
| Clathrin-mediated endocytosis | Chlorpromazine (10–20 μg/mL) | Clathrin-mediated endocytosis efflux inhibitor | [28] |
| Caveolae-Permeability glycoprotein (P-gp) | Verapamil (50–100 μM) | Caveolae-mediated endocytosis efflux inhibitor | [29,30] |
| Multidrug resistance-associated protein 2 (MRP2) | MK-571 (100–150 μM) | Protein and peptide transport | [31] |
| Multidrug resistance-associated protein 5 (MRP5) | Silymarin (20–40 μM) | Protein and peptide transport | [32] |
| Transport enhancer | EDTA (5–10 mM) | Penetration enhancement | [33] |
| Transport enhancer | Sodium taurocholate (10–20 mM) | Open tight junction and enhance penetration | [34] |
| Caco-2/HT29 Ratio | TEER Values (Ω cm2) |
|---|---|
| a: 1:0 | 480.8 ± 45.8 |
| b: 0:1 | 172.5 ± 18.7 |
| c: 1:1 | 341.7 ± 37.5 |
| d: 1:2 | 180.9 ± 21.8 |
| e: 1:3 | 228.4 ± 28.9 |
| f: 3:1 | 288.2 ± 22.8 |
| g: 5:1 | 335.5 ± 36.5 |
| h: 7:1 | 361.4 ± 39.7 |
| i: 9:1 | 457.3 ± 40.2 |
| Caco-2 and HT-29 | Test Day 1 | Test Day 2 | Test Day 3 |
|---|---|---|---|
| TEER (Ω cm2) | 408.2 ± 36.5 | 466.8 ± 29.8 | 485.7 ± 66.8 |
| Formulations | TP5 | TP5-Niosomes | TP5-PEG-Niosomes |
|---|---|---|---|
| Papp values (10−8 cm/s) | 5.39 ± 0.46 | 4.69 ± 0.52 | 4.81 ± 0.19 |
| Papp Values | Formulations | ||
|---|---|---|---|
| (10−8 cm/s) | TP5 | TP5-Niosomes | TP5-PEG-Niosomes |
| No treatment | 5.39 ± 0.46 | 4.69 ± 0.52 | 4.81 ± 0.19 |
| Sodium azide | 5.90 ± 0.52 | 3.15 ± 0.41 | 2.76 ± 0.18 ** |
| Verapamil | 6.03 ± 0.51 | 4.21 ± 0.45 | 3.06 ± 0.16 ** |
| Chlorpromazine | 5.73 ± 0.63 | 4.09 ± 0.39 | 4.25 ± 0.43 |
| MK571 | 5.04 ± 0.51 | 4.32 ± 0.51 | 5.07 ± 0.34 |
| Silymarin | 4.30 ± 0.55 | 4.00 ± 0.45 | 3.18 ± 0.15 |
| EDTA | 14.22 ± 0.89 ** | 10.73 ± 0.77 ** | 9.05 ± 0.64 ** |
| Sodium taurocholate | 13.36 ± 0.52 ** | 9.43 ± 0.69 ** | 7.24 ± 0.69 ** |
Disclaimer/Publisher’s Note: The statements, opinions and data contained in all publications are solely those of the individual author(s) and contributor(s) and not of MDPI and/or the editor(s). MDPI and/or the editor(s) disclaim responsibility for any injury to people or property resulting from any ideas, methods, instructions or products referred to in the content. |
© 2024 by the authors. Licensee MDPI, Basel, Switzerland. This article is an open access article distributed under the terms and conditions of the Creative Commons Attribution (CC BY) license (https://creativecommons.org/licenses/by/4.0/).
Share and Cite
Liu, M.; Svirskis, D.; Proft, T.; Loh, J.; Huang, Y.; Wen, J. Cellular Uptake and Transport Mechanism Investigations of PEGylated Niosomes for Improving the Oral Delivery of Thymopentin. Pharmaceutics 2024, 16, 397. https://doi.org/10.3390/pharmaceutics16030397
Liu M, Svirskis D, Proft T, Loh J, Huang Y, Wen J. Cellular Uptake and Transport Mechanism Investigations of PEGylated Niosomes for Improving the Oral Delivery of Thymopentin. Pharmaceutics. 2024; 16(3):397. https://doi.org/10.3390/pharmaceutics16030397
Chicago/Turabian StyleLiu, Mengyang, Darren Svirskis, Thomas Proft, Jacelyn Loh, Yuan Huang, and Jingyuan Wen. 2024. "Cellular Uptake and Transport Mechanism Investigations of PEGylated Niosomes for Improving the Oral Delivery of Thymopentin" Pharmaceutics 16, no. 3: 397. https://doi.org/10.3390/pharmaceutics16030397