Abstract
The automotive sector’s transition to Battery Electric Vehicles (BEVs) requires extensive deployment of additional charging infrastructure. To determine optimal new locations, planners consider and rate a multitude of factors that influence the charging demand at candidate sites. Researchers have proposed a variety of placement criteria and methods to automate site selection. However, no common set of criteria has emerged. In addition, due to the lack of usage data, the applicability of existing criteria remains unclear. Therefore, the goals of this article are to extract the most relevant factors from literature and to evaluate their ability to characterize charging point usage. First, we review the literature base to collect, analyze, and cluster existing influencing factors and to analyze how they affect charging demand. Second, we conduct a case study using real-life charging station data from Hamburg, Germany. Based on the extracted influencing factors, we identify four clusters within Hamburg’s public charging infrastructure. While the mean performance indicators duration, daily transactions, and connection ratio hardly differ among these clusters, the temporal occupancy curves clearly show distinct charging behavior for each cluster. This work contributes to the state of the art by structuring the diverse landscape of charging station location placement criteria, by deriving a set of measurable influencing factors, and by analyzing their effect on a location’s charging demand, yielding an open source data set of charging point usage.
1. Introduction and Motivation
With the Paris Agreement of 2015, policy-makers all over the world have acknowledged climate change as a phenomenon of global importance and committed themselves to a reduction of greenhouse gas emissions in order to retain global warming to less than 2 °C in comparison to pre-industrial levels [1]. Especially the transportation sector, which is a significant driver of CO2 emissions, experiences massive restructuring. One of the most notable efforts is the phase out of fossil-fueled vehicles in new cars, which researchers believe to be a key step in the decarbonization of the transport sector [2]. Alternative fuel vehicles like BEV step up to replace conventional ones. Current research indicates that Public Electric Vehicle Charging Infrastructure (PEVCI) is a means of enabling and promoting BEV. Hence, it is an important factor to attract the majority of residents to BEV [3] and many countries have put support programs for Public Electric Vehicle Charging Infrastructure (PEVCI) in place.
In order to allocate resources efficiently during large scale deployment of PEVCI, decision-makers rely on guidelines that help to determine optimal charging station sites, numbers, and specifications. This is especially true for urban areas, in which public space is a scarce resource that has to be shared between manifold interests. Thus, in Germany as well as in many other countries, a number of hands-on guidelines issued by governmental organizations propose important factors to consider when placing PEVCI [4,5,6]. In addition to these guidelines, the scientific community has contributed vastly to the topic of charging infrastructure location planning [7,8]. Consequently, a diverse landscape of methods, modeling styles, optimization techniques and design objectives has emerged.
Within the manifold publications on the topic, researchers consider a great variety of aspects that impact the optimal roll-out of PEVCI. Therefore, a structured overview of existing placement criteria is needed to identify the most relevant set of criteria and reduce ambiguity and complexity of regarded factors. Hence, this article collects, groups, and analyzes placement criteria identified in PEVCI technical guidelines and scientific publications with the aim of supplying a comprehensive overview for researchers and decision-makers.
For a clearer understanding of existing placement criteria, we distinguish between two related terms: influencing factors and metrics. We define influencing factors as general factors that affect the charging station location decision. Metrics are then used for the quantitative assessment of influencing factors. Thus, a metric is a numerical variable that describes the nature and extent of an influencing factor.
Employing this terminology, the main contributions of this article are:
- A detailed overview of existing influencing factors and associated metrics concerning the demand-oriented placement of PEVCI.
- A list of 15 core aspects regarding the placement of PEVCI, representing the most commonly addressed groups of influencing factors.
- A taxonomy of 9 lines of argumentation, describing the mechanisms by which charging demand is influenced by the identified factors.
- A case study on the city of Hamburg’s 1023 public charging points to evaluate the presumed link between influencing factors, metrics, and observed charging utilization.
- An pre-processed open source data set of the Hamburg’s public charging station usage over the period of four weeks.
- The identification of further research directions.
The remainder of this article is structured as follows: Section 2 structures and characterizes literature related to the design of PEVCI, presents a first overview of associated placement criteria, derives a problem statement from existing research gaps, and describes the concept that is used in this article to fill the identified gaps. In Section 3, influencing factors known from the literature are assessed, grouped, and linked to available metrics. Using the most prominent set of influencing factors and metrics, a case study for the city of Hamburg is presented in Section 4. Herein, the presumed linkage between influencing factors and actual charging station utilization is analyzed. The article is concluded by a summary and discussion in Section 5 and Section 6. Figure 1 depicts the presented outline of this article and briefly summarizes its main content.
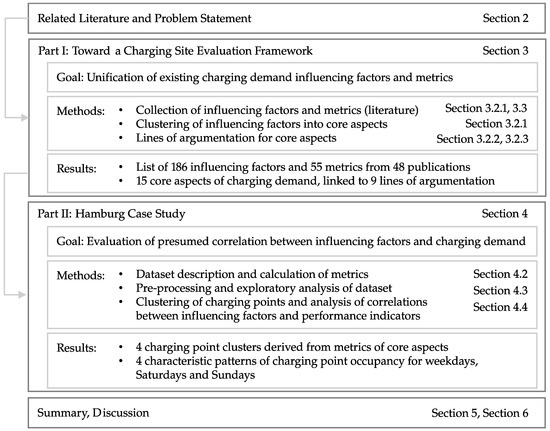
Figure 1.
Structure of this article.
2. Related Literature and Problem Statement
In recent years, an increasing number of scientific publications has addressed the issue of charging station planning. The subsequent literature review describes representative approaches for PEVCI location planning, but does not cover a holistic overview, due to the quantity of publications. The focus lies on the criteria and factors for evaluating a suitable PEVCI location, instead of a detailed outline of applied research methods.
2.1. Related Literature
During the review process, practical guidelines and scientific publications are considered. Among scientific publications, various source types can be distinguished. The following sections are structured according to the taxonomy in Figure 2.

Figure 2.
Types of literature considered in our review.
2.1.1. Practical Guidelines
Practical guidelines on the placement of PEVCI reflect the operative way PEVCI are promoted and are therefore presumed to be most applicable to the real life case. It can be assumed that they contain lessons learned from past deployment activities and that they are designed to meet the administrative and regulatory requirements of the target area.
In Germany, for instance, both local and national authorities have issued such guidelines to steer the roll-out of PEVCI: the city of Hamburg presented their strategy for PEVCI installation in 2014. They drafted an assessment matrix consisting of exclusion factors, operator related factors and user related factors [4]. As a result, planners can draw relative comparisons of different locations. Kindl et al. [6] propose a top down, demand-oriented planning methodology for cities based on traffic districts. The authors correlate four indicators of charging demand to seven area types. This allows cities to distinguish charging demand on district level without requiring traffic models. Subsequently, the specific site selection within traffic districts is proposed to take ten criteria into account. The NOW GmbH [5], a German organization which issues funding guidelines for electric mobility and charging infrastructure, published a list of twelve, partly similar, criteria. Some of the factors mentioned in practical guidelines, such as connectivity to public transport [4] or number of parking lots [6], are measurable with appropriate quantitative metrics. However, there are also qualitative factors which evoke great fuzziness regarding the decision making, for example attractiveness [4] and visibility [6].
2.1.2. User Surveys
Surveys are a user-centered way of exploring key influencing factors on the optimal placement of PEVCI. Through interviews, Philipsen et al. [9] extracted eight main evaluation criteria for fast-charging locations. In a second study, users stated their preferred location and prioritized the prior study’s established criteria [10]. The factors reliability, dual use, and accessibility were ranked as most important. However, most user opinions are of a qualitative nature and cannot directly be transferred into a charging location decision. Anderson et al. [11] proposed an approach which could solve this issue by enabling users to directly select preferred locations for charging stations. The authors conducted an online survey with 843 BEV users. This way, PEVCI could be installed, exactly where users demand it. While surveys substantially help to understand user requirements, planning PEVCI based on user opinions is impractical, because regional or even nationwide surveys would be complex. Furthermore, users cannot be expected to grasp the full extent of influencing factors from multiple areas and might thereby miss crucial aspects, leading to partial advantages of strategic roll-out schemes over user-oriented pull strategies [12].
2.1.3. Expert Interviews
In contrast to users, experts deal with the topic of charging station planning more frequently and can contribute in a broader way to site selection decisions. Expert interviews often open up the considerations to various areas such as society or ecology and include qualitative and quantitative factors that are often identified within elaborate collection, weighting, and classification schemes (ISM, MICMAC) [13]. Due to the amount and nature of the considered influencing factors, Multi Criteria Decision Making Models like VIKOR and PROMETHEE help to condensate the identified factors into an applicable ranking process [14,15]. Guo and Zhao [16] introduced eleven factors by building an sustainability-based evaluation system from literature and expert opinions. In a second step, the authors used a fuzzy method for ranking alternative PEVCI locations according to experts’ views. Wu et al. [14] published a similar approach. Besides the factor groups used by Guo et al. [16], economic, social, and environmental factors, Wu et al. [14] added the areas engineering feasibility, service availability, and land factors. In total, the authors used 18 factors such as construction costs or attitude of local residents. The ratings of alternative locations were determined with the fuzzy PROMETHEE method. Zhao et al. [15] derived four factor groups with a total of 37 sub-factors. The authors reduced these to a vital set of 13 sub-criteria applying the fuzzy Delphi method. The location decision was conducted by experts using a fuzzy VIKOR approach. Using experts’ contribution to select charging station locations allows to include qualitative measures, but it also makes the comparison of large numbers of possibilities impractical, since this would require every potential charging site to be rated individually by the experts. Aside from ranking the location options itself, expert knowledge has been harnessed by Tang et al. [17] and Erbaş et al. [18] to weight factors against each other. According to Erbaş et al. [18], BEV ownership in the area, distance to power cut, and service area population are the most important factors. Tang et al. [17] list total cost of construction, main roads, and power grid safety as top factors. Wu and Niu [13] presented a methodology to examine underlying interrelationships of influencing factors. Using ISM and fuzzy MICMAC, they evaluated 12 previously selected factors.
2.1.4. Optimization and Assessment
Adding to the pool of influencing factors from guidelines, user surveys, and expert interviews are contributions aimed at the optimization and assessment of PEVCI [8,19,20,21,22,23,24,25,26,27,28,29,30,31,32,33,34]. They constitute the largest body of literature in this review. Assessments of PEVCI comprise works in which simulations aid the analysis of existing or hypothetical infrastructures, demand estimations as well as the analysis of real-life usage data. Manifold scholars have dealt with the optimization of PEVCI, usually based on assessments or modelings of the domain. Hence, depending on the scope of works in this type of literature, motives of analysis and optimization are often intermingled and are thus referred to in one single category for the scope of this article. Despite the relationship of contributions in this category, the way influencing factors are considered varies widely among the literature. While the analysis of studies focused on the explicit estimation of charging demand often yields verbatim influencing factors, not all of the aforementioned publications formulate explicit influencing factors on the charging demand. Instead, objective functions of mathematical models, entities modeled in simulations, or the most promising predictors in utilization regression studies provide insights into the sources of charging demand and were therefore extracted as influencing factors by the authors of this contribution.
Independent of the specific type of publication, two prominent perspectives—flow-based and node-based—form the basis for the modeling or simulation of charging demand. Flow-based studies arrange PEVCI in a way which maximizes the flow of passing vehicles at the charging sites. This idea builds upon the flow capturing location model outlined by Hodgson [35]. Under the assumption that charging demand correlates with network traffic, the main influencing factor considered in these approaches is the traffic volume at or near candidate sites. Consequently, flow-based approaches have often been applied to stop and charge situations like highway corridors and fast-charging infrastructure [22,23]. Nevertheless, flow-based approaches also consider additional influencing factors. For instance, He et al. [36] formulate their objective function to minimize social costs, defined as the total driving time, recharging time, and the inconvenience cost caused by missed trips. Gkatzoflias et al. [25] plan infrastructure on regional and national level with the objective to place charging sites within a required distance. Csonka et al. [20] consider traffic volume, service level and a constraint for existing charging stations within range. Consequently, both publications constrain candidate sites to gas and service stations to leverage existing distribution structures. While flow-based models have also been applied to urban PEVCI design [24,37], Upchurch and Kuby [38] find that node-based models are more suitable for urban environments. In contrast to flow-based placement models, node-based approaches model charging demand to be concentrated in demand nodes. These nodes constitute locations of the planning domain for which charging demand can be estimated in an absolute or relative fashion. Hence, node-based approaches assume a discrete planning domain by associating charging demand with spatial locations that are representative of their direct proximity. Depending on the perspective, demand nodes can be located in predetermined candidate sites [27], regular evaluation grids [21] or in the centroids of areas like administrative units and travel analysis zones [19]. Once a set of node positions and demand estimates is available, charging station locations can be placed at the highest demand nodes or, in case of high spatial resolutions, such that the charging station catchment areas cover as much of the estimated demand as possible. Since the key to these kinds of approaches is a precise node-based demand estimation, authors have identified a large set of factors influencing the potential spatial charging demand. In addition, within node-based contributions, non-demand focused influencing factors relevant to the overall decision process have been identified as well.
2.1.5. Reviews
The preceding literature comprises influencing factors of qualitative and quantitative nature with a great quantity and variety. While we have considered a great number of sources on the matter, a comprehensive review escapes the scope of this article. To mitigate possible shortcomings, existing reviews are taken into consideration in addition to the aforementioned primary literature sources. Although, to the best of our knowledge, no previous review has explicitly addressed the question of demand influencing factors comprehensively, existing reviews serve as multiplicators for our literature survey. We include referenced influencing factors, as well as contributions through the reviews themselves in our analysis.
Shareef et al. [39] review optimization techniques for the placement and sizing of PEVCI. Zhang et al. [40] describe influencing factors as “the basic premise of site selection decision”. The authors divide influencing factors into charging station’s own factors, such as construction cost, consumer factors, such as travel behavior or charging demand and supplier factors, such as power grid distribution or grid loss. Deb et al. [7] introduce a categorization of three approaches regarding the consideration of the transportation network, the distribution network, or both. The authors outline that the majority of transportation network models target cost reduction and EV flow improvement. Further objectives are distance, tour time, and covered trips. Most distribution network models aim for costs and net optimization. Furthermore, local constraints like voltage limits influence the PEVCI. Deb et al. summarize the findings in a list of eleven objectives and six constraints. Pagany et al. [41] examine a vast body of publications that uses empirical data and assigns those to one or multiple target criteria in a list of eleven objectives. Their overview shows the variety of unique target criteria combinations.
2.2. Problem Statement and Concept Description
Ideally, planning of new PEVCI installations would include knowledge of actual future charging demand in kWh with a high spatial and temporal resolution. This would require extensive knowledge of citizens’ mobility patterns, charging behavior, and BEV adoption rates. Alternatively, usage data from existing PEVCI in close-by locations allows assumptions on future charging demand. Nevertheless, especially in early stages of PEVCI installation, cities cannot draw from past usage data. Therefore, planners and researchers have come up with indicators for charging demand. Our literature review showed a great diversity and fuzziness of proposed influencing factors in the current research landscape. Furthermore, it is evident that no common set of influencing factors has emerged from the literature base so far.
User surveys contribute to understanding qualitative influencing factors of BEV users. Current research uses expert interviews and opens up the considerations to areas such as social factors or engineering feasibility. Fuzzy methods are used to quantify qualitative measures. However, evaluating large numbers of PEVCI options manually is impractical. Hence, scientists propose optimization and assessment approaches to support planning with automation. Multi-objective optimization models allow to include factors from various perspectives such as transport and electricity. We focused our analysis on the area of charging demand, as numerous publications evaluate PEVCI sites this way [41]. Demand is estimated from a flow-based or node-based perspective. Often, Point of Interest (POI) is included as an influencing factor for parking behavior and potential charging demand in accordance with current user habits. Yet, even on this level of the analysis, POI groups and considered POI differ. Clear metrics as quantifiers of influencing factors are still to be established. Charging infrastructure planning will remain divergent until we take a step toward a common set of target criteria. Only then will it be possible to extract the most influential and suitable factors from the list of suggestions throughout scientific publications.
Hence, this paper collects, clusters, and visualizes existing influencing factors and related metrics. We aim at providing a transparent base for further investigation and discussion toward an effective evaluation framework of PEVCI.
3. Toward a Charging Site Evaluation Framework
Based on the exploratory literature review presented in Section 2, we collected, analyzed, and structured influencing factors in a systematic literature analysis. A summary and explanation of our approach is in presented in Section 3.1. The results in Section 3.2 are a list of influencing factors, which are clustered into core aspects and augmented by an abstraction of their lines of argumentation by analyzing the underlying mechanisms affecting the charging demand. Finally, Section 3.3 contains an overview of metrics describing influencing factors quantitatively at a specific location. With these results at hand, Section 4 presents a case study which is used to reveal connections between the most prominent influencing factors and observed PEVCI utilization.
3.1. General Approach
Figure 3 summarizes our approach. The first step (1) is collecting influencing factors with a focus on static, charging demand related factors. Section 2 already addressed a range of exemplary factors. Time-dependent factors, such as number of customers, or non-demand-related factors, such as grid connection cost, are filtered out of the collection. We categorize the extracted factors into two types (2): influencing factors themselves and metrics as a measurable representation of a factor. Subsequently, we cluster the collected factors into core aspects (3) by unifying the formulation and subject of similar factors. We adopt the terms which are most often used by different authors and assigned divergent formulations to a core aspect, when suitable. Although we try to follow the reasoning given in the publications carefully, the results can be biased by our interpretation. To examine the underlying mechanisms of the influencing factors’ effect on charging demand, we identify lines of argumentation for all factors (4). Lastly, we structure the results by linking influencing factors with core aspects, lines of argumentation, and metrics (5). In the next section, the results of each step and the developed static, charging demand related site evaluation framework are presented, analyzed, and illustrated (Section 3.2).
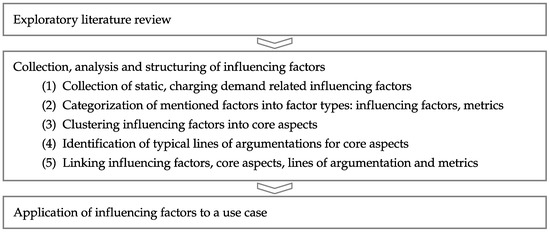
Figure 3.
Approach for the static, charging demand related site evaluation framework.
3.2. Influencing Factors, Core Aspects, and Lines of Argumentation
This section presents the resulting influencing factor framework including its core aspects, lines of argumentation for planning, and possible metrics. The whole table containing all factors and their links can be accessed as a digital attachment at https://github.com/TUMFTM/Hamburg-Public-Charging-Station-Utilization (accessed on 20 February 2022). More condensed results are extracted from the table and are discussed in this section following the logic of our approach.
3.2.1. Collection, Categorization, and Clustering of Factors—Steps 1–3
In total, 241 relevant items from 48 publications were collected from the literature base (step (1)). Among these are 186 static, demand-related influencing factors and 55 metrics (step (2)). The clustering result from step (3) with 15 identified core aspects is shown in Table 1. The aspects Residential Population, POI, and Parking Situation are mentioned most frequently in our literature body, while Centrality, Safety, and Visibility are included the least.

Table 1.
Core aspect frequency.
To analyze the variety of factors in the existing publications in more detail, Table 2 contains the analyzed papers with their respective mentioned factors. Forty-one out of forty-eight publications consider a unique set of core aspects. In two instances, authors consider influencing factors from the same single core aspect: Pallonetto et al. [42] mention presence of shopping centers and commercial areas and Wagner et al. [43] mention presence of food, museum, and health POI, which were both assigned to the core aspect POI. The second example is Surrounding Street Network mentioned by Tang et al. [17] and Guo and Zhao [16]. However, looking at the considered influencing factors, differences appear. Tang et al. [17] consider main roads, lane crossings, and road conditions whereas Guo and Zhao [16] refer to traffic convenience. Both works consider further non-static, non-demand-related factors. Furthermore, there are some publications with similar core aspect combinations and small differences. Bian et al. [44] and Wu et al. [14] mention three static, demand-related core aspects. The authors consider factors from Other CIS and Land Use. Bian et al. [44] additionally refer to Traffic Flow, while [14] employs factors belonging to the core aspect Surrounding Street Network. Even within their shared core aspects, the authors do not apply the same terminology for their influencing factors. Other examples of high similarity are the contributions of Wirges [45] and Gkatzoflias et al. [25] as well as the “Masterplan Ladeinfrastruktur” [4], Kindl et al. [6], and guidelines issued by the NOW Gmbh [5]. Table 3 contains all influencing factors clustered according to the matched core factors to analyze the denotation of factors in the literature. The table shows that some aspects are used with more unanimous terms than others. For example, six of eight mentions of the core aspect Accessibility use the term accessibility, the other two denotations are unrestricted access and public access. Other aspects, such as POI or Residential Population, include a variety of terms, shedding light on the different nuances and sub-factors of these aspects. Some aspects are difficult to assign and the associated influencing factors remain partly heterogeneous, because of a high variety and ambiguity of the expressions. For example, this applies to the aspects Dwell Characteristics and Parking Situation. Furthermore, some core aspects such as Coverage and Other CIS or Dwell Characteristics and Parking Situation appear similar at first sight, but are used in different connotations. Therefore, the established lines of argumentation in step (4) help to distinguish influencing factors and core aspects more clearly and reveal the mechanisms by which individual influencing factors and their associated core aspects may influence the charging demand at a site in question.
Table 2.
Core aspects mentioned by author.
Table 3.
Influencing factors mentioned per core aspect.
3.2.2. Lines of Argumentation—Step 4
To investigate the underlying mechanisms of the influencing factors’ effect on charging demand, step (4) establishes lines of argumentation from the literature base. These lines of argumentation further specify the partly ambiguous ways in which influencing factors affect charging demand, e.g., the Parking Situation at a candidate site may be tense, indicating that a lot of activities happen in the area, which potentially increases the charging demand. At the same time, parking pressure may reduce the quality of the potential charging site due to blocked PEVCI and quarrels between users of conventional vehicles and BEV users. Even if the net effect of these influencing factors remains unclear and may be subject to further investigation, transparency about these mechanisms add to the sole listing and grouping of influencing factors and metrics.
Based on the literature analysis, we derive three main arguments for the site-specific charging demand: the Availability of a charging point, the Quality of the charging point and the Activities connected to the location. Additionally, we specify these main arguments found in the literature by nine more detailed arguments. Figure 4 visualizes the results. We assign an argumentation code to each argument to abbreviate and thus simplify the references in the digital appendix and the following tables. In the following paragraphs, the lines of argumentation are explained in more detail.

Figure 4.
Lines of argumentation for the influencing factor’s effect on charging demand.
BEV users can only charge at locations, where charging points are available. Hence, Availability includes the fundamental factor Coverage, which refers to the general existence of charging points at or near a site. At some locations, charging points are not available 24 h or are only open to a restricted clientele. Therefore, Access Restrictions at a location have a significant influence on the availability of a charging point and, hence, on the charging demand. BEV users can usually choose between multiple charging site options. Hence, they will prefer locations that provide a high Quality charging experience. This includes the Reachability of a site. People are more likely to select a charging point that can be reached well and in a short amount of time. Reachability is similar to the aforementioned Access Restrictions, but is related to easy access in contrast to general availability of access. The second line of argumentation belonging to quality is Redundancy. Redundancy extends the Coverage argument. For an individual BEV user, charging sites with multiple charging points, or other charging stations in proximity, are more appealing, because they offer back-up options in case of malfunctioning or occupied charging points. Finally, the Attractiveness of the location plays a role, as people are more likely to charge where it is safe and where there is low parking pressure. Centrality and visibility are other aspects, which can contribute to an attractive charging site. The integration of the charging process into the daily habits of BEV users can be of an advantage, even in comparison to combustion engine vehicles, because detours and waiting time for refueling can be avoided. Hence, people will charge at locations where they spend time on other activities. A common case for charging demand is charging at Home, for example overnight. BEV users will also charge at Work, in particular commuters. Furthermore, people might want to charge during other activities such as shopping, leisure or administrative activities. These locations are generally summarized as POI. Finally, proximity to Public Transport influences the charging demand, for example when people undertake a multi-modal journey.
3.2.3. Linking Argumentation Codes with Core Aspects—Step 5
The last step is linking lines of argumentation to influencing factors (step (5)). This final step is required to visualize the underlying mechanism of each influencing factor’s effect on the charging demand of a location. It is possible to assign multiple lines of argumentation to one influencing factor, because influencing factors can affect charging demand in different ways. For example number of culture, recreation, and other services [59] is linked to the core aspect POI. An increasing number of such services in an area leads to higher POI related activity in an area. In addition, culture and recreation services usually increase the attractiveness of an area, which can also affect the charging demand. Another example with multiple effects on charging demand is the influencing factor effect of nearby charging [20], which is part of the core aspect Other CIS. A lot of nearby charging indicates that the location is covered well, at least in terms of spatial coverage. Furthermore, multiple charging points in a small area can lead to redundancy, which is a benefit for the BEV user, because of increased reliability to satisfy the charging demand. Table 4 shows the occurrence of argumentation codes for each core aspect. It can be seen that some core aspects such as Residential Population, Working Population, or Safety are mostly linked to one line of argumentation. Other core aspects, such as Other CIS or Parking Situation, are mostly assigned to multiple lines of argumentation. Activity is the only of the three main arguments appearing in the table, because a lot of factors have a reference to activities of BEV users without specifying the activity itself.
Table 4.
Argumentation code frequency per core aspect.
3.3. Metrics
A set of core aspects cannot be directly used for planning purposes. Quantitative metrics are required for automatizing the evaluation of possible charging sites. In the literature body, we detected 55 metrics for the 186 influencing factors. Table 5 displays the mentioned metrics per core aspect. The distribution between the core aspects is highly skewed. Accessibility, Centrality, Safety, and Visibility do not have any proposed metrics. Coverage, Other CIS, and POI are more frequently mentioned together with metrics. The Residential Population core aspect has been quantified with metrics most often. Although metrics related to the same core aspect are similar to some extent, few publications use the exact same metrics. For example, Chen et al. [29] evaluate the Parking Situation with average parking prices for daily paid parking, while Gkatzoflias et al. [25] use availability at candidate site and capacity of parking. Wirges [45] evaluates the number of parking lots. The core aspect Residential Population serves as an estimation of expected BEV owners. Often, the respective metric is a population density, but authors apply different reference areas, such as population in 250 m hexagon [21], sum of residents in 200 m radius [30], or population density in 100 × 100 m cell.
Table 5.
Metrics mentioned per core aspect.
A comprehensive catalog of metrics for each core aspect is out of the scope of this paper. The availability of data is a challenge, because broad applicability would call for the use of openly available data, but the acquisition of some data, such as the safety of a location or the traffic flow, is difficult. Furthermore, each metric makes the overall evaluation of a potential PEVCI site more complex and expensive. Therefore, it would be of interest to extract the most relevant metrics, while still covering the most influential core aspects.
3.4. Charging Site Evaluation Framework: Conclusions
Section 2 and Table 4 both demonstrate the variety of previous studies on PEVCI planning. The analysis of this paper and the resulting proposal of core aspects and lines of argumentation can serve as a basis toward a catalog of demand related influencing factors. With respect to practical applicability, there are two required extensions. The list of core aspects focuses on demand-related influencing factors. In the future, it should be expanded with other important planning factors such as connectivity to the grid or economic viability. Furthermore, a set of core aspects cannot be directly used for planning purposes. Instead, standardized, quantitative metrics for all influencing factors are required for automatizing the evaluation of possible charging sites. Currently, there is little knowledge about the correlation of core aspects and the actual usage of charging infrastructure, because BEV charging is still ramping up and the previously built PEVCI was established considering only a subset of mentioned core aspects. Consequently, Section 4 uses a set of metrics to assess the applicability of influencing factors for PEVCI evaluation in a case study of the city of Hamburg.
4. Hamburg Case Study
4.1. Introduction
A case study of the city of Hamburg serves to analyze the presumed correlation of the identified influencing factors, represented by their core aspects from the literature review, with observed charging station utilization based on a real-life example. Two components are needed for this analysis: the actual utilization of existing chargers and an evaluation of metrics associated with the demand influencing core aspects for each charging location in the usage data set.
In the following, Section 4.2 provides a list of metrics used to estimate the charging demand at charging sites, while Section 4.3 introduces the real life charging data set from the city of Hamburg. Finally, Section 4.4 evaluates the character and degree of correlation between metrics and usage data in order to arrive at a conclusion regarding the applicability of the identified influencing factors, core aspects, and metrics to the estimation of charging demand at candidate sites for public charging. The data sets used and described in the following sections are available at https://github.com/TUMFTM/Hamburg-Public-Charging-Station-Utilization (accessed on 20 February 2022).
4.2. Spatial Data and Metrics
In order to derive a set of evaluation metrics for the estimation of charging demand, we build upon the presented literature review from Section 3. To this end, the most relevant and potentially measurable core aspects constitute a starting point for the derivation of metrics. Table 1 reflects the most prominent core aspects from the literature review. The most frequently named core aspects are Residential Population, POI, Parking Situation, Surrounding Street Network, Traffic Flow, Coverage, Dwell Characteristics, and Other CIS. Manifold factors have been identified as possible influences on the local charging demand for each of these core aspects as indicated in Table 3. Not all of these influencing factors appear to be measurable within the scope of this paper and on the whole area of a city. Some because required input data is not available, like on-street parking facilities or a comprehensive data set on traffic flows, some because they are unavailable on a sufficient spatial resolution, like detailed information on the extended socio-demographics of the residential population. The latter could potentially be imputed by the disaggregation of available data on the district level. Such imputations, however, escape the scope of this work due to the induced complexity and the added uncertainties.
Table 6 lists the metrics used in this case study to evaluate charging station sites. The metrics are chosen to reflect the most prominent core aspects and represent different argumentation codes, depending on their design. All lines of argumentation except for Access Restrictions and Public Transport are represented by the metrics. In this case study, only public chargers with 24/7 availability are analyzed. Furthermore, possible access restrictions are not a matter of candidate site location, but of the charge point operator’s policies, which are outside the scope of this work. The consideration of public transport in the assessment of a charging station’s presumed charging demand is mainly reflected in the Connectivity to Public Transport core aspect. This aspect is of minor importance and has thus been left out.
Table 6.
Derived metrics for the Hamburg case study. OSM: Open Street Maps; OSRM: Open Source Routing Machine; OD HH: OpenData Hamburg.
Three different kinds of metrics are employed: counts, area shares, and area sizes. For most of them, accepted walking distances serve as thresholds to determine reference values, as walking distances between the place of activity and available parking spots determine the willingness of users to consider a parking spot (or charger) in question. Acceptable walking distances are known to differ for different activities [67]. The majority of people is willing to accept walking distances of up to 500 m. Within this bracket, longer walking distances are acceptable for longer staying periods while shorter distances are preferred for short term activities. Thus, we set two different analysis thresholds: 500 m for residential parking as well as the consideration of alternative charging points, and 300 m for general POI. Moreover, the 500 m threshold is also used for the calculation of the business area share, around each charging site. Reachability of a charging site is determined by measuring the area of a three minute driving isochrone around the charger. This isochrone is large for dense street networks with many intersections and high-speed roads, and shrinks for locations with a bad infrastructural connection. Finally, the catchment size of a charger is defined as the area of the Voronoi Cell associated with the charging station in the network of all charging stations. It measures the area for which the charger in question is the closest charger. This measure increases as the density of chargers in an area decreases and vice versa. Figure 5 visualizes the described metrics and input data sets to foster an understanding of the calculation process. Each subfigure shows an orange circle, which has a radius of 500 m as a size reference. One can see that the population data set, taken from the German census 2011 [63], takes the form of a 100 m by 100 m lattice, indicating the sum of inhabitants for each cell of the grid. To determine the amount of residents in the vicinity of a charging station, the sum of all population points within a 500 m radius is considered. Similarly, POI, and competing chargers are counted in their respective catchments based on data from Open Street Maps, taken from the Geofabrik download server [64], and the charger locations from the open data portal of the city of Hamburg [65]. The share of business area around each location is calculated within a 500 m radius using land use data from the city of Hamburg [66]. Three minute driving isochrones are calculated using the Open Source Routing Machine (OSRM—[68]) and OSM as input data.
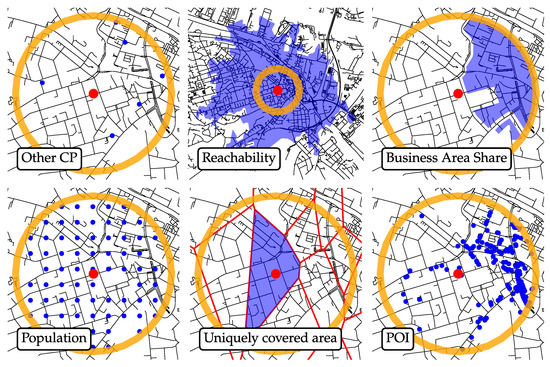
Figure 5.
Visualization of metrics used in the case study. Orange circles serve as a size reference (500 m radius each).
4.3. Charging Data Set
This section introduces and describes a real-world charging data set from the city of Hamburg. It includes connection data from 1023 public chargers at 475 individual locations, including normal and fast chargers. All chargers are operated by the local energy grid operator "Stromnetz Hamburg", the largest provider of public charging infrastructure in Hamburg. Hence, we consider the charging data set at hand to be representative of the general charging behavior at public charging stations in Hamburg. Furthermore, due to the relatively advanced development of electromobility and public charging infrastructure in Hamburg, we also consider the data set to be exemplary for larger European cities in general. A continuous data feed of Hamburg’s charging infrastructure is publicly available at [65]. To build a basis for the following analysis, the data feed is retrieved from the internet and stored in a local data base.
Figure 6 depicts a map of the city of Hamburg, consisting of 104 city districts. The locations of the analyzed charging stations are marked on the map. A majority of the charging stations is located in the center-most parts of the city, which can be identified by a gray background color. A considerable proportion also focuses around two local centers to the west and south of the city, namely, Bergedorf and Harburg. The rest of the chargers are scattered in the suburbs north of the river Elbe.

Figure 6.
Hamburg charging stations.
The following sections describe the preparation of the charging data set. Firstly, all necessary pre-processing steps are presented in Section 4.3.1. Secondly, an exploratory analysis of the data set reveals first insights into usage patterns (Section 4.3.2). Lastly, Section 4.4 analyzes the correlations between the spatial metrics from the first part of this work and the objective utilization of charge points taken from the charging data set.
4.3.1. Pre-Processing
First, the data set is filtered and cleaned to make sure that it is as descriptive and unbiased as possible. To this end, we exclusively use data which was recorded between 6 February 2020 (included) and 5 March 2020 (excluded), although the charging data set contains more recent data. Before this period, the data set shows inconsistencies between the recorded timestamps. After 5 March 2020, records are affected by the Corona pandemic, which has a large impact on mobility and charging behavior. The end of the period is also chosen to reflect four whole weeks, such that each weekday is equally weighted in the study data set. Furthermore, fast charging stations (>22 kW) and charging stations which contain at least one fast charging point are removed from the data set because of the fundamental differences in usage patterns, pricing, and regulations between normal and fast charging modes. Furthermore, fast charging points in Hamburg are often realized by combining a Type 2, CCS, and CHAdeMO plug into one charging pole. In this setup, however, the installed hardware does not allow both fast charging plugs to be used at the same time and usually only two parking spots are reserved for the three plugs skewing and biasing the data. The remaining raw data is transformed from a list of state observations to a list of charging processes. The Hamburg charging data set in its original form supplies a list of sensor values for each charging point of the infrastructure. A first data analysis reveals that sensor values are not only updated on change, but also polled frequently and furthermore recorded in additional, non-equidistant intervals. Hence, repetitions of unchanged sensor states are removed from the study data set under the assumptions that no sensor state changes are missing from the data set and all relevant information is retained without state repetition. Finally, the data set of charging processes is generated by translating the list of state changes to a list of charging processes by matching state changes in pairs and propagating sensor states back in time. Charging processes of under 5 min that can be caused by aborted charging processes or the misuse of charging infrastructure for short term parking are removed from the data set. On the other end of the spectrum, we omit charging processes exceeding 48 h, which we consider to be outliers that do not reflect regular charging demand.
4.3.2. Exploratory Data Analysis
After data pre-processing, an exploratory data analysis gives a first indication of the spatiotemporal charging demand in the city of Hamburg during the observation period. To access this demand, we evaluate the following performance indicators of the infrastructure:
- Occupancy: the share of occupied chargers at a given time.
- Connection ratio: the proportion of time a charger is occupied.
- Daily transactions: the number of transactions per charging station and day.
- Duration: the duration of a transaction.
Figure 7 provides an overview of the final study data set regarding the aforementioned performance indicators without any spatial differentiation of the chargers. The occupancy of the whole charging infrastructure in Hamburg varies only in a narrow band between 14% and 22%. On weekdays (Monday to Friday), occupancy fluctuates in a 4% corridor between approximately 18% and 22%, while Saturdays and Sundays exhibit a broader occupancy spectrum. On weekdays, occupancy peaks overnight, during working hours before noon, and in the evening at around 7 p.m. Due to the overall small band of fluctuation, weekday occupancy peaks are not as prominent as those on Saturdays and Sundays. On Saturdays, more pronounced peaks can be found around midday and in the evening. Overnight occupancy shows a significant drop in comparison to weekdays. Sunday occupancies are similar to their respective counterparts on Saturdays until noon, before they peak at around 2 p.m. and then closely resemble weekday charging processes from 6 p.m. onward. Because of the clear difference in usage behaviors between weekdays, Saturdays, and Sundays, all subsequent figures and analyses differentiate between these day types. The connection ratio reveals that most of the charging points are utilized between just under 10% and 25% of the available time. That is approximately 2.5 to 6 h a day. In this statistic, no clear differentiation between weekdays, Saturdays, and Sundays can be made. Looking at the number of transactions per charging location and day, it can be seen that most charging stations fall in an interval of 0.5 to 2.5 transactions per day. There are slightly less charging transactions on Saturdays and Sundays. Typical transaction durations lie between 3 and 9 h with longer connections on the weekend. It is to be noted that most of the analyzed charging points have a maximum parking limit of 2 h between 9 a.m. and 8 p.m. on weekdays and Saturdays. Outside of these times, unlimited parking and charging is possible, which serves as an explanation for longer durations on Sundays.

Figure 7.
Overview of the general charging station usage in Hamburg.
A first look at the spatial characteristics of BEV charging is provided by Figure 8. In both subfigures, only the most central districts of Hamburg are shown (gray area in Figure 6) for the sake of simplicity. The left subfigure depicts the quantiles of transaction durations at charging stations in four different shades of green, whereas on the right, the quantiles of the number of transactions per charging stations are encoded in shades of red. It is striking that charging stations close to the shopping mile, which is located in the center-most city districts experience the shortest and most connections. To further analyze the connection between spatial metrics and charging station utilization, the following section investigates the relation between the spatial metrics introduced in Section 4.2 and the presented performance indicators (occupancy, connection ratio, number of transactions, and duration in hours).
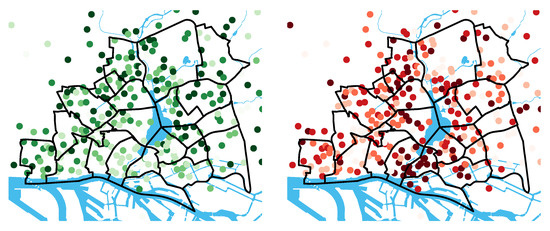
Figure 8.
Overview of the spatial utilization of public chargers in Hamburg. Left: duration per transaction and charging station (quantiles); Right: number of transactions per charging station (quantiles).
4.4. Correlations of Spatial Metrics and Charge Point Usage
In order to investigate the correlations between the spatial metrics introduced in Section 4.2 and the infrastructure performance indicators from Section 4.3.2, all metrics are evaluated for each of the charging stations. Subsequently, a clustering of charging stations by their associated metrics is performed to reveal potential groups of charging stations with similar characteristics in their spatial surroundings. Using a k-means clustering approach under varying values for the number of clusters k, four clusters are identified to best segment the data. A subsequent interpretation of the identified clusters shows that it is possible to describe the four clusters by the predominant spatial context the clusters appear in. Figure 9 shows the resulting clusters of charging stations with meaningful names assigned: Suburbs (SU), Urban Residental (UR), City Center (CC), and Working Area (WA).

Figure 9.
Clustered charging stations of the study region.
Figure 10 characterizes these cluster types by an excerpt of the evaluated metrics: the Suburbs cluster comprises charging stations with a medium number of residents, few surrounding charging stations, large catchment areas, slightly reduced reachability, few POI, and the lowest share of business areas. The Urban Residential cluster describes charging stations with a lot of neighboring residents, many competing charging stations leading to small individual catchment areas, good reachability, a considerable amount of POI, as well as a low share of business areas. The population around City Center stations is comparable to Suburb stations. Stations in the City Center cluster are similar to Urban Residential locations with regard to other charging points, catchment areas, and reachability but stand out from all other clusters by the high number of POI around them. City Center stations are also close to business areas. Lastly, Working Area locations are among those with the lowest number of residents, and other charging points in comparison to other clusters. In contrast to City Center locations, they serve a lot of business area while being adjacent to few POI.
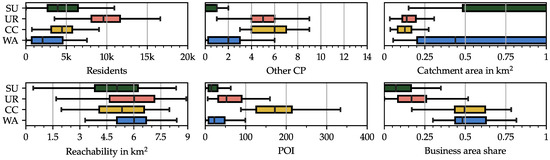
Figure 10.
Characteristics of the identified charging station clusters.
The clustering of charging stations regarding their spatial surroundings reveals groups of similar charging stations that may exhibit characteristic charging behavior, if the used metrics are significant for the utilization of charging stations.
In order to investigate the relationship between spatial metrics and charging station utilization, connection ratio, number of transactions, and connection durations are plotted separately for each cluster of charging stations in Figure 11. Few differences between the performance indicators of charging stations in different clusters can be observed both in typical and extreme values across all day types. Consequently, the same applies to the difference between each individual cluster and the total charging infrastructure (Figure 7). Furthermore, existing differences between the medians of the performance indicators across clusters are small in comparison to the variance within a cluster, indicating that charger performance in absolute terms cannot be determined by the used metrics.
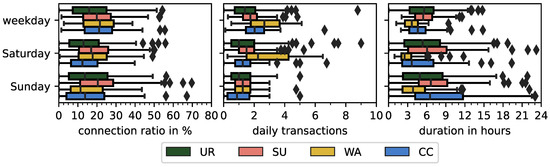
Figure 11.
Usage indicators per cluster.
The only exception to this uniformity is the already known higher number of transactions in the city center, with corresponding shorter connection times.
While the absolute utilization of charging stations cannot be explained by the metrics derived from our literature study, Figure 12 proves clear and significant differences in the timely charging behavior at stations of different clusters. The figure is divided into three subfigures, one for each day type (weekday, Saturday, Sunday). It shows both the line of median occupancies, and the 5% and 95% percentile of daily occupancies to give an indication of the fluctuation between different days and weeks. Looking at weekdays, Working Area and City Center charging stations experience similar utilization with large fluctuations of about 10% of occupied chargers overnight to nearly 40% during work hours. Urban Residential and Suburb chargers on the other hand are more evenly occupied during the day with 10% fluctuations at Urban Residential stations, which are mostly occupied in the evening and overnight, and below 5% fluctuations at Suburb chargers, which shows a qualitatively similar time behavior to Urban Residential chargers. The differences across different clusters are evidently larger than the fluctuations between different days of the week and different weeks as can be seen by a visual comparison of the errorbands and occupancy graphs. While City Center and Working Area chargers are utilized similarly on weekdays, their occupancy on Saturdays differs. As expected, City Center occupancy remains high during the day on Saturdays, while Working Area utilization plummets to occupancies below 20% for most part of the day. The same applies to occupancy curves of the Suburbs and Urban Residential clusters which are much flatter on Saturdays than on weekdays. Urban Residential chargers are occupied more often than Suburb charging points and show a distinctive accumulation of transactions in the evening between 6 and 9 p.m. on Saturdays, leading to an increase of about 5% occupancy. Large differences between the 5% and 95% occupancy percentile can be observed before 9 a.m. on Saturdays for all clusters. This indicates that there are significant differences in Saturday morning charging infrastructure utilization across Saturdays of different weeks or across different charging points within the same cluster. City Center, Working Area, and Suburb charging stations are used almost equally often during Sundays. Chargers within these clusters are most used in the early afternoon between noon and 3 p.m. with up to 30% of occupied chargers. Urban Residential charging points are increasingly occupied during the course of the day. At midnight, 25% of the chargers are occupied for overnight charging, which is in line with typical weekday occupancies at that time.

Figure 12.
Occupancy per cluster, time, and day type.
Summarizing the insights provided by Figure 12, it can be said that while average daily performance indicators hardly differ between different clusters as seen in Figure 7, occupancy times and amounts of fluctuations vary widely between different station clusters. This applies to both occupancy fluctuation during the course of a day and such across different weekdays. Each cluster type can be characterized by a unique set of typical occupancy curves for weekdays, Saturdays, and Sundays.
Figure 12 offers insights into the amounts of taken charging points over time. Adding to these insights, Figure 13 reveals the character of individual transactions by picturing the distribution of transaction durations for different start time intervals across all possible combinations of day types and station clusters. When looking at the distribution of connection durations on weekdays and Saturdays, one finds that for many start time intervals median values lie close to 2 h. This is the allowed maximum parking duration at public chargers in Hamburg between 9 a.m. and 8 p.m., indicating that approximately half of the transactions respect the charging policy as issued by the charge point operator. Nevertheless, more than 50% of transactions are in excess of the 2 h mark and some exceed it by more than 10 h. For every day type and any cluster, growing connection durations can be observed outside the 2 h policy interval. As expected, overnight charging, starting in the evening, results in the longest transactions. Generally, there are only few differences across the clusters on weekdays and Saturdays. On Saturdays, however, shorter connection times and smaller variances are present within the City Center cluster in contrast to the other clusters. Another difference lies in the typical lower bound of connection durations in the evening: Urban Residential chargers exhibit only few connections that are shorter than 7 h for all day types. In contrast, Suburban, Working Area, and City Center chargers are frequently used for shorter connection sessions in the evening. Seeing the fact that a clustering in the spatial metrics domain corresponds to a distinct differentiation regarding usage profiles, it can be assumed that the employed metrics are usable to estimate usage characteristics at charging stations and at potential candidate sites for new charging stations.
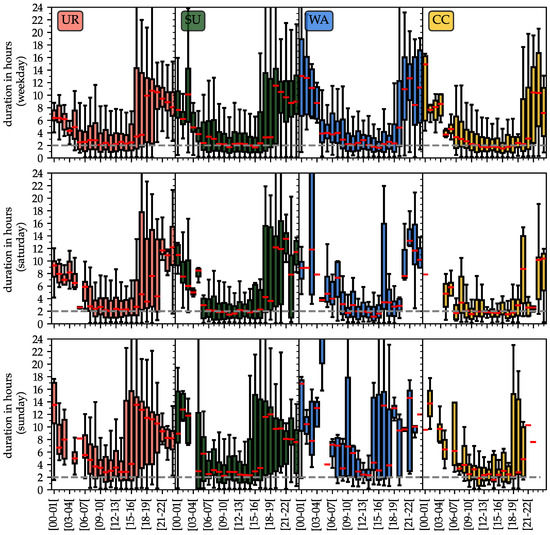
Figure 13.
Connection durations per cluster, day type, and start time interval.
5. Summary
The first part of this paper analyzed and structured publications on the topic of PEVCI placement while focusing on the pre-existing usage of placement criteria, presented in Section 2. The review showed that there is a high variety of influencing factors, and a discrepancy of used terms. Furthermore, almost all reviewed studies apply a different set of influencing factors. The goal of the literature analysis was to derive influencing factors and respective metrics that allow for an automated assessment of potential site for new PEVCI. To this end, in Section 3, we structured the problem domain of PEVCI placement, and compiled a list of influencing factors that can affect BEV charging demand at candidate stations based on the literature body. In addition, influencing factors were clustered into core aspects to reduce the number of unique terms for similar influencing factors and to generalize and emphasize the aspects which have to be considered when setting up new charging points. We derived lines of argumentation to explain the underlying effects on the charging demand as well as the rationales behind each core aspect. Finally, we summarized the literature body’s metrics used to quantify the influencing factors.
In the second part of this contribution, we conducted a case study, as shown in Section 4, which analyzed the correlation between influencing factors and charger utilization based on real life data from the city of Hamburg. To this end, a set of metrics measuring the most prominently named core aspects from the literature review was established and the existing PEVCI of the city of Hamburg was evaluated with regards to these metrics. Subsequently, a clustering of the existing charging sites by their metrics revealed four distinct clusters among the charging sites which are characterized by unique combinations of spatial traits and were therefore named Suburbs, Urban Residential, City Center, and Working Area. In order to assess the presumed relationship between metric clusters and charger utilization, a data set of occupancy states of the considered chargers was prepared in Section 4.3. An exploratory data analysis revealed clear differences between charging profiles on weekdays, Saturdays, and Sundays, indicating the importance of analyzing charging behavior separately for each day type. With regard to the aggregated PEVCI performance factors connection ratio, daily transactions, and duration, the four clusters did not exhibit significant differences. The difference between the clusters’ mean performance factors are lower than their variance within one cluster. While no correlation between the mean values of charger utilization and the spatial characteristics of the chargers were found, the four clusters presented with distinct occupancy profiles over the course of a day (Figure 12) indicating characteristic charging behaviors in different spatial environment types. Hence, we conclude that the identified influencing factors can support the PEVCI deployment by estimating usage characteristics of candidate sites in an automated way.
6. Discussion
While the previous sections have already presented our results, this section serves to critically discuss their validity, possible applicability, and limitations as well as to compare them with similar works. Regarding the literature review, there are no publications with contrary or supporting results, because—to the best of our knowledge—this work provides the first comprehensive and structured overview of influencing factors on charging demand. Moreover, the presented influencing factors are directly taken from the literature and are thus not in conflict with the cited works. Nevertheless, the formulation of influencing factors and the means by which we extracted them especially from literature that only implicitly contains such factors as well as the grouping of influencing factors into core aspects is subject to our phrasing and interpretation. Additionally, the literature survey is clearly limited by our focus on static, demand-oriented influencing factors and by the fact that no explicit analysis of the influencing strength and direction was conducted. The latter limitation is mitigated in parts by the derivation of lines of argumentation which help experts to analyze influencing strengths and directions for their use cases. Regarding the focus on demand-oriented influencing factors, it is to be noted that real placement processes may also depend on a much wider collection of influencing factors. Considerations of practical, organizational, economic, and technical feasibility are known to influence charging station placement as much as the presented demand oriented considerations [13,14,15,16,17,34,40,49]. Additionally, known aspects of ecological sustainability, strategic placement, and socio-politics have been spared out by this analysis. As a result, the list of influencing factors, core aspects, metrics, and lines of argumentation as well as the analysis of their linkages may help to guide decision-makers and researchers through the process of charging station placement, optimization, and demand estimation by a clarification and structuring of the domain. However, the results of the work at hand will not yet provide an optimal placement strategy or demand estimation by itself, it merely helps to develop better and more comprehensive estimations in the future.
The presented case study describes the Hamburg PEVCI regarding its performance indicators in great detail. Therefore, it adds to the limited set of real-life data assessments on the matter and thus provides a valuable addition to the existing literature base. The open source data set, which has been generated from publicly available data can be used by other researchers and businesses in the future. Our results regarding occupancies, daily transactions, connection ratios, and connection durations fall in line with current assessments of other PEVCI [48,69] both on average and in terms of the timely charging behavior. Due to the insignificant differences in mean performance indicators among the identified clusters, we reasoned that it is momentarily impossible to reliably predict the absolute occupancy of charging sites by evaluating spatial, demand-related metrics. While this claim can hardly be generalized looking at a single case study and one set of metrics that does not even cover all core aspects, let alone influencing factors named in this work, there is strong evidence that it is indeed the case that site-specific occupancies cannot yet be forecasted successfully. For instance, Straka et al. [61] perform a statistically advanced regression analysis on the consumed energy at charging stations considering a broad range of spatial and socio-demographic influencing factors. The obtained standardized regression coefficients remain mostly inconclusive with many small, zero-valued or zero-spanning coefficients despite their elaborated methodology. In a smaller scope, Straka et al. [60] aimed to predict whether a charging site belongs to the top tier category of chargers regarding utilization. While this classification yielded promising results, the authors conclude that planning decisions solely based on such methodology are not justified. In addition to these literature references, some analytical considerations further substantiate the hypothesis that charging performance indicators cannot yet be predicted. In particular, non-demand oriented influencing factors, the complexity of the system dynamic both in time and in space, the ongoing roll-out of PEVCI, changes in technical specifications like charging speeds and vehicle ranges, site-specific circumstances, as well as growing penetration rates in the BEV sector are presumably more determinant of a specific charger’s performance than spatial metrics alone.
An interesting difference between the work of Friese et al. [48] and this contribution is given by the complementing approaches of the respective authors. While our contribution first identifies a large set of possible influencing factors on the charging demand and then clusters existing charging stations by the associated spatial metrics to arrive at the conclusion that different spatial characteristics induce different usage behaviors, Friese et al. first cluster usage behaviors and then formulate a classification problem which links the identified usage clusters with spatial metrics. It is striking that Friese et al. also arrive at four distinct usage clusters and that their usage clusters and the corresponding spatial classification match our findings. This alludes to the fact that spatial metrics are indeed inextricably linked to certain usage patterns no matter from which side one analyses the problem. It is furthermore promising that Friese et al. conducted their analysis in the city of Munich substantiating the hope that the presented findings of our respective studies are generalizable to some extend.
Albeit all arguments for the validity of the presented results, a clear and undisputed limitation of this case study is the fact that only connection data is available. Information on the amount of transferred energy per charging session is lacking. Hence, it is not possible to analyze charging times in contrast to connection times, and while there may be further links between the suggested metrics and these variables, detailed analysis are rendered impossible.
Last but not least, a limitation of the presented case study lies in the chicken–egg relation of charging demand and supply: the observed charging demand at existing stations does not necessarily match user preferences perfectly, because users will inevitably realize their charging demand at places where chargers are available. Unfulfilled charging demands can thus not be observed in the spatial surroundings they appear in and consequently elude analysis. The observed charging demand at existing chargers is thus only an approximation of the real charging demand which may or may not coincide with spatial influencing factors more or less closely. Existing chargers have often been placed based on demand-oriented influencing factors through the adherence to practical guidelines. Hence, it is to some extend a self-fulfilling prophecy that presumed influencing factors result in realized charging demand. These potential limitations of the study at hand is mitigated first and foremost by the large number of chargers already available in the study region. With over 1000 chargers at nearly 500 charging sites, a sufficient spatial resolution of the charging demand can be assumed. It is therefore unlikely that actual user preferences are entirely different from the observed charging behavior.
Building on the critical reception presented in this section, further research directions can be identified: the catalogue of demand-oriented influencing factors has to be complemented by all factors relevant to the choice of a charging station. Moreover, the relative weighting of influencing factors should be studied. Analyses similar to this one should be conducted in other study areas with different degrees of maturity regarding electromobility to further refine and substantiate the findings of this and similar contributions.
Author Contributions
Conceptualization, L.A. and S.K.; methodology, L.A.; software, L.A.; validation, L.A. and S.K.; formal analysis, L.A. and S.K.; data curation, L.A. and S.K.; writing—original draft preparation, L.A. and S.K.; writing—review and editing, L.A. and S.K.; visualization, L.A. and S.K. All authors have read and agreed to the published version of the manuscript.
Funding
This research was funded by the Technical University of Munich (TUM) in the framework of the Open Access Publishing Program.
Institutional Review Board Statement
Not applicable.
Informed Consent Statement
Not applicable.
Data Availability Statement
The data presented in this study are openly available at https://github.com/TUMFTM/Hamburg-Public-Charging-Station-Utilization (accessed on 20 February 2022).
Conflicts of Interest
The authors declare no conflict of interest. The funders had no role in the design of the study; in the collection, analyses, or interpretation of data; in the writing of the manuscript, or in the decision to publish the results.
Abbreviations
The following abbreviations are used in this manuscript:
| Ac | Activity |
| AcHo | Quality–Home |
| AcWo | Quality–Work |
| AcPOI | Quality–Points of Interest |
| AcPT | Quality–Public Transport |
| Av | Availability |
| AvCo | Availability–Coverage |
| AvAR | Availability–Access Restriction |
| BEV | Battery Electric Vehicle |
| CC | City Center |
| CIS | Charging Infrastructure |
| CP | Charging Point |
| EV | Electric Vehicle |
| ISM | Interpretive Structural Modeling |
| MICMAC | Cross-Impact Matrix Multiplication Applied to Classification |
| PEVCI | Public Electric Vehicle Charging Infrastructure |
| POI | Point of Interest |
| PROMETHEE | Preference Ranking Organization Method for Enrichment Evaluation |
| Qu | Quality |
| QuRe | Quality–Reachability |
| QuRed | Quality–Redundancy |
| QuAt | Quality–Attractiveness |
| SU | Suburbs |
| UR | Urban Residential |
| VIKOR | Multicriteria Optimization and Compromise Solution |
| WA | Working Area |
References
- United Nations. Paris Agreement: 2015. 2015. Available online: https://treaties.un.org/pages/ViewDetails.aspx?src=TREATY&mtdsg_no=XXVII-7-d&chapter=27&clang=_en (accessed on 1 February 2022).
- Rockström, J.; Gaffney, O.; Rogelj, J.; Meinshausen, M.; Nakicenovic, N.; Schellnhuber, H.J. A roadmap for rapid decarbonization. Science 2017, 355, 1269–1271. [Google Scholar] [CrossRef] [PubMed] [Green Version]
- Hardman, S.; Tal, G. Driving the Market for Plug-in Vehicles—Developing PEV Charging Infrastrcuture for Consumers; Institute of Transportation Studies: Berkeley, CA, USA, 2017. [Google Scholar]
- Stadt Hamburg. Masterplan Ladeinfrastruktur. 2014. Available online: https://www.hamburg.de/contentblob/4479262/dcabd1a0157d6ac7c2ab1bfb06b22dc7/data/masterplan-ladeinfrastruktur.pdf (accessed on 1 February 2022).
- NOW GmbH. Tank-und Ladeinfrastruktur—Öffentlicher Bereich—Kommunen—Standortkriterien. 2022. Available online: https://www.now-gmbh.de/foerderung/foerderprogramme/ladeinfrastruktur/ (accessed on 20 February 2022).
- Kindl, A.; Luchman, I.; Szabo, N.; Walther, C. SIMONE: Bedarfsorientiertes Verfahren zur Planung von Ladeinfrastruktur. Available online: https://www.forschungsinformationssystem.de/servlet/is/493096/?clsId0=276664&clsId1=0&clsId2=0&clsId3=0 (accessed on 20 February 2022).
- Deb, S.; Tammi, K.; Kalita, K.; Mahanta, P. Review of recent trends in charging infrastructure planning for electric vehicles. Wiley Interdiscip. Rev. Energy Environ. 2018, 7, 114. [Google Scholar] [CrossRef] [Green Version]
- Pagany, R.; Marquardt, A.; Zink, R. Electric Charging Demand Location Model—A User- and Destination-Based Locating Approach for Electric Vehicle Charging Stations. Sustainability 2019, 11, 2301. [Google Scholar] [CrossRef] [Green Version]
- Philipsen, R.; Schmidt, T.; Ziefle, M. A Charging Place to Be—Users’ Evaluation Criteria for the Positioning of Fast-charging Infrastructure for Electro Mobility. Procedia Manuf. 2015, 3, 2792–2799. [Google Scholar] [CrossRef] [Green Version]
- Philipsen, R.; Schmidt, T.; van Heek, J.; Ziefle, M. Fast-charging station here, please! User criteria for electric vehicle fast-charging locations. Transp. Res. Part Traffic Psychol. Behav. 2016, 40, 119–129. [Google Scholar] [CrossRef]
- Anderson, J.E.; Lehne, M.; Hardinghaus, M. What electric vehicle users want: Real-world preferences for public charging infrastructure. Int. J. Sustain. Transp. 2018, 12, 341–352. [Google Scholar] [CrossRef]
- Helmus, J.R.; Spoelstra, J.C.; Refa, N.; Lees, M.; van den Hoed, R. Assessment of public charging infrastructure push and pull rollout strategies: The case of the Netherlands. Energy Policy 2018, 121, 35–47. [Google Scholar] [CrossRef]
- Wu, H.; Niu, D. Study on Influence Factors of Electric Vehicles Charging Station Location Based on ISM and FMICMAC. Sustainability 2017, 9, 484. [Google Scholar] [CrossRef] [Green Version]
- Wu, Y.; Yang, M.; Zhang, H.; Chen, K.; Wang, Y. Optimal Site Selection of Electric Vehicle Charging Stations Based on a Cloud Model and the PROMETHEE Method. Energies 2016, 9, 157. [Google Scholar] [CrossRef] [Green Version]
- Zhao, H.; Li, N. Optimal Siting of Charging Stations for Electric Vehicles Based on Fuzzy Delphi and Hybrid Multi-Criteria Decision Making Approaches from an Extended Sustainability Perspective. Energies 2016, 9, 270. [Google Scholar] [CrossRef] [Green Version]
- Guo, S.; Zhao, H. Optimal site selection of electric vehicle charging station by using fuzzy TOPSIS based on sustainability perspective. Appl. Energy 2015, 158, 390–402. [Google Scholar] [CrossRef]
- Tang, Z.; Guo, C.; Hou, P.; Fan, Y. Optimal Siting of Electric Vehicle Charging Stations Based on Voronoi Diagram and FAHP Method. Energy Power Eng. 2013, 5, 1404–1409. [Google Scholar] [CrossRef]
- Erbaş, M.; Kabak, M.; Özceylan, E.; Çetinkaya, C. Optimal siting of electric vehicle charging stations: A GIS-based fuzzy Multi-Criteria Decision Analysis. Energy 2018, 163, 1017–1031. [Google Scholar] [CrossRef]
- Bi, R.; Xiao, J.; Pelzer, D.; Ciechanowicz, D.; Eckhoff, D.; Knoll, A. A simulation-based heuristic for city-scale electric vehicle charging station placement. In Proceedings of the 2017 IEEE 20th International Conference on Intelligent Transportation Systems (ITSC), Yokohama, Japan, 16–19 October 2017; pp. 1–7. [Google Scholar] [CrossRef]
- Csonka, B.; Csiszár, C. Determination of charging infrastructure location for electric vehicles. Transp. Res. Procedia 2017, 27, 768–775. [Google Scholar] [CrossRef]
- Csiszár, C.; Csonka, B.; Földes, D.; Wirth, E.; Lovas, T. Urban public charging station locating method for electric vehicles based on land use approach. J. Transp. Geogr. 2019, 74, 173–180. [Google Scholar] [CrossRef]
- Chung, S.H.; Kwon, C. Multi-period planning for electric car charging station locations: A case of Korean Expressways. Eur. J. Oper. Res. 2015, 242, 677–687. [Google Scholar] [CrossRef]
- He, Y.; Kockelman, K.M.; Perrine, K.A. Optimal locations of U.S. fast charging stations for long-distance trip completion by battery electric vehicles. J. Clean. Prod. 2019, 214, 452–461. [Google Scholar] [CrossRef]
- Wu, F.; Sioshansi, R. A stochastic flow-capturing model to optimize the location of fast-charging stations with uncertain electric vehicle flows. Transp. Res. Part D Transp. Environ. 2017, 53, 354–376. [Google Scholar] [CrossRef]
- Gkatzoflias, D.; Drossinos, Y.; Zubaryeva, A.; Zambelli, P.; Dilara, P.; Thiel, C. Optimal allocation of electric vehicle charging infrastructure in cities and regions: Scientific analysis or review. JRC Rep. 2016. [Google Scholar] [CrossRef]
- Namdeo, A.; Tiwary, A.; Dziurla, R. Spatial planning of public charging points using multi-dimensional analysis of early adopters of electric vehicles for a city region. Technol. Forecast. Soc. Chang. 2014, 89, 188–200. [Google Scholar] [CrossRef] [Green Version]
- Pagani, M.; Korosec, W.; Chokani, N.; Abhari, R.S. User behaviour and electric vehicle charging infrastructure: An agent-based model assessment. Appl. Energy 2019, 254, 113680. [Google Scholar] [CrossRef]
- Wirges, J.; Linder, S.; Kessler, A. Modelling the Development of a Regional Charging Infrastructure for Electric Vehicles in Time and Space. Eur. J. Transp. Infrastruct. Res. 2012, 12, 391–416. [Google Scholar] [CrossRef]
- Chen, T.D.; Kockelman, K.M.; Khan, M. Locating Electric Vehicle Charging Stations. Transp. Res. Rec. J. Transp. Res. Board 2013, 2385, 28–36. [Google Scholar] [CrossRef]
- Efthymiou, D.; Antoniou, C.; Tyrinopoylos, Y.; Mitsakis, E. Spatial Exploration of Effective Electric Vehicle Infrastructure Location. Procedia Soc. Behav. Sci. 2012, 48, 765–774. [Google Scholar] [CrossRef] [Green Version]
- Frade, I.; Ribeiro, A.; Gonçalves, G.; Antunes, A.P. Optimal Location of Charging Stations for Electric Vehicles in a Neighborhood in Lisbon, Portugal. Transp. Res. Rec. J. Transp. Res. Board 2011, 2252, 91–98. [Google Scholar] [CrossRef] [Green Version]
- He, S.Y.; Kuo, Y.H.; Wu, D. Incorporating institutional and spatial factors in the selection of the optimal locations of public electric vehicle charging facilities: A case study of Beijing, China. Transp. Res. Part C Emerg. Technol. 2016, 67, 131–148. [Google Scholar] [CrossRef]
- Lam, A.Y.S.; Leung, Y.W.; Chu, X. Electric Vehicle Charging Station Placement: Formulation, Complexity, and Solutions. IEEE Trans. Smart Grid 2014, 5, 2846–2856. [Google Scholar] [CrossRef] [Green Version]
- Zhang, H.; Hu, Z.; Xu, Z.; Song, Y. An Integrated Planning Framework for Different Types of PEV Charging Facilities in Urban Area. IEEE Trans. Smart Grid 2016, 7, 2273–2284. [Google Scholar] [CrossRef]
- Hodgson, M.J. A Flow-Capturing Location-Allocation Model. Geogr. Anal. 1990, 22, 270–279. [Google Scholar] [CrossRef]
- He, F.; Yin, Y.; Zhou, J. Deploying public charging stations for electric vehicles on urban road networks. Transp. Res. Part C Emerg. Technol. 2015, 60, 227–240. [Google Scholar] [CrossRef]
- Cruz-Zambrano, M.; Corchero, C.; Igualada-Gonzalez, L.; Bernardo, V. Optimal location of fast charging stations in Barcelona: A flow-capturing approach. In Proceedings of the 2013 10th International Conference on the European Energy Market (EEM), Stockholm, Sweden, 27–31 May 2013; pp. 1–6. [Google Scholar] [CrossRef] [Green Version]
- Upchurch, C.; Kuby, M. Comparing the p-median and flow-refueling models for locating alternative-fuel stations. J. Transp. Geogr. 2010, 18, 750–758. [Google Scholar] [CrossRef]
- Shareef, H.; Islam, M.M.; Mohamed, A. A review of the stage-of-the-art charging technologies, placement methodologies, and impacts of electric vehicles. Renew. Sustain. Energy Rev. 2016, 64, 403–420. [Google Scholar] [CrossRef]
- Zhang, Y.; Liu, X.; Zhang, T.; Gu, Z. Review of the Electric Vehicle Charging Station Location Problem. In Dependability in Sensor, Cloud, and Big Data Systems and Applications; Wang, G., Bhuiyan, M.Z.A., de Di Capitani Vimercati, S., Ren, Y., Eds.; Communications in Computer and Information Science; Springer: Singapore, 2019; Volume 1123, pp. 435–445. [Google Scholar] [CrossRef]
- Pagany, R.; Ramirez Camargo, L.; Dorner, W. A review of spatial localization methodologies for the electric vehicle charging infrastructure. Int. J. Sustain. Transp. 2019, 13, 433–449. [Google Scholar] [CrossRef] [Green Version]
- Pallonetto, F.; Galvani, M.; Torti, A.; Vantini, S. A Framework for Analysis and Expansion of Public Charging Infrastructure under Fast Penetration of Electric Vehicles. World Electr. Veh. J. 2020, 11, 18. [Google Scholar] [CrossRef] [Green Version]
- Wagner, S.; Götzinger, M.; Neumann, D. Optimal Location of Charging Stations in Smart Cities: A Points of Interest Based Approach. In International Conference on Information Systems. 2013, Volume 3, pp. 2838–2855. Available online: https://aisel.aisnet.org/icis2013/proceedings/BreakthroughIdeas/12 (accessed on 1 February 2022).
- Bian, C.; Li, H.; Wallin, F.; Avelin, A.; Lin, L.; Yu, Z. Finding the optimal location for public charging stations—A GIS-based MILP approach. Energy Procedia 2019, 158, 6582–6588. [Google Scholar] [CrossRef]
- Wirges, J. Planning the Charging Infrastructure for Electric Vehicles in Cities and Regions; KIT Scientific Publishing: Karlsruhe, Germany, 2016. [Google Scholar] [CrossRef]
- Brost, W.; Funke, T.; Philipsen, R.; Brell, T.; Ziefle, M. Integrated Model Approach STELLA Method of Site Identification for Charging Infrastructure. IFAC-PapersOnLine 2018, 51, 206–211. [Google Scholar] [CrossRef]
- Dong, J.; Liu, C.; Lin, Z. Charging infrastructure planning for promoting battery electric vehicles: An activity-based approach using multiday travel data. Transp. Res. Part C Emerg. Technol. 2014, 38, 44–55. [Google Scholar] [CrossRef] [Green Version]
- Friese, P.A.; Michalk, W.; Fischer, M.; Hardt, C.; Bogenberger, K. Charging Point Usage in Germany—Automated Retrieval, Analysis, and Usage Types Explained. Sustainability 2021, 13, 13046. [Google Scholar] [CrossRef]
- Funke, S.Á.; Gnann, T.; Plötz, P. Addressing the Different Needs for Charging Infrastructure: An Analysis of Some Criteria for Charging Infrastructure Set-up. In E-Mobility in Europe; Leal Filho, W., Kotter, R., Eds.; Green Energy and Technology, Springer International Publishing: Cham, Switzerland, 2015; pp. 73–90. [Google Scholar] [CrossRef]
- Helmus, J.; van den Hoed, R. Key Performance Indicators of Charging infrastructure. World Electr. Veh. J. 2016, 8, 733–741. [Google Scholar] [CrossRef] [Green Version]
- Huang, K.; Kanaroglou, P.; Zhang, X. The design of electric vehicle charging network. Transp. Res. Part D Transp. Environ. 2016, 49, 1–17. [Google Scholar] [CrossRef] [Green Version]
- Jordán, J.; Palanca, J.; del Val, E.; Julian, V.; Botti, V. A Multi-Agent System for the Dynamic Emplacement of Electric Vehicle Charging Stations. Appl. Sci. 2018, 8, 313. [Google Scholar] [CrossRef] [Green Version]
- Luo, L.; Gu, W.; Zhou, S.; Huang, H.; Gao, S.; Han, J.; Wu, Z.; Dou, X. Optimal planning of electric vehicle charging stations comprising multi-types of charging facilities. Appl. Energy 2018, 226, 1087–1099. [Google Scholar] [CrossRef]
- Maase, S.; Dilrosun, X.; Kooi, M.; van den Hoed, R. Performance of Electric Vehicle Charging Infrastructure: Development of an Assessment Platform Based on Charging Data. World Electr. Veh. J. 2018, 9, 25. [Google Scholar] [CrossRef] [Green Version]
- Niels, T.; Gerstenberger, M.; Bogenberger, K.; Hessel, C.; Gigl, A.; Wagner, K. Model-based optimization of public charging infrastructure planning in rural areas. Transp. Res. Procedia 2019, 41, 342–353. [Google Scholar] [CrossRef]
- Pevec, D.; Babic, J.; Kayser, M.A.; Carvalho, A.; Ghiassi-Farrokhfal, Y.; Podobnik, V. A data-driven statistical approach for extending electric vehicle charging infrastructure. Int. J. Energy Res. 2018, 42, 3102–3120. [Google Scholar] [CrossRef]
- Raposo, J.; Rodrigues, A.; Silva, C.; Dentinho, T. A multi-criteria decision aid methodology to design electric vehicles public charging networks. AIP Adv. 2015, 5, 057123. [Google Scholar] [CrossRef] [Green Version]
- Shirmohammadli, A.; Vallée, D. Developing a location model for fast charging infrastructure in urban areas. Int. J. Transp. Dev. Integr. 2017, 1, 159–170. [Google Scholar] [CrossRef]
- Straka, M.; Buzna, L. Preprocessing of GIS data for electric vehicle charging stations analysis and evaluation of the predictors significance. Transp. Res. Procedia 2019, 40, 1583–1590. [Google Scholar] [CrossRef]
- Straka, M.; de Falco, P.; Ferruzzi, G.; Proto, D.; van der Poel, G.; Khormali, S.; Buzna, L. Predicting Popularity of Electric Vehicle Charging Infrastructure in Urban Context. IEEE Access 2020, 8, 11315–11327. [Google Scholar] [CrossRef]
- Straka, M.; Carvalho, R.; van der Poel, G.; Buzna, L. Analysis of Energy Consumption at Slow Charging Infrastructure for Electric Vehicles. IEEE Access 2021, 9, 53885–53901. [Google Scholar] [CrossRef]
- Wolbertus, R.; Kroesen, M.; van den Hoed, R.; Chorus, C. Fully charged: An empirical study into the factors that influence connection times at EV-charging stations. Energy Policy 2018, 123, 1–7. [Google Scholar] [CrossRef] [Green Version]
- Statistisches Bundesamt. Zensus 2011: Bevölkerung im 100 Meter-Gitter. 2011. Available online: https://www.zensus2011.de/DE/Home/Aktuelles/DemografischeGrunddaten.html?nn=559100 (accessed on 18 January 2022).
- Geofabrik.de. OSM-Downloadserver: Hamburg. 2022. Available online: https://download.geofabrik.de/europe/germany/hamburg.html (accessed on 18 January 2022).
- Stadt Hamburg. Transparenzportal Hamburg: Elektro Ladestandorte Hamburg. 2022. Available online: https://suche.transparenz.hamburg.de/dataset/elektro-ladestandorte-hamburg26 (accessed on 18 January 2022).
- Stadt Hamburg. Transparenzportal Hamburg: Flächennutzungsplan Hamburg. 2022. Available online: https://suche.transparenz.hamburg.de/dataset/flachennutzungsplan-hamburg25 (accessed on 18 January 2022).
- van der waerden, P.; Timmermans, H.; de Bruin-Verhoeven, M. Car drivers’ characteristics and the maximum walking distance between parking facility and final destination. J. Transp. Land Use 2017, 10, 1–11. [Google Scholar] [CrossRef] [Green Version]
- Luxen, D.; Vetter, C. Real-time routing with OpenStreetMap data. In Proceedings of the 19th ACM SIGSPATIAL International Conference on Advances in Geographic Information Systems—GIS ’11, Chicago, IL, USA, 1–4 November 2011; Cruz, I., Agrawal, D., Eds.; ACM Press: New York, NY, USA, 2011; p. 513. [Google Scholar] [CrossRef]
- Hecht, C.; Das, S.; Bussar, C.; Sauer, D.U. Representative, empirical, real-world charging station usage characteristics and data in Germany. ETransportation 2020, 6, 100079. [Google Scholar] [CrossRef]
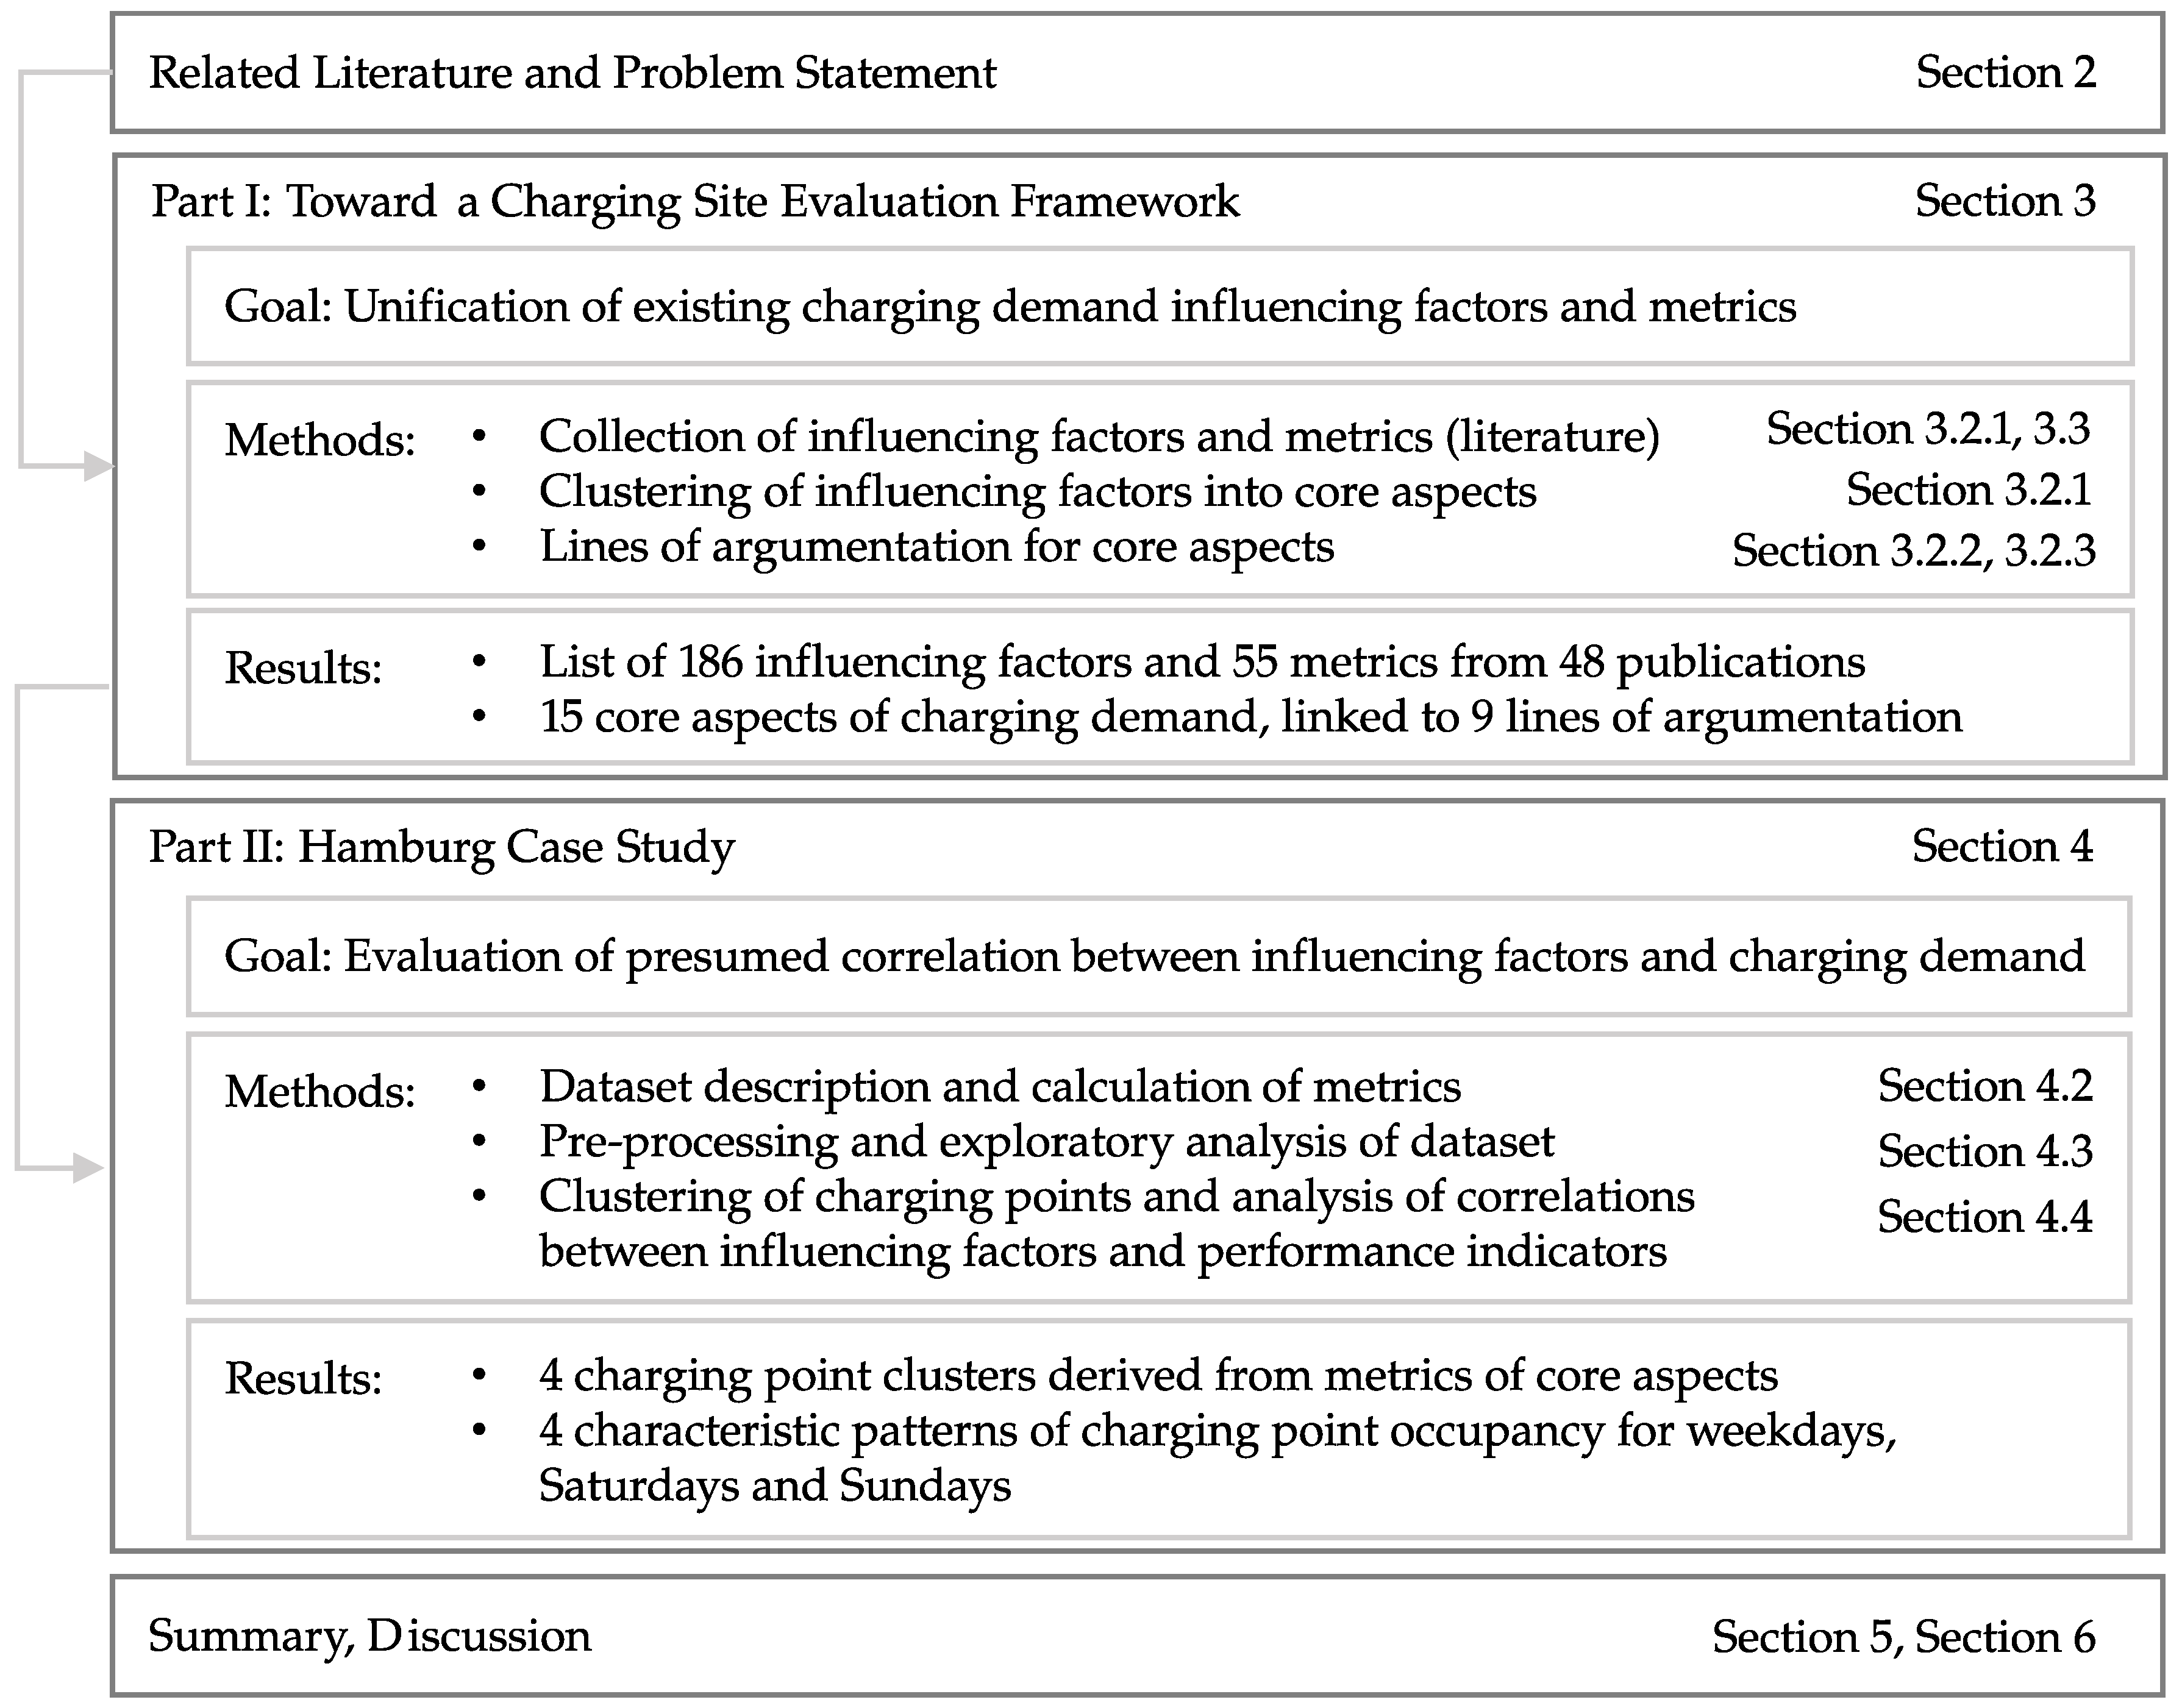

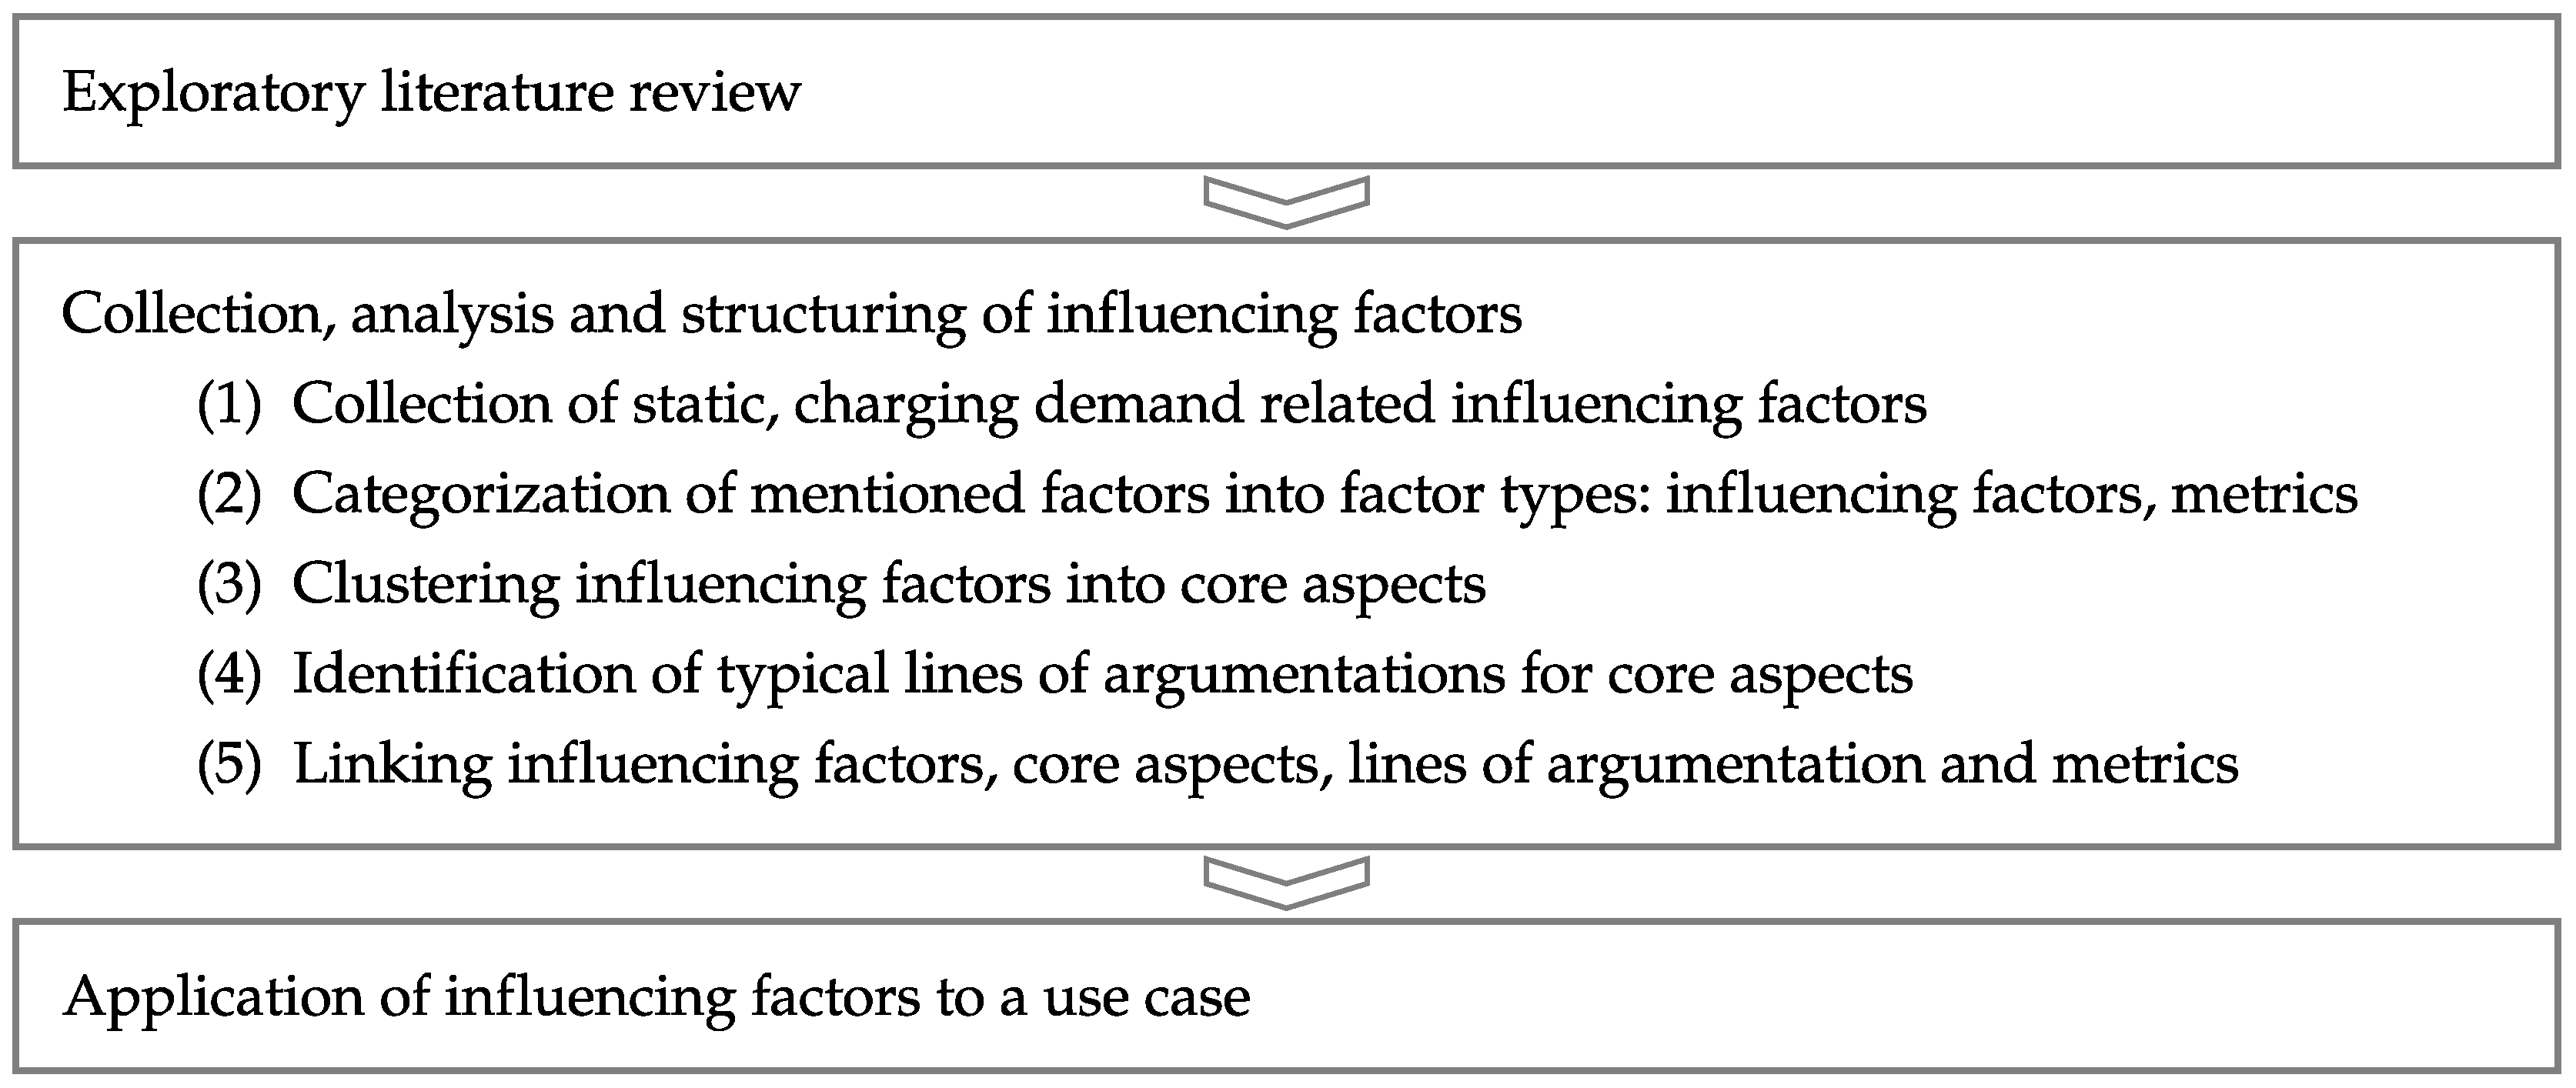
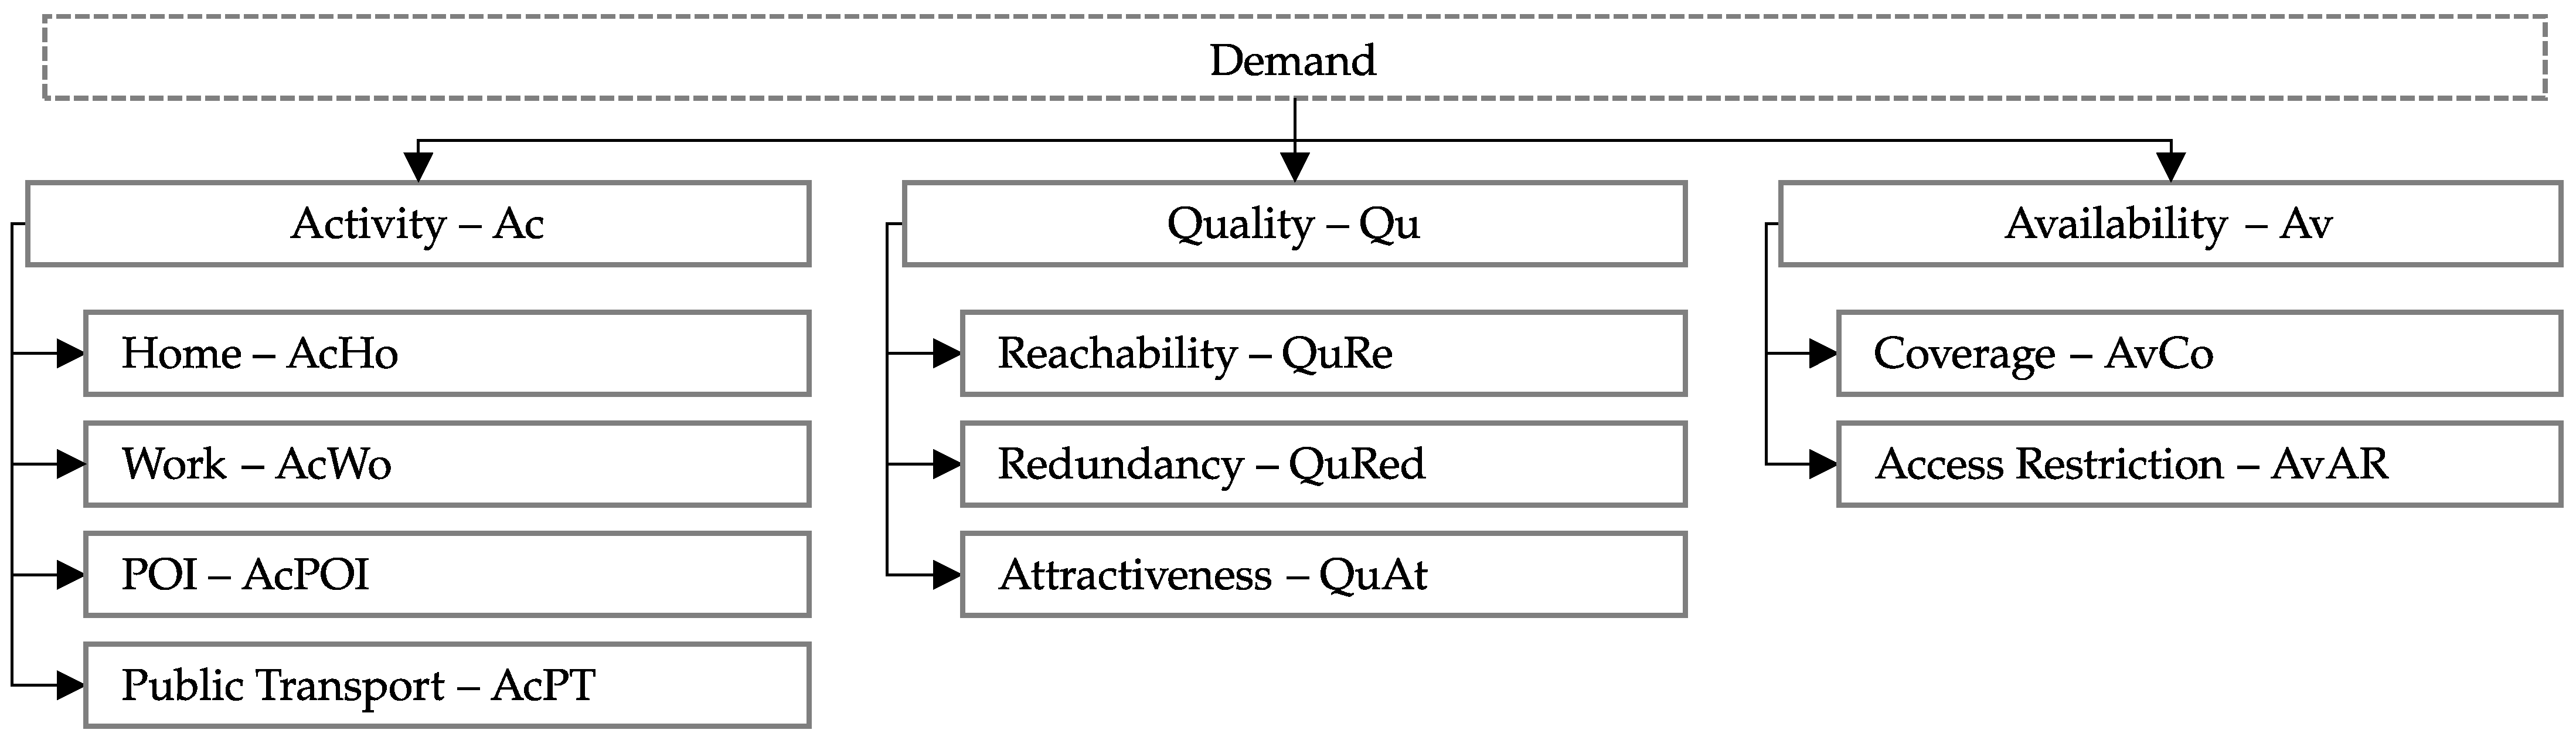
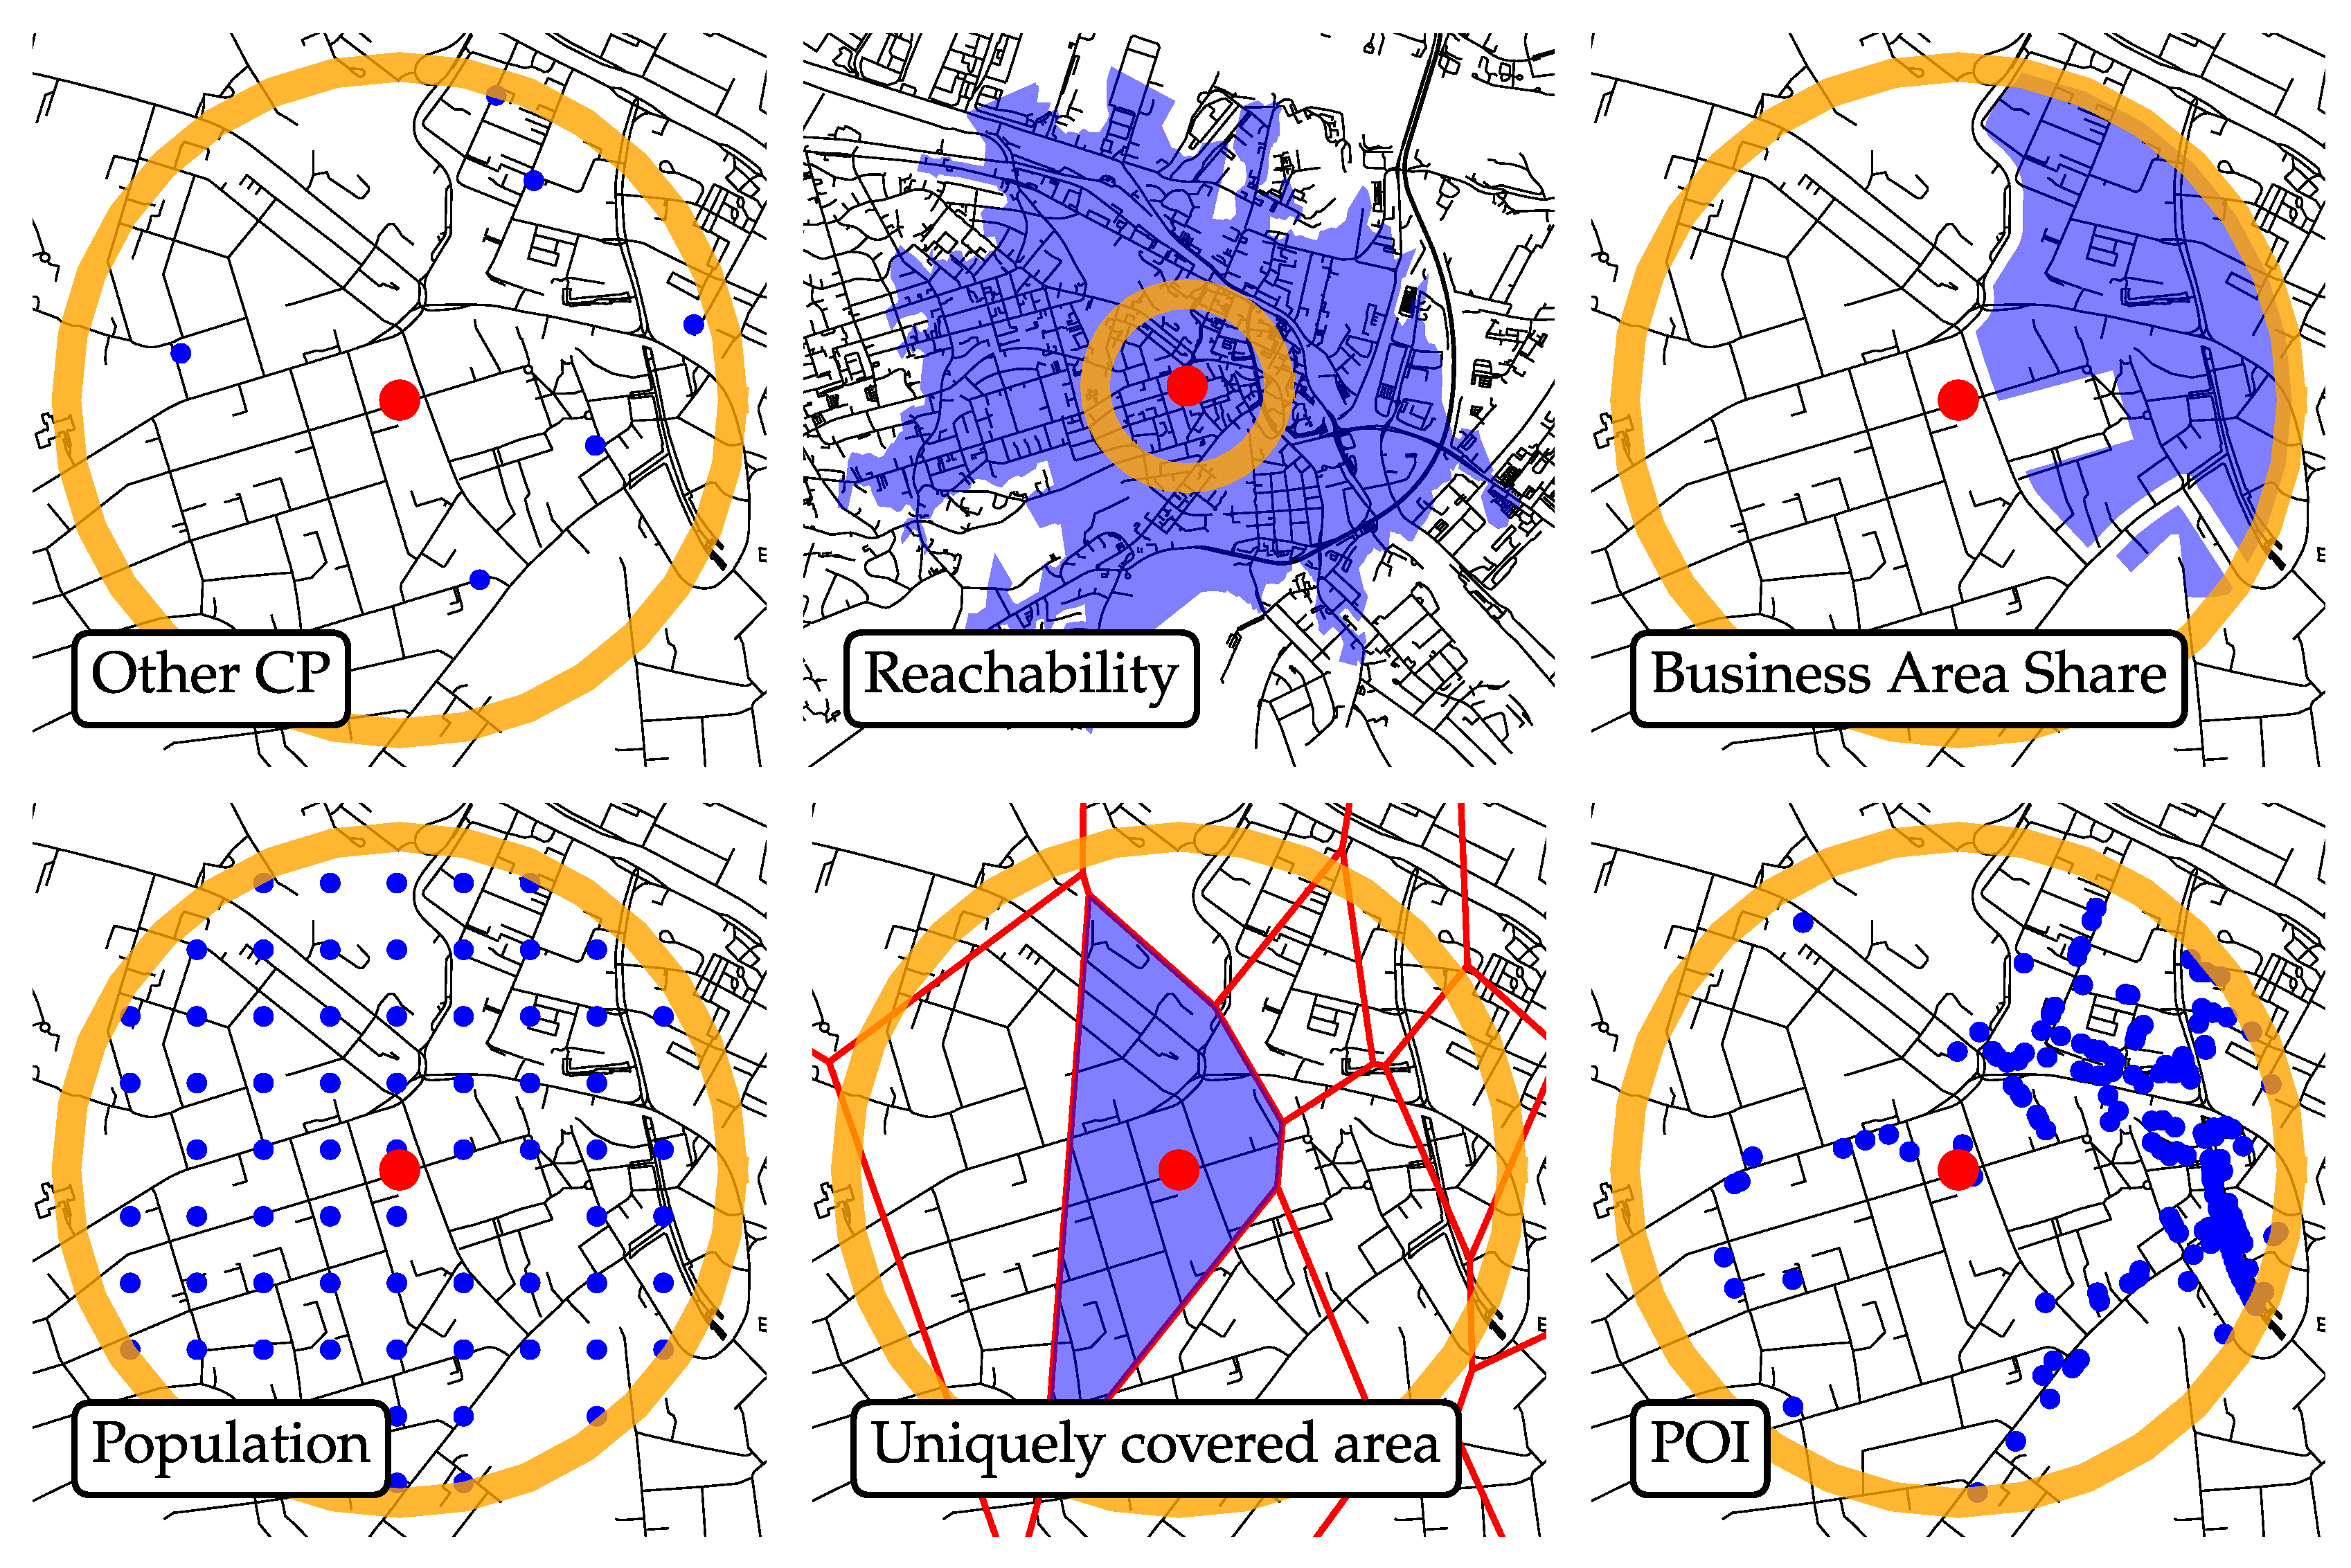
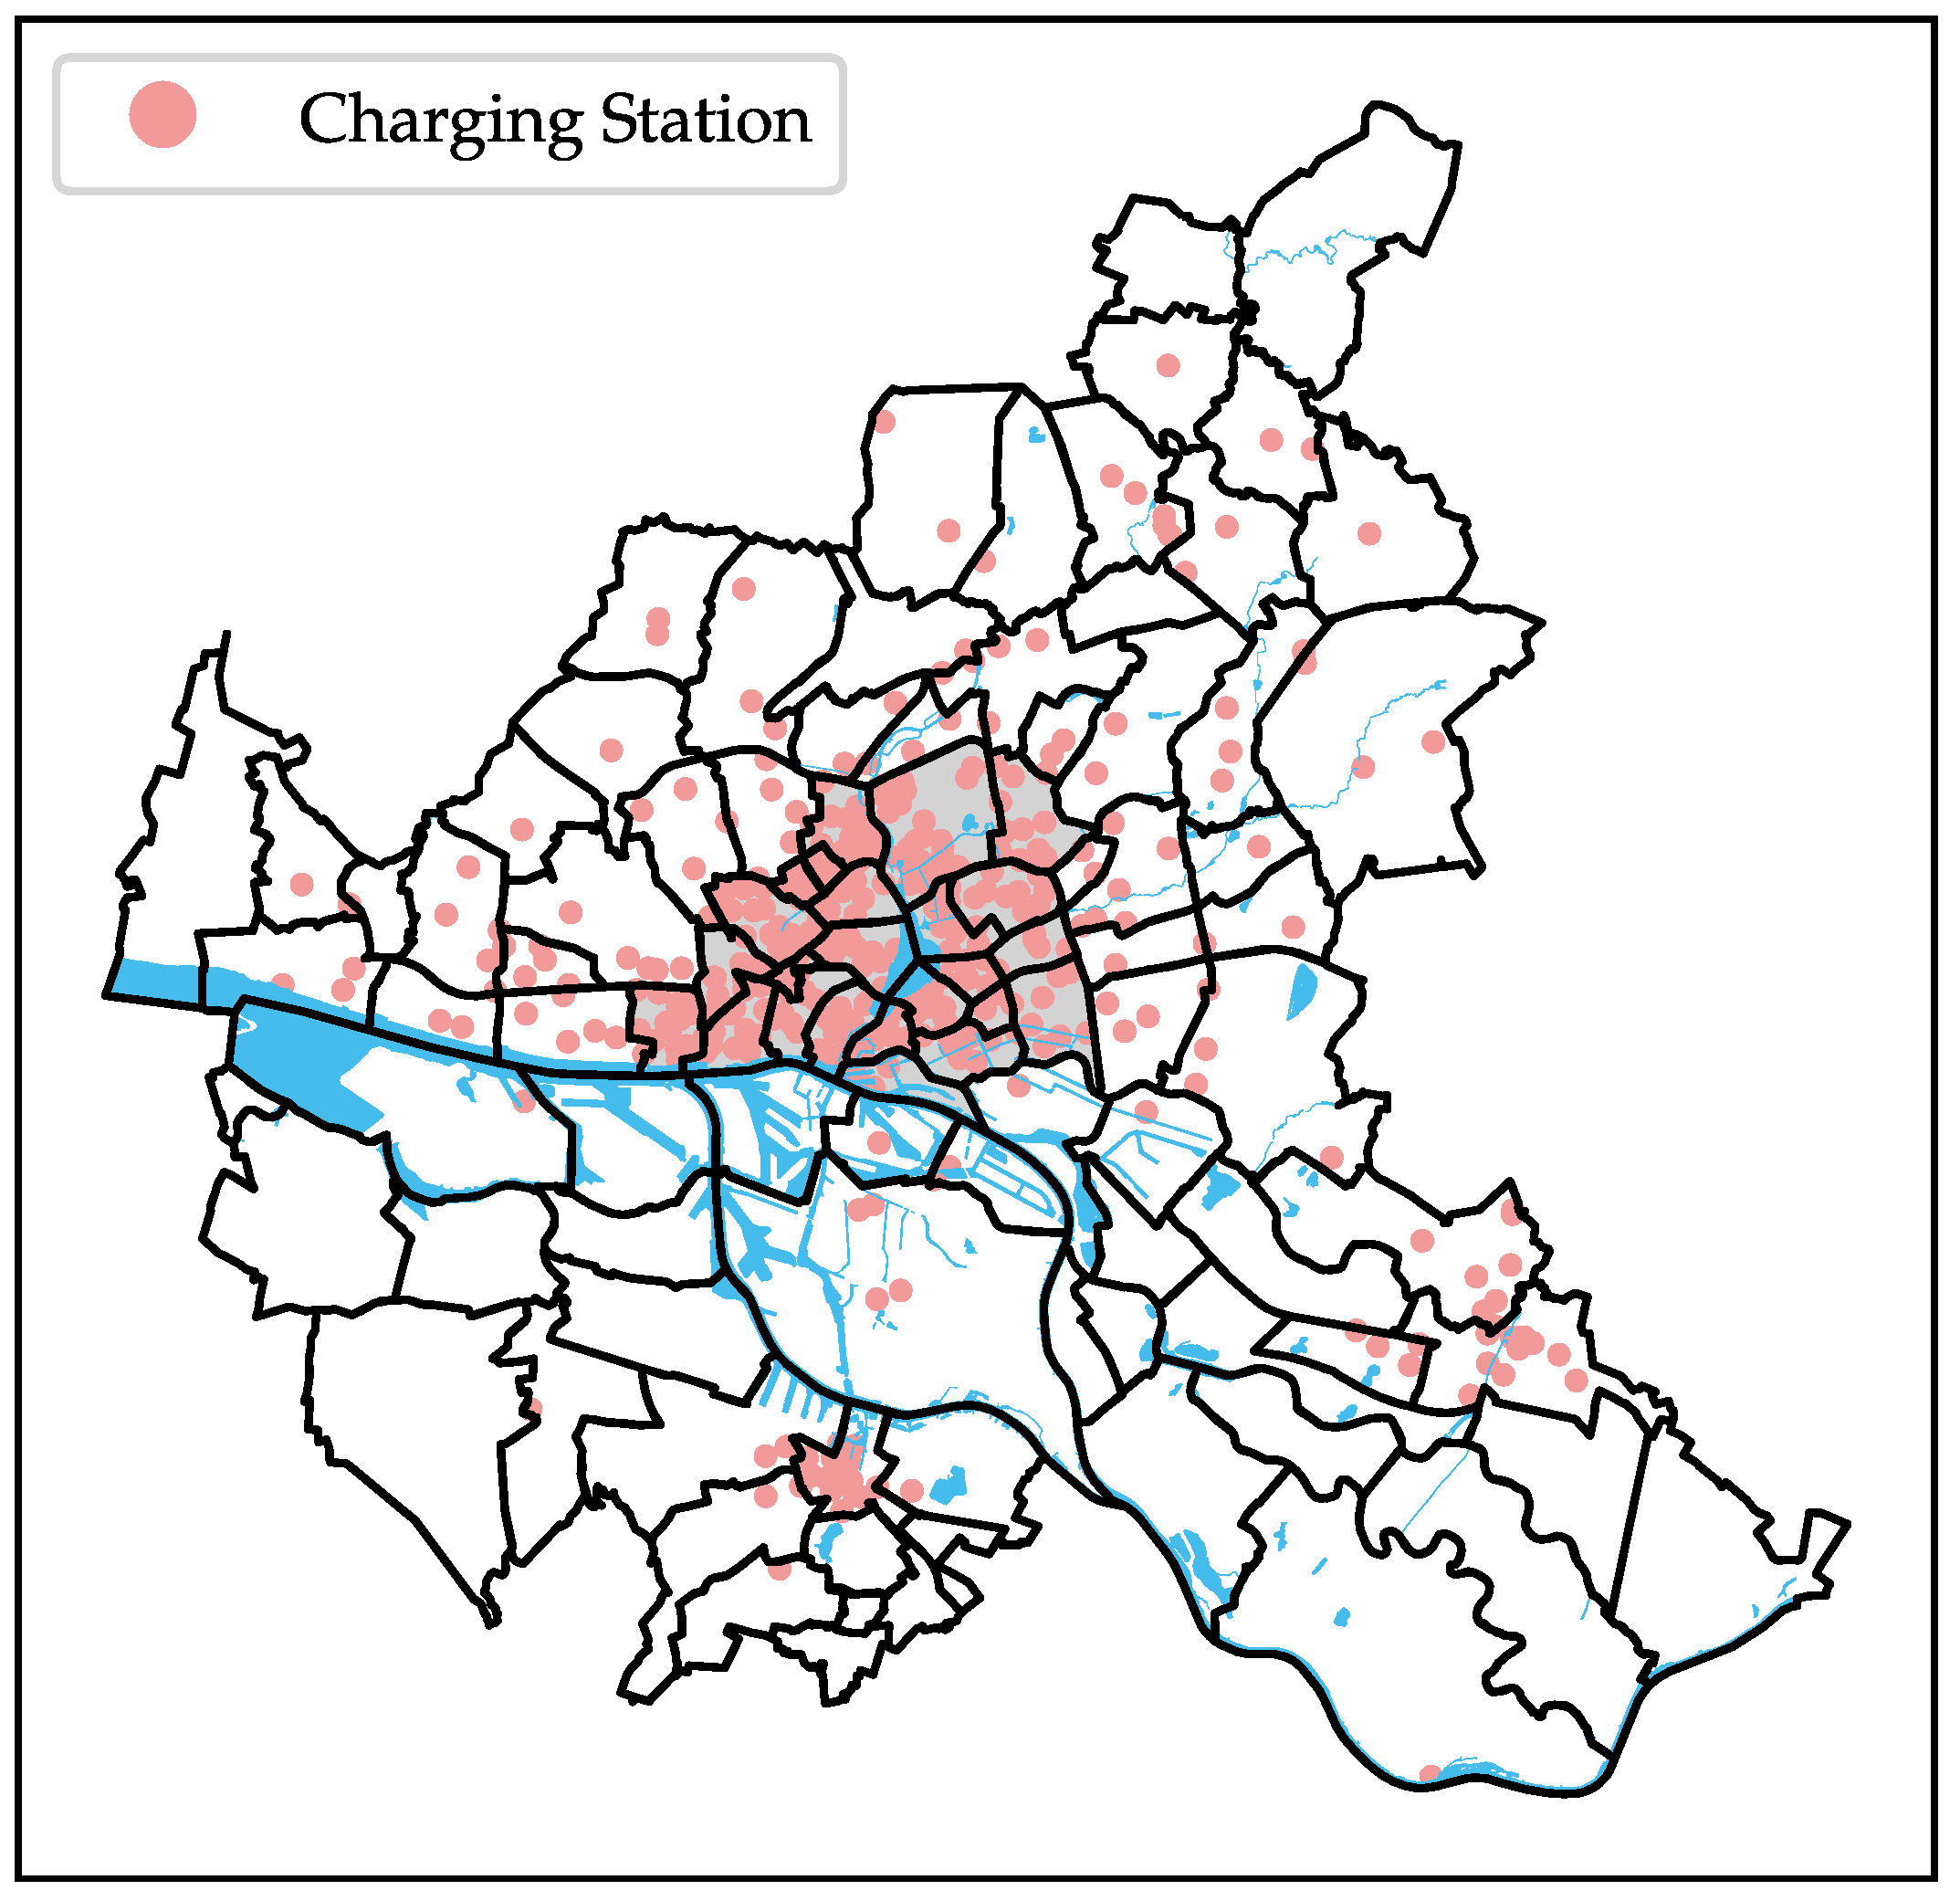
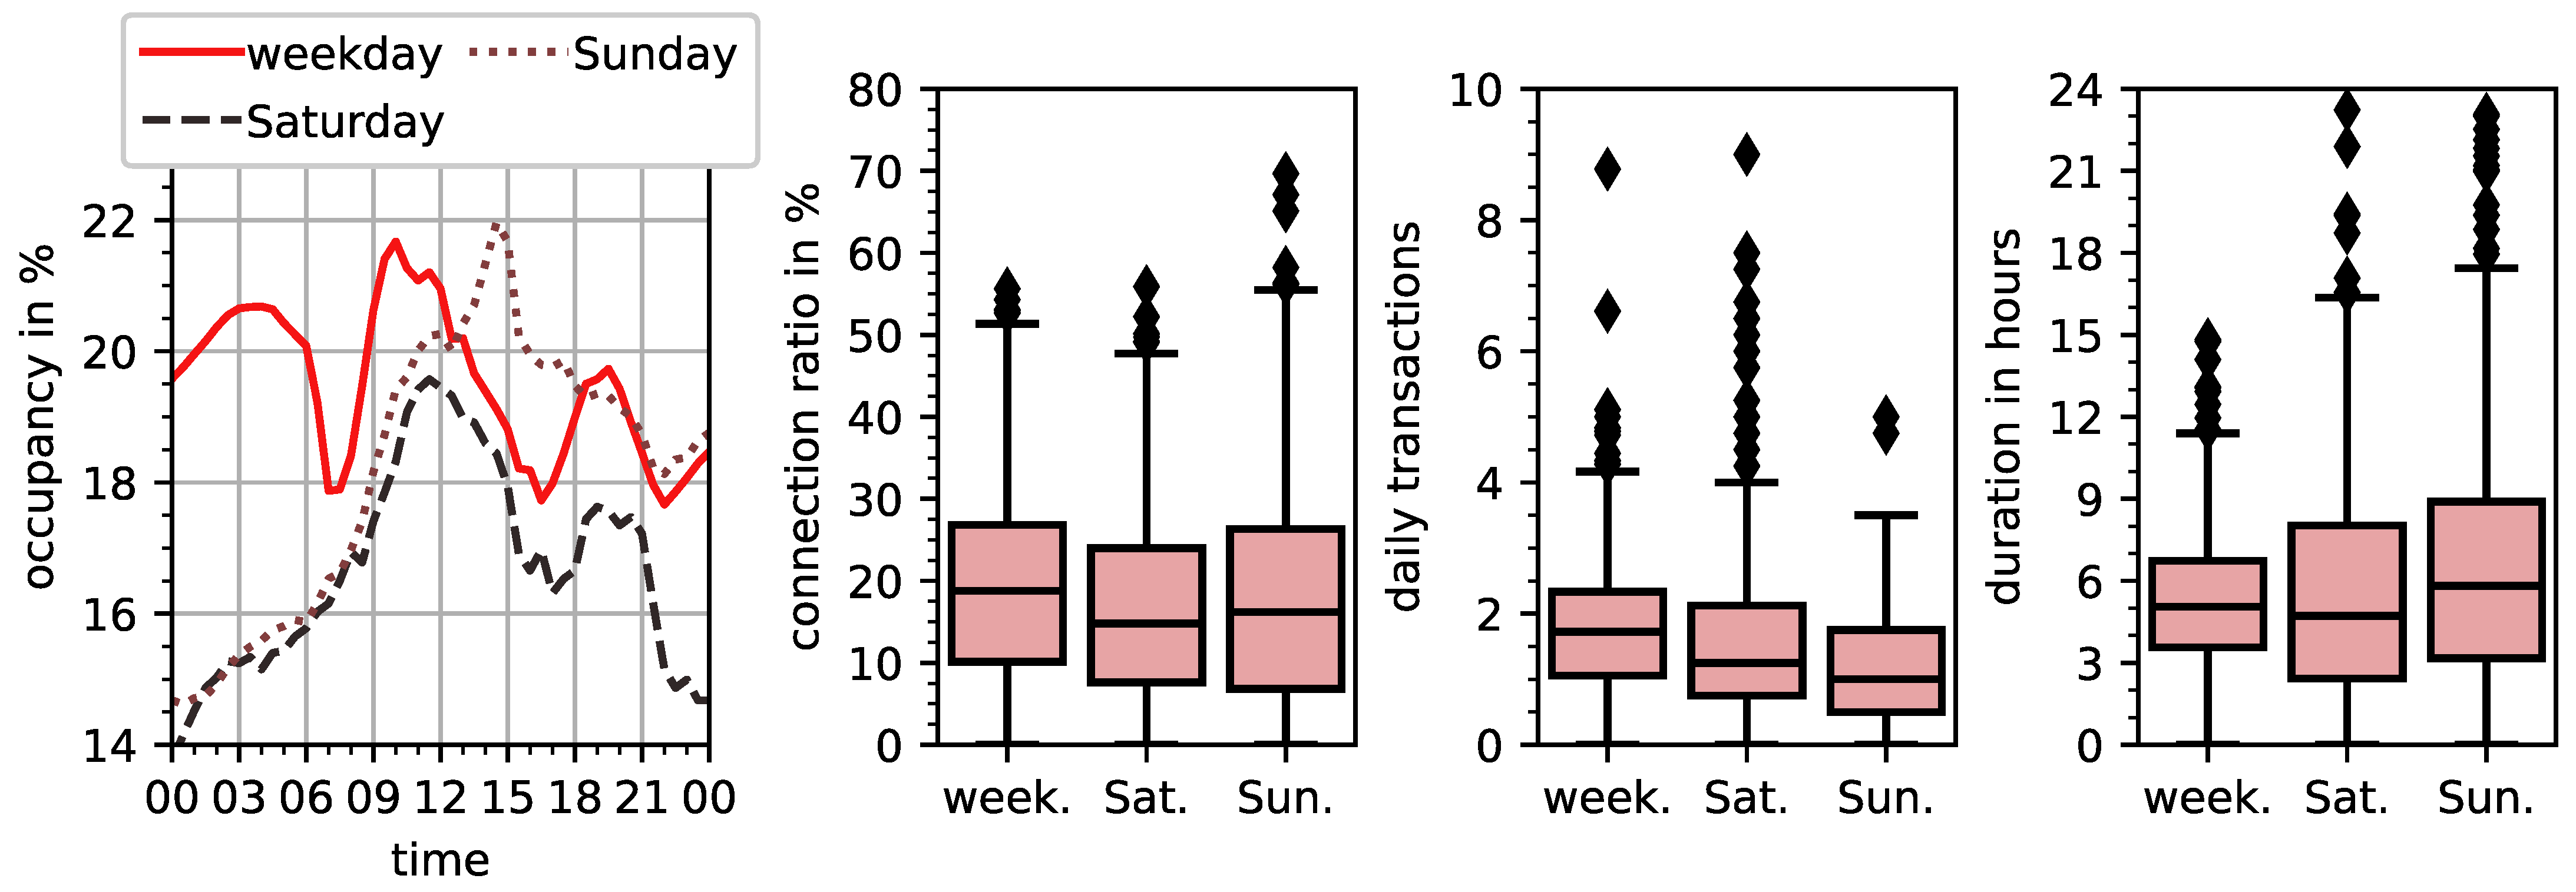
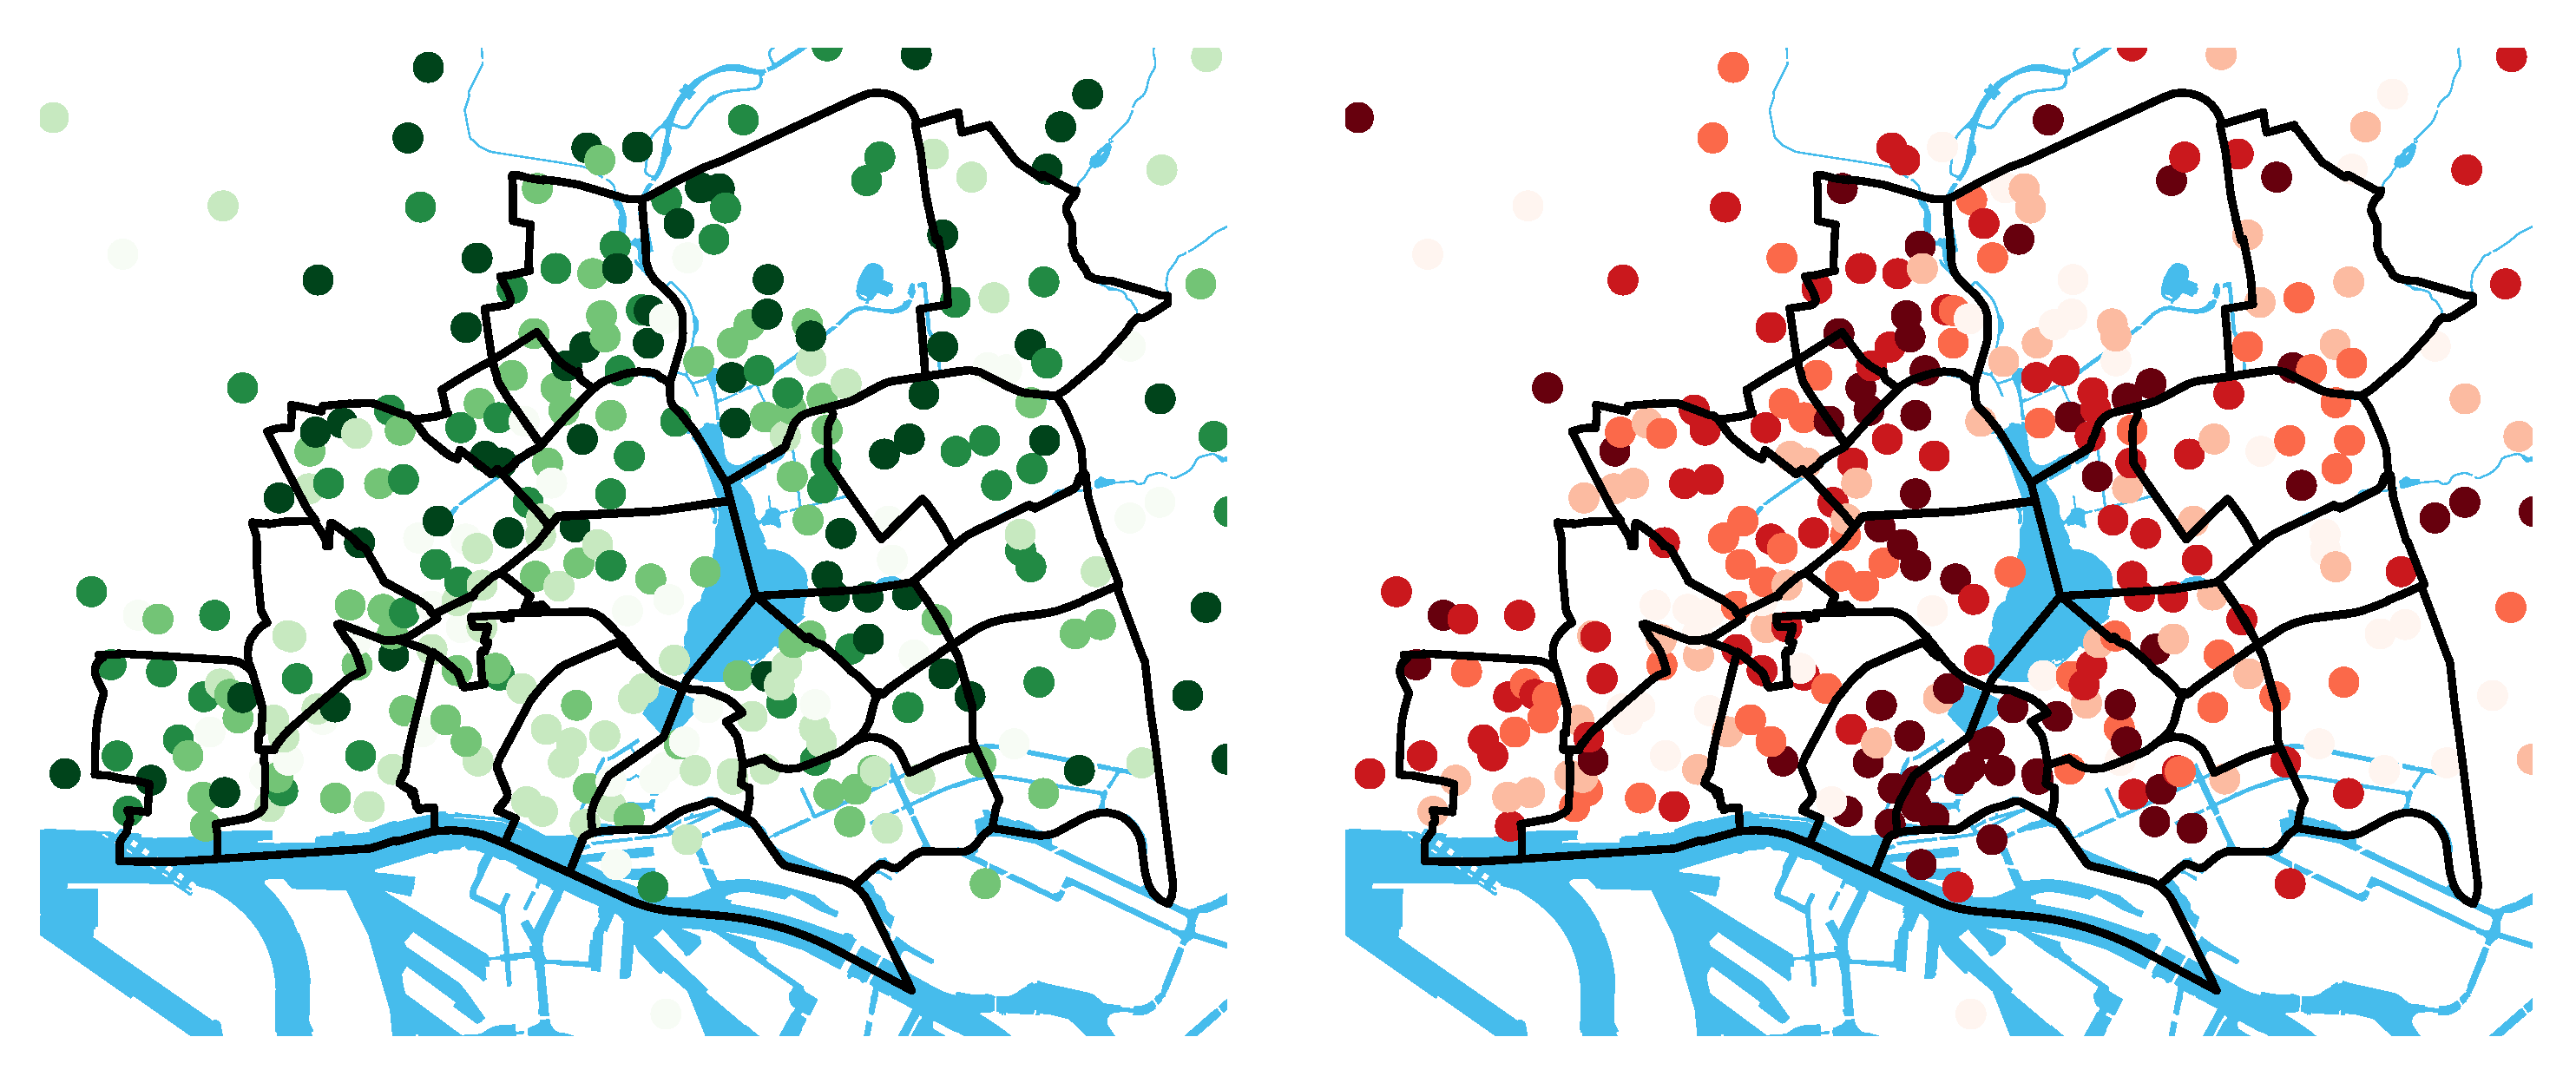
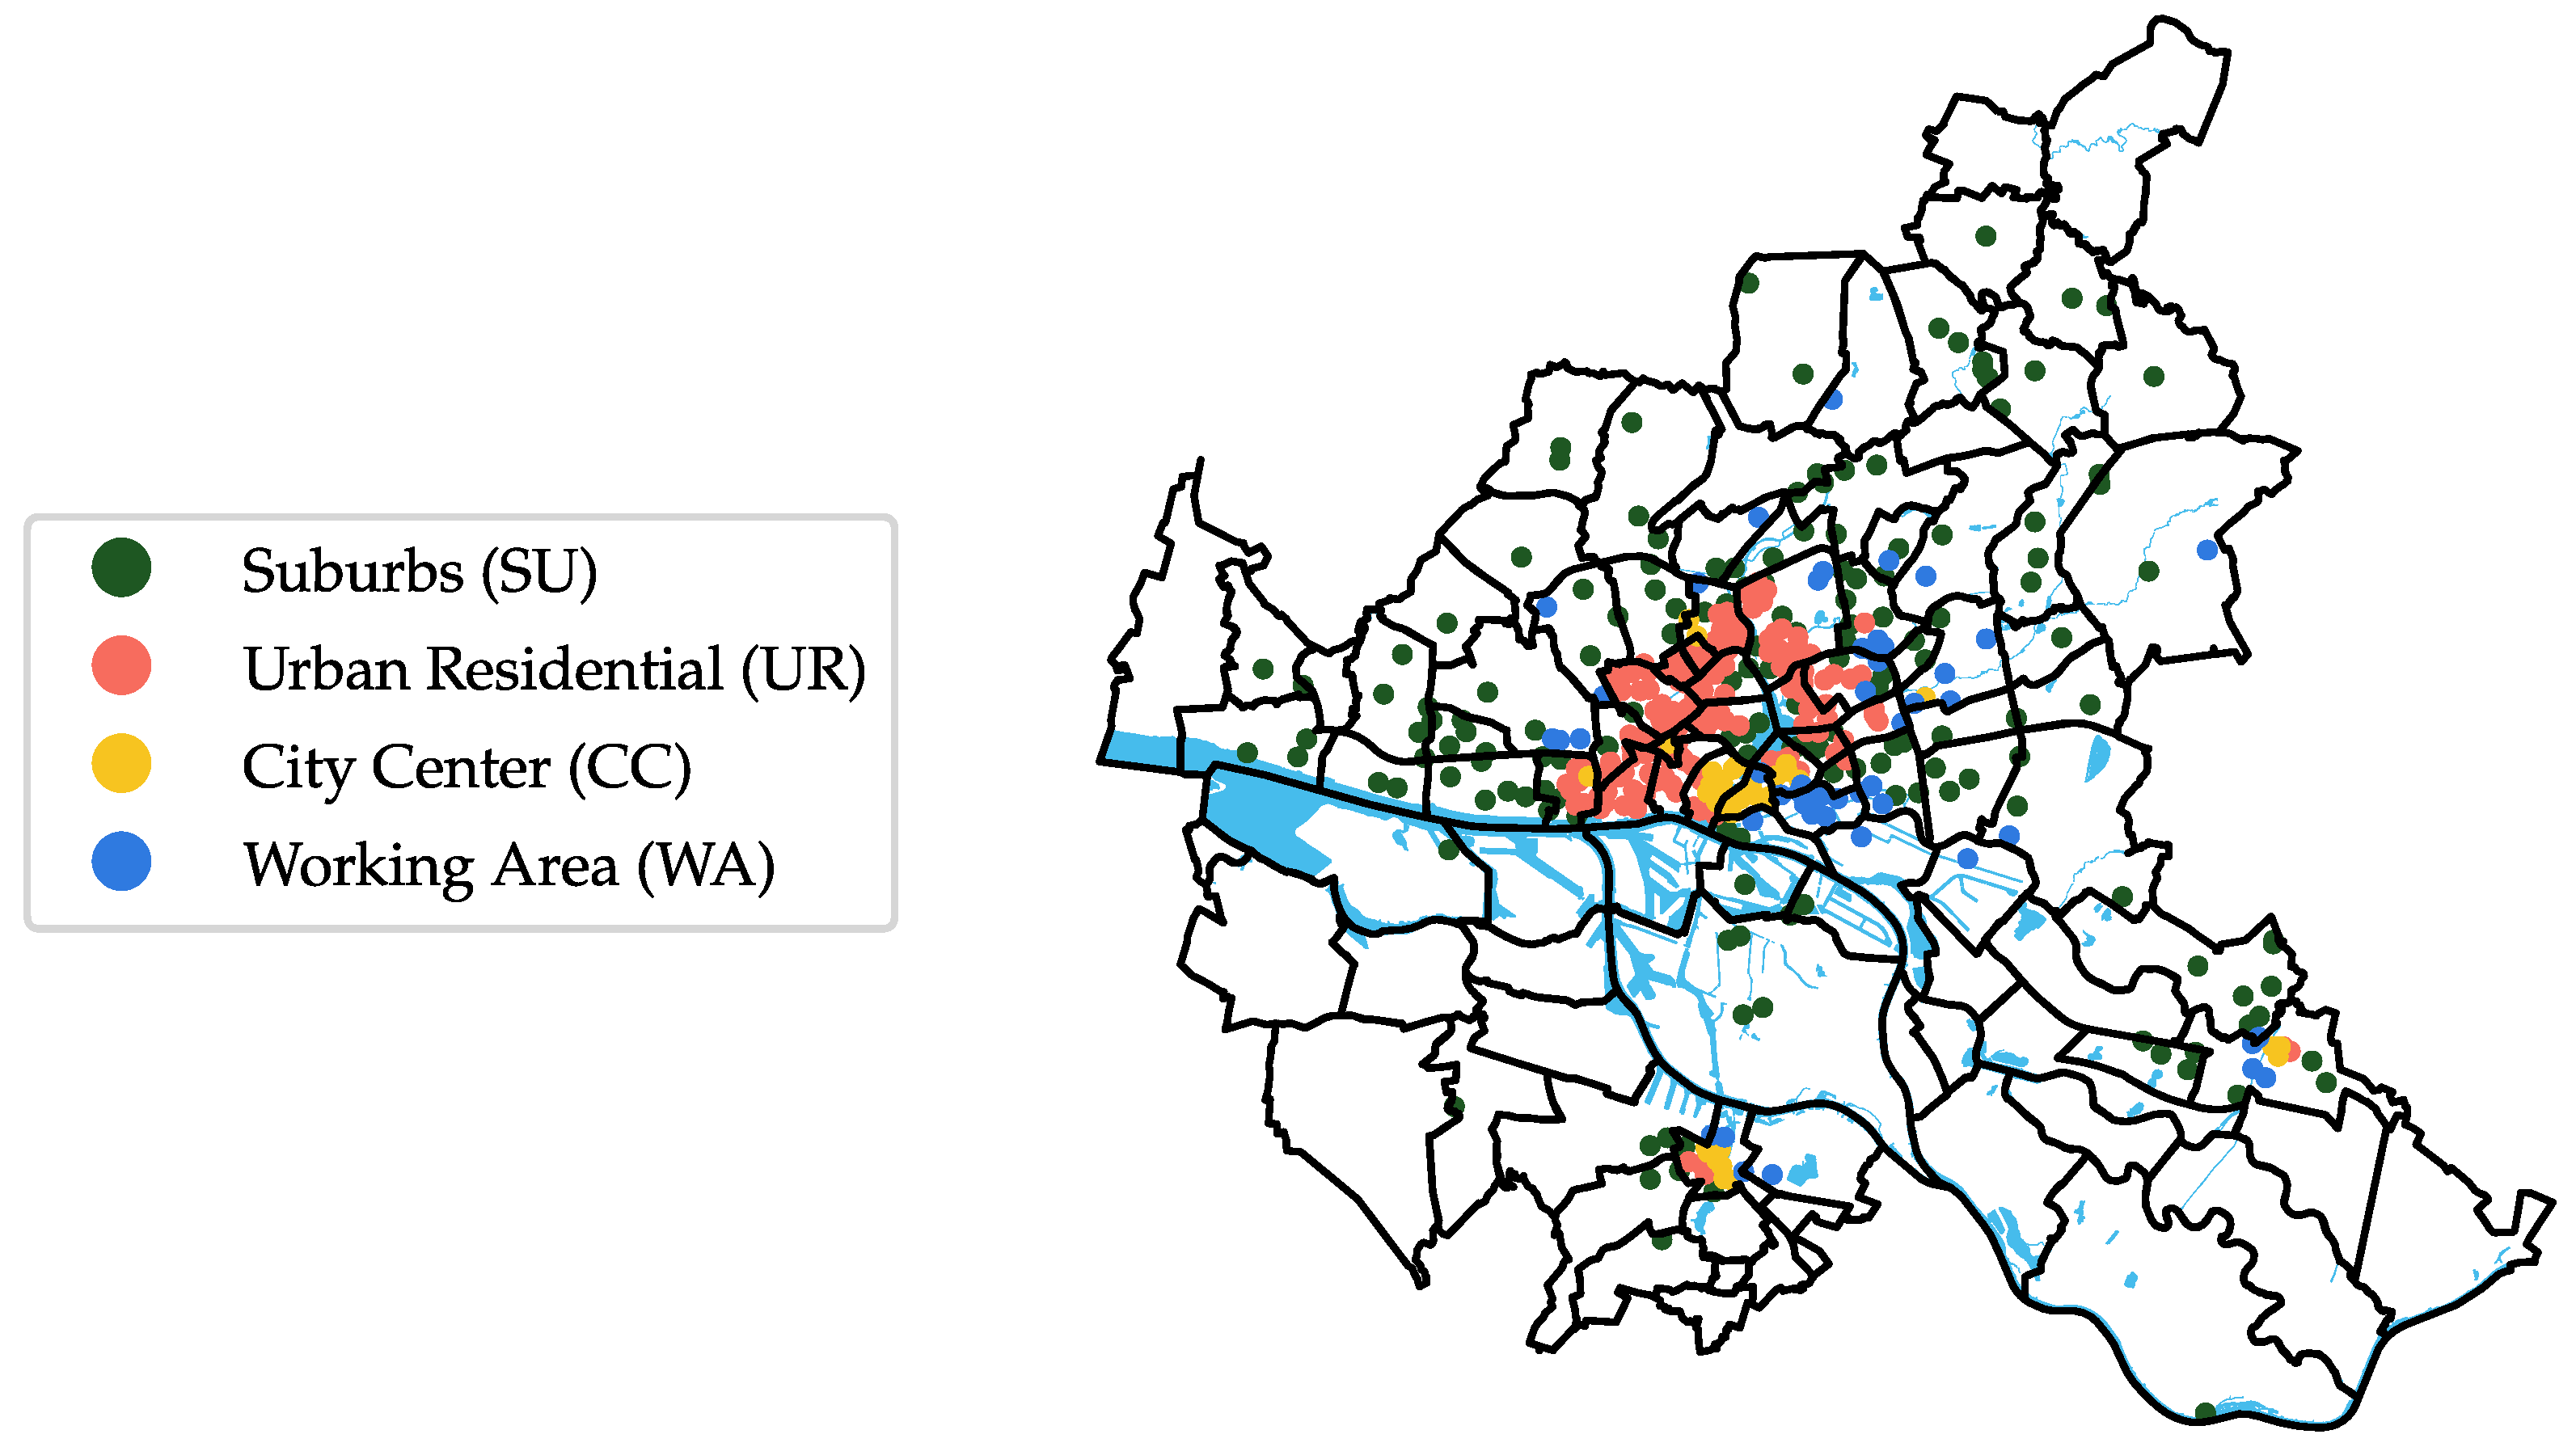

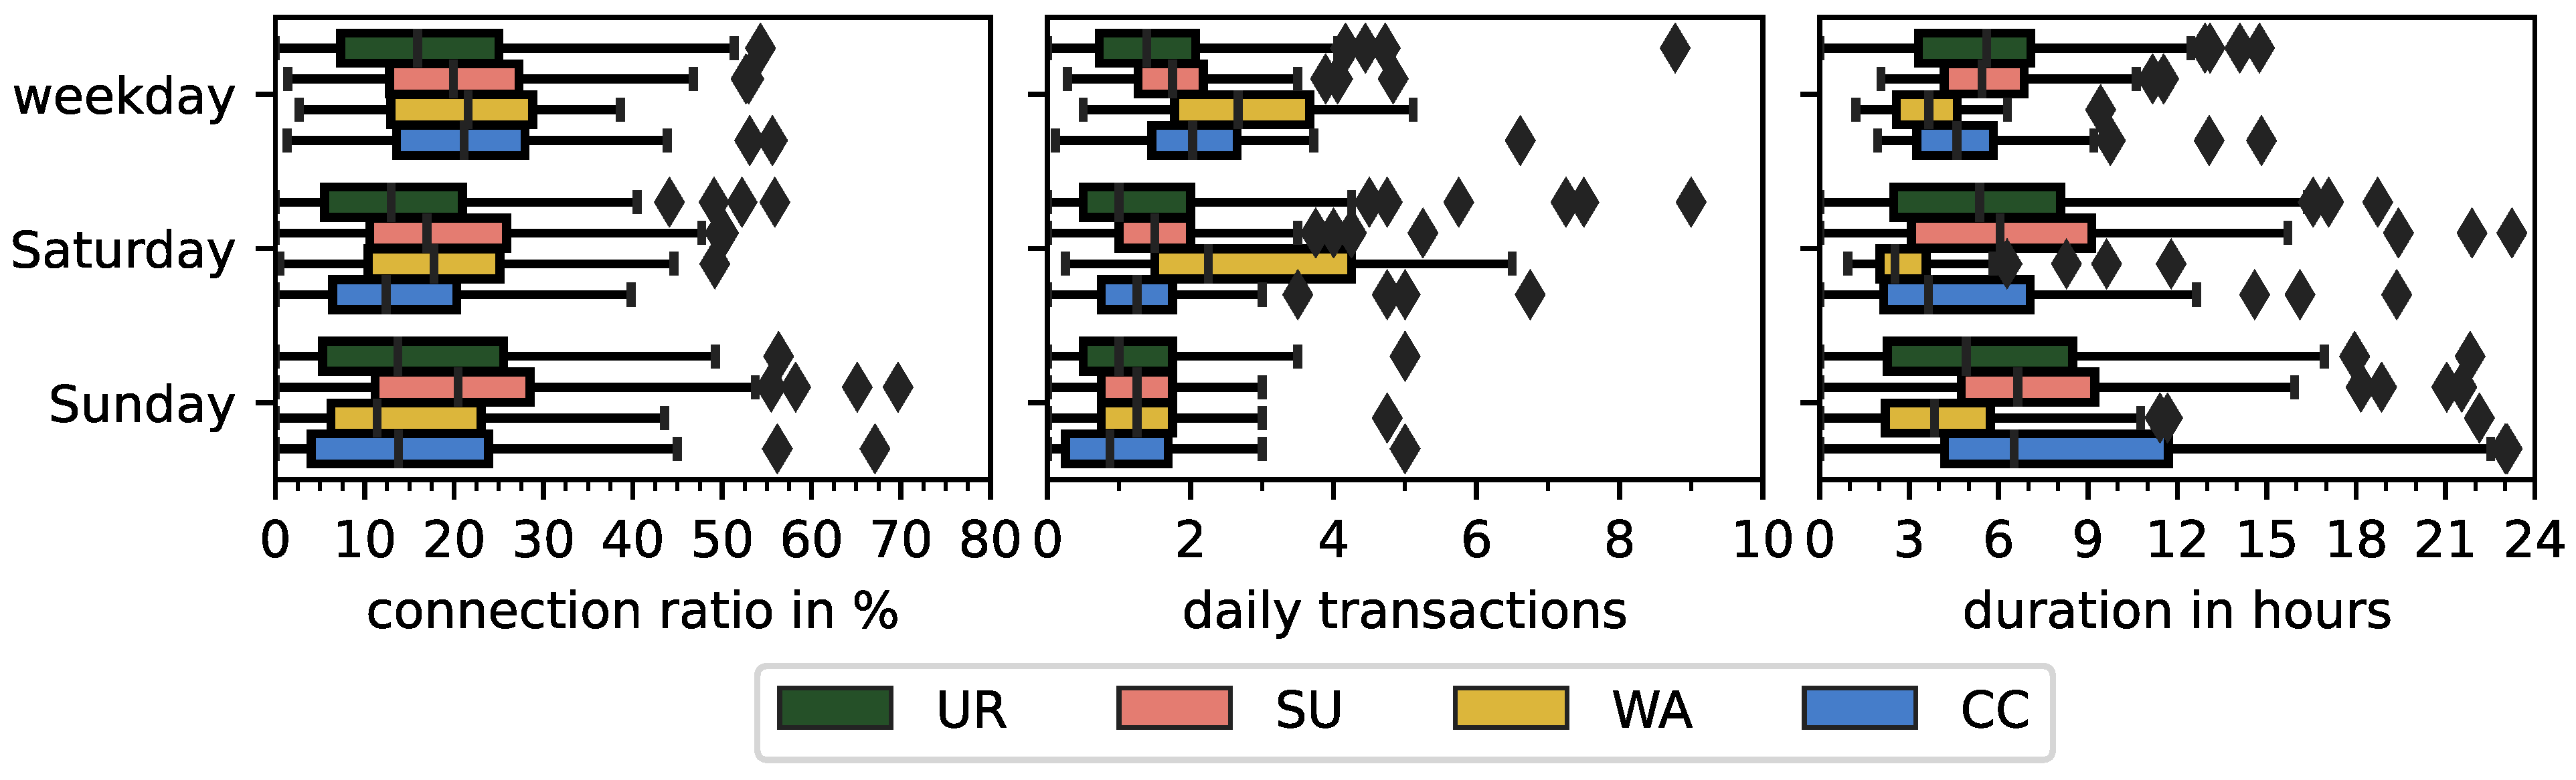
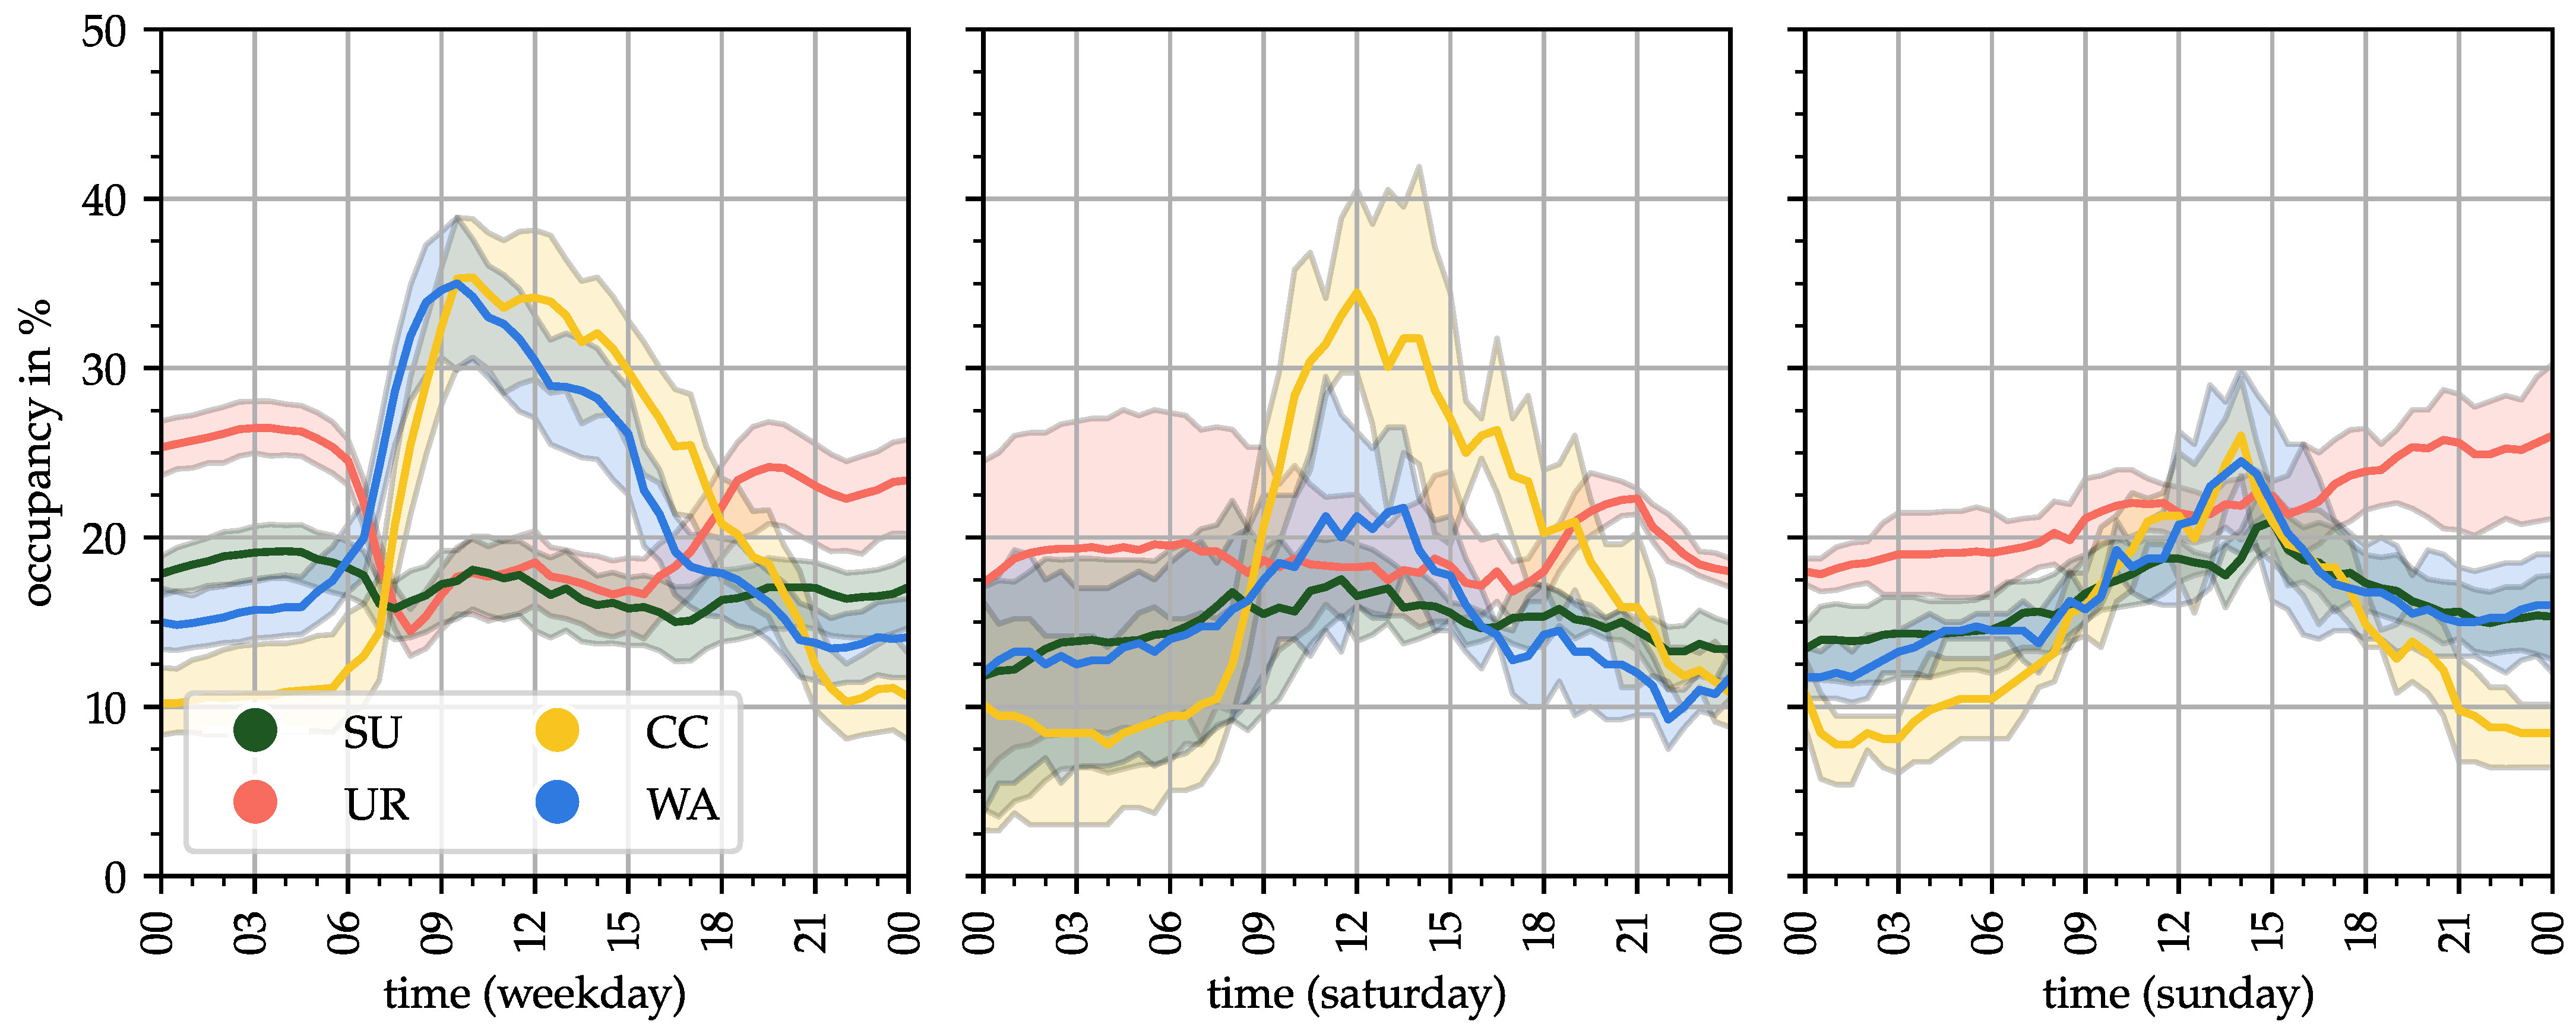
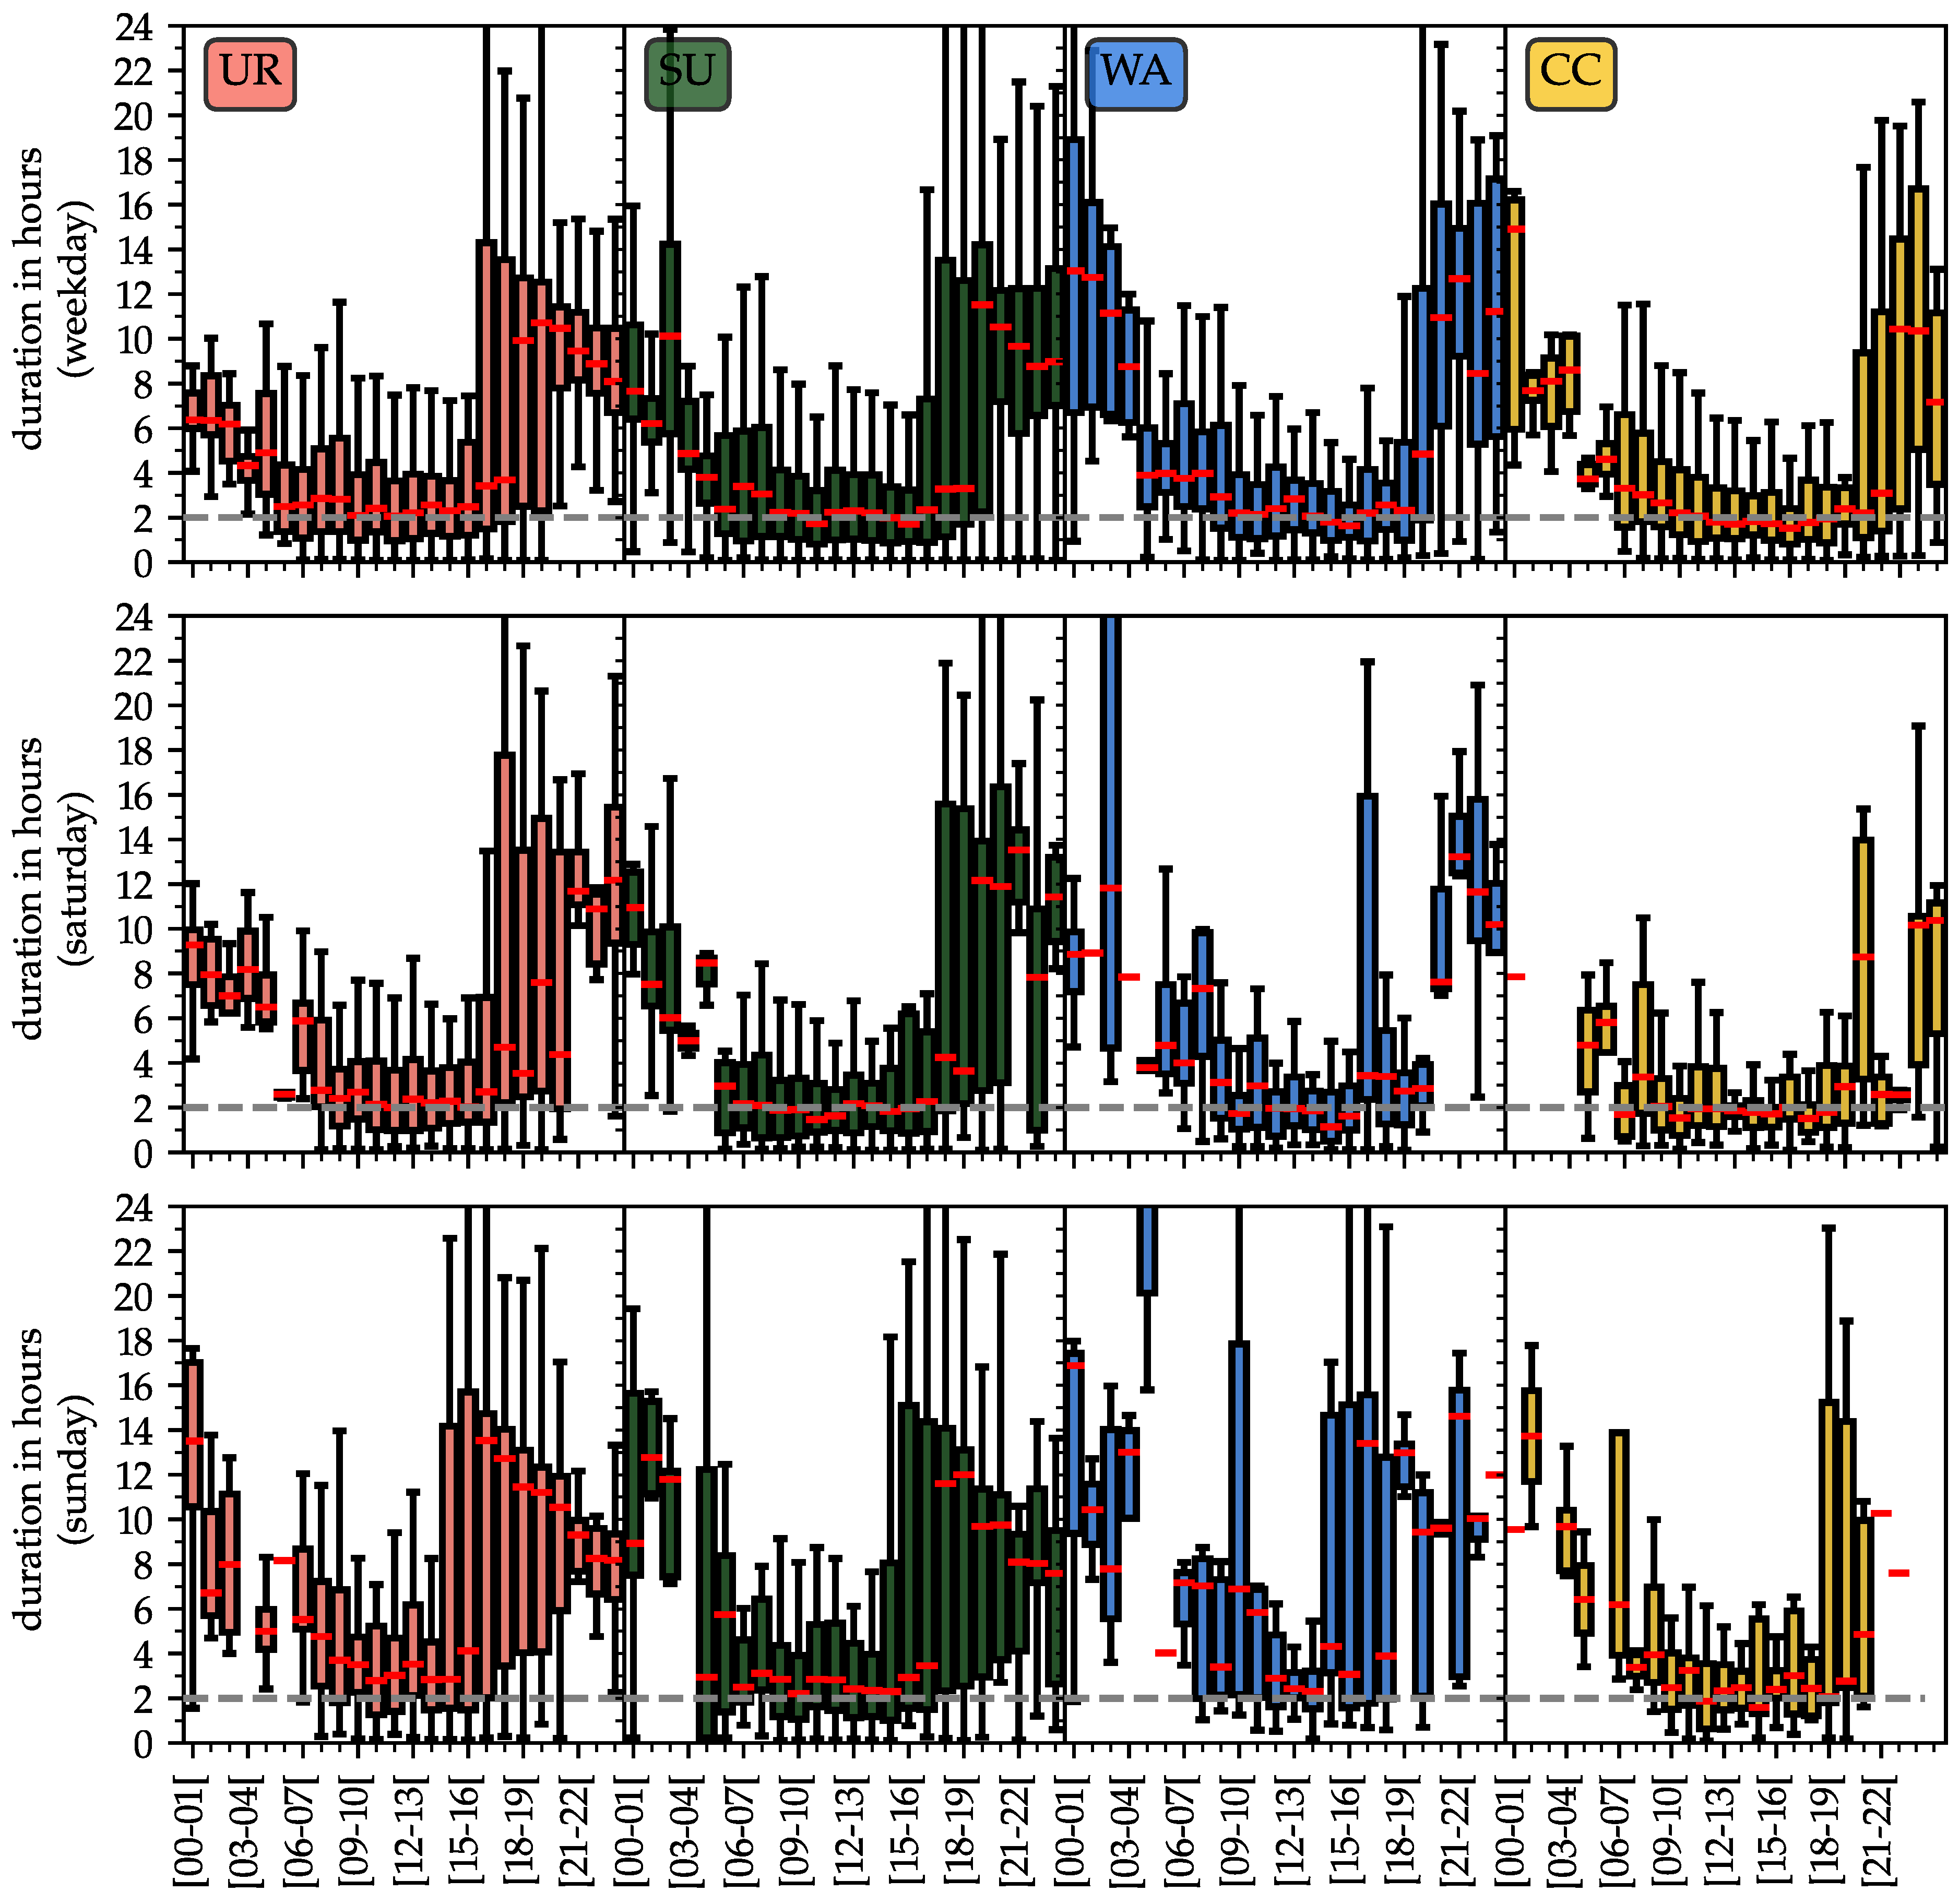
Publisher’s Note: MDPI stays neutral with regard to jurisdictional claims in published maps and institutional affiliations. |
© 2022 by the authors. Licensee MDPI, Basel, Switzerland. This article is an open access article distributed under the terms and conditions of the Creative Commons Attribution (CC BY) license (https://creativecommons.org/licenses/by/4.0/).