


Predicting User Preference for Innovative Features in Intelligent Connected Vehicles from a Cultural Perspective


Abstract
1. Introduction
2. Literature Review
2.1. Cultural Models
2.2. Hofstede’s Cultural Dimensions Theory
2.3. Individual Cultural Orientation
2.4. Summary
3. Materials and Methods
3.1. Control Variables
3.1.1. Demographic Information
3.1.2. Cultural Dimensions and Individual Cultural Orientations
- These cultural dimensions are able to effectively show cultural diversity among different countries and nations;
- These cultural dimensions can clearly explain users’ different performances in automotive human–vehicle interaction and user experience;
- These cultural dimensions have been validated by multiple authoritative experts in the cultural field and are independent of each other across different dimensions.
3.1.3. User Preferences for Innovative HMI features
3.2. Samples and Data Collection
3.3. Measures and Procedure
4. Results
4.1. Assessment of Measurement Models
4.2. Influence Mechanism
4.3. Clustering and Preferences Prediction
5. Discussion
5.1. User Groups Classification and Definition
5.2. User Groups Classification and Definition
5.3. Comparison with Previous Studies
6. Conclusions
- This study selected 18 innovative HMI features widely applied in ICVs and with high user ratings and predicted user preferences from the perspectives of culture and values. It was found that users with a high power distance tend to favor features related to the sense of ceremony and show-off, while those with strong individualism culture are inclined toward more open and personalized IVIS. Users with long-term orientation prefer features that can improve efficiency, while those with low uncertainty avoidance are more attracted to new features. Users with a high level of indulgence are more willing to use entertainment-related features.
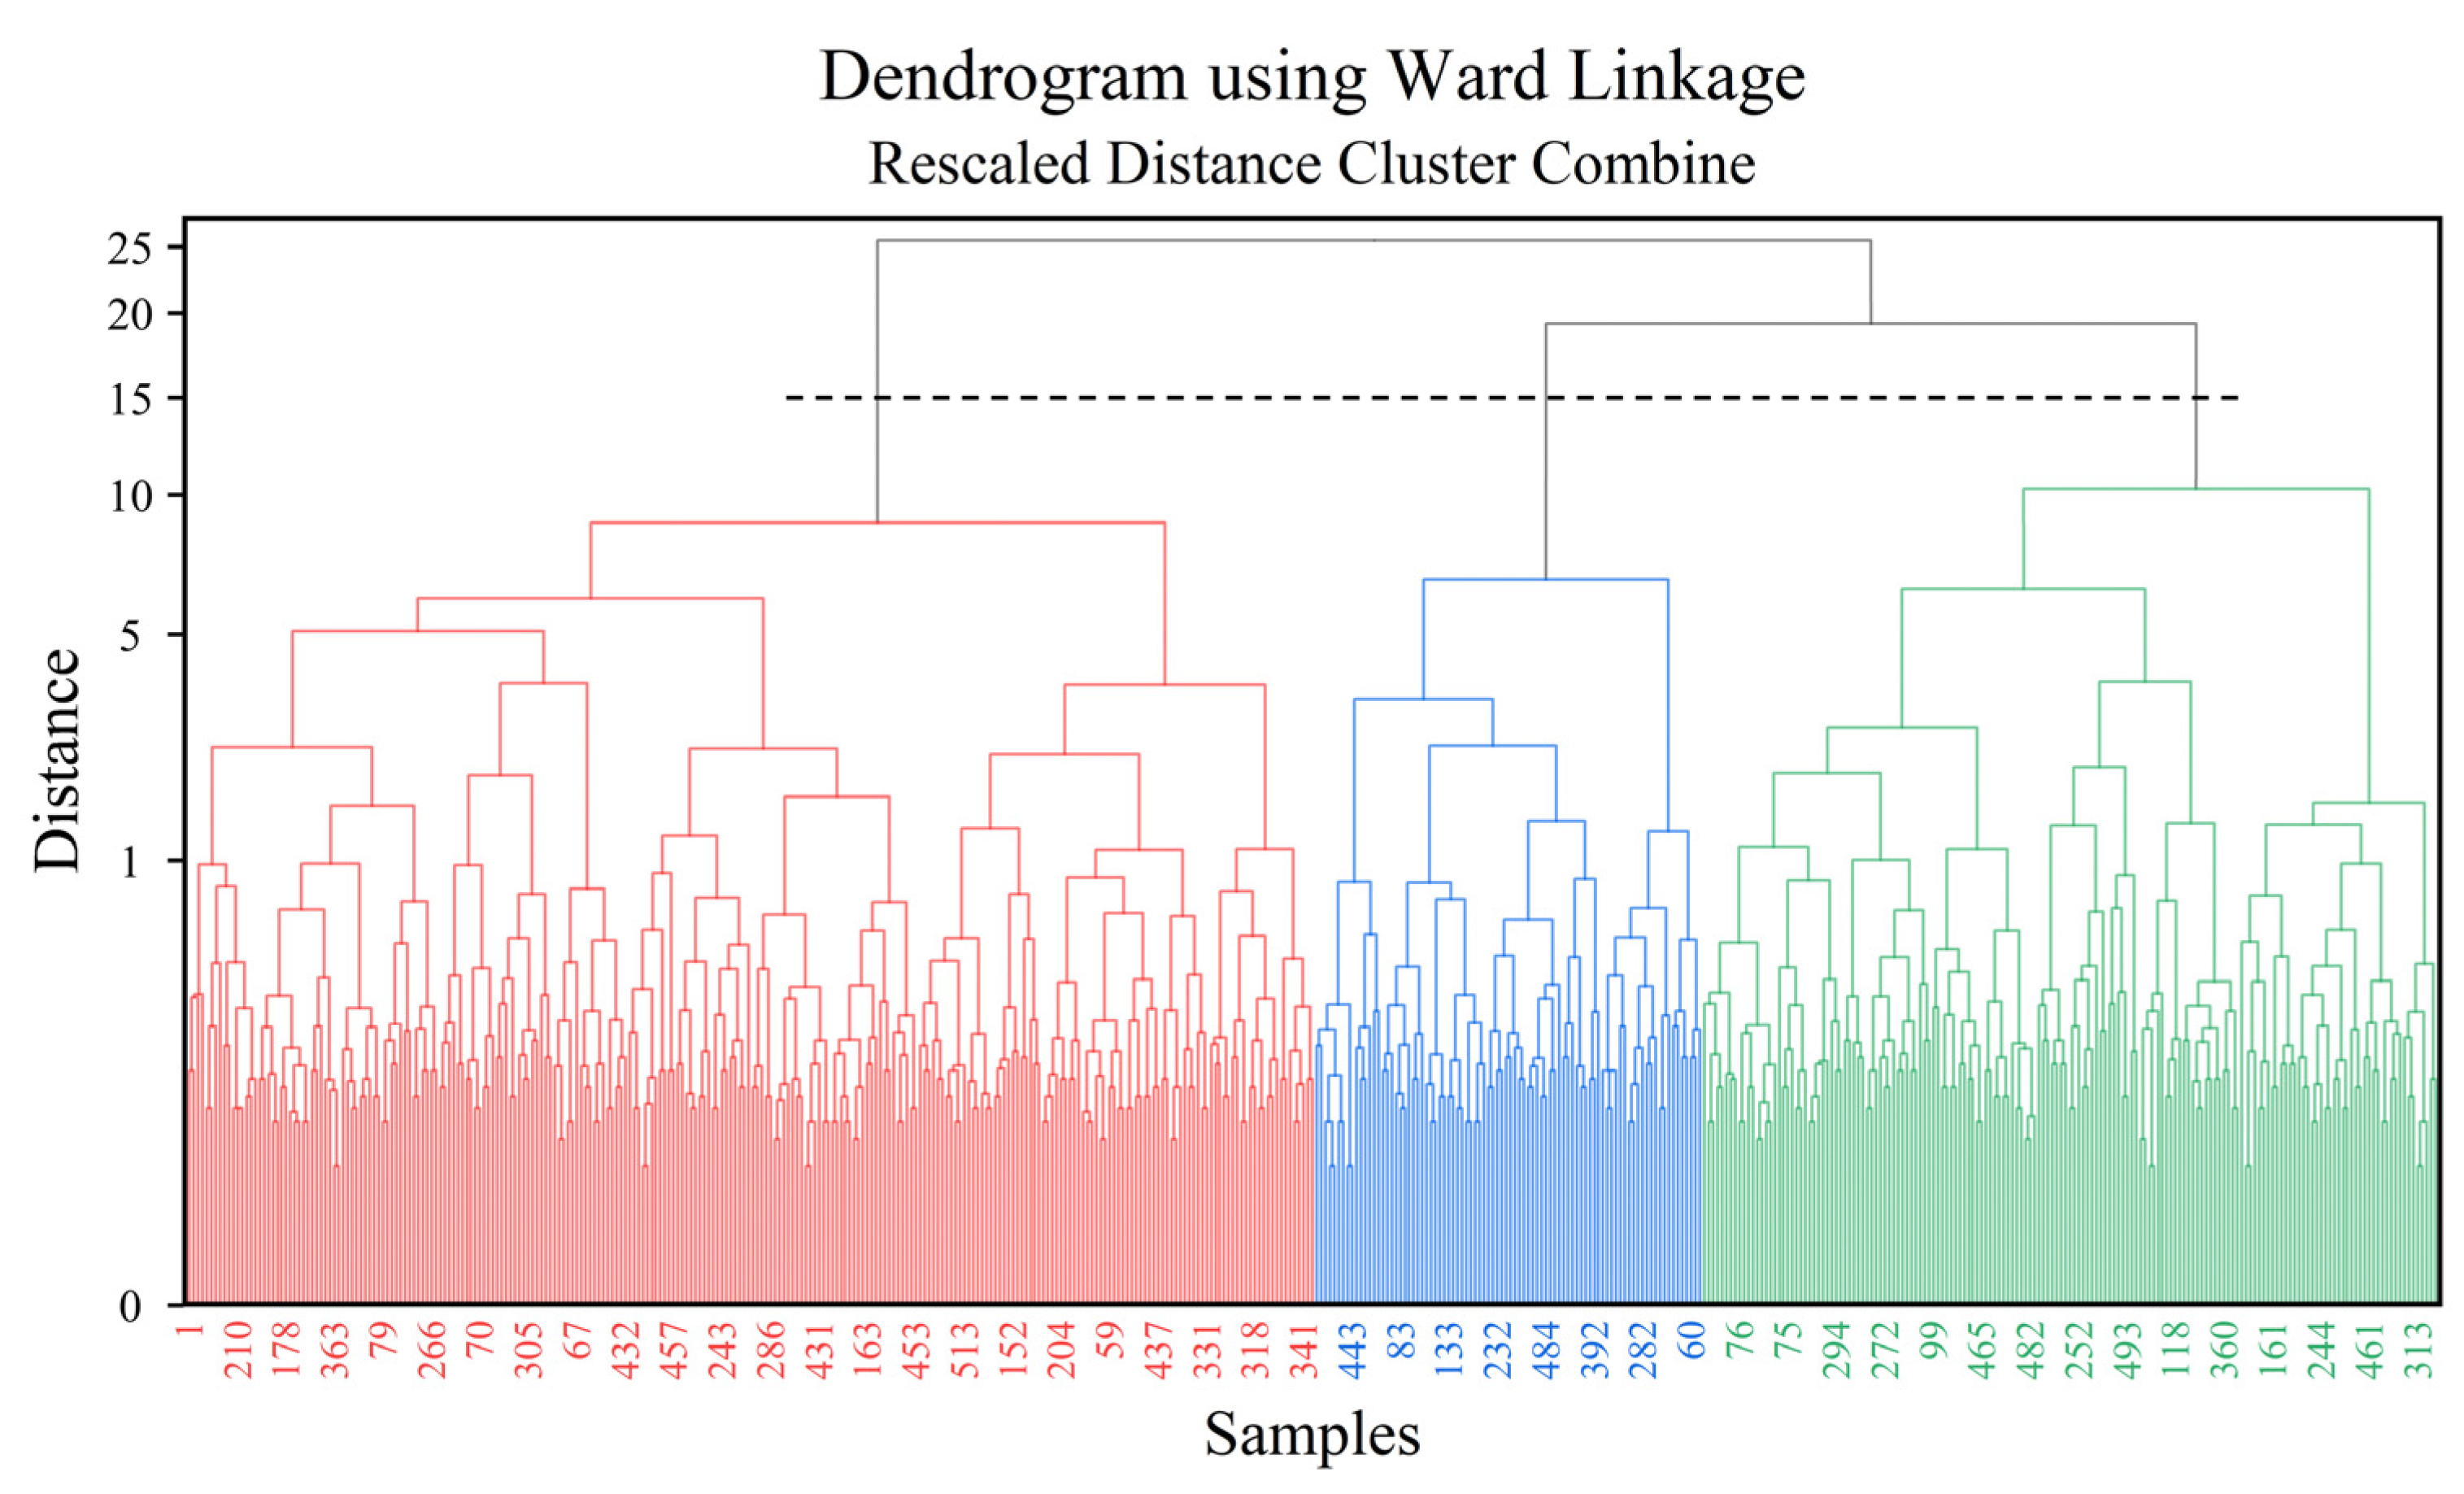
- This study categorized China’s young consumers into three user groups based on demographic information, individual cultural orientations and past usage experiences. All three groups show good acceptance of innovative HMI features inside the intelligent cabin. Users in group A appear to prioritize leisure and entertainment as well as personalized features prominently. Users in group B show a greater emphasis on efficiency and safety. Users in group C prefer an open and real-time updated software ecosystem. This clustering result is applicable to Chinese young consumers (under 35 years old) with a high acceptance of ICVs.
Author Contributions
Funding
Data Availability Statement
Conflicts of Interest
Appendix A


References
- Yuen, K.F.; Wong, Y.D.; Ma, F.; Wang, X. The Determinants of Public Acceptance of Autonomous Vehicles: An Innovation Diffusion Perspective. J. Clean. Prod. 2020, 270, 121904. [Google Scholar] [CrossRef]
- Jiang, X.; Yu, W.; Li, W.; Guo, J.; Chen, X.; Guo, H.; Wang, W.; Chen, T. Factors Affecting the Acceptance and Willingness-to-Pay of End-Users: A Survey Analysis on Automated Vehicles. Sustainability 2021, 13, 13272. [Google Scholar] [CrossRef]
- Li, C.; Wang, W.; Guo, H.; Dietrich, A. Cross-Cultural Analysis of Young Drivers’ Preferences for In-Vehicle Systems and Behavioral Effects Caused by Secondary Tasks. Sustainability 2018, 10, 4083. [Google Scholar] [CrossRef]
- Lu, J.; Peng, Z.; Yang, S.; Ma, Y.; Wang, R.; Pang, Z.; Feng, X.; Chen, Y.; Cao, Y. A Review of Sensory Interactions between Autonomous Vehicles and Drivers. J. Syst. Archit. 2023, 141, 102932. [Google Scholar] [CrossRef]
- Duarte, F.; Ratti, C. The Impact of Autonomous Vehicles on Cities: A Review. J. Urban Technol. 2018, 25, 3–18. [Google Scholar] [CrossRef]
- Lee, S.C.; Nadri, C.; Sanghavi, H.; Jeon, M. Exploring User Needs and Design Requirements in Fully Automated Vehicles. In Proceedings of the Extended Abstracts of the 2020 CHI Conference on Human Factors in Computing Systems, Honolulu, HI, USA, 25 April 2020; pp. 1–9. [Google Scholar]
- Conceptualizing a Decision Making Process Model Around Aspects Influencing Consumers Considering Purchase of Electric Vehicles—All Databases. Available online: https://webofscience.clarivate.cn/wos/alldb/full-record/WOS:000468972100003 (accessed on 18 January 2024).
- Using Predictive Analytics to Profile Potential Adopters of Autonomous Vehicles—All Databases. Available online: https://webofscience.clarivate.cn/wos/alldb/full-record/KJD:ART002372016 (accessed on 18 January 2024).
- Pricing and Investment Decision Issues of an Automobile Manufacturer for Different Types of Vehicles—All Databases. Available online: https://webofscience.clarivate.cn/wos/alldb/full-record/WOS:000673591800001 (accessed on 18 January 2024).
- What Would It Take to Get You into an Electric Car? Consumer Perceptions and Decision Making about Electric Vehicles—All Databases. Available online: https://webofscience.clarivate.cn/wos/alldb/full-record/WOS:000467983500006 (accessed on 18 January 2024).
- Liu, P.; Guo, Q.; Ren, F.; Wang, L.; Xu, Z. Willingness to Pay for Self-Driving Vehicles: Influences of Demographic and Psychological Factors. Transp. Res. Part C Emerg. Technol. 2019, 100, 306–317. [Google Scholar] [CrossRef]
- Impact of Cultural Diversity on the Menu Structure Design of Driver Information Systems: A Cross-Cultural Study—All Databases. Available online: https://webofscience.clarivate.cn/wos/alldb/full-record/WOS:000298736200019 (accessed on 18 January 2024).
- Environmental Values and Behavior in Traditional Chinese Culture—All Databases. Available online: https://webofscience.clarivate.cn/wos/alldb/full-record/WOS:000189463000009 (accessed on 18 January 2024).
- Congruence and Functions of Personal and Cultural Values: Do My Values Reflect My Culture’s Values?—All Databases. Available online: https://webofscience.clarivate.cn/wos/alldb/full-record/WOS:000241331200001 (accessed on 18 January 2024).
- The Effect of Temporal Orientation on Green Purchase Behavior: Comparing U.S. and Chinese Consumers—All Databases. Available online: https://webofscience.clarivate.cn/wos/alldb/full-record/WOS:000648179000001 (accessed on 18 January 2024).
- Cultural Influences on Consumer Values, Needs and Consumer Loyalty Behavior: East Asian Culture versus Eastern European Culture—All Databases. Available online: https://webofscience.clarivate.cn/wos/alldb/full-record/WOS:000297665400038 (accessed on 18 January 2024).
- Novotny, A.; Szeberin, I.; Kovács, S.; Máté, D. National Culture and the Market Development of Battery Electric Vehicles in 21 Countries. Energies 2022, 15, 1539. [Google Scholar] [CrossRef]
- Ashmore, D.P.; Pojani, D.; Thoreau, R.; Christie, N.; Tyler, N.A. The Symbolism of ‘Eco Cars’ across National Cultures: Potential Implications for Policy Formulation and Transfer. Transp. Res. Part D Transp. Environ. 2018, 63, 560–575. [Google Scholar] [CrossRef]
- Soares, A.M.; Farhangmehr, M.; Shoham, A. Hofstede’s Dimensions of Culture in International Marketing Studies. J. Bus. Res. 2007, 60, 277–284. [Google Scholar] [CrossRef]
- Requirements for the Design of Advanced Driver Assistance Systems—The Differences between Swedish and Chinese Drivers—All Databases. Available online: https://webofscience.clarivate.cn/wos/alldb/full-record/WOS:000207869200005 (accessed on 18 January 2024).
- Mental Models of Chinese and German Users and Their Implications for MMI: Experiences from the Case Study Navigation System—All Databases. Available online: https://webofscience.clarivate.cn/wos/alldb/full-record/WOS:000248043000097 (accessed on 17 January 2024).
- Young, K.L.; Rudin-Brown, C.M.; Lenné, M.G.; Williamson, A.R. The Implications of Cross-Regional Differences for the Design of In-Vehicle Information Systems: A Comparison of Australian and Chinese Drivers. Appl. Ergon. 2012, 43, 564–573. [Google Scholar] [CrossRef]
- Yun, Y.; Oh, H.; Myung, R. Statistical Modeling of Cultural Differences in Adopting Autonomous Vehicles. Appl. Sci. 2021, 11, 9030. [Google Scholar] [CrossRef]
- Hsu, Y.; Hsu, L.; Yeh, C.-W. A Cross-Cultural Study on Consumers’ Level of Acceptance toward Marketing Innovativeness. Afr. J. Bus. Manag. 2010, 4, 1215. [Google Scholar]
- Zhao, Y.; Wang, N.; Li, Y.; Zhou, R.; Li, S. Do Cultural Differences Affect Users’ E-learning Adoption? A Meta-analysis. Br. J. Educ. Technol. 2021, 52, 20–41. [Google Scholar] [CrossRef]
- Social Culture and Innovation Diffusion: A Theoretically Founded Agent-Based Model—All Databases. Available online: https://webofscience.clarivate.cn/wos/alldb/full-record/WOS:000521035900001 (accessed on 18 January 2024).
- Factors Influencing the User Acceptance of Automated Vehicles Based on Vehicle-Road Collaboration—All Databases. Available online: https://webofscience.clarivate.cn/wos/alldb/full-record/WOS:000554372400001 (accessed on 18 January 2024).
- Influencing Factors on Social Acceptance of Autonomous Vehicles and Policy Implications—All Databases. Available online: https://webofscience.clarivate.cn/wos/alldb/full-record/KJD:ART002367182 (accessed on 18 January 2024).
- Evaluating Initial Public Acceptance of Highly and Fully Autonomous Vehicles—All Databases. Available online: https://webofscience.clarivate.cn/wos/alldb/full-record/WOS:000468763200002 (accessed on 18 January 2024).
- Analysis of the Acceptance of Carsharing and Eco-Cars in Japan—All Databases. Available online: https://webofscience.clarivate.cn/wos/alldb/full-record/WOS:000327836100002 (accessed on 18 January 2024).
- Acceptance of Electric Vehicles: A Dual-Factor Approach Using Social Comparison Theory and Technology Acceptance Model—All Databases. Available online: https://webofscience.clarivate.cn/wos/alldb/full-record/WOS:000904001100006 (accessed on 18 January 2024).
- Cross-Cultural Differences in the Acceptance of Decisions of Automated Vehicles—All Databases. Available online: https://webofscience.clarivate.cn/wos/alldb/full-record/WOS:000614757100011 (accessed on 18 January 2024).
- Consumer Purchase Intention of New Energy Vehicles with an Extended Technology Acceptance Model: The Role of Attitudinal Ambivalence—All Databases. Available online: https://webofscience.clarivate.cn/wos/alldb/full-record/WOS:001063622100001 (accessed on 18 January 2024).
- Sharma, P. Measuring Personal Cultural Orientations: Scale Development and Validation. J. Acad. Mark. Sci. 2010, 38, 787–806. [Google Scholar] [CrossRef]
- Kuhnimhof, T.; Wulfhorst, G. The Reader’s Guide to Mobility Culture. In Megacity Mobility Culture: How Cities Move on in a Diverse World; Lecture Notes in Mobility; Springer: Berlin/Heidelberg, Germany, 2013; pp. 55–64. ISBN 978-3-642-34735-1. [Google Scholar]
- Khan, T.; Williams, M. A Study of Cultural Influence in Automotive HMI: Measuring Correlation between Culture and HMI Usability. SAE Int. J. Passeng. Cars-Electron. Electr. Syst. 2014, 7, 430–439. [Google Scholar] [CrossRef]
- Irlandbild/Deutschlandbild: The Reception of German Culture in Ireland in the 1840s.—All Databases. Available online: https://webofscience.clarivate.cn/wos/alldb/full-record/PQDT:68013925 (accessed on 18 January 2024).
- The “Onion Model of Human Factors”: A Theoretical Framework for Cross-Cultural Design—All Databases. Available online: https://webofscience.clarivate.cn/wos/alldb/full-record/WOS:000876897600002 (accessed on 18 January 2024).
- Hofstede, G.H.; Hofstede, G.J.; Minkov, M. Cultures and Organizations: Software of the Mind: Intercultural Cooperation and Its Importance for Survival, 3rd ed.; McGraw-Hill: New York, NY, USA, 2010; ISBN 978-0-07-177015-6. [Google Scholar]
- Bond, M.H. Reclaiming the Individual from Hofstede’s Ecological Analysis—A 20-Year Odyssey: Comment on Oyserman et al. (2002). Psychol. Bull. 2002, 128, 73–77. [Google Scholar] [CrossRef] [PubMed]
- McSweeney, B. Hofstede’s Model of National Cultural Differences and Their Consequences: A Triumph of Faith—A Failure of Analysis. Hum. Relat. 2002, 55, 89–118. [Google Scholar] [CrossRef]
- Lazányi, K. Perceived Risks of Autonomous Vehicles. Risks 2023, 11, 26. [Google Scholar] [CrossRef]
- Ray, S.K.; Sahney, S. Personal Cultural Orientation and Green Purchase Intention: A Case of Electric Two-Wheelers in India. J. Asia Bus. Stud. 2021, 16, 729–746. [Google Scholar] [CrossRef]
- Oyserman, D.; Kemmelmeier, M.; Coon, H.M. Cultural Psychology, a New Look: Reply to Bond (2002), Fiske (2002), Kitayama (2002), and Miller (2002). Psychol. Bull. 2002, 128, 110–117. [Google Scholar] [CrossRef] [PubMed]
- The Influence of Cultural Values on Green Purchase Behaviour—All Databases. Available online: https://webofscience.clarivate.cn/wos/alldb/full-record/WOS:000402938100005 (accessed on 18 January 2024).
- Yoo, B.; Lenartowicz, T. Measuring Hofstede’s Five Dimensions of Cultural Values at the Individual Level: Development and Validation of CVSCALE. J. Int. Consum. Mark. 2011, 23, 193–210. [Google Scholar] [CrossRef]
- Wintersberger, S.; Azmat, M.; Kummer, S. Are We Ready to Ride Autonomous Vehicles? A Pilot Study on Austrian Consumers’ Perspective. Logistics 2019, 3, 20. [Google Scholar] [CrossRef]
- Hanafy, M.; Ming, R. Machine Learning Approaches for Auto Insurance Big Data. Risks 2021, 9, 42. [Google Scholar] [CrossRef]
- Liu, Y.; Wu, H. Prediction of Road Traffic Congestion Based on Random Forest. In Proceedings of the 2017 10th International Symposium on Computational Intelligence and Design (ISCID), Hangzhou, China, 9–10 December 2017; pp. 361–364. [Google Scholar]
- Evaluating Car-Sharing Switching Rates from Traditional Transport Means through Logit Models and Random Forest Classifiers—All Databases. Available online: https://webofscience.clarivate.cn/wos/alldb/full-record/WOS:000604697800001 (accessed on 18 January 2024).
- Factors Affecting the Preference of Buying Hybrid and Electric Vehicles—All Databases. Available online: https://webofscience.clarivate.cn/wos/alldb/full-record/PQDT:65555149 (accessed on 18 January 2024).
- Prediction Method Based on Data Global Search and Feature Classification, Involves Dividing User Group into Brand Crowd and Non-Brand Crowd Based on Improved Random Forest Algorithm Set for Establishing Potential Customer Recognition Model—All Databases. Available online: https://webofscience.clarivate.cn/wos/alldb/full-record/DIIDW:2020C6352M (accessed on 18 January 2024).
- Guo, M.; Zhao, X.; Yao, Y.; Yan, P.; Su, Y.; Bi, C.; Wu, D. A Study of Freeway Crash Risk Prediction and Interpretation Based on Risky Driving Behavior and Traffic Flow Data. Accid. Anal. Prev. 2021, 160, 106328. [Google Scholar] [CrossRef]
- Zhang, N.; Sun, Q.; Yang, L.; Li, Y. Event-Triggered Distributed Hybrid Control Scheme for the Integrated Energy System. IEEE Trans. Ind. Inf. 2022, 18, 835–846. [Google Scholar] [CrossRef]
- Raghav, L.P.; Kumar, R.S.; Raju, D.K.; Singh, A.R. Optimal Energy Management of Microgrids Using Quantum Teaching Learning Based Algorithm. IEEE Trans. Smart Grid 2021, 12, 4834–4842. [Google Scholar] [CrossRef]
- Behavioral Intention of Fully Autonomous Vehicles Considering User Group Segmentation—All Databases. Available online: https://webofscience.clarivate.cn/wos/alldb/full-record/CSCD:7319715 (accessed on 18 January 2024).
- Research on Effect of Current Chinese Cultural Values on Consumption Attitude Loyalty—All Databases. Available online: https://webofscience.clarivate.cn/wos/alldb/full-record/WOS:000261330700095 (accessed on 18 January 2024).
- The Impact of Long-Term Orientation on Compulsive Buying Behavior: A Cross-Cultural Study—All Databases. Available online: https://webofscience.clarivate.cn/wos/alldb/full-record/WOS:000876919400001 (accessed on 18 January 2024).
- Pfleging, B.; Rang, M.; Broy, N. Investigating User Needs for Non-Driving-Related Activities during Automated Driving. In Proceedings of the 15th International Conference on Mobile and Ubiquitous Multimedia, Rovaniemi, Finland, 12 December 2016; pp. 91–99. [Google Scholar]
- Stevens, G.; Bossauer, P.; Pakusch, C.; Vonholdt, S. Using Time and Space Efficiently in Driverless Cars: Findings of a Co-Design Study. In Proceedings of the 2019 CHI Conference on Human Factors in Computing Systems, Glasgow, UK, 4–9 May 2019. [Google Scholar]
- National Culture and Innovation Diffusion. Exploratory Insights from Agent-Based Modeling—All Databases. Available online: https://webofscience.clarivate.cn/wos/alldb/full-record/WOS:000375163300012 (accessed on 18 January 2024).
- Sreen, N.; Purbey, S.; Sadarangani, P. Impact of Culture, Behavior and Gender on Green Purchase Intention. J. Retail. Consum. Serv. 2018, 41, 177–189. [Google Scholar] [CrossRef]


| Dimension | Definition | Characteristics | Typical Countries |
|---|---|---|---|
| Power Distance | This constitutes the extent to which the less powerful members of an organization or institution—such as a family—accept and expect that power is distributed unequally [39]. | High Power Distance:
| PDI Index:
|
| Uncertainty Avoidance | This dimension reflects the extent to which members of a society attempt to cope with their anxiety by minimizing uncertainty. It refers to how threatening change is to a culture [39]. | High Uncertainty Avoidance:
| UAI Index:
|
| Individualism versus Collectivism | This involves the integration of individuals into groups. Individualism is focused on the rights and concerns of each person, while collectivism stresses the importance of the community [39]. | High Individualism:
| IDV Index:
|
| Masculinity versus Femininity | This dimension looks at how much a society values traditional masculine and feminine roles. A masculine society values assertiveness, courage, strength and competition, while a feminine society values cooperation, nurturing and quality of life [39]. | High Masculinity:
| MAS Index:
|
| Long-Term versus Short-Term Orientation | This constitutes the degree to which cultures encourage delaying gratification or the material, social and emotional needs of their members. A society with long-term orientation tends to focus on the future in a way, while a short-term orientation society places a stronger emphasis on the present rather than the future [4]. | Long-Term Orientation:
| LTO Index:
|
| Indulgence versus Restraint | This is the extent and tendency of a society to fulfill its desires. A highly indulgent society allows relatively free gratification and high levels of bon de vivre. But, a high-restraint society tends to suppress the gratification of needs and regulate them through social norms [39]. | High Indulgence:
| IVR Index:
|
| Feature | Description |
|---|---|
| Ambient lighting | Ambient lighting is a function that decorates the car and sets the mood in the interior. It can interact with passengers and conduct some information through the rhythm of colors, bringing a strong sense of ceremony and creating a relaxing and pleasant atmosphere. |
| Welcome mode | When the user approaches the vehicle, the courtesy lighting comes on and projects a personalized pattern, the screen displays welcome words and the seat automatically adjusts itself to a suitable position for easy entry, bringing the user ingress and egress ceremony. |
| Diverse UI themes | The theme of the in-vehicle information system (IVIS) switches with different usage scenarios, seasons and festivals, bring users a more interesting experience (e.g., Tesla’s vehicle model on the instrument central screen (ICS) will be replaced by Santa’s sleigh car during Christmas Day). |
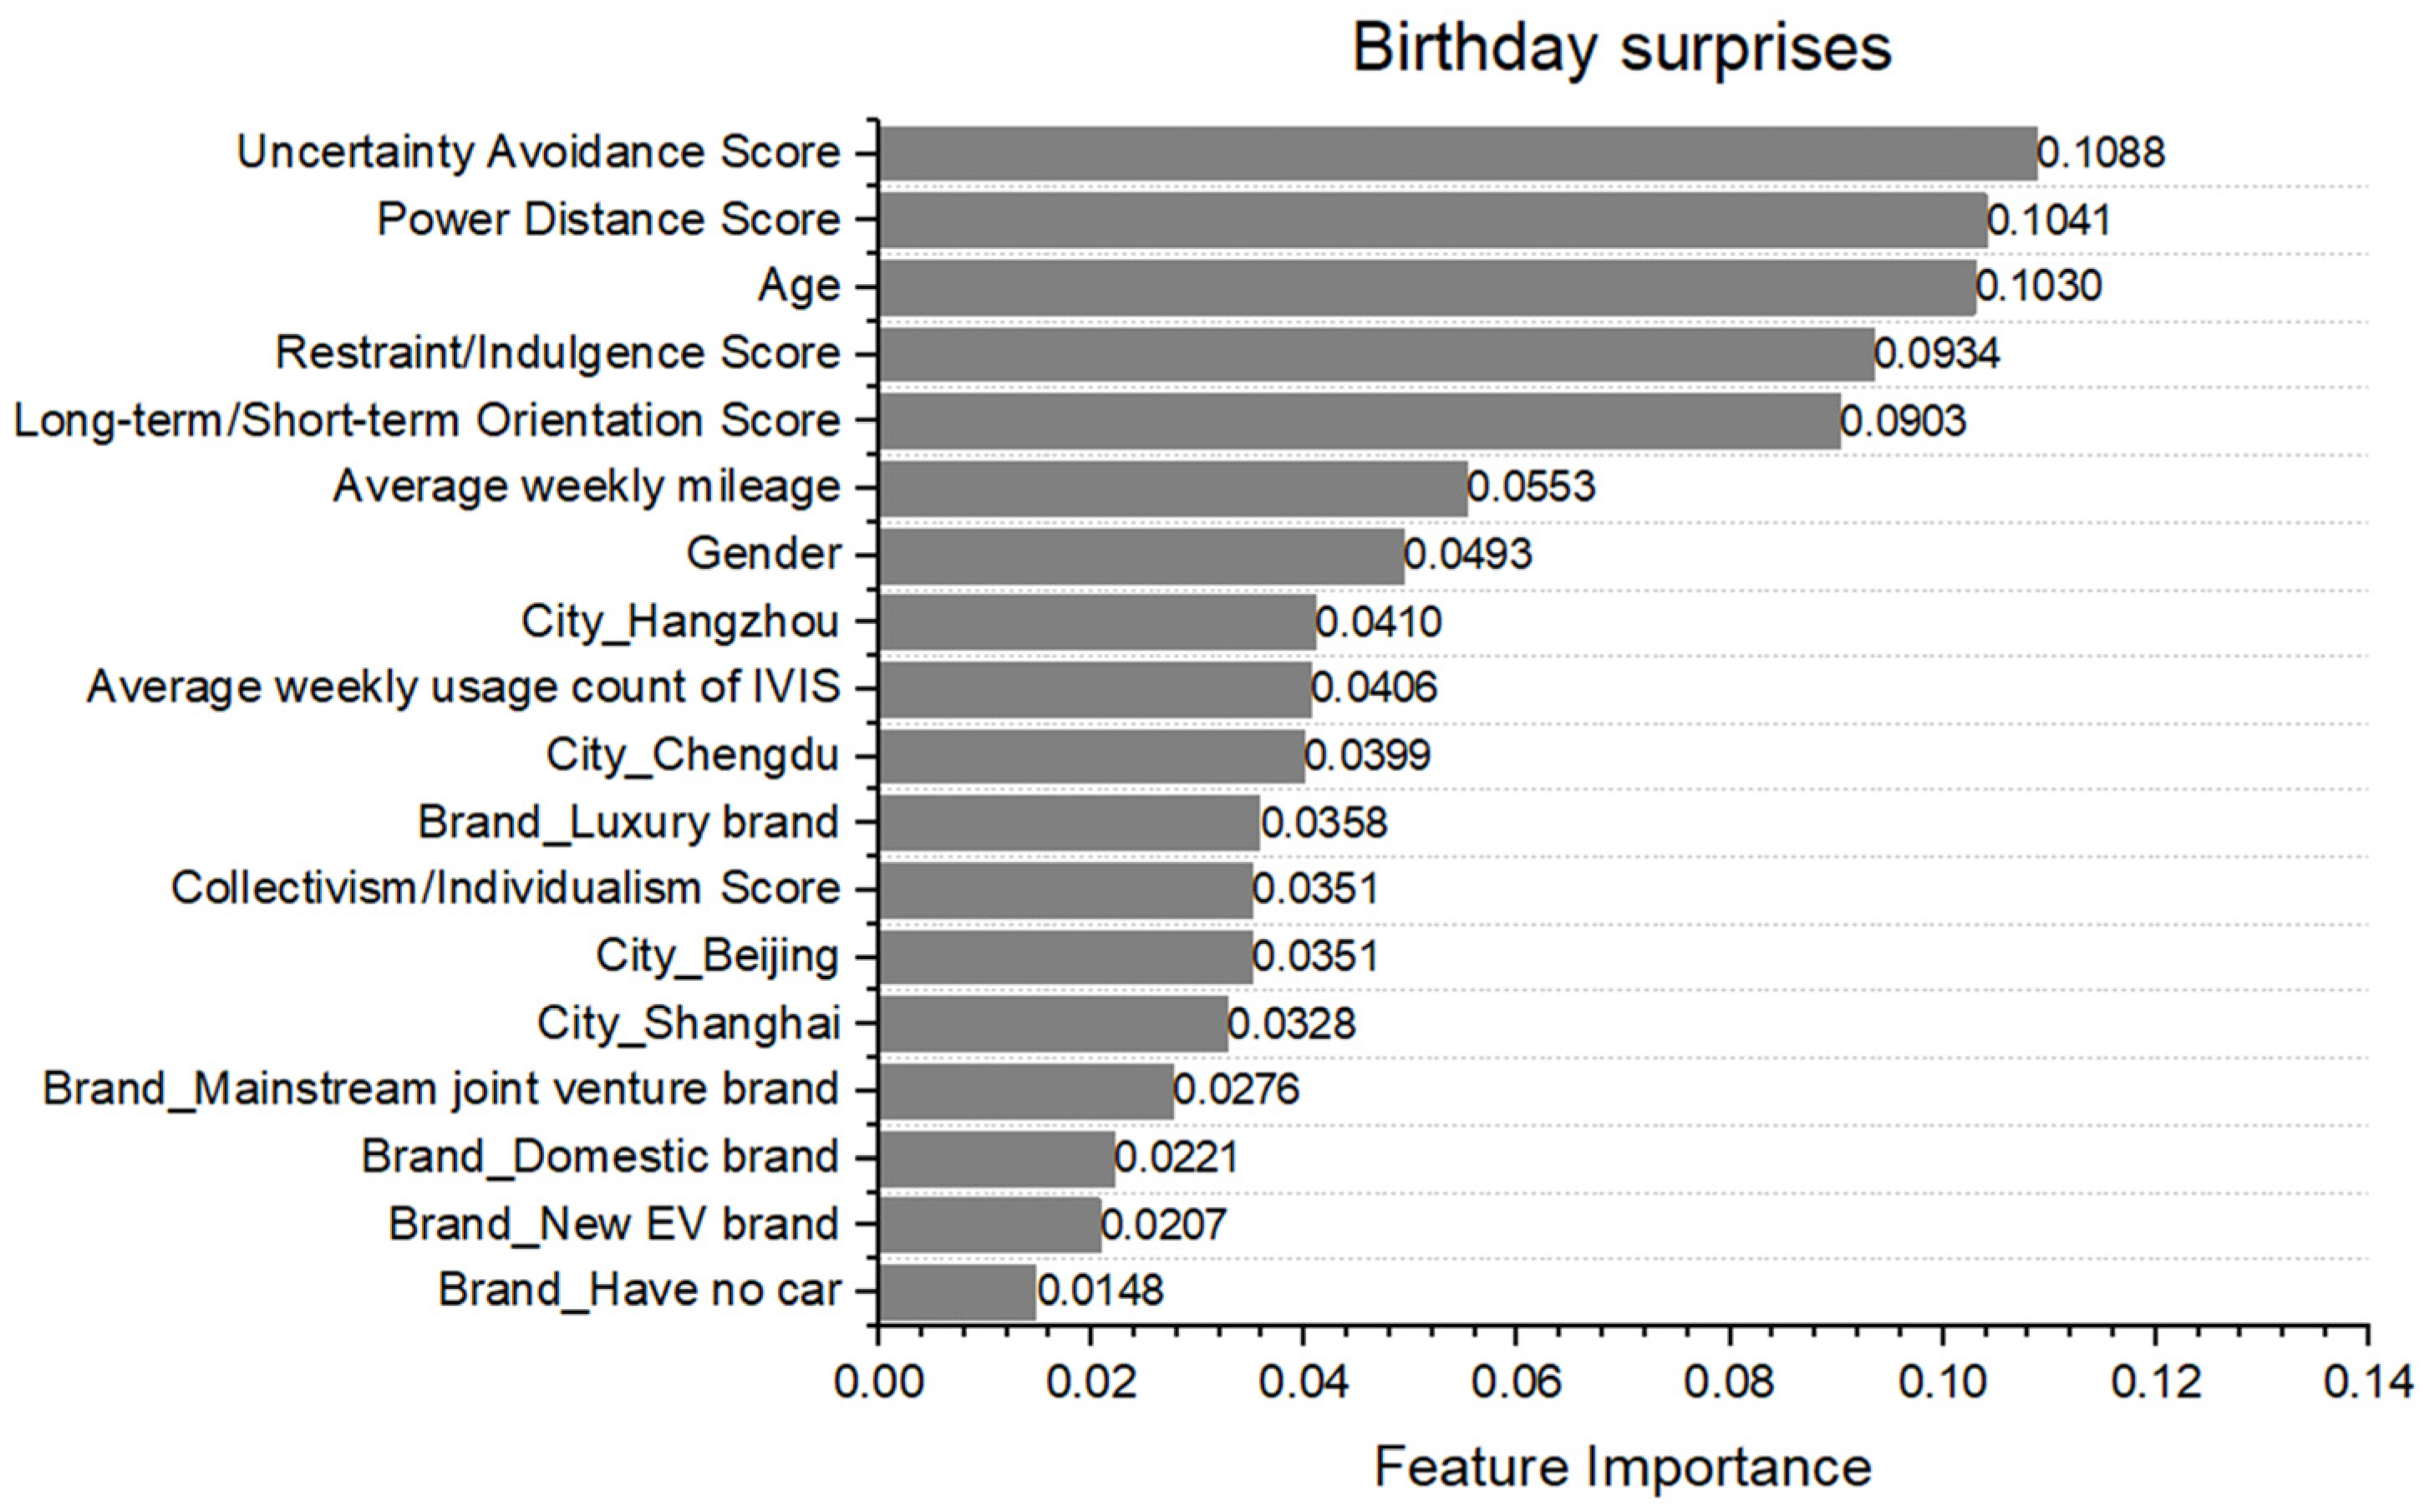
| Birthday surprises | On the user’s birthday and special anniversaries, the vehicle will play a birthday song, offer well wishes on the screen, give a surprise gift or make hidden surprises in the IVIS. |
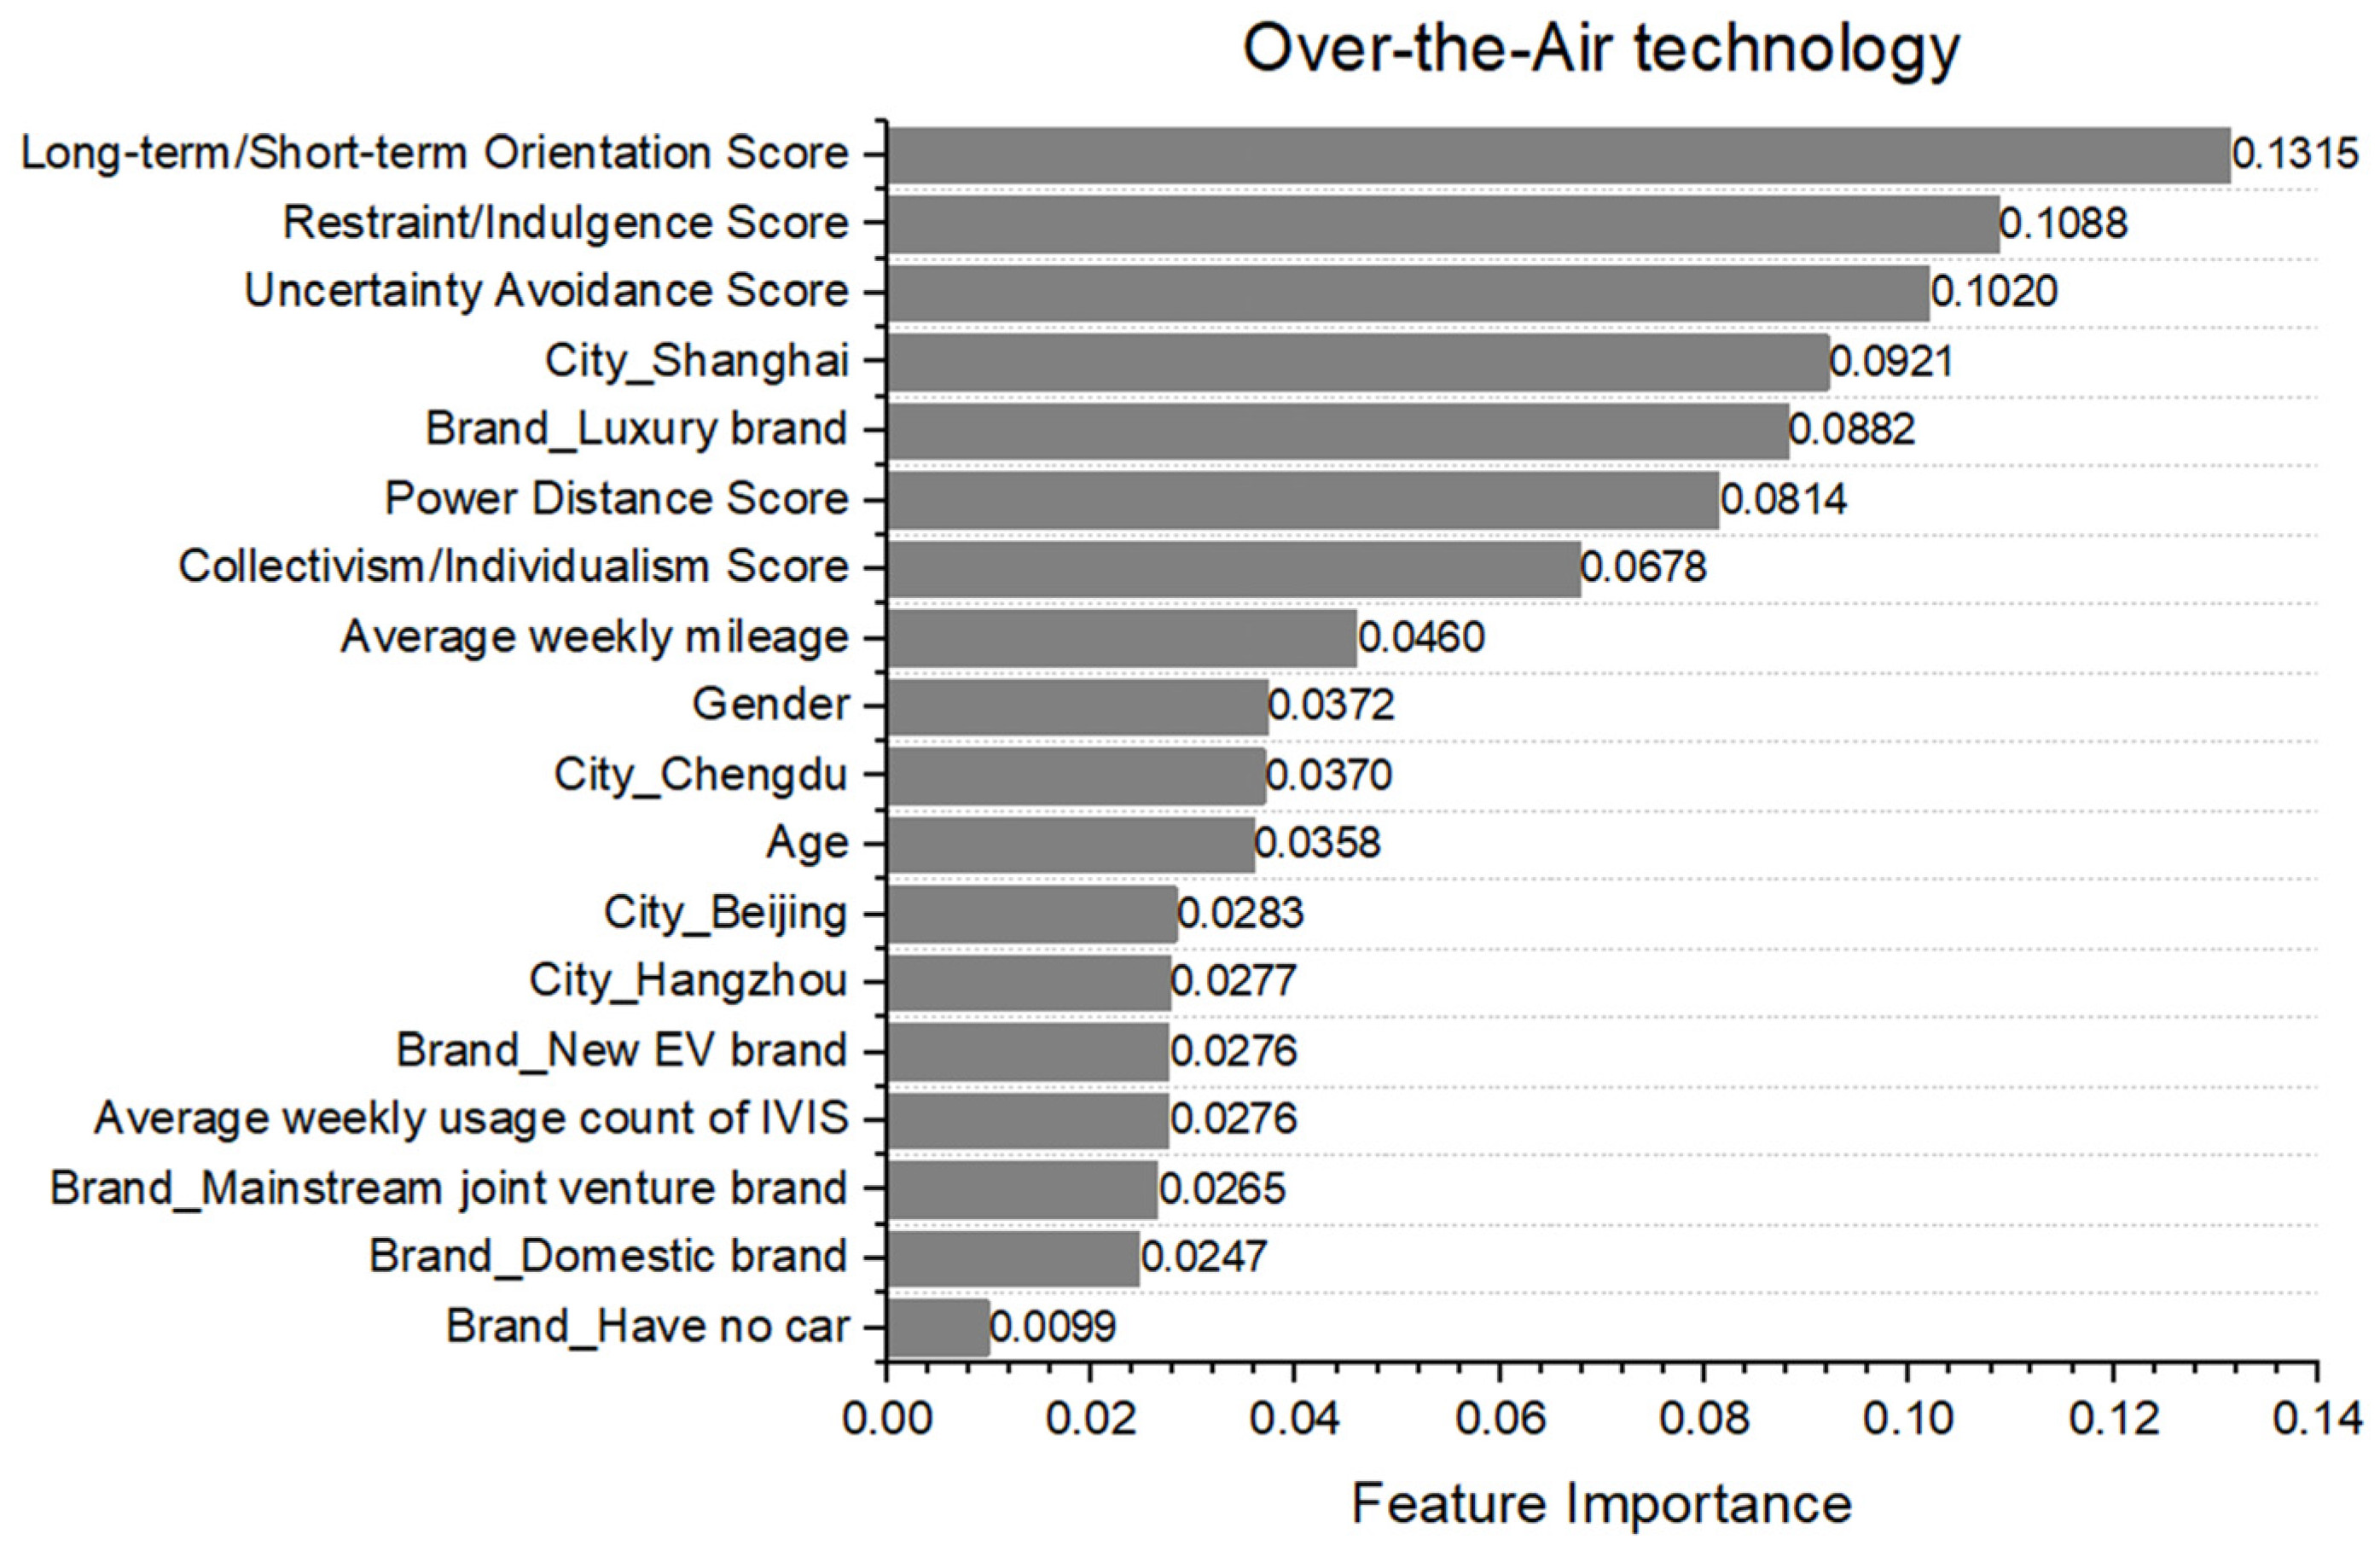
| Over-the-air technology (OTA) | Vehicles are able to remotely manage and upgrade software through a mobile communications interface. Similar to upgrading a mobile phone system, each OTA is aimed to improve vehicle performance, fix bugs, gain more new features, etc. |
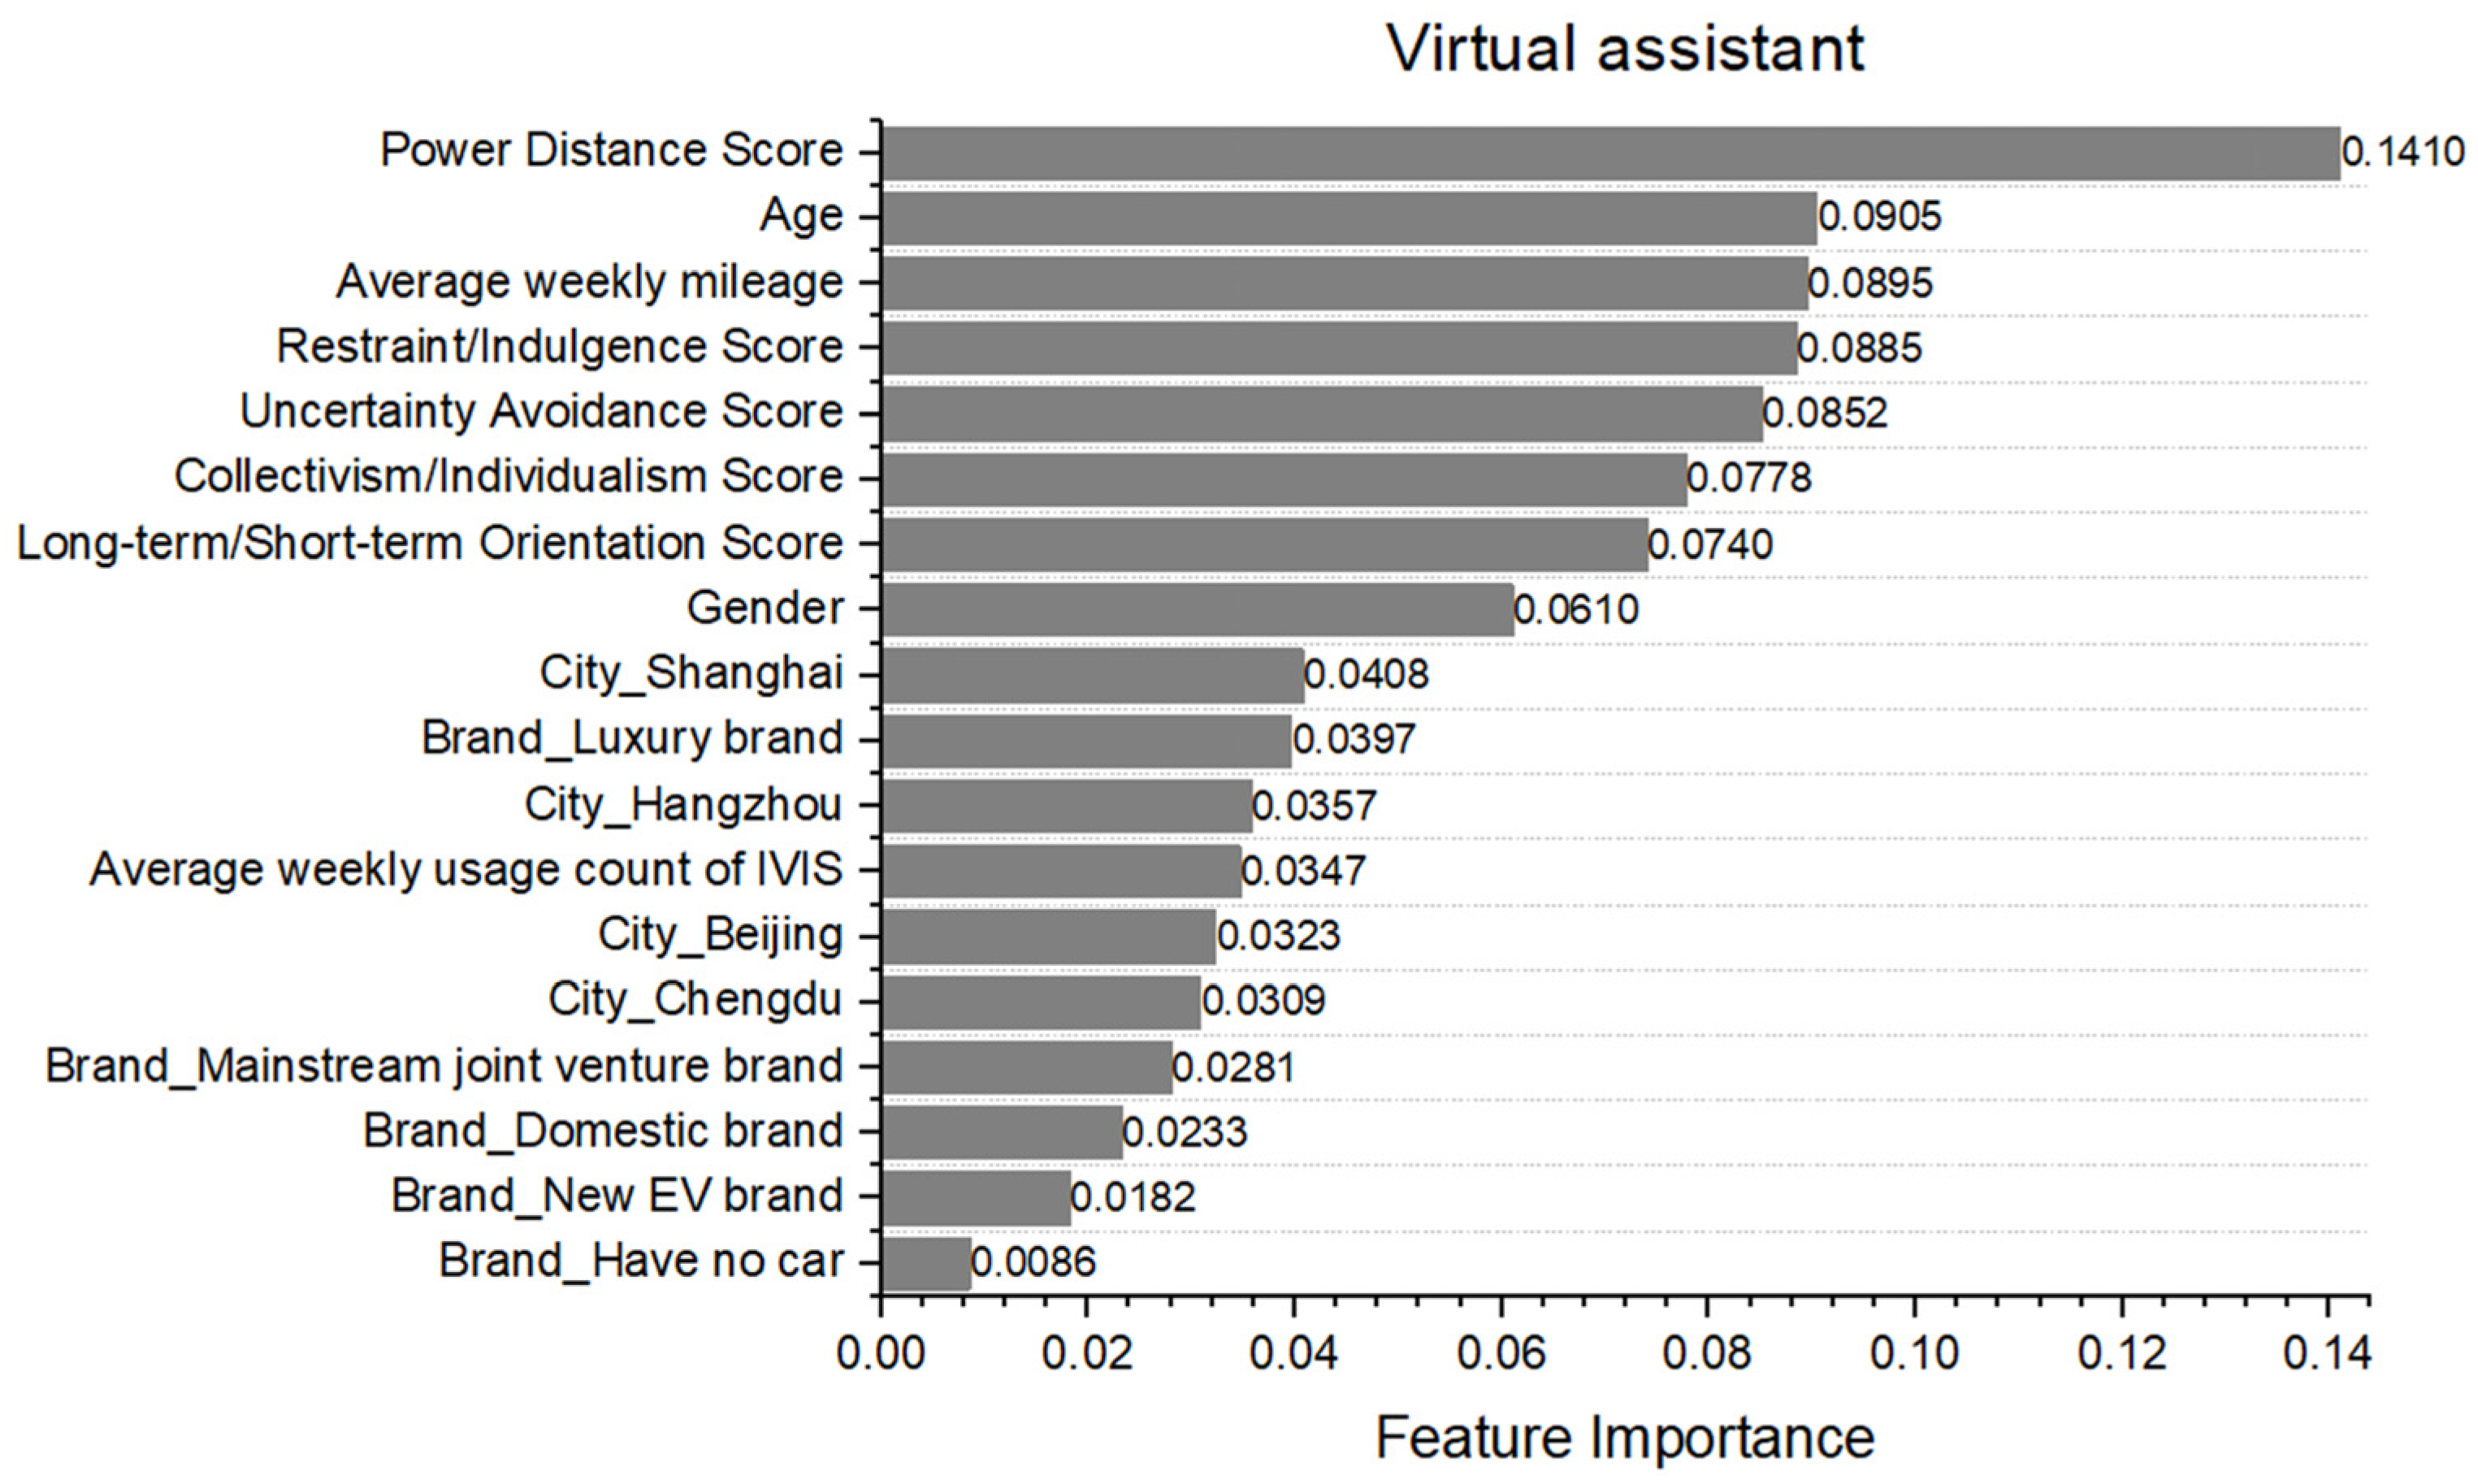
| Virtual assistant | A voice-activated virtual assistant with a unique image that provides vehicle control on user’s command. The equipped emotion engine allows it to communicate with users like a human being and respond to the user’s words in an interesting way. |
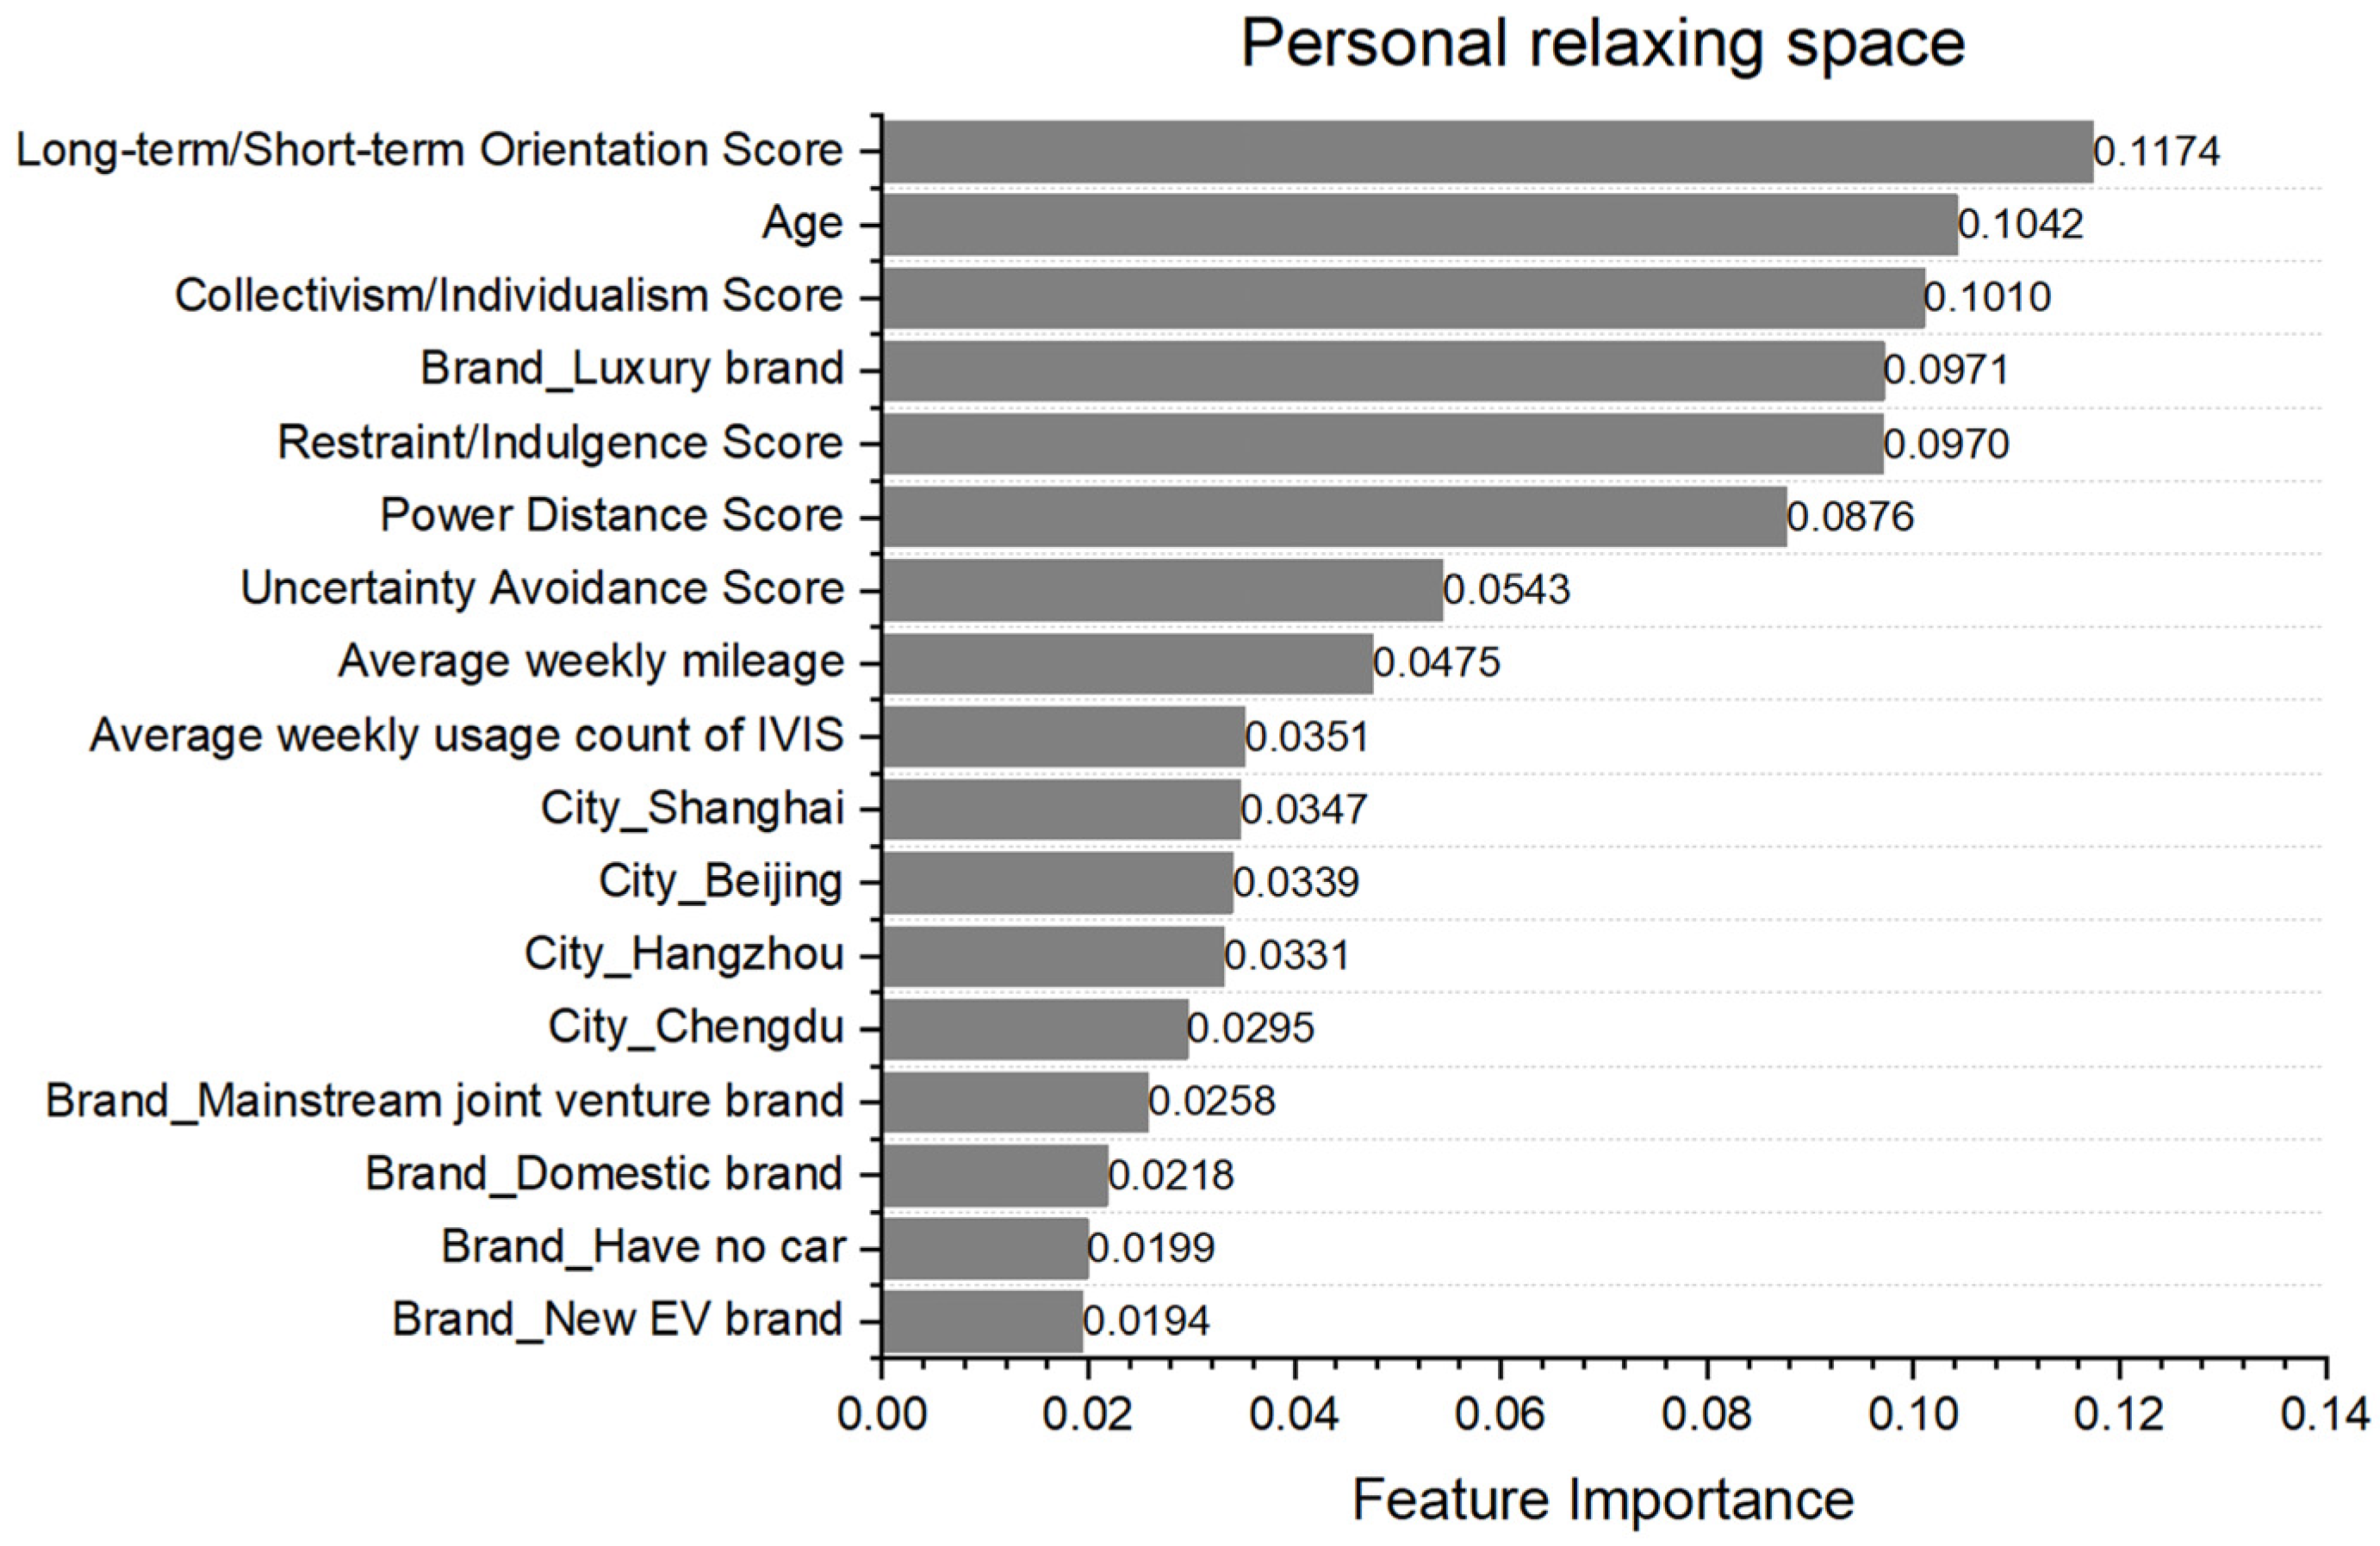
| Personal relaxing space | The cabin acts as a private, comfortable, cocoon-like hideaway and a personal space where customers can relax, spend quality time and even work. |
| Personalized mode | The vehicle gives users more control in the form of personalized modes, customized buttons, etc. Users can set up the vehicle according to their own usage habits. |
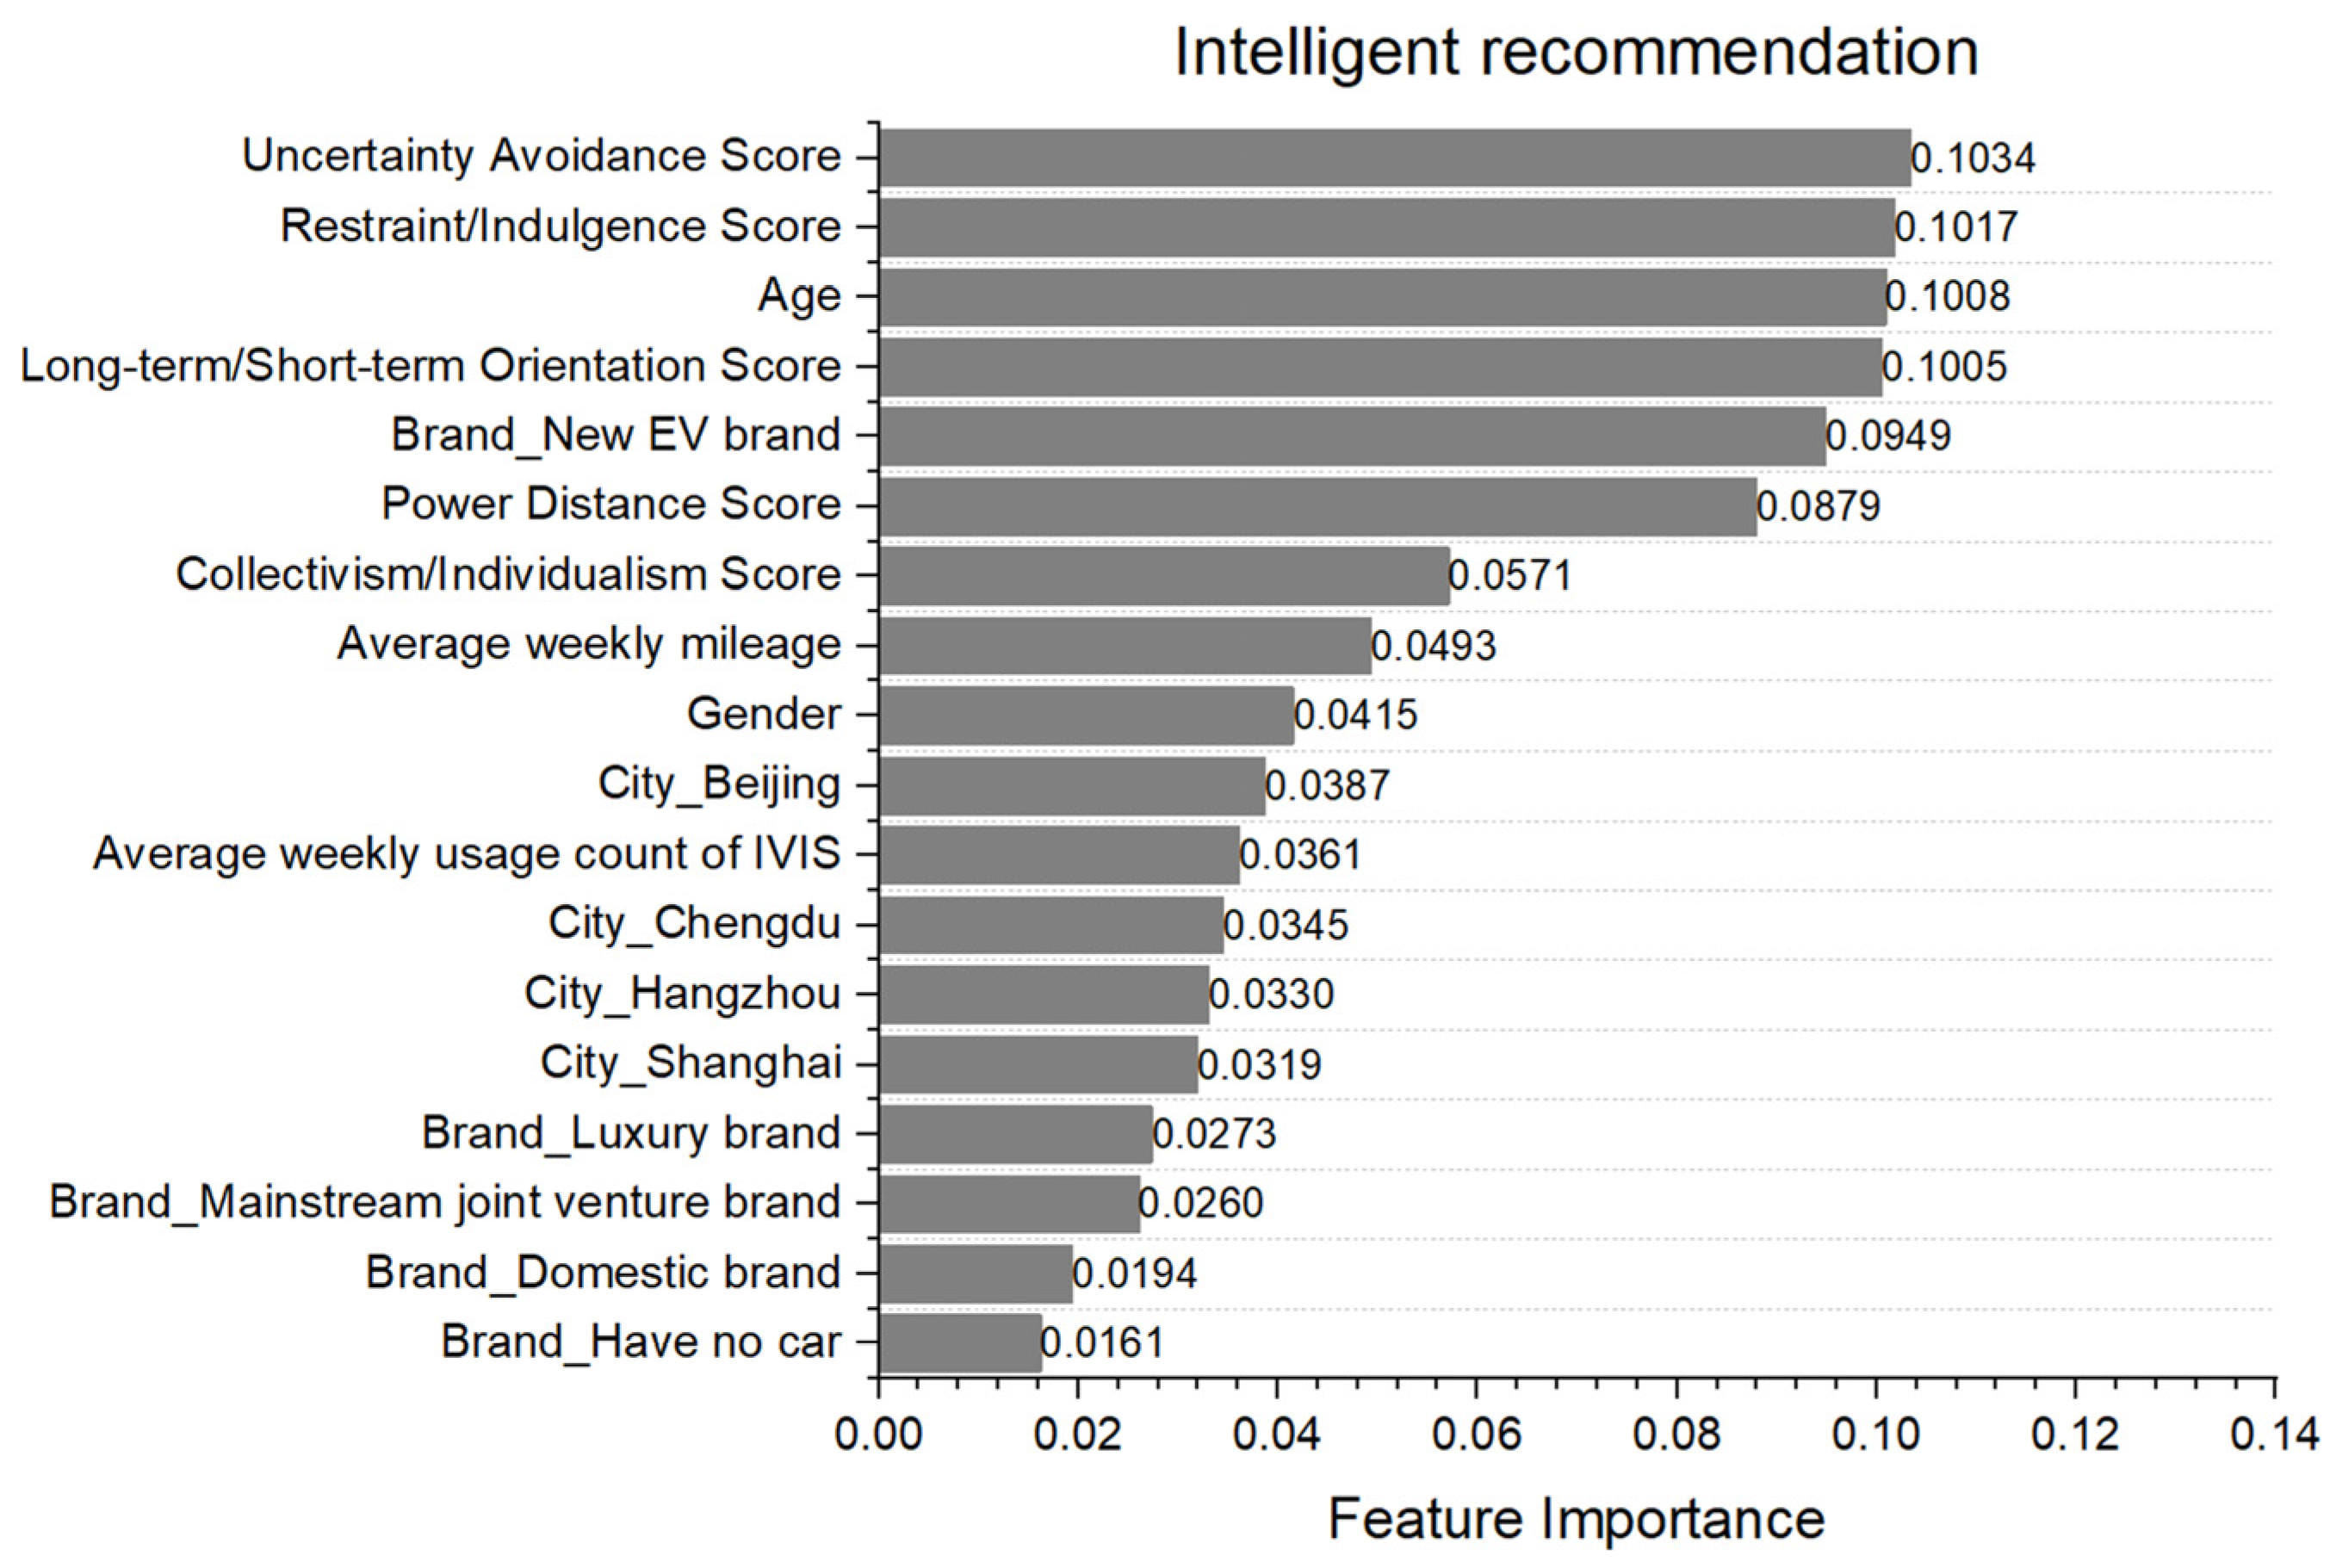
| Intelligent recommendation | Through big data and recommendation algorithms, the vehicle actively predicts the user’s interests and needs in order to automatically push the required information for the user, improving the user’s search efficiency. |
| Calendars | Through data sharing between the vehicle and mobile phone calendars, the user’s travel information is automatically synchronized to the IVIS, so the users can achieve one-click navigation to the destination and arrange their working schedules during the daily commute. |
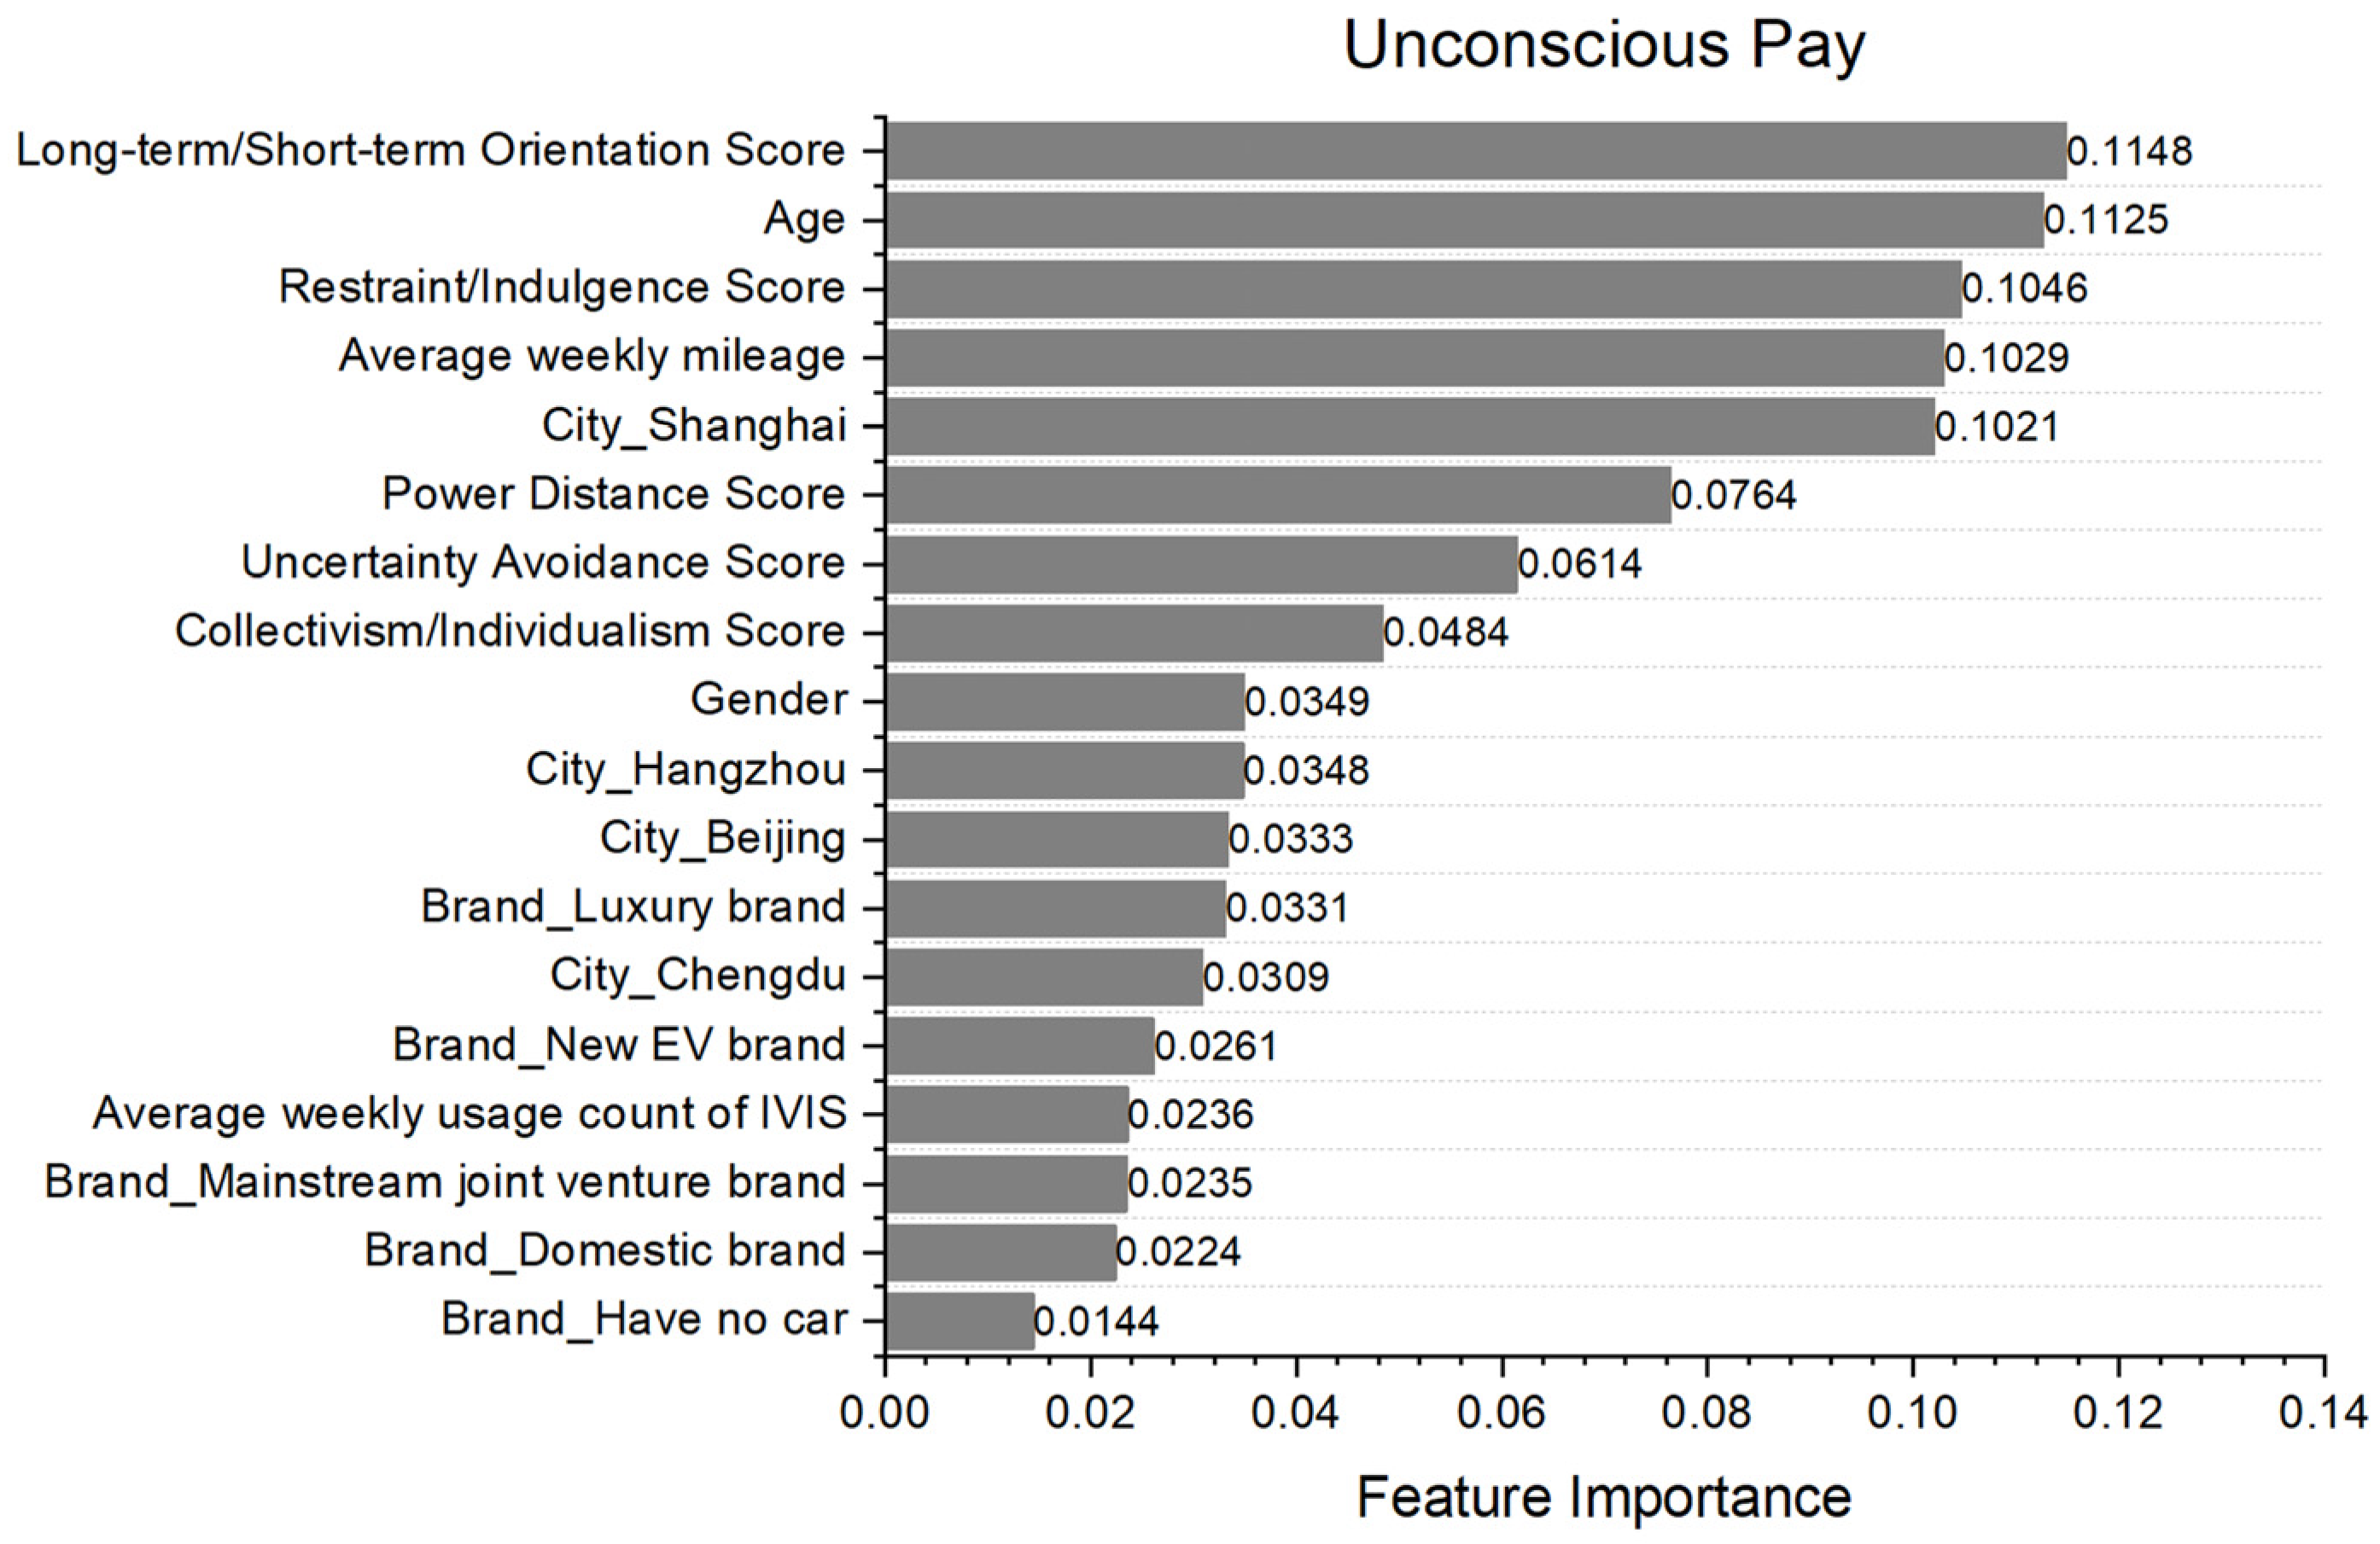
| Unconscious pay | It is a fast payment service for scenarios like parking, charging and car wash. The vehicle is bound to the mobile payment account so as to achieve rapid payment by license plate recognition, without stopping to scan the code and pay. |
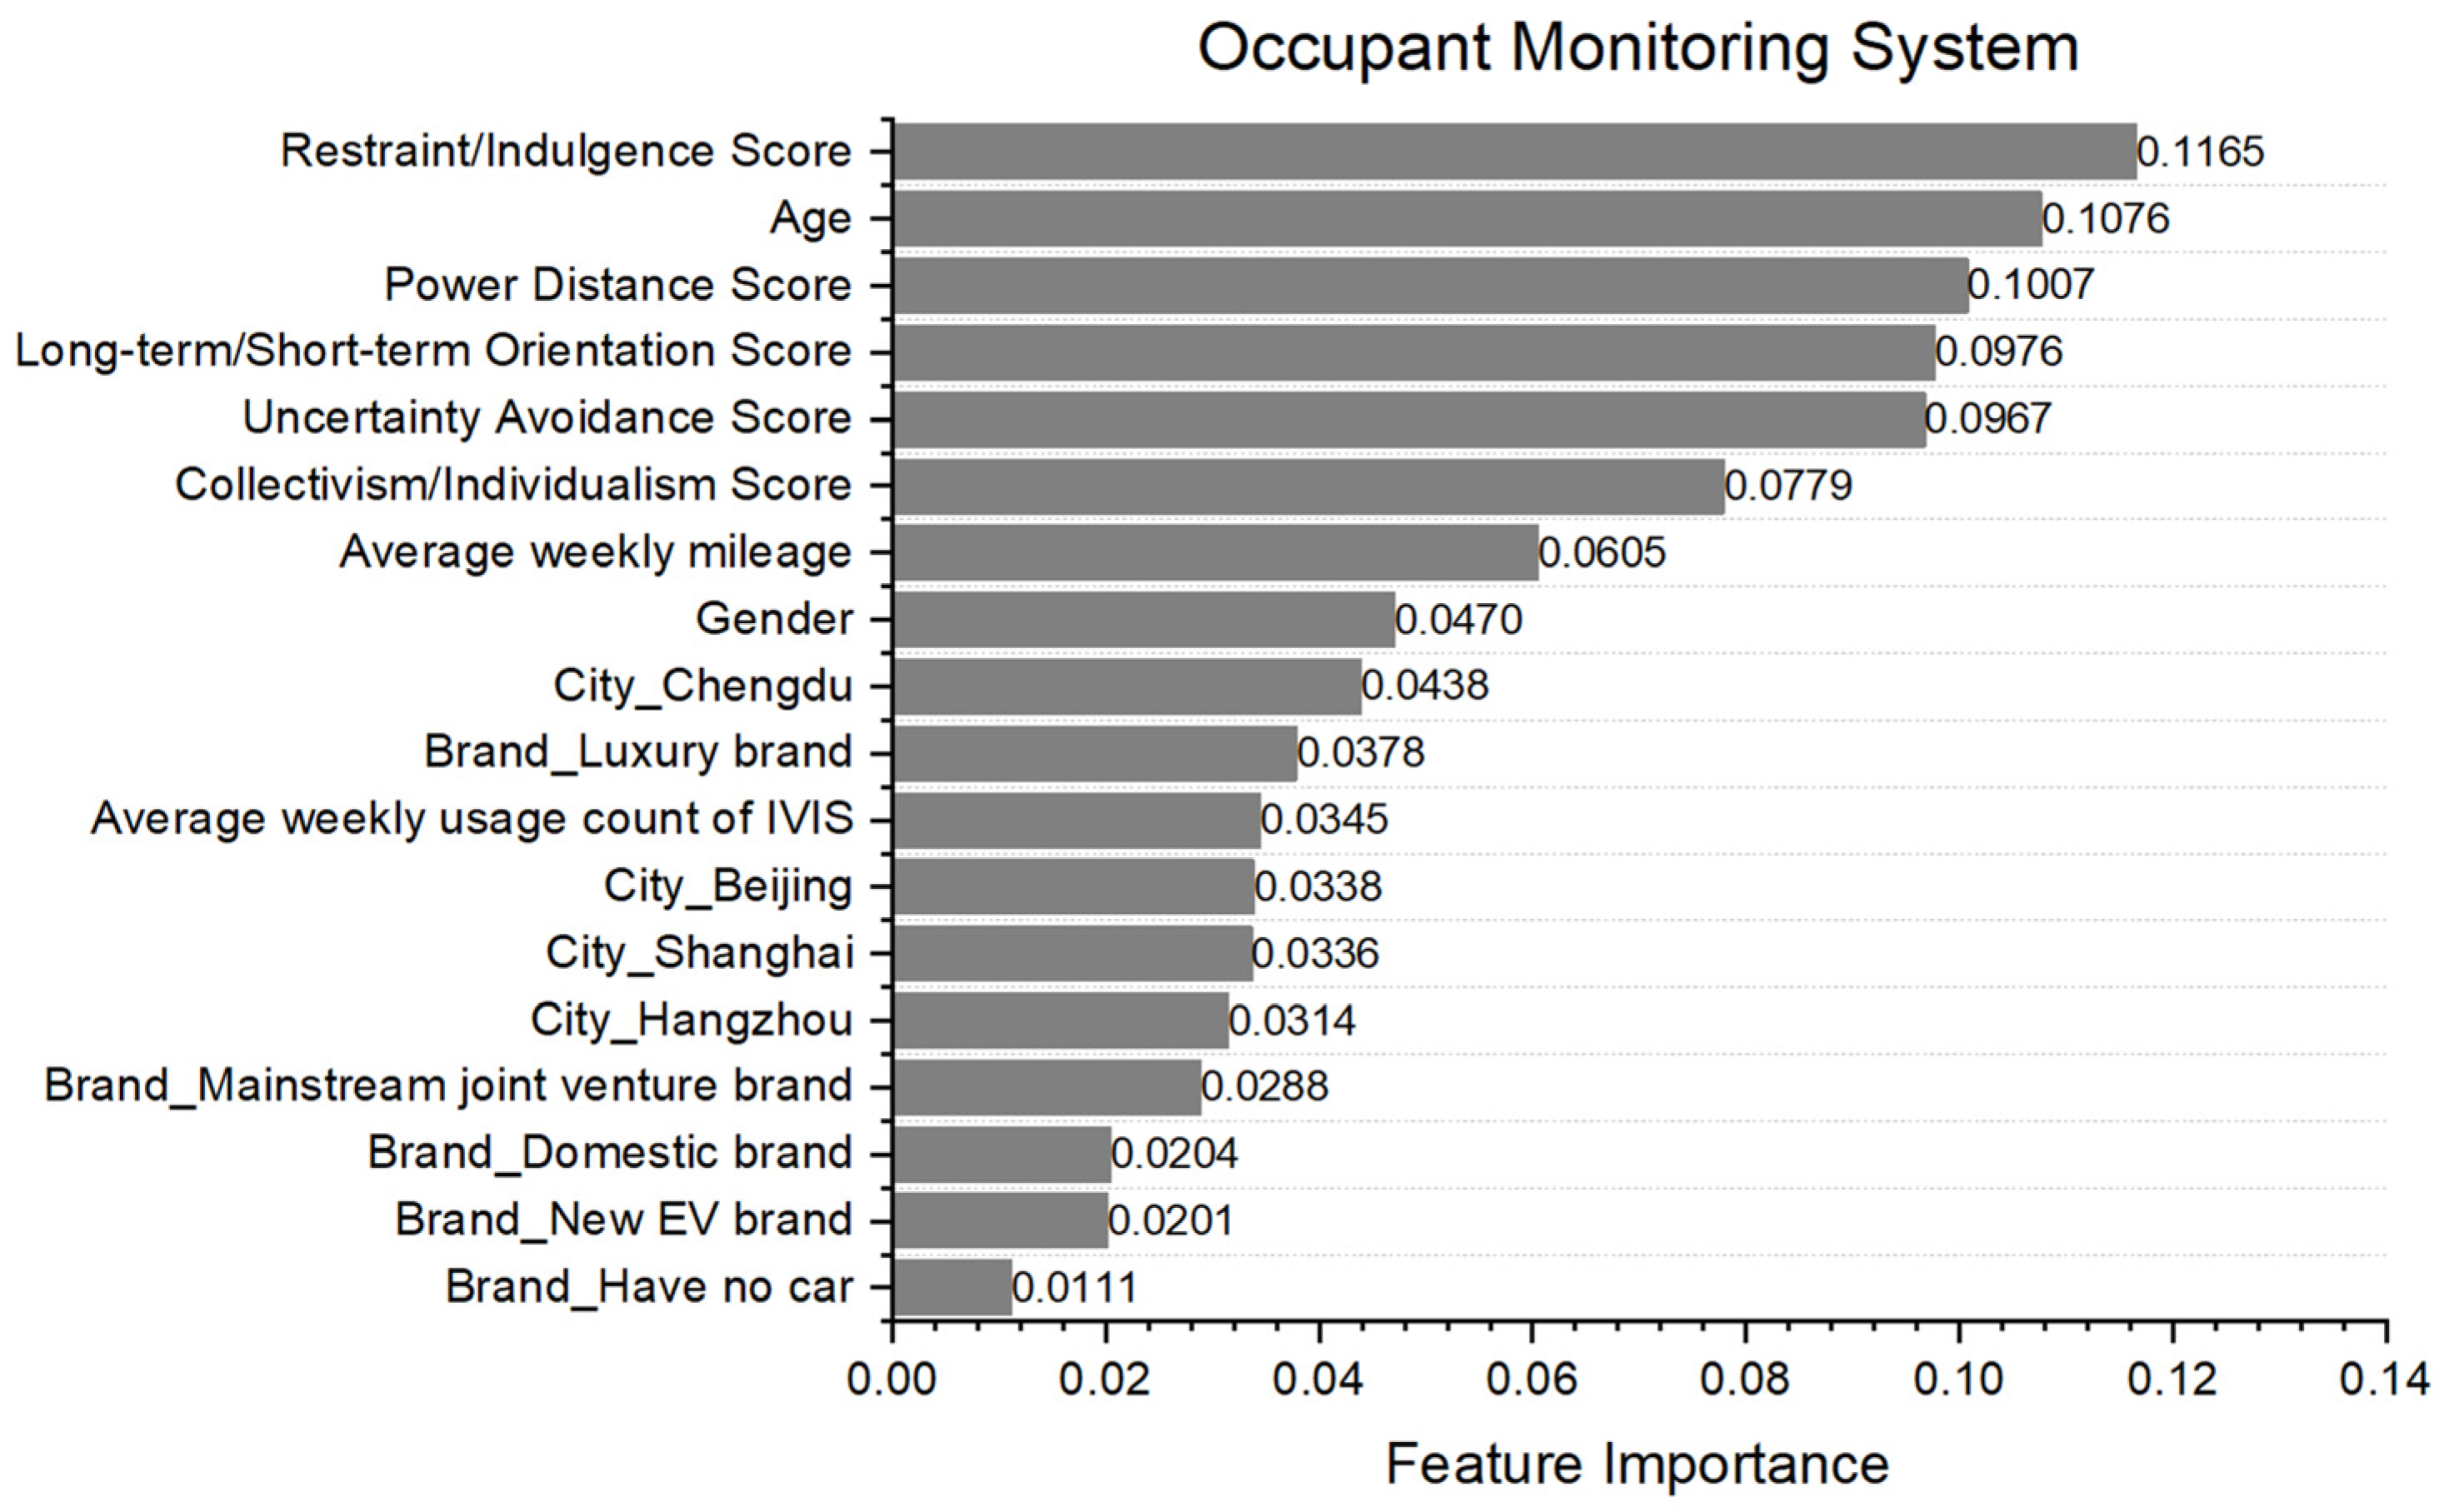
| Occupant monitoring system (OMS) | The vehicle will monitor the status of passengers through in-cabin sensors and cameras, combined with facial recognition and posture tracking, to provide timely warnings and interventions in the event of risky driving behavior by the driver or abnormal status of the passenger. |
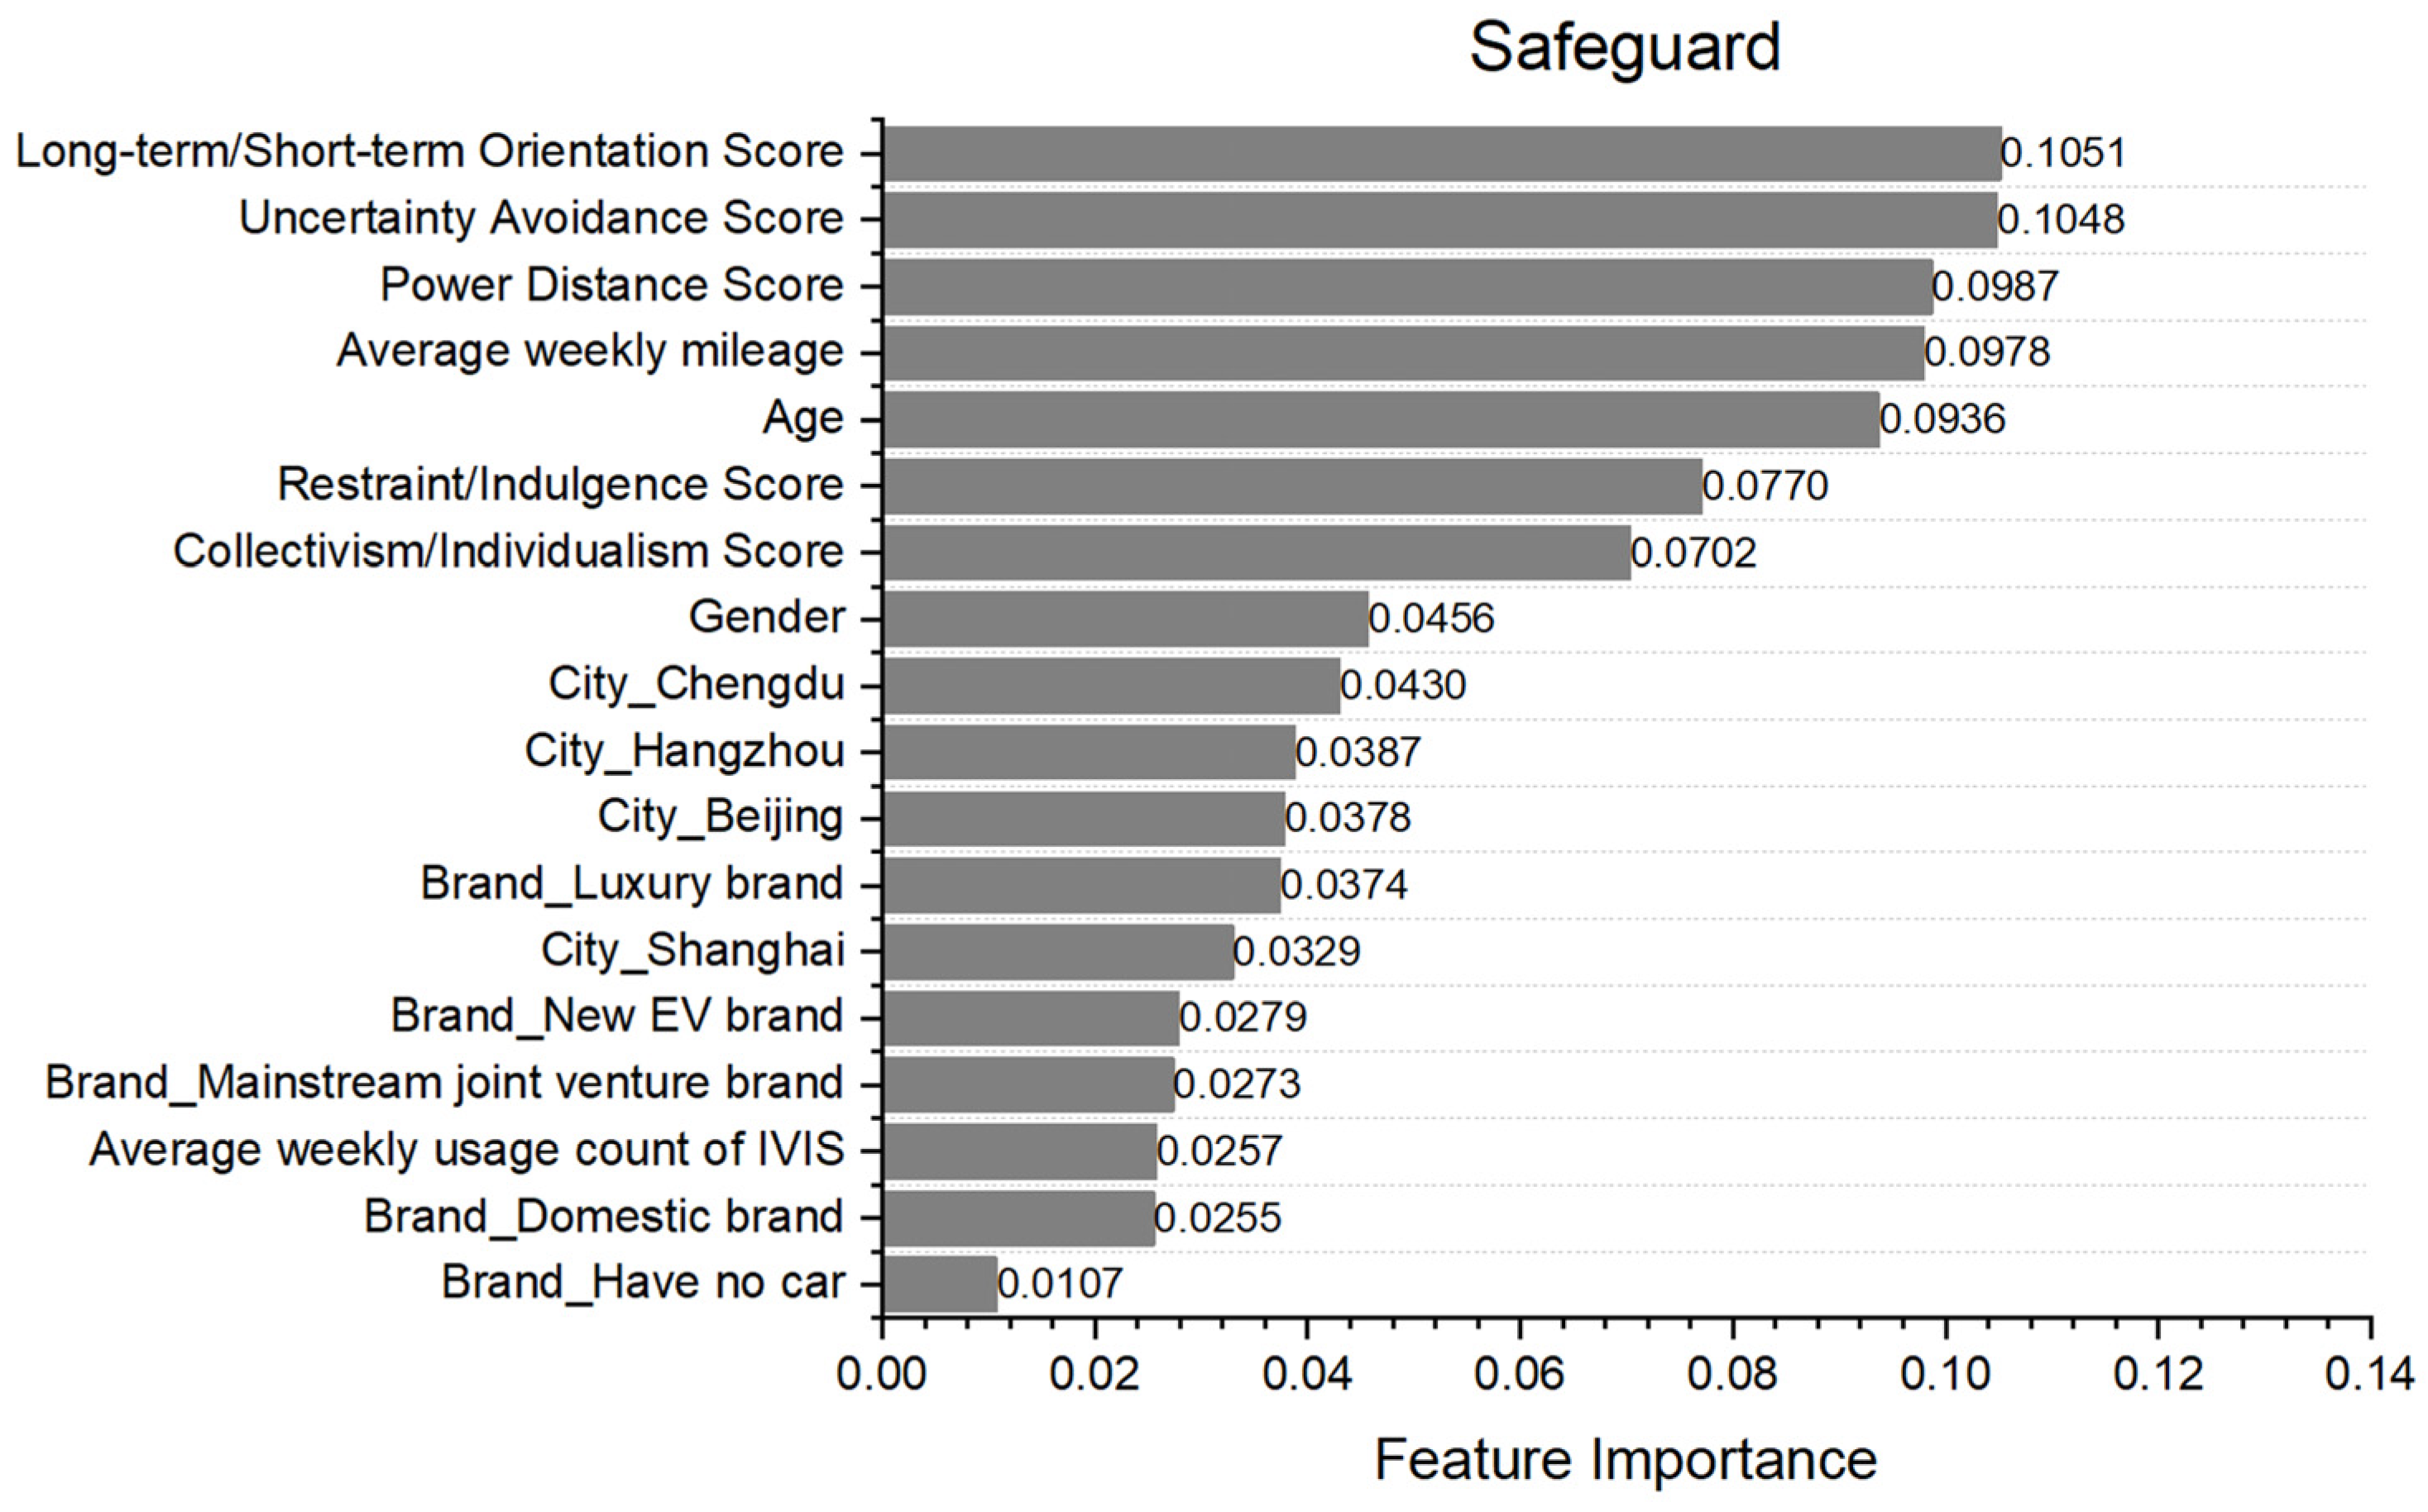
| Safeguard | It is a safety guard function based on the original hardware of the vehicle. The vehicle can record images and send alarms to the mobile phone so that the owner can always pay attention to safety when away from the vehicle. |
| Remote control | Users are able to remotely control the vehicle’s locking/unlocking, seats, doors and windows when away from the vehicle via the mobile app and can also remotely authorize the vehicle for family members and friends to use. |
| Entertainment system | Users can watch films or play games through the screen, sound system, steering wheel and other hardware in the cabin under the premise of not affecting driving safety. The IVIS supports the connection of gaming peripherals, giving users a more enjoyable entertainment experience. |
| Multi-screen collaboration | In the cabin, users can share information with the ICS, co-driver screen and rear-row screens to communicate with other passengers easily. The vehicle can also connect with user’s mobile phones and smart home devices to share files, information and control commands. |
| Vlogging | Users are able to take photos or videos via in-cabin and outside cameras. The software on ICS enables users to quickly edit the videos, add filters to them and then share with one click. |
| Application ecosystem | Through co-operation with internet vendors, the IVIS can access lots of third-party applications covering all aspects of life, providing users with a more convenient, efficient and continuous car experience. |
| Item | Category | Number | Percentage |
|---|---|---|---|
| Age | 20~25 years old | 163 | 32% |
| 26~30 years old | 203 | 40% | |
| 31~35 years old | 143 | 28% | |
| Gender | Male | 366 | 72% |
| Female | 143 | 28% | |
| City | Beijing | 128 | 25% |
| Shanghai | 255 | 52% | |
| Hangzhou | 54 | 11% | |
| Chengdu | 68 | 13% | |
| Car brand | Luxury brand | 252 | 50% |
| Mainstream joint venture brand | 81 | 16% | |
| Domestic brand | 81 | 16% | |
| New energy brand | 43 | 8% | |
| Have no car | 52 | 10% | |
| Average weekly mileage | 200~300 km | 302 | 59% |
| 300~500 km | 192 | 38% | |
| More than 500 km | 15 | 3% | |
| Average weekly usage count of IVIS | Under 3 per week | 34 | 7% |
| 3~6 per week | 441 | 87% | |
| At least once a day | 32 | 6% |
| Cronbach’s Alpha a | N of Items |
|---|---|
| 0.823 | 34 |
| Kaiser–Meyer–Olkin Measure of Sampling Adequacy | 0.791 | |
| Bartlett’s Test of Sphericity | Approx. Chi-Squared | 438.534 |
| df | 55 | |
| Sig. | 0.000 | |
| Initial | Extraction | |
|---|---|---|
| Age | 1 | 0.677 |
| Gender | 1 | 0.731 |
| City | 1 | 0.594 |
| Car brand | 1 | 0.671 |
| Average weekly mileage | 1 | 0.614 |
| Average weekly usage count of IVIS | 1 | 0.576 |
| Power distance score | 1 | 0.844 |
| Collectivism/individualism score | 1 | 0.751 |
| Long-term/short-term orientation score | 1 | 0.741 |
| Uncertainty avoidance score | 1 | 0.793 |
| Restraint/indulgence score | 1 | 0.686 |
| Feature | Accuracy | AUC | Weighted Avg F1-Score |
|---|---|---|---|
| Ambient lighting | 0.93521 | 0.73349 | 0.88 |
| Welcome mode | 0.86247 | 0.76555 | 0.87 |
| Diverse UI themes | 0.69548 | 0.69144 | 0.79 |
| Birthday surprises | 0.75442 | 0.72975 | 0.84 |
| OTA | 0.81925 | 0.71396 | 0.86 |
| Virtual assistant | 0.88212 | 0.75877 | 0.92 |
| Personal relaxing space | 0.69745 | 0.69716 | 0.81 |
| Personalized mode | 0.81729 | 0.77963 | 0.91 |
| Intelligent recommendation | 0.78782 | 0.63882 | 0.83 |
| Calendars | 0.89784 | 0.87044 | 0.88 |
| Unconscious Pay | 0.73674 | 0.78627 | 0.79 |
| OMS | 0.83104 | 0.82094 | 0.91 |
| Safeguard | 0.88016 | 0.88971 | 0.93 |
| Remote control | 0.75442 | 0.71584 | 0.72 |
| Entertainment system | 0.86444 | 0.75943 | 0.83 |
| Multi-screen collaboration | 0.75539 | 0.78866 | 0.83 |
| Vlogging | 0.80353 | 0.83765 | 0.89 |
| Application ecosystem | 0.73281 | 0.71568 | 0.85 |
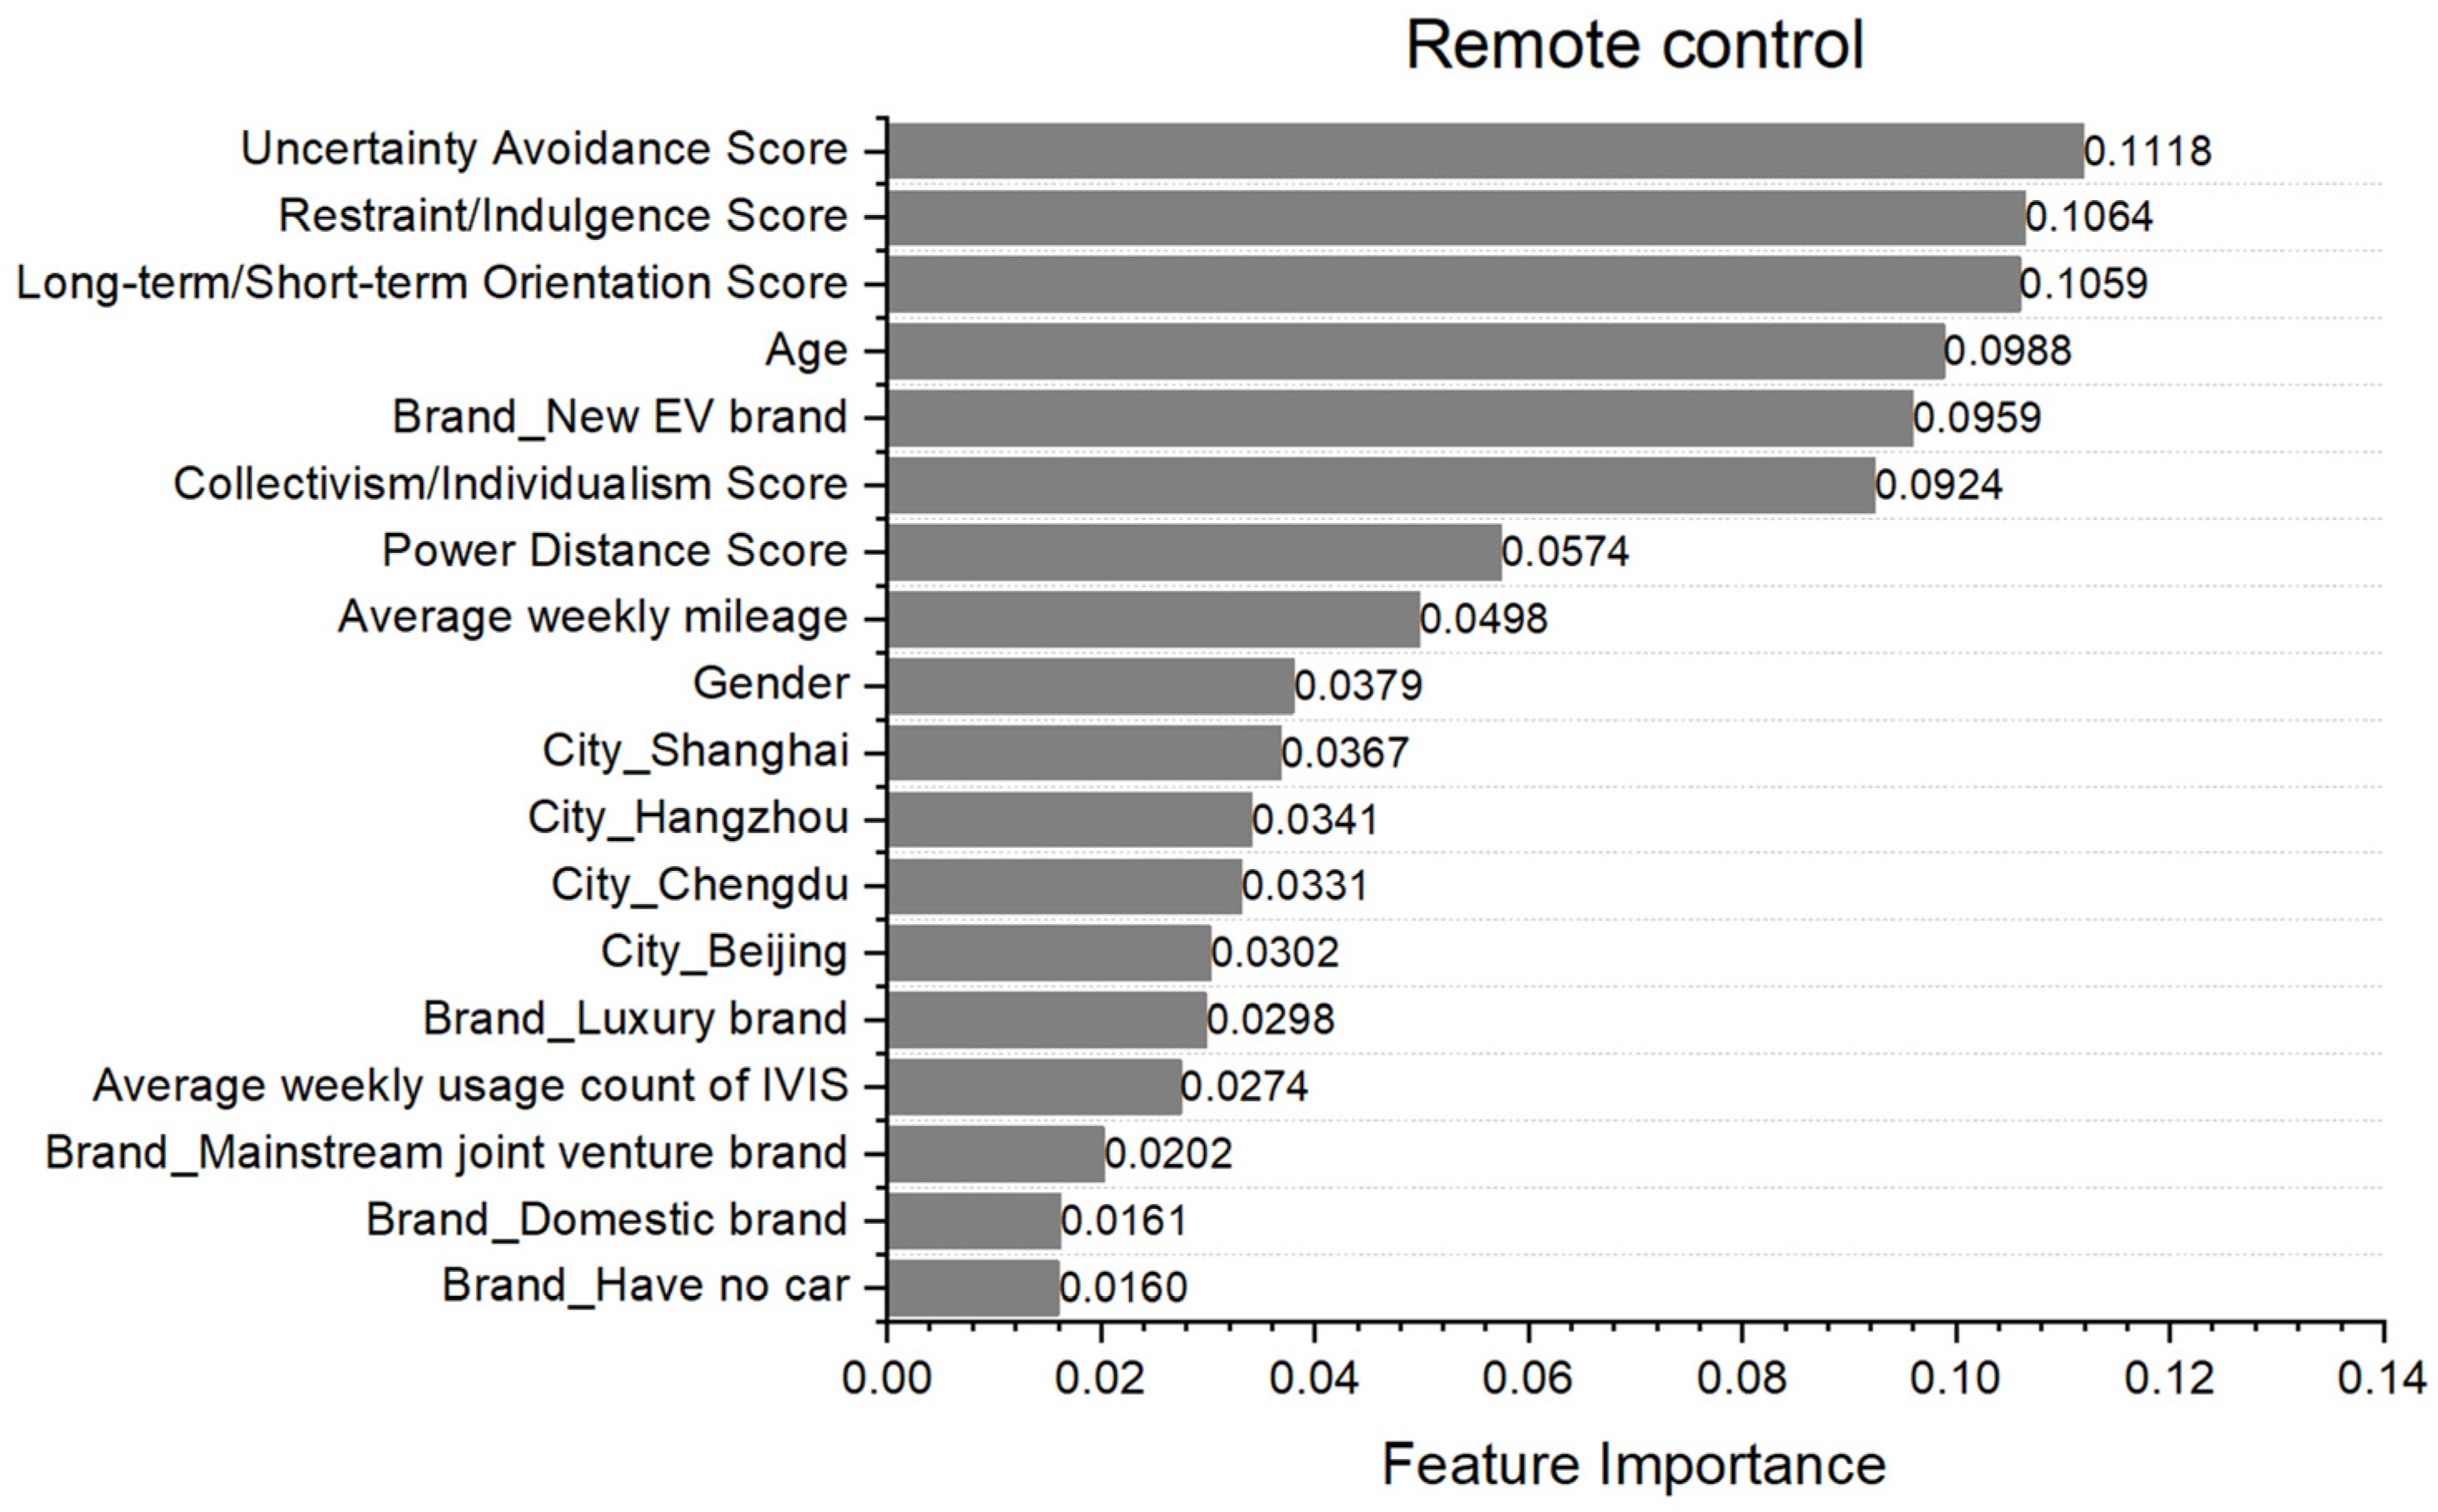
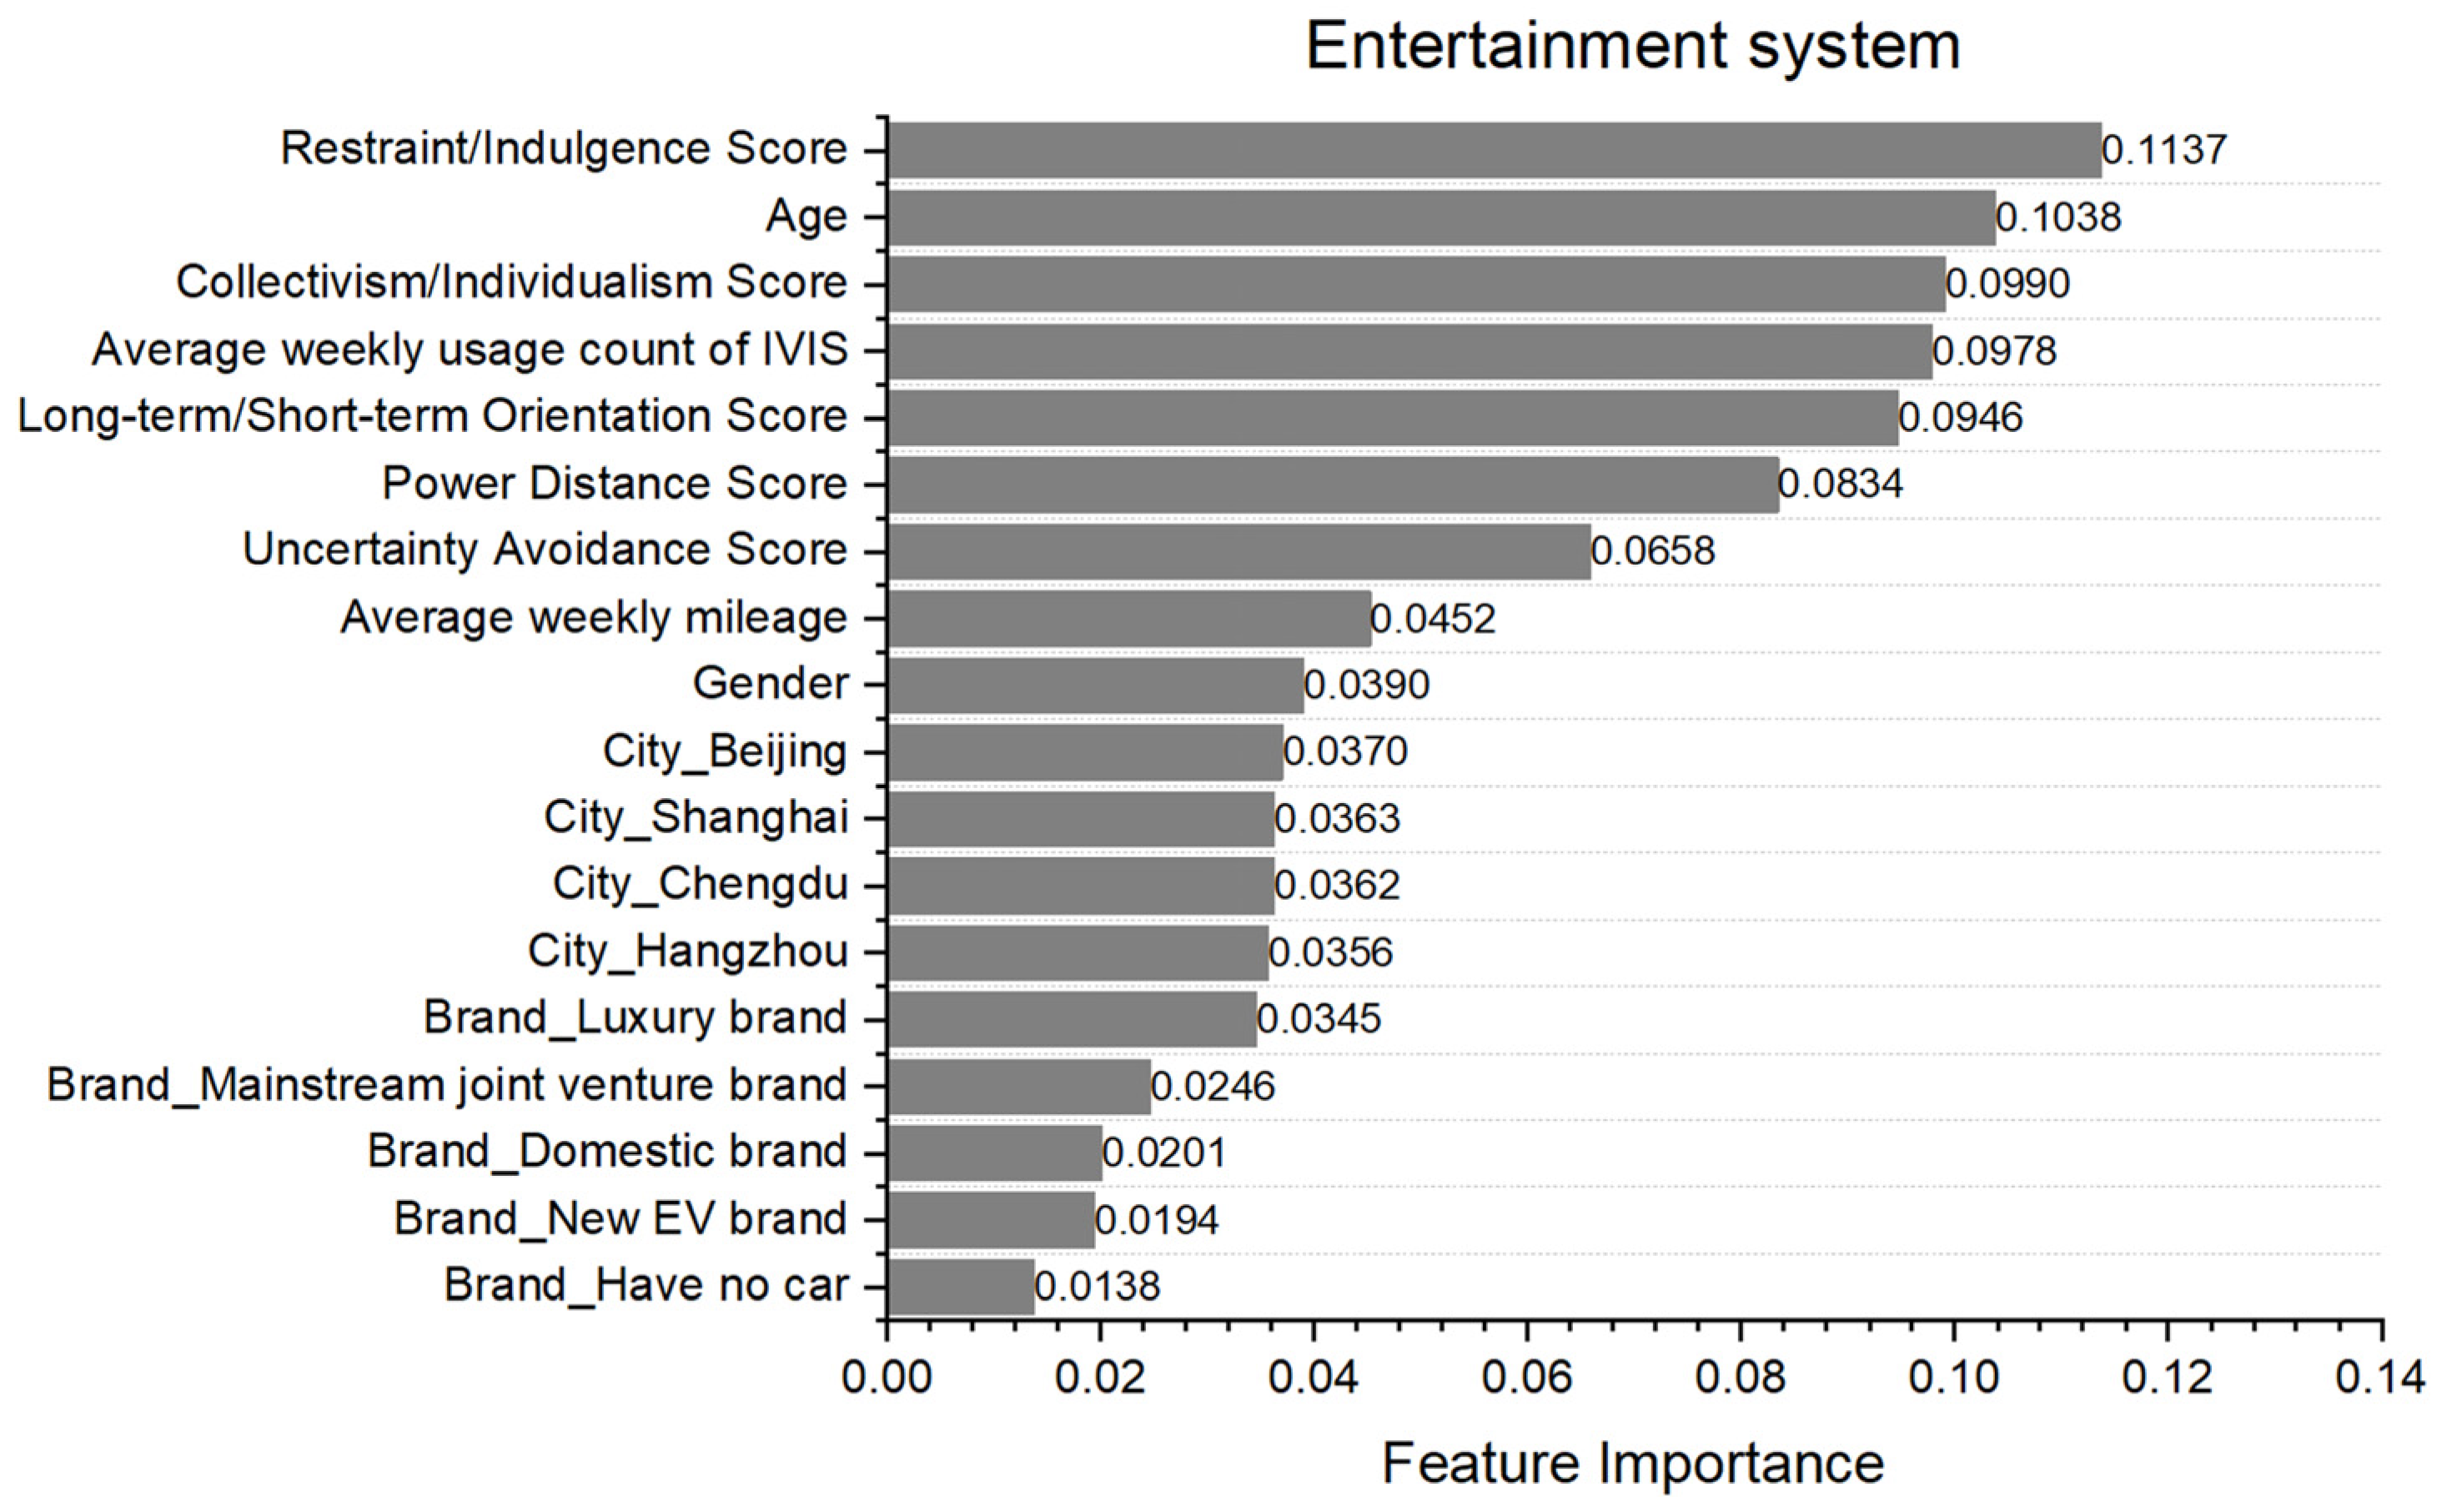
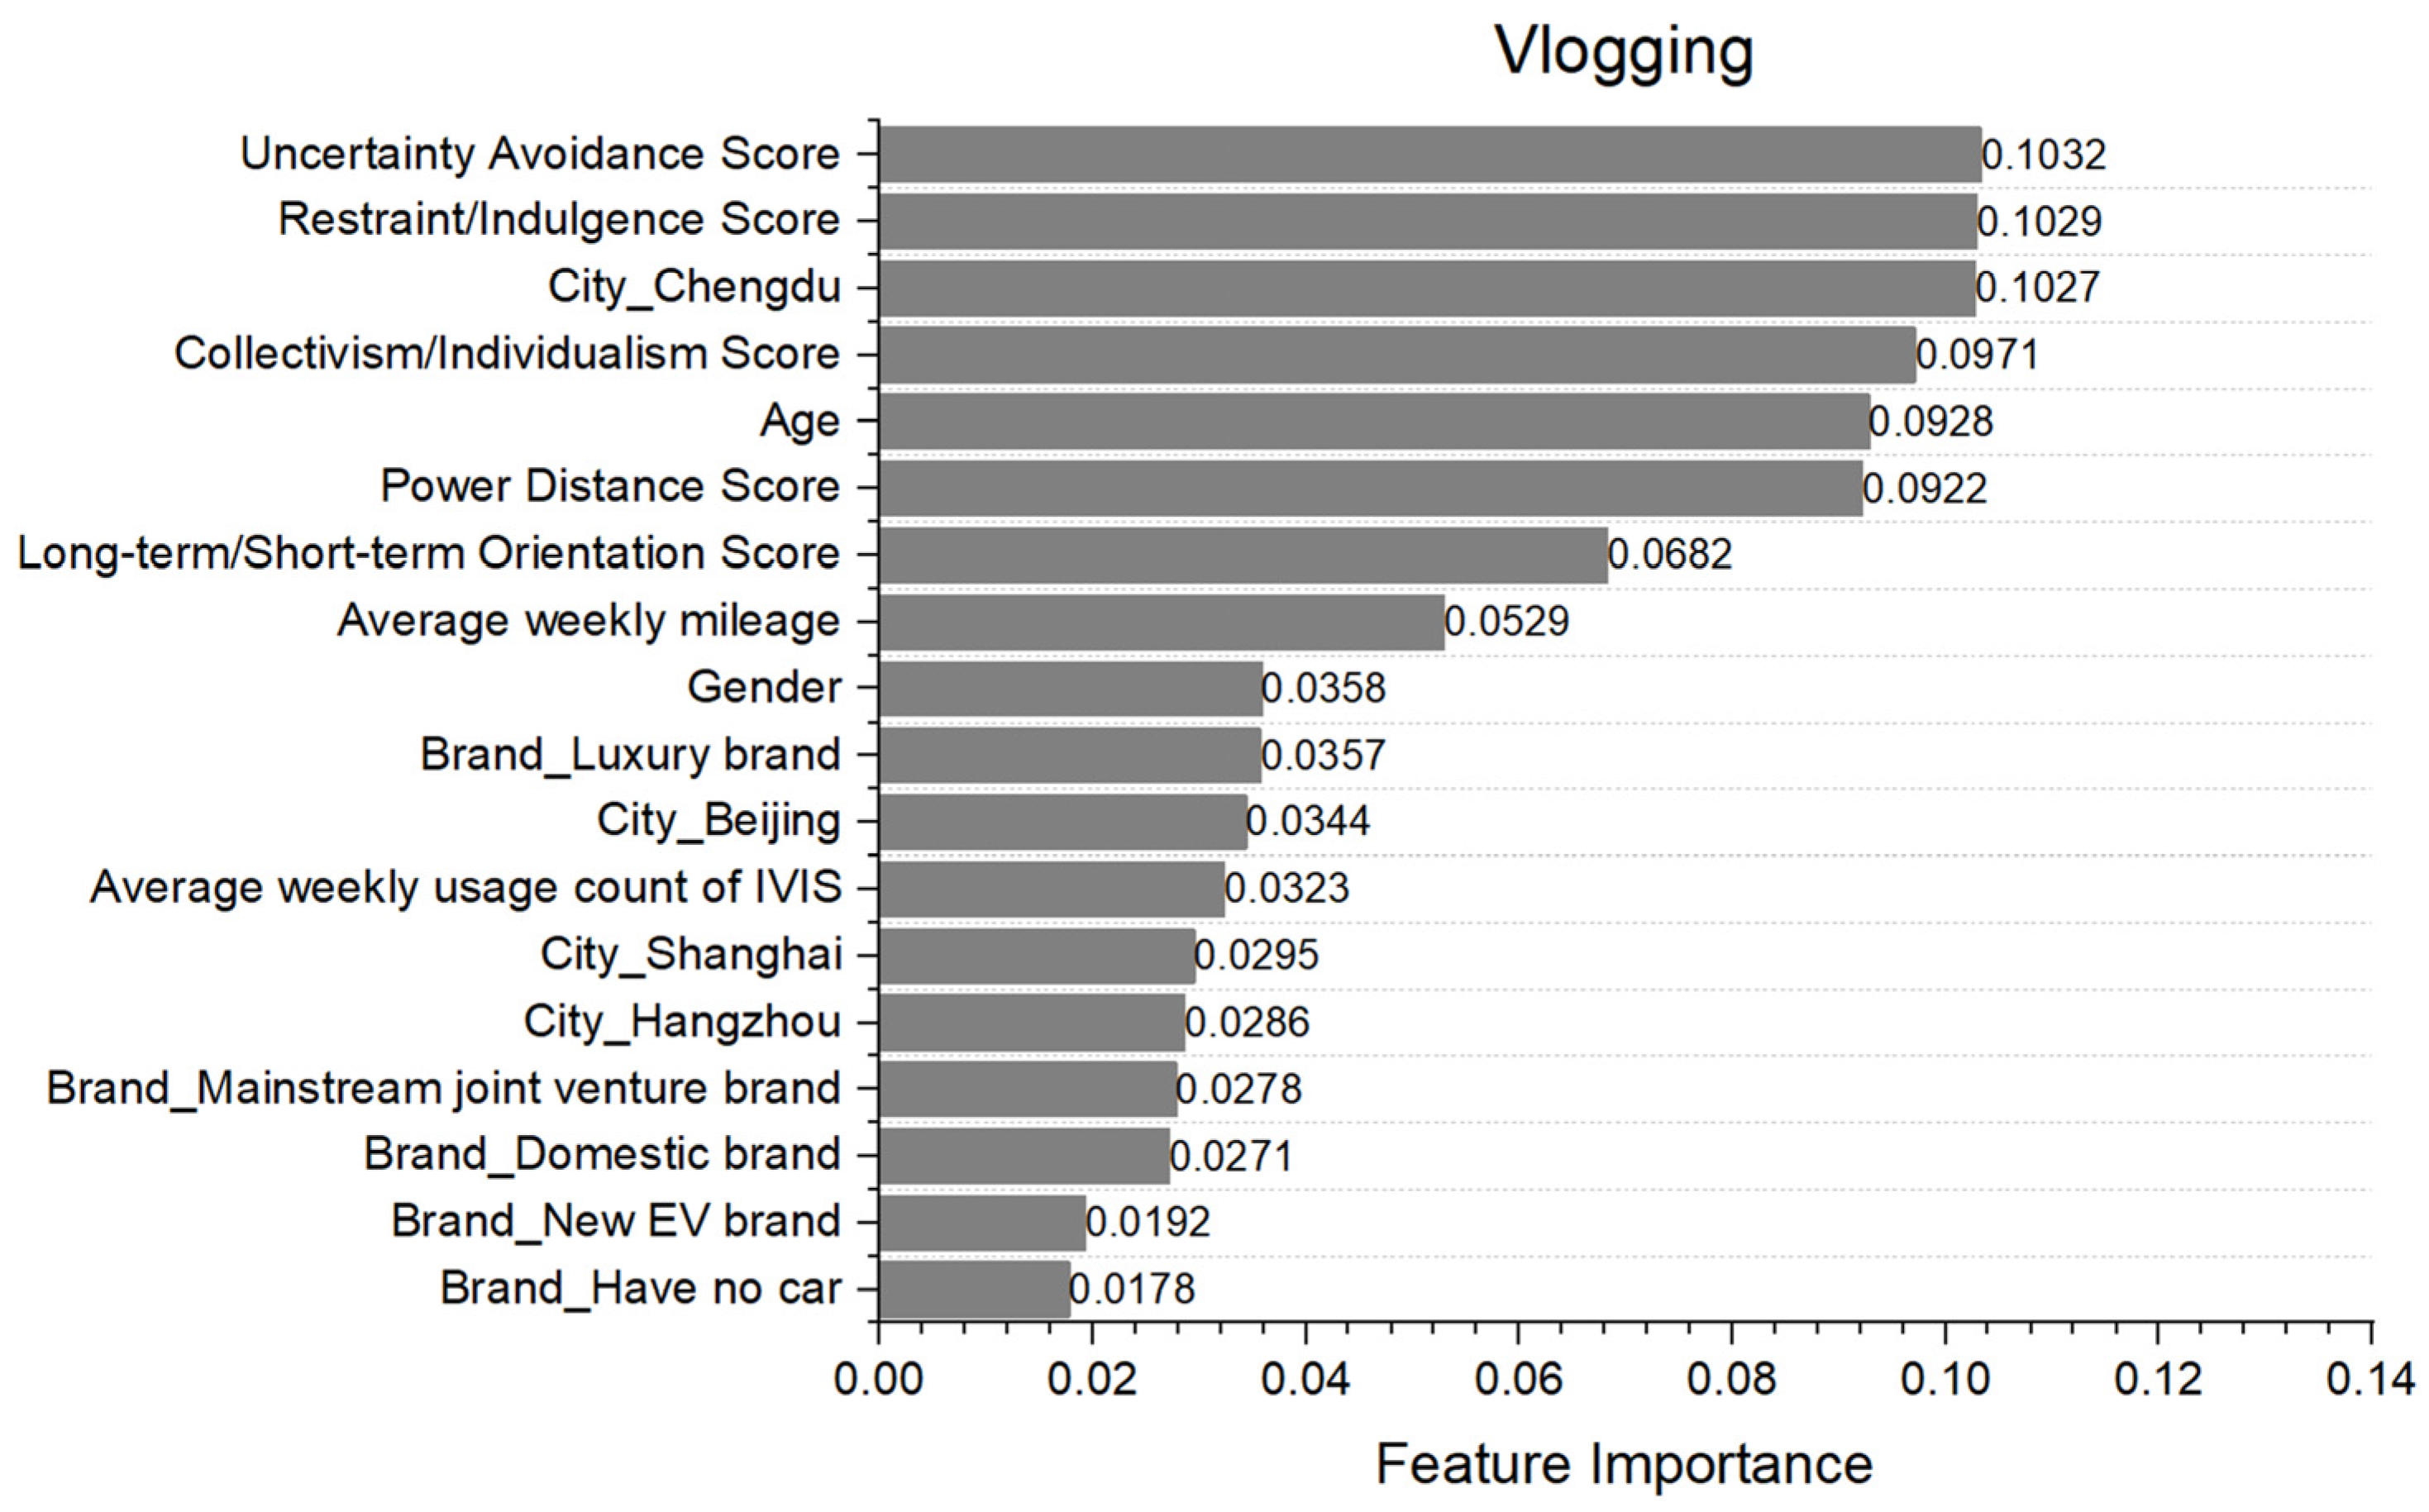
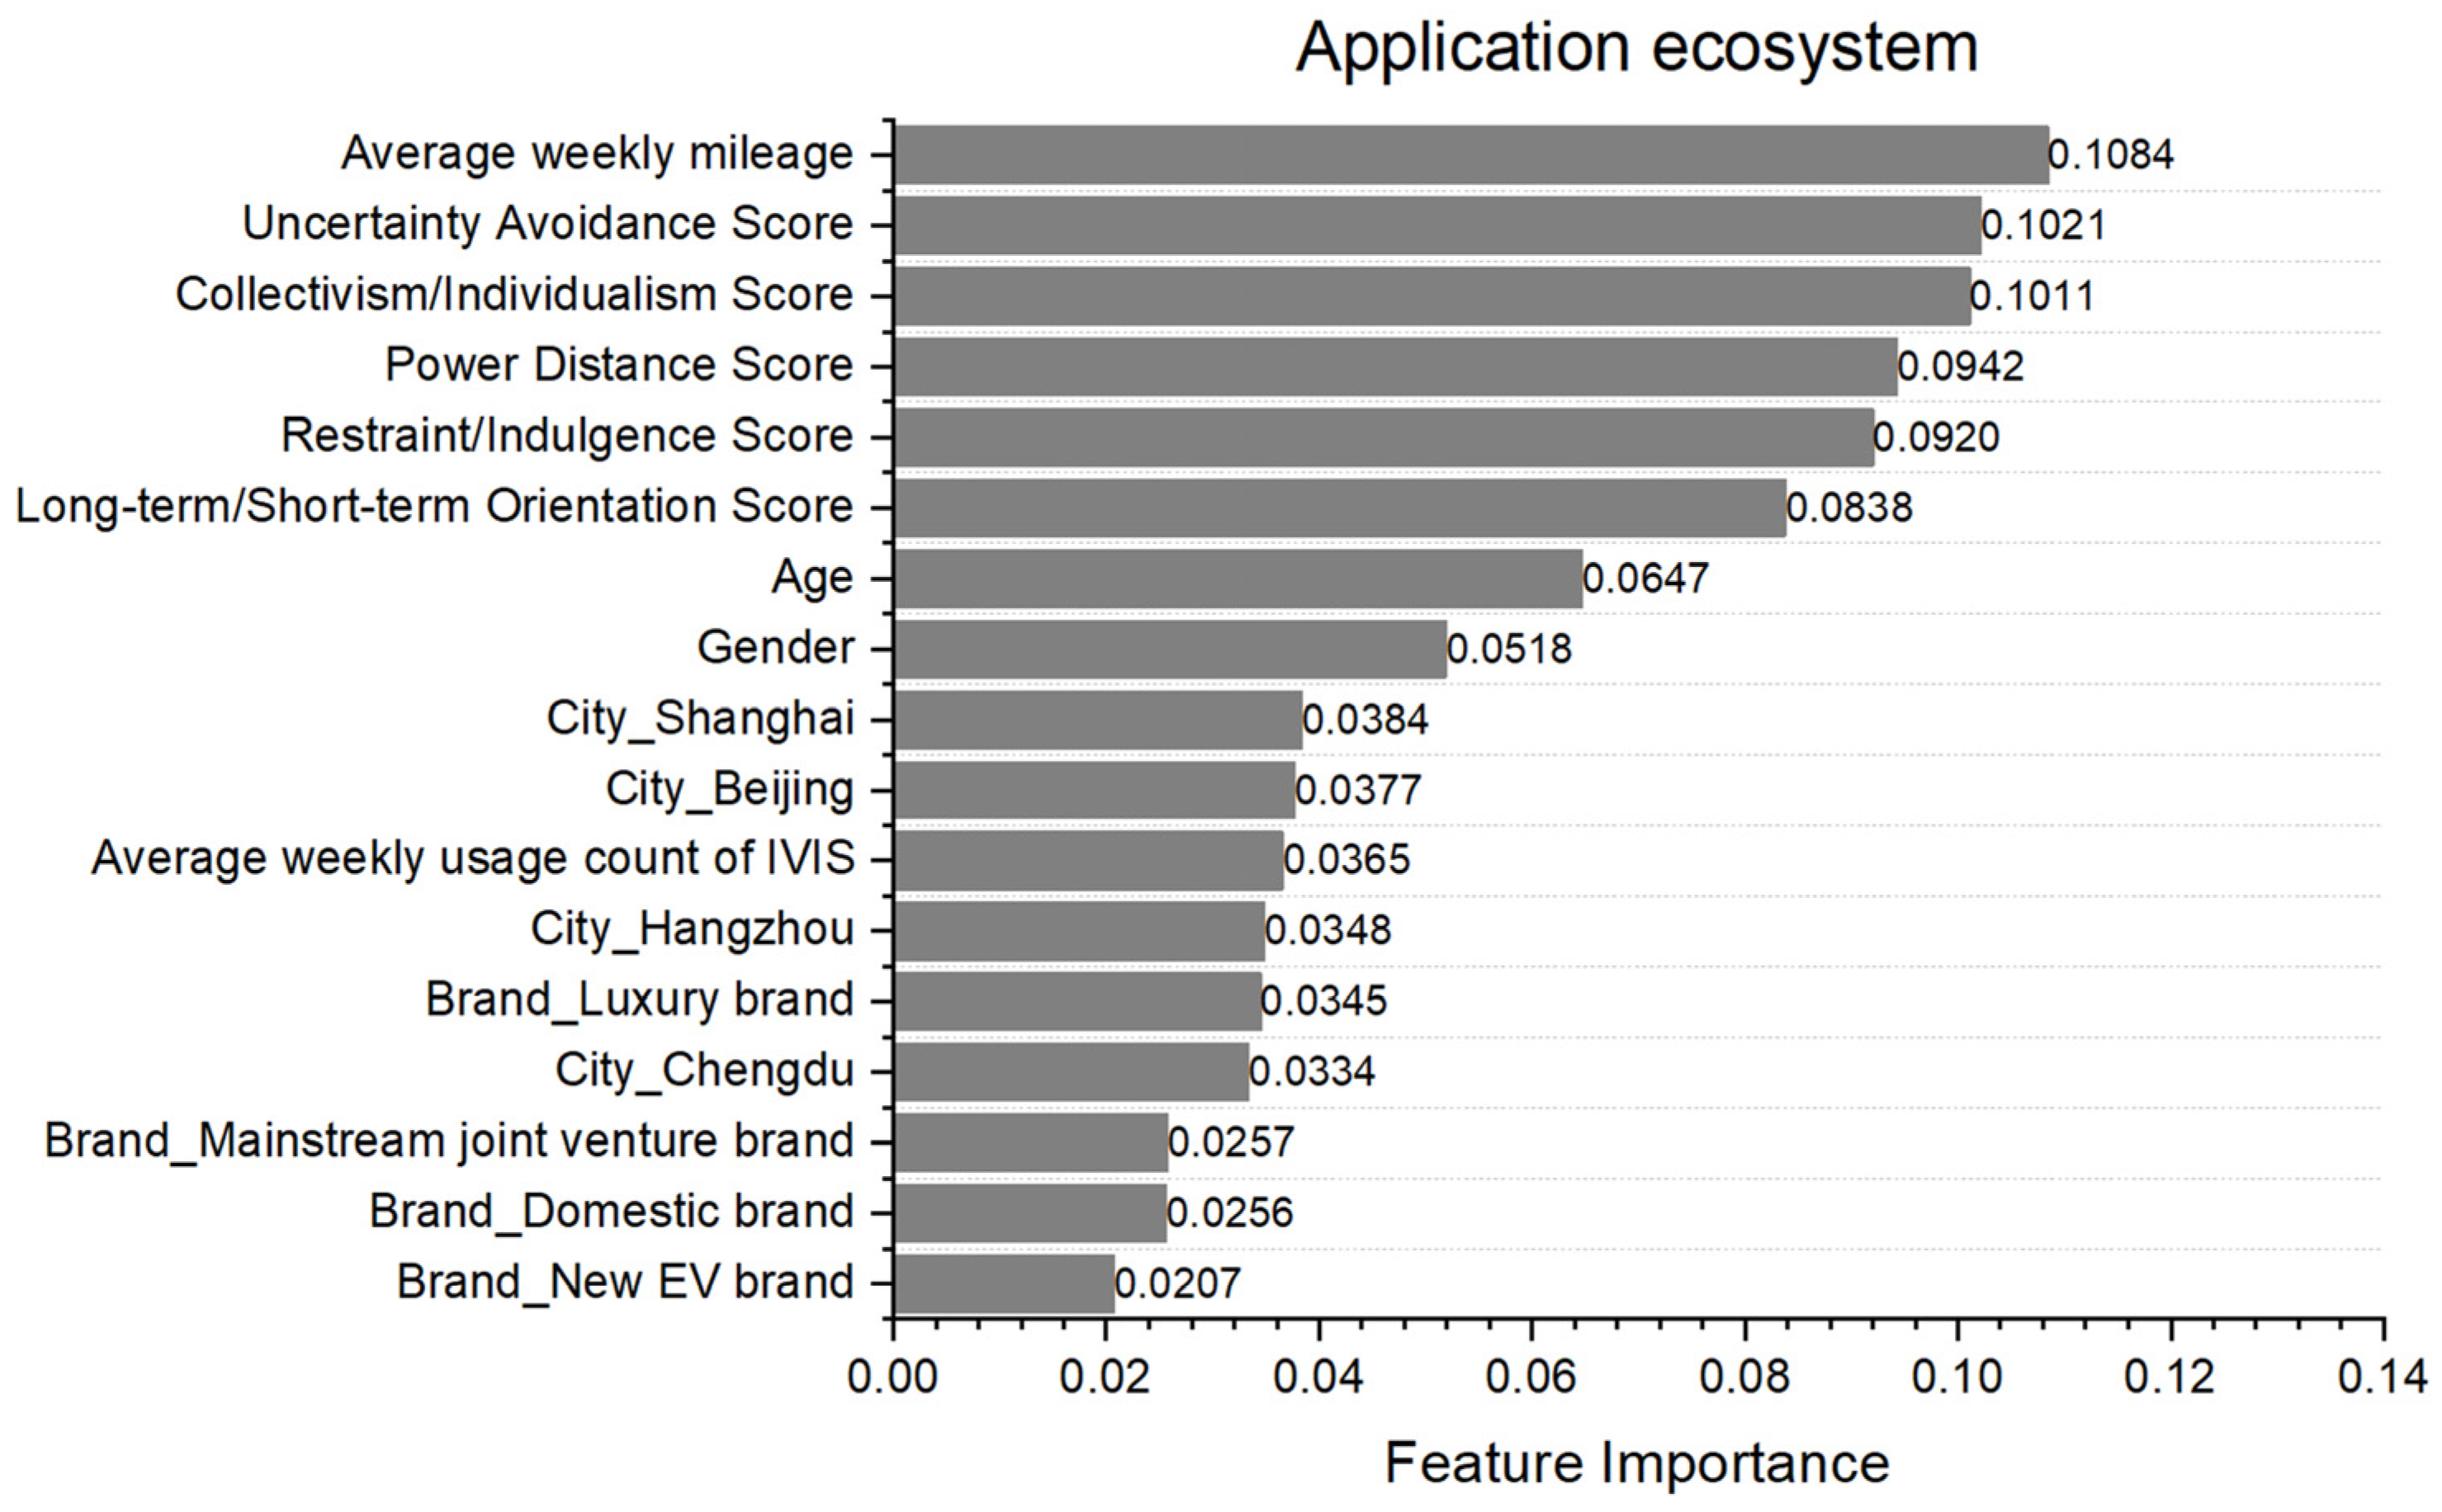
| Features | Top Five Factors | ||||
|---|---|---|---|---|---|
| Ambient Lighting | Power Distance—High | Age—Young | Collectivism | Restraint | Uncertainty Avoidance—High |
| Welcome Mode | Power Distance—High | Long-Term Orientation | Restraint | Age—Old | Collectivism |
| Diverse UI Themes | Power Distance—High | Uncertainty Avoidance—Low | Indulgence | Short-Term Orientation | Age—Young |
| Birthday Surprises | Uncertainty Avoidance—Low | Power Distance—High | Age—Young | Indulgence | Short-Term Orientation |
| OTA | Short-Term Orientation | Indulgence | Uncertainty Avoidance—Low | City—Shanghai | Luxury Brand |
| Virtual Assistant | Power Distance—High | Age—Young | Average Weekly Mileage—More | Indulgence | Uncertainty Avoidance—Low |
| Personal Relaxing Space | Long-Term Orientation | Age—Old | Individualism | Luxury Brand | Indulgence |
| Personalized Mode | Uncertainty Avoidance—Low | Age—Young | Short-Term Orientation | Individualism | Gender—Female |
| Intelligent Recommendation | Uncertainty Avoidance—Low | Indulgence | Age—Young | Long-Term Orientation | New Energy Brand |
| Calendars | Power Distance—High | Long-Term Orientation | Age—Old | Uncertainty Avoidance—High | City—Beijing |
| Unconscious Pay | Long-Term Orientation | Age—Young | Indulgence | Average Weekly Mileage—More | City—Shanghai |
| OMS | Indulgence | Age—Old | Power Distance—Low | Long-Term Orientation | Uncertainty Avoidance—High |
| Safeguard | Long-Term Orientation | Uncertainty Avoidance—High | Power Distance—High | Average Weekly Mileage—More | Age—Old |
| Remote Control | Uncertainty Avoidance—Low | Indulgence | Long-Term Orientation | Age—Young | New Energy Brand |
| Entertainment System | Indulgence | Age—Young | Collectivism | Average Weekly Usage Count of IVIS—More | Short-Term Orientation |
| Multi-Screen Collaboration | Power Distance—Low | Indulgence | Long-Term Orientation | Uncertainty Avoidance—High | Average Weekly Mileage—More |
| Vlogging | Uncertainty Avoidance—Low | Indulgence | City—Chengdu | Collectivism | Age—Young |
| Application Ecosystem | Average Weekly Mileage—More | Uncertainty Avoidance—High | Collectivism | Power Distance—High | Indulgence |
| Cluster | Error | F | Sig | |||
|---|---|---|---|---|---|---|
| Mean Square | df | Mean Square | df | |||
| Age | 12.38 | 2 | 0.553 | 504 | 122.395 | 0.000 |
| Gender | 4.483 | 2 | 0.186 | 504 | 24.113 | 0.000 |
| City | 205.499 | 2 | 0.44 | 504 | 367.146 | 0.000 |
| Car brand | 338.365 | 2 | 0.536 | 504 | 231.763 | 0.000 |
| Average weekly mileage | 1.77 | 2 | 0.296 | 504 | 5.984 | 0.003 |
| Average weekly usage count of IVIS | 4.326 | 2 | 0.11 | 504 | 39.394 | 0.000 |
| Group 1 | Group 2 | Group 3 | |
|---|---|---|---|
| Age | 20–25 years old | 31–35 years old | 26–30 years old |
| Gender | Female | Male | Male |
| City | Shanghai | Beijing | Chengdu |
| Car brand | New energy brand | Luxury brand | Luxury brand |
| Average weekly mileage | 200~300 km | 300~500 km | More than 500 km |
| Average weekly usage count of IVIS | three~six per week | Under three per week | At least once a day |
| Power distance score | 9 | 12 | 7 |
| Collectivism/individualism score | 12 | 10 | 9 |
| Long-term/short-term orientation score | 7 | 12 | 9 |
| Uncertainty avoidance score | 10 | 11 | 7 |
| Restraint/indulgence score | 6 | 10 | 8 |
| Feature | Group 1 | Group 2 | Group 3 |
|---|---|---|---|
| Ambient lighting | 1 | 1 | 1 |
| Welcome mode | 0 | 1 | 0 |
| Diverse UI themes | 1 | 0 | 1 |
| Birthday surprises | 1 | 0 | 1 |
| OTA | 0 | 0 | 1 |
| Virtual assistant | 1 | 0 | 1 |
| Personal relaxing space | 1 | 0 | 0 |
| Personalized mode | 1 | 0 | 1 |
| Intelligent recommendation | 1 | 0 | 0 |
| Calendars | 1 | 1 | 0 |
| Unconscious pay | 1 | 1 | 1 |
| OMS | 1 | 1 | 1 |
| Safeguard | 1 | 1 | 0 |
| Remote control | 0 | 1 | 1 |
| Entertainment system | 1 | 0 | 1 |
| Multi-screen collaboration | 0 | 0 | 1 |
| Vlogging | 1 | 0 | 1 |
| Application ecosystem | 1 | 0 | 0 |
| Group 1 | Group 2 | Group 3 |
|---|---|---|
| OMS | OMS | Entertainment system |
| Safeguard | Calendars | Remote control |
| Entertainment system | Welcome mode | Vlogging |
| Vlogging | Ambient lighting | OMS |
| Personal relaxing space | Safeguard | OTA |
| Intelligent recommendation | Remote control | Personalized mode |
| Unconscious pay | Unconscious pay | Unconscious pay |
| Virtual assistant | Personal relaxing space | Ambient lighting |
| Calendars | Diverse UI themes | |
| Application ecosystem | Multi-screen collaboration | |
| Personalized mode | Virtual assistant | |
| Birthday surprises | Birthday surprises | |
| Diverse UI themes | ||
| Ambient lighting |
Disclaimer/Publisher’s Note: The statements, opinions and data contained in all publications are solely those of the individual author(s) and contributor(s) and not of MDPI and/or the editor(s). MDPI and/or the editor(s) disclaim responsibility for any injury to people or property resulting from any ideas, methods, instructions or products referred to in the content. |
© 2024 by the authors. Licensee MDPI, Basel, Switzerland. This article is an open access article distributed under the terms and conditions of the Creative Commons Attribution (CC BY) license (https://creativecommons.org/licenses/by/4.0/).
Share and Cite
Ma, J.; Gong, Y.; Xu, W. Predicting User Preference for Innovative Features in Intelligent Connected Vehicles from a Cultural Perspective. World Electr. Veh. J. 2024, 15, 130. https://doi.org/10.3390/wevj15040130
Ma J, Gong Y, Xu W. Predicting User Preference for Innovative Features in Intelligent Connected Vehicles from a Cultural Perspective. World Electric Vehicle Journal. 2024; 15(4):130. https://doi.org/10.3390/wevj15040130
Chicago/Turabian StyleMa, Jun, Yuqi Gong, and Wenxia Xu. 2024. "Predicting User Preference for Innovative Features in Intelligent Connected Vehicles from a Cultural Perspective" World Electric Vehicle Journal 15, no. 4: 130. https://doi.org/10.3390/wevj15040130
APA StyleMa, J., Gong, Y., & Xu, W. (2024). Predicting User Preference for Innovative Features in Intelligent Connected Vehicles from a Cultural Perspective. World Electric Vehicle Journal, 15(4), 130. https://doi.org/10.3390/wevj15040130