Article

Application of Real-Life On-Road Driving Data for Simulating the Electrification of Long-Haul Transport Trucks

1
National Research Council of Canada, 1200 Montreal Rd., Ottawa, ON K1A 0R6, Canada
2
Natural Resources Canada, 1 Haanel Drive, Ottawa, ON K1A 1M1, Canada
3
ICAM-Lille, 6 rue Auber, 59800 Lille, France
*
Author to whom correspondence should be addressed.
World Electr. Veh. J. 2024, 15(4), 149; https://doi.org/10.3390/wevj15040149
Submission received: 21 February 2024 / Revised: 12 March 2024 / Accepted: 29 March 2024 / Published: 4 April 2024

Abstract

:
The worldwide commitment to the electrification of road transport will require a broad overhaul of equipment and infrastructure. Heavy-duty trucks account for over one-third of on-road energy use. Electrified roadways (e-Hwys) are an emerging technology where electric vehicles receive electricity while driving via dynamic wireless power transfer (DWPT), which is becoming highly efficient, and can bypass the battery to directly serve the motor. A modeling study was undertaken to compare long-haul trucks on e-Hwys with conventional battery technology requiring off-road recharging to assess the most favorable pathway to electrification. Detailed data taken from on-road driving trips from five diesel transport trucks were obtained for this study. This on-road data provided the simulations with both real-life duty cycles as well as performance targets for electric trucks, enabling an assessment and comparison of their performance on e-Hwys or with fast recharging. Battery-only trucks were found to have lifetimes down to 60% original battery capacity (60% SOH) of up to 9 years with 1600 kWh packs, and were similar to conventional diesel truck performance. On e-Hwys smaller pack sizes in the 500 to 900 kWh capacity range were sufficient for the driving duty, and showed lifetimes upwards of 20 years, comparing favorably to the battery calendar life limit of about 26 years. For a 535 kWh battery pack, an e-Hwy DWPT level of 250 kW was sufficient for a 36 tonne truck to complete all the daily driving as defined by the diesel reference trucks, and reach a battery pack end of life point of 60% SOH.

1. Introduction

Electrified highways (e-Hwys) are a technology potentially suitable for the decarbonization of road transportation [1,2,3,4]. e-Hwys work by having installed infrastructure which supplies electricity directly from the electric grid to vehicles as they travel along the road, traditionally with catenary systems, or more recently, via dynamic wireless power transfer (DWPT) [3,5]. e-Hwys thus shift the focus to dynamic power rather than the more conventional electric vehicle (EV) situation which relies on the storage capacity of a battery.
The concept of dynamic electrified road vehicles goes back well over 100 years beginning with catenary systems for urban transit trolley car routes [6]. While they were alluded to in a notional sense in relation to future concerns of energy and environment stresses [7], no meaningful technical breakthroughs were made with any other modality until almost 1990 [8,9]. It is only within the last decade that more concretely promising technical developments have emerged along with the circumstances driving firmer commitment to realize experimental and test installations [10,11,12].
Transport on e-Hwys has the prospective advantage over the conventional situation of battery electric trucks in that it can allow trucks to operate using much smaller battery packs, as the battery would only be intensively used for non-electrified portions of any driving. This is significant, since the battery remains the costliest component of an electric vehicle. Despite these advantages, the installation costs of e-Hwys are high and need to be compared to high power charging in a comprehensive way to guide upcoming infrastructure development. For the transport sector, e-Hwys could enable truck operation with less concern about driving range and recharging downtime. Canada could be a country that is suitable for the implementation of e-Hwys, since a large portion of its population is concentrated on the Windsor–Quebec City corridor, which is situated on a well-developed highway system. Long-haul transport trucks remain an important component of the transport sector. All classes of on-road vehicles consume upwards of 75% of the energy used in the transportation sector, with heavy-duty trucks accounting for about one-third of this [13]. It is understood that there is a market for both freight by rail and road. On average, long-distance cargo transport is cheaper, consumes less energy and can move more quickly by rail. Rail still deals with the disadvantage of having to transfer much of its freight to and from trucks to complete point to point deliveries. Thus, road transport becomes economically viable across shorter distances, where door to door transit times end up being shorter than by rail, making it the preferred method for shipping goods that are time sensitive [14]. At present, the Windsor–Quebec rail corridor is diesel powered, so it would also benefit from electrification.
The electrification of roadways is now a developing reality. Ultimately, should e-Hwys become widespread, it would require a level of full commitment to them from a range of sectors including highway departments, vehicle manufacturers, the electrical distribution grid, favorable policy and an aligned citizenry. Test sections of e-Hwys are an essential first step. Notable initial efforts include a 1.6 km test section of e-Hwy on the Swedish island of Gotland [15], a 10 km catenary supplied section of the A5 autobahn in Germany [16], a test section of e-Hwy between Paris and Orléans in France is planned with the Vinci group working with government support [17], as well as a portion of a route used by electric urban transit buses in Tel Aviv [18] involving the commercial company Electreon. The totality of these efforts along with a number of higher level academic studies indicate that the eventual viability of e-Hwys on either a restricted or general level remains entirely possible at present, and that said, it is very much premature at this point to rule them out. A comprehensive Swedish study at a national infrastructure level found that even the net savings from smaller battery requirements in battery electric vehicles could be at the same level as e-Hwy construction costs [19]. A recent American study found similar general benefits, and found that with the future emergence of certain plausible conditions, a nation-wide breakeven point between dynamic and at-home charging could be achieved at about 21% EV penetration into the general on-road fleet [20]. A review considering e-Hwy from the perspective of inductive coupled power transfer technology found that the prospects were suitably positive to warrant continued technical research on DWPT equipment and operation [12]. This study also showed that wireless power technology transfer equipment systems have been designed and integrated into roadbed construction schemes for use in winter conditions, able to withstand freezing, frost heave and moisture damage, all of which occur on the Windsor–Quebec corridor.
The general aims of the present study were to use numerical simulation methods to assess performance and power requirements of long-haul trucking as they relate to electrification. Following a similar rationale used in a feasibility study for using EVs as taxis [21], the approach here will be to develop a number of electrification scenarios to determine how to best enable electric trucks to match performance levels of present day diesel trucks. To this end, real on-road driving carried out by long haul diesel trucks whose daily driving patterns were recorded for roughly a one-month period provided reference duty cycles which were made available to the study [22]. Simulated scenarios will allow the impact of factors such as the battery pack size, the e-Hwy power provision level, and additional recharging possibilities to be evaluated in terms of how they contribute individually and collectively to electrified long-haul transport truck performance and durability. In particular, this study applies major focus on how all of these usage scenarios and operational choices impact the battery pack durability.
The present paper aims to enhance and refine an initial recent study [1] which was a first look at the subject of comparing the performance of long haul transport trucks running either as battery electric trucks (BETs) or being equipped with batteries and also receiving electricity via DWPT through infrastructure embedded in electrified roadways. It bears mentioning that a readily observable shift in focus gained traction at the 2022 35th Electric Vehicle Symposium in Oslo, in the wake of the recent 2022 European Union legislative action seeking to ban the sale of new internal combustion engine (ICE) vehicles effective in 2035 [23]. The research community was now absolved of having to continually make the case for electrified transport compared to fossil-fuel powered vehicles, and began to position itself into a new situation where the general motivations are being updated to the development and enhancement of the best modalities for electrified transport.
A fairly extensive summary of our intra-cycle approach to developing a multi-factor capacity fade model, which would reflect the nuanced results from many simultaneous impinging factors, was presented recently in [24]. Over time, understanding has emerged that operational factors including temperature, state of charge (SOC), current level, current direction and duration of operational modality all influence the degradation rate of a lithium-ion battery. Beyond operational factors, the details of the cell chemistry, construction and electrode morphology also impact cell degradation rates. Given that automotive applications result in highly irregular battery usage patterns [21], it has become clear over time that the most accurate and meaningful way of tracking operational cell capacity loss requires a model where the impacting factors are applied repeatedly over very short time steps which reflect the instantaneous state of the battery. Such an approach is taken for this study.
After this Introduction, the rest of the paper is organized in the following manner. Section 2 discusses the simulation test aims for electric heavy-duty long-haul trucks, the characterization of the simulated vehicle, the driving route and driving environment, and the approaches to making use of detailed on-road driving data. Section 3 presents the scope of usage scenarios to be simulated and their rationale for providing valuable results. Section 4 begins with reference results on the performance and durability of battery-only trucks, and then goes on to compare these results with those from simulations carried out over e-Hwys. Several input parameters were tested and assessed, and analysis and interpretation of these results was performed to provide further insight. Finally, the study is summarized with key findings highlighted in the conclusions.

2. Simulation Environment
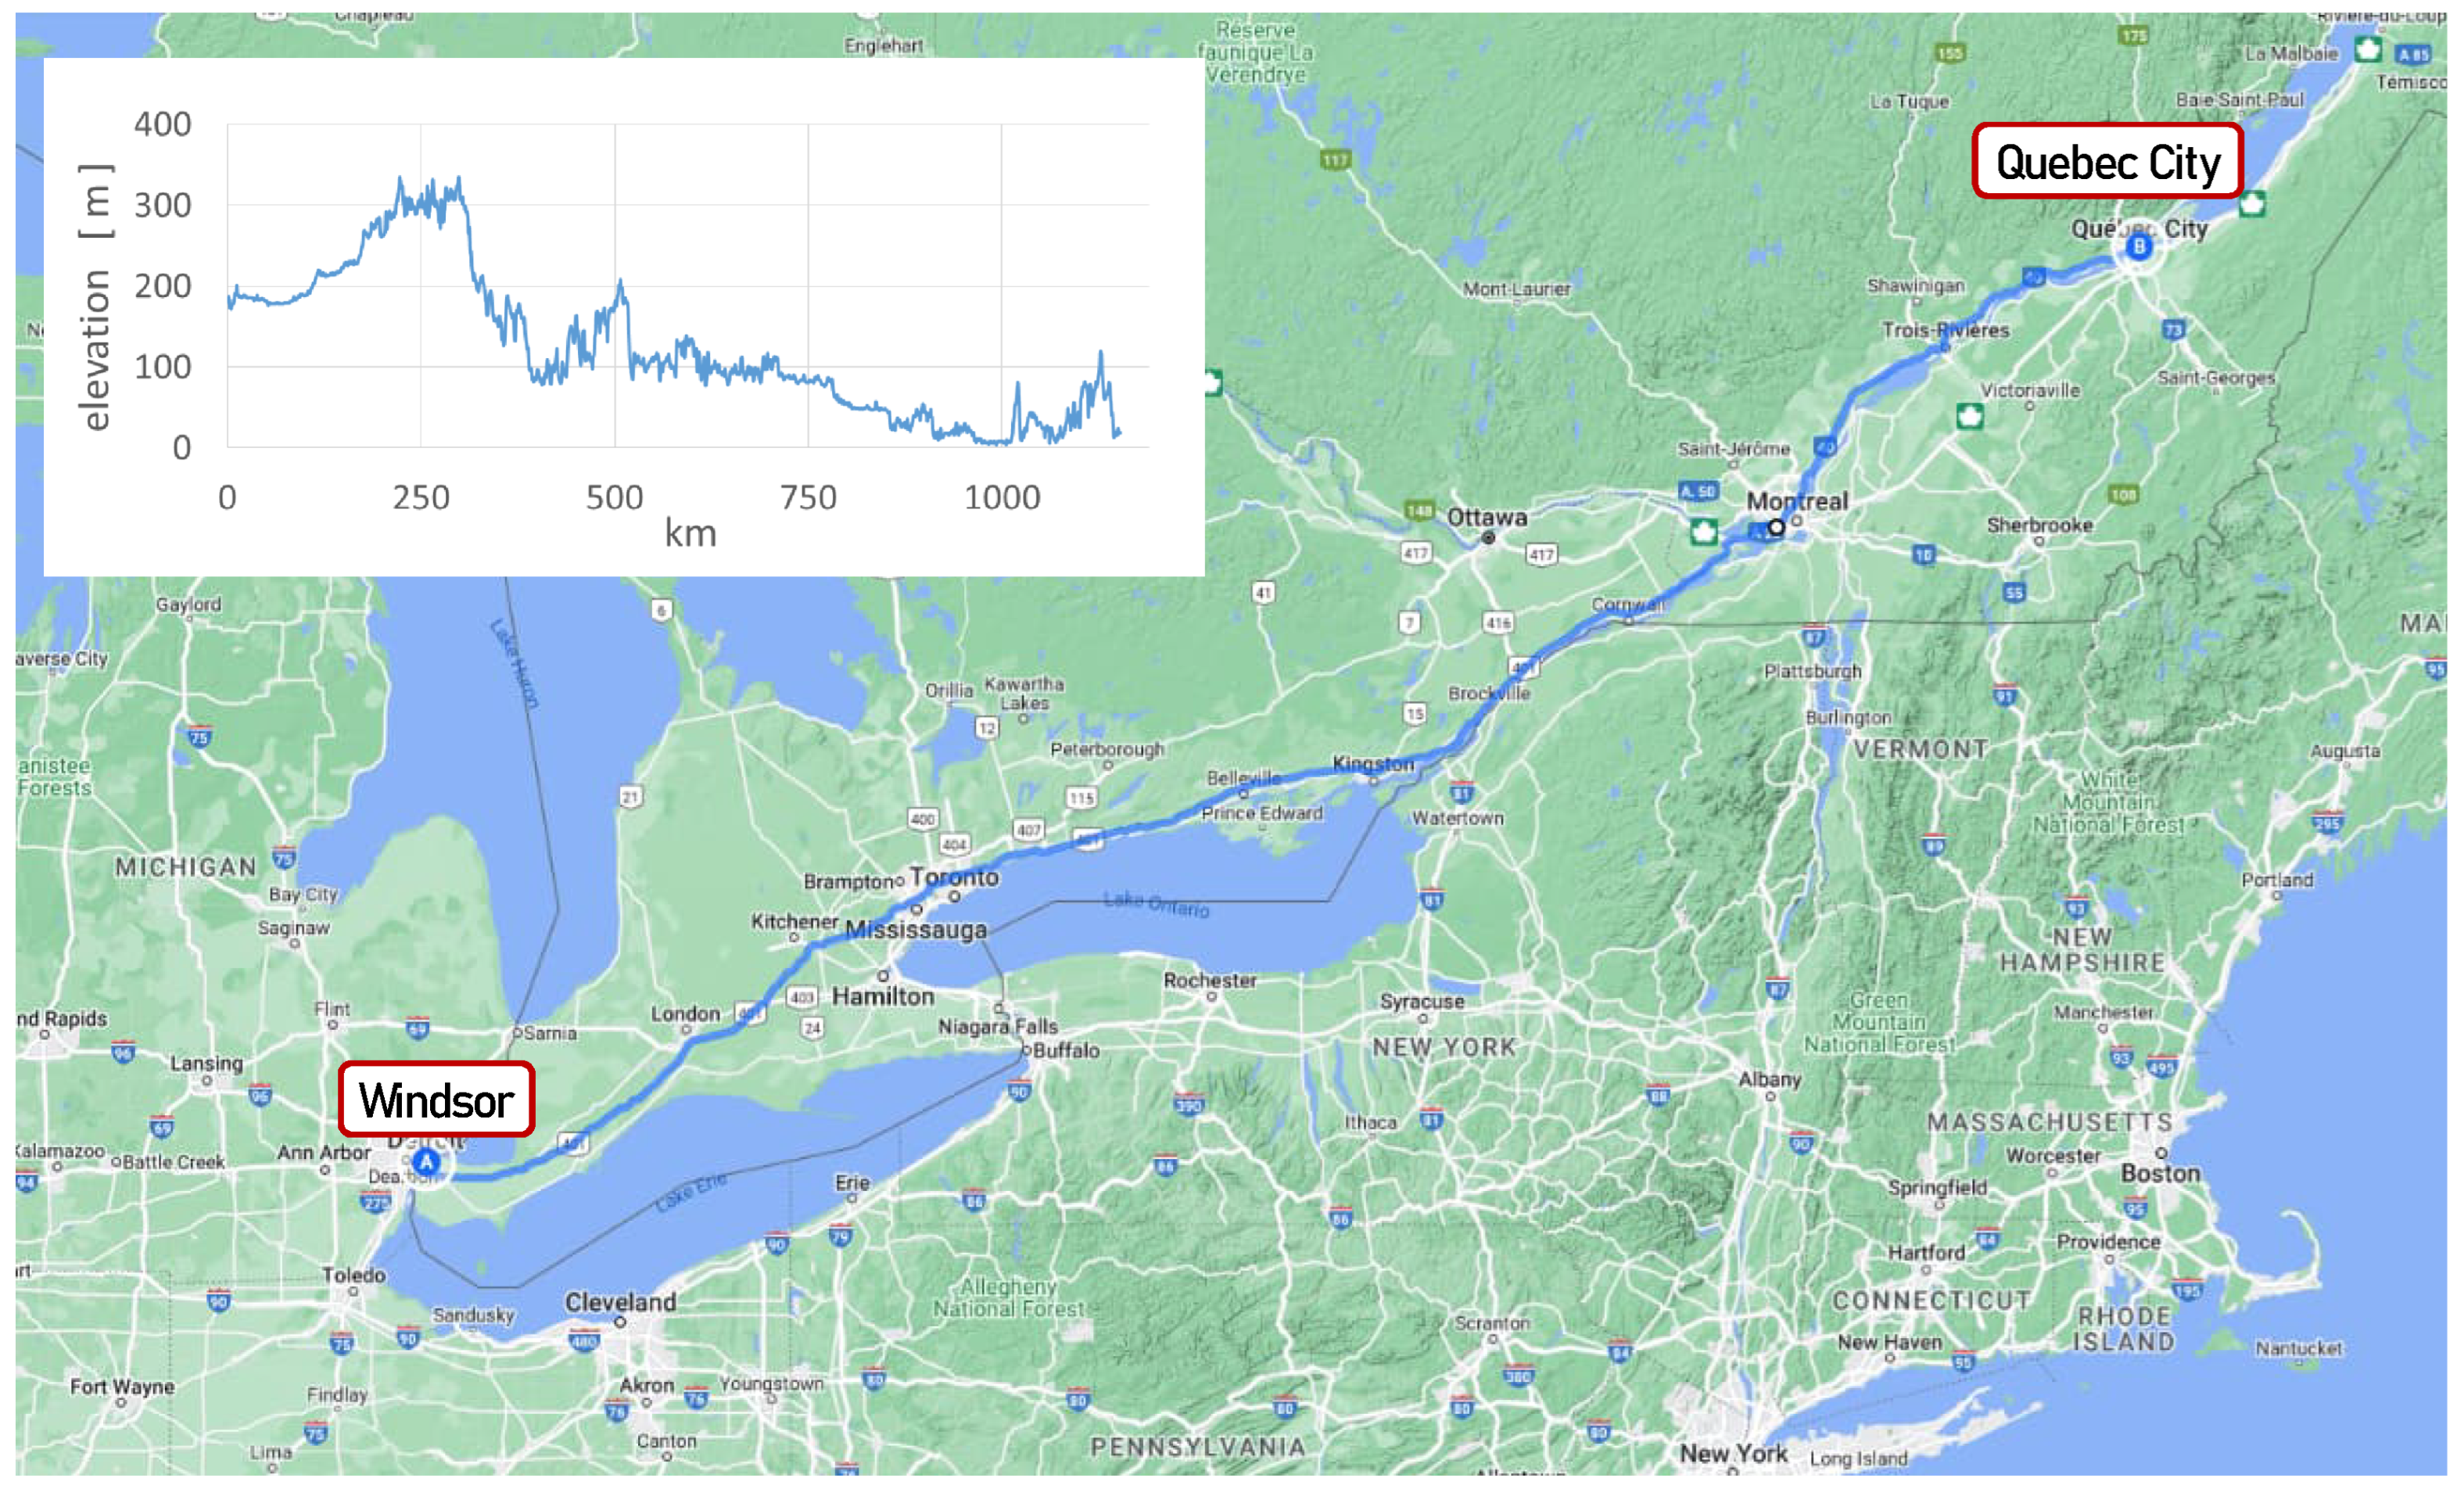
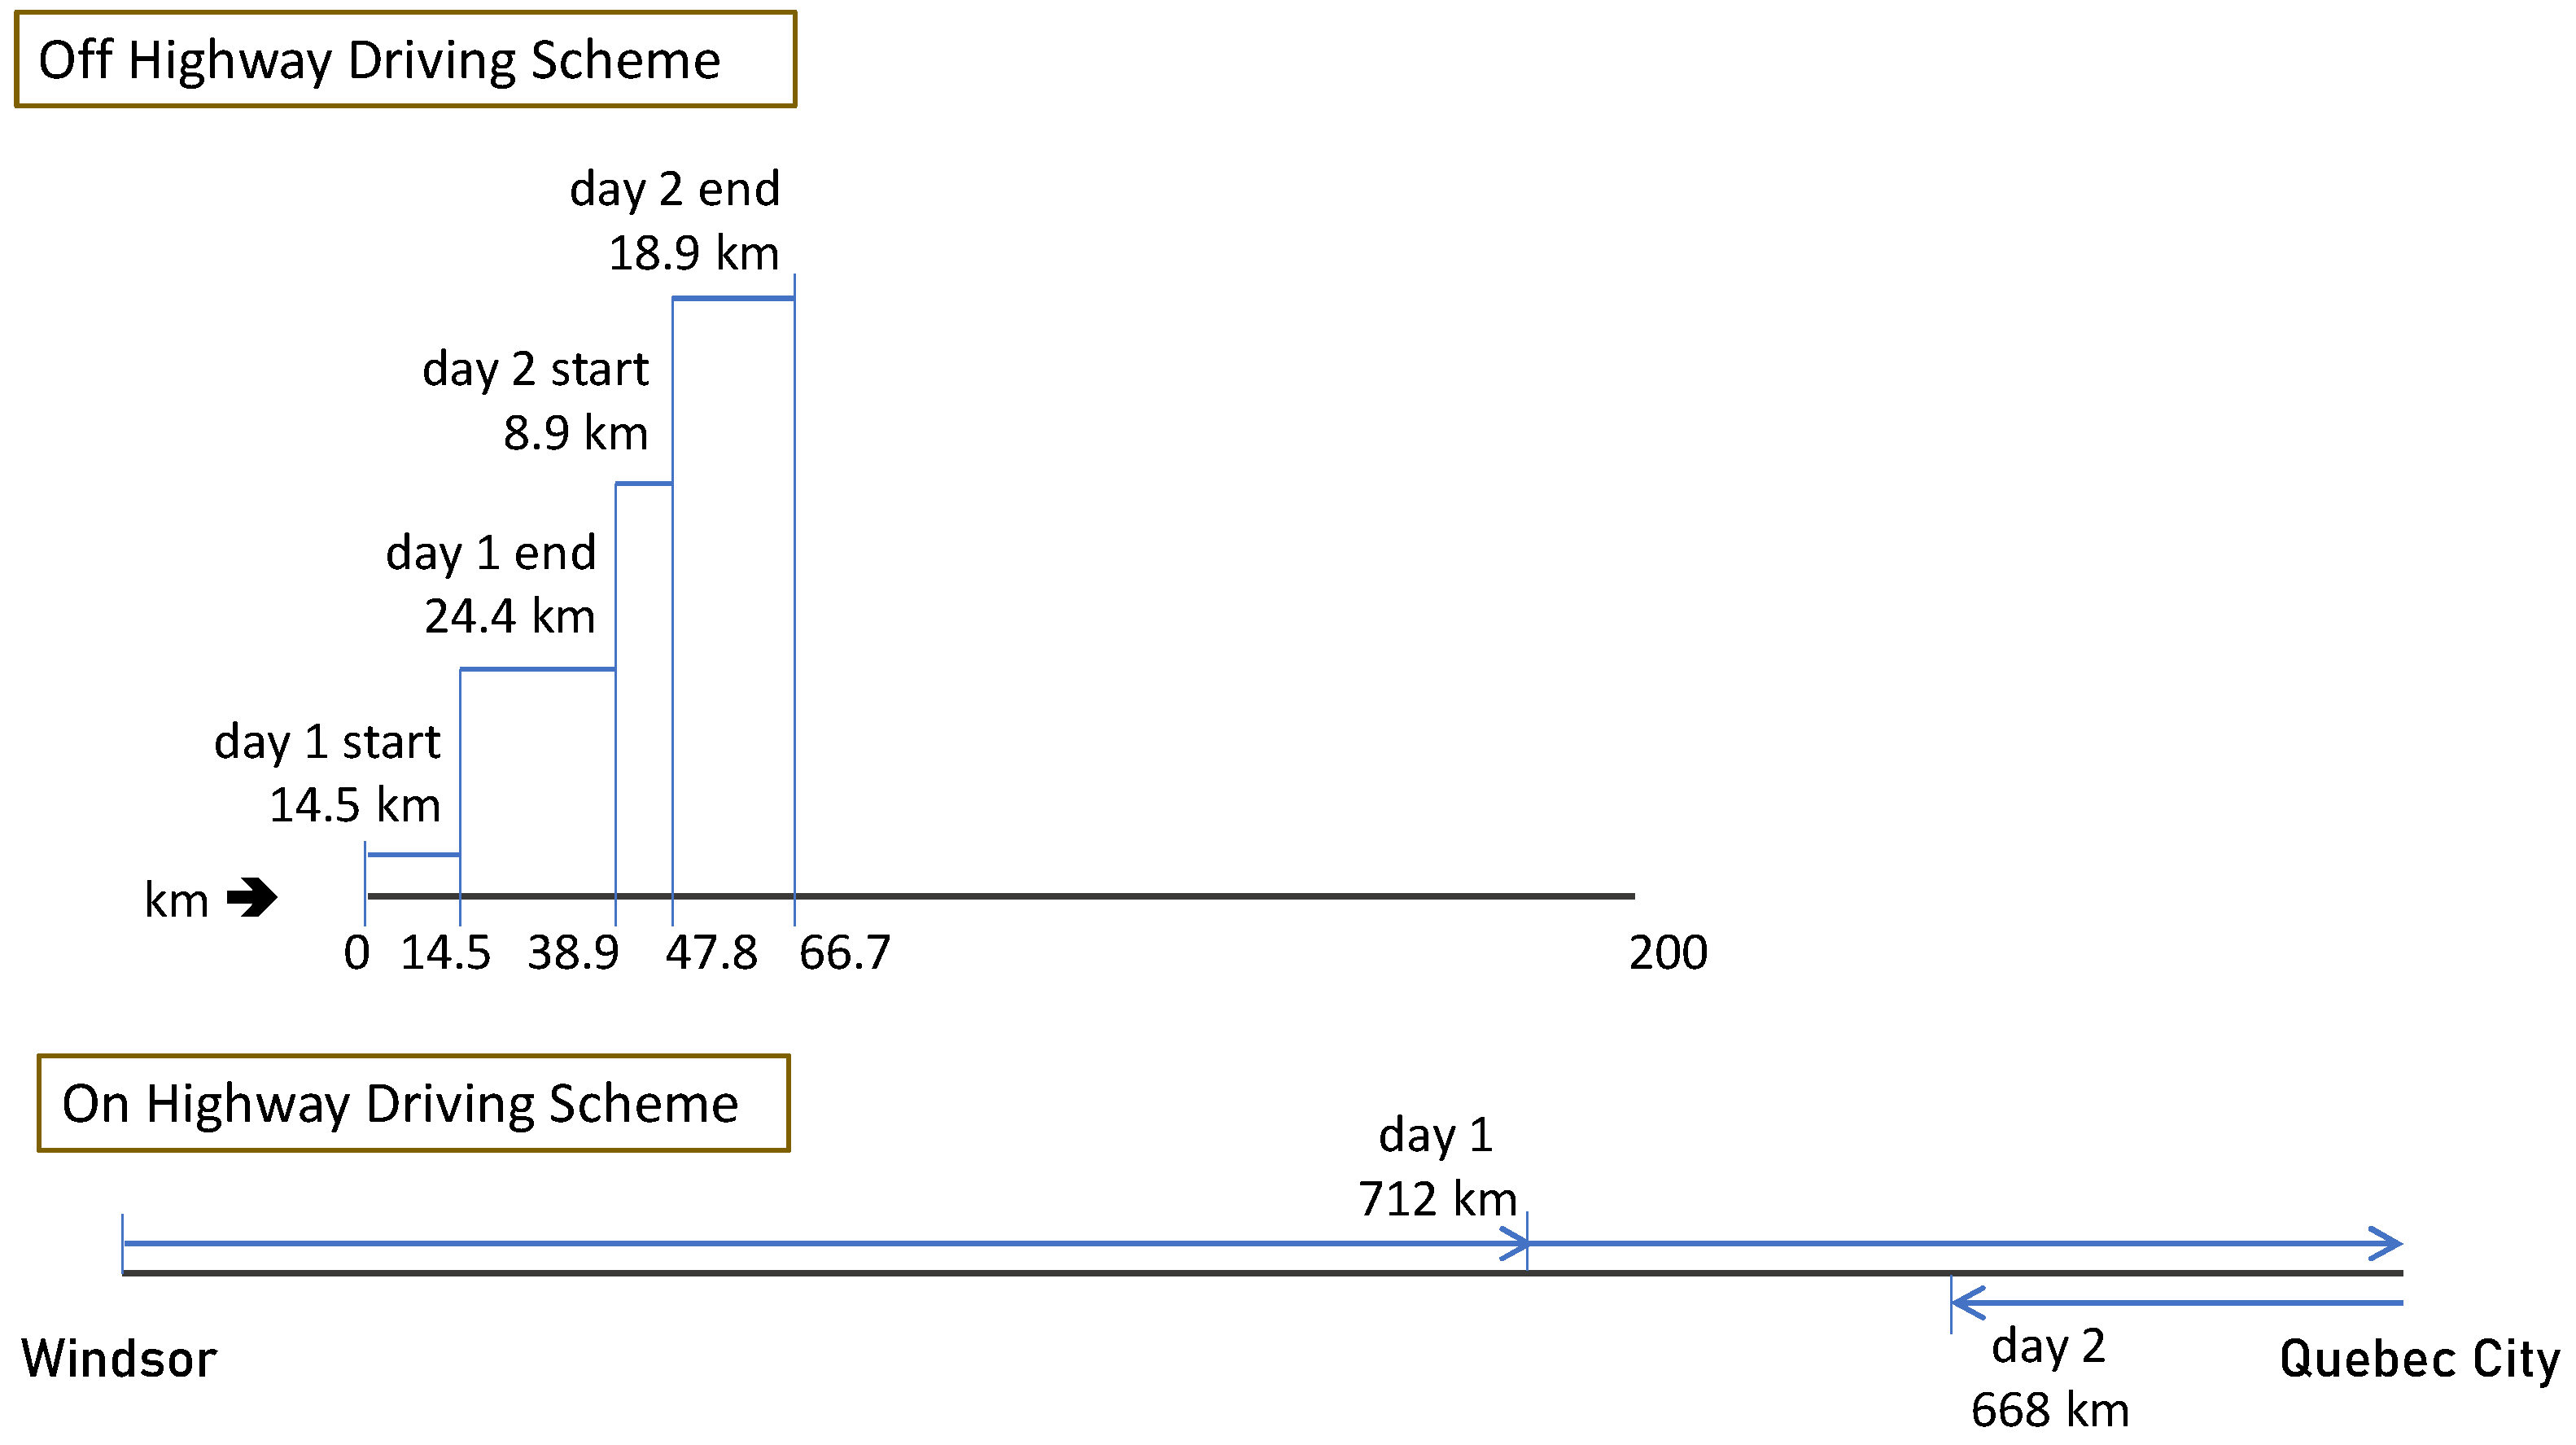
The subject of this study was to investigate the effect of various usage scenarios and equipment characteristics on the service lifetime of electric long-haul heavy-duty transport trucks.
The trucks simulated were all equipped with battery packs. To make a distinction for the purposes of this study, electric trucks that ran only with battery power and relied on off-road high power (1.0 MW) recharging will be referred to as battery electric trucks (BETs), while trucks getting electric power via DWPT embedded in roadways will be referred to as e-Hwy trucks (EHTs), or generically referred to here as e-trucks. The main interest was to compare the performance and durability of BETs and EHTs, to assess both the suitability of their battery packs, as well as to provide technically sound information to enable future work to properly assess the value and feasibility of constructing roadways equipped with DWPT as an alternative to megawatt level charging stations.

2.1. Driving Route

The electric truck simulations were made on the Windsor to Quebec City Canadian transport corridor, a 1152 km route. The section of this route between Toronto and Montreal in Canada is one of the busiest highways in North America. A total of about 8000 trucks use it in either direction on a daily basis to transport goods [25]. Topographical elevations at 500 m intervals for the route were obtained from Google Earth [26], and outdoor conditions along this route were given by hourly temperature data published by Environment Canada [27] for the year 2020. On the highway, the nominal speed limits were 100 km/h, and typically, fast traffic on such roads will drive at slightly higher speeds. The trucks followed high-resolution one second driving speed real-life on-road data sets provided by NESCAUM (Northeast States for Coordinated Air Use Management) for their daily driving duties [22]. Daily distances ranged from 275 to 850 km per day.
The simulation had the trucks going continuously back and forth between Windsor and Quebec City. If a truck happened to reach one end of the Windsor–Quebec City route part way through its daily driving duty, the simulation had the truck immediately turn around and continue the trip in the opposite direction. A map showing this route is provided in Figure 1, which follows Highway 401 in the province of Ontario, and continues on as Autoroutes 20 and 40 in the province of Quebec. The inset in Figure 1 shows the elevation profile of the route going from Windsor to Quebec City.
The daily driving was considered to take place in various segments, and can be classed in two main parts, being highway driving and off-highway driving. The route data for the off-highway portions of the simulated driving were based on a separate 200 km section of secondary highway located around London, Ontario, which included elevation profiles also taken from Google Earth. Off-highway driving segments were looped over the off-highway route as per the off-highway segment distance required. When off-highway driving transitioned to on-highway, it resumed at the same position as the end of the previous day’s on-highway driving. How the daily driving demands were imposed on the virtual road system is shown in Figure 2, where off highway driving at the start and end of each day’s driving trip moves it along the virtual 200 km off-highway road, and on-highway driving moves it along the virtual principal highway depicted in Figure 1. When the 200 km virtual off-highway distance is completed, the truck continues its trip at the 0 km point, while for the on-highway driving, the tracked position loops back and forth between Windsor and Quebec, as shown.
The goal of the simulation was to estimate vehicle battery pack lifetime, which in Canada requires consideration of seasonal weather effects. Weather data provided ambient outdoor temperatures which were superimposed as a function of location along the highway, as well as calendar date and time of day. Hourly temperatures for the calendar year 2020 were tabulated for the cities of Windsor, Toronto, Kingston, Montreal and Quebec City. For points along the route within 100 km of a city, temperature data were used from that city, and points between were interpolated using data from bounding cities. Figure 3 shows the annual temperature data for the cities of Windsor at the extreme southwest of the route, Kingston which was roughly mid-way along the route, and Quebec City at the extreme northeast of the route, to show the thermal environment in which these simulations took place.

2.2. Electric Truck Technical Specifications

The electric truck used in the simulation was modeled on the Tesla Semi [28]. The Tesla Semi is specified to have a 947 kWh battery pack composed of only just recently available 4680 format cylindrical cells with an anticipated 800 km driving range. For the daily trips prescribed by the data with distances in the 275 to 850 km range, it was desired to have an e-truck with sufficient driving range to be able to complete the daily duty cycles over its lifetime (i.e., with decreasing battery capacity down to 60% of the original capacity) without requiring excessive mid-trip recharging. For this study, the battery pack that was used in the 2016 Tesla Model S was used as a base unit for building an e-truck pack. In the simulated e-trucks, cell banks of 3.07 Ah cells were configured in a 74-parallel and 84-series arrangement. These smaller cells were substituted for the 4680 cells, since technical specifications for the 4860 cells were not available. For our simulations, packs were simulated in quantities ranging from 8-banks up to 24 banks (534 to 1600 kWh) to power the truck. The 84-series specification was required for floor level 240 V operation.
The weight of the truck was set as 36 tonnes, the normal maximum allowable weight on North American highways [29]. The weights of the batteries were not explicitly treated in these simulations. Larger battery packs would logically be heavier, and this would come at the expense of reduced cargo loads. In this study, the trucks were simply specified as 36 tonnes in the simulations, total weight. The reduction in cargo with larger battery packs is a parameter that will impact any subsequent economic analyses considering revenues from cargo hauling.

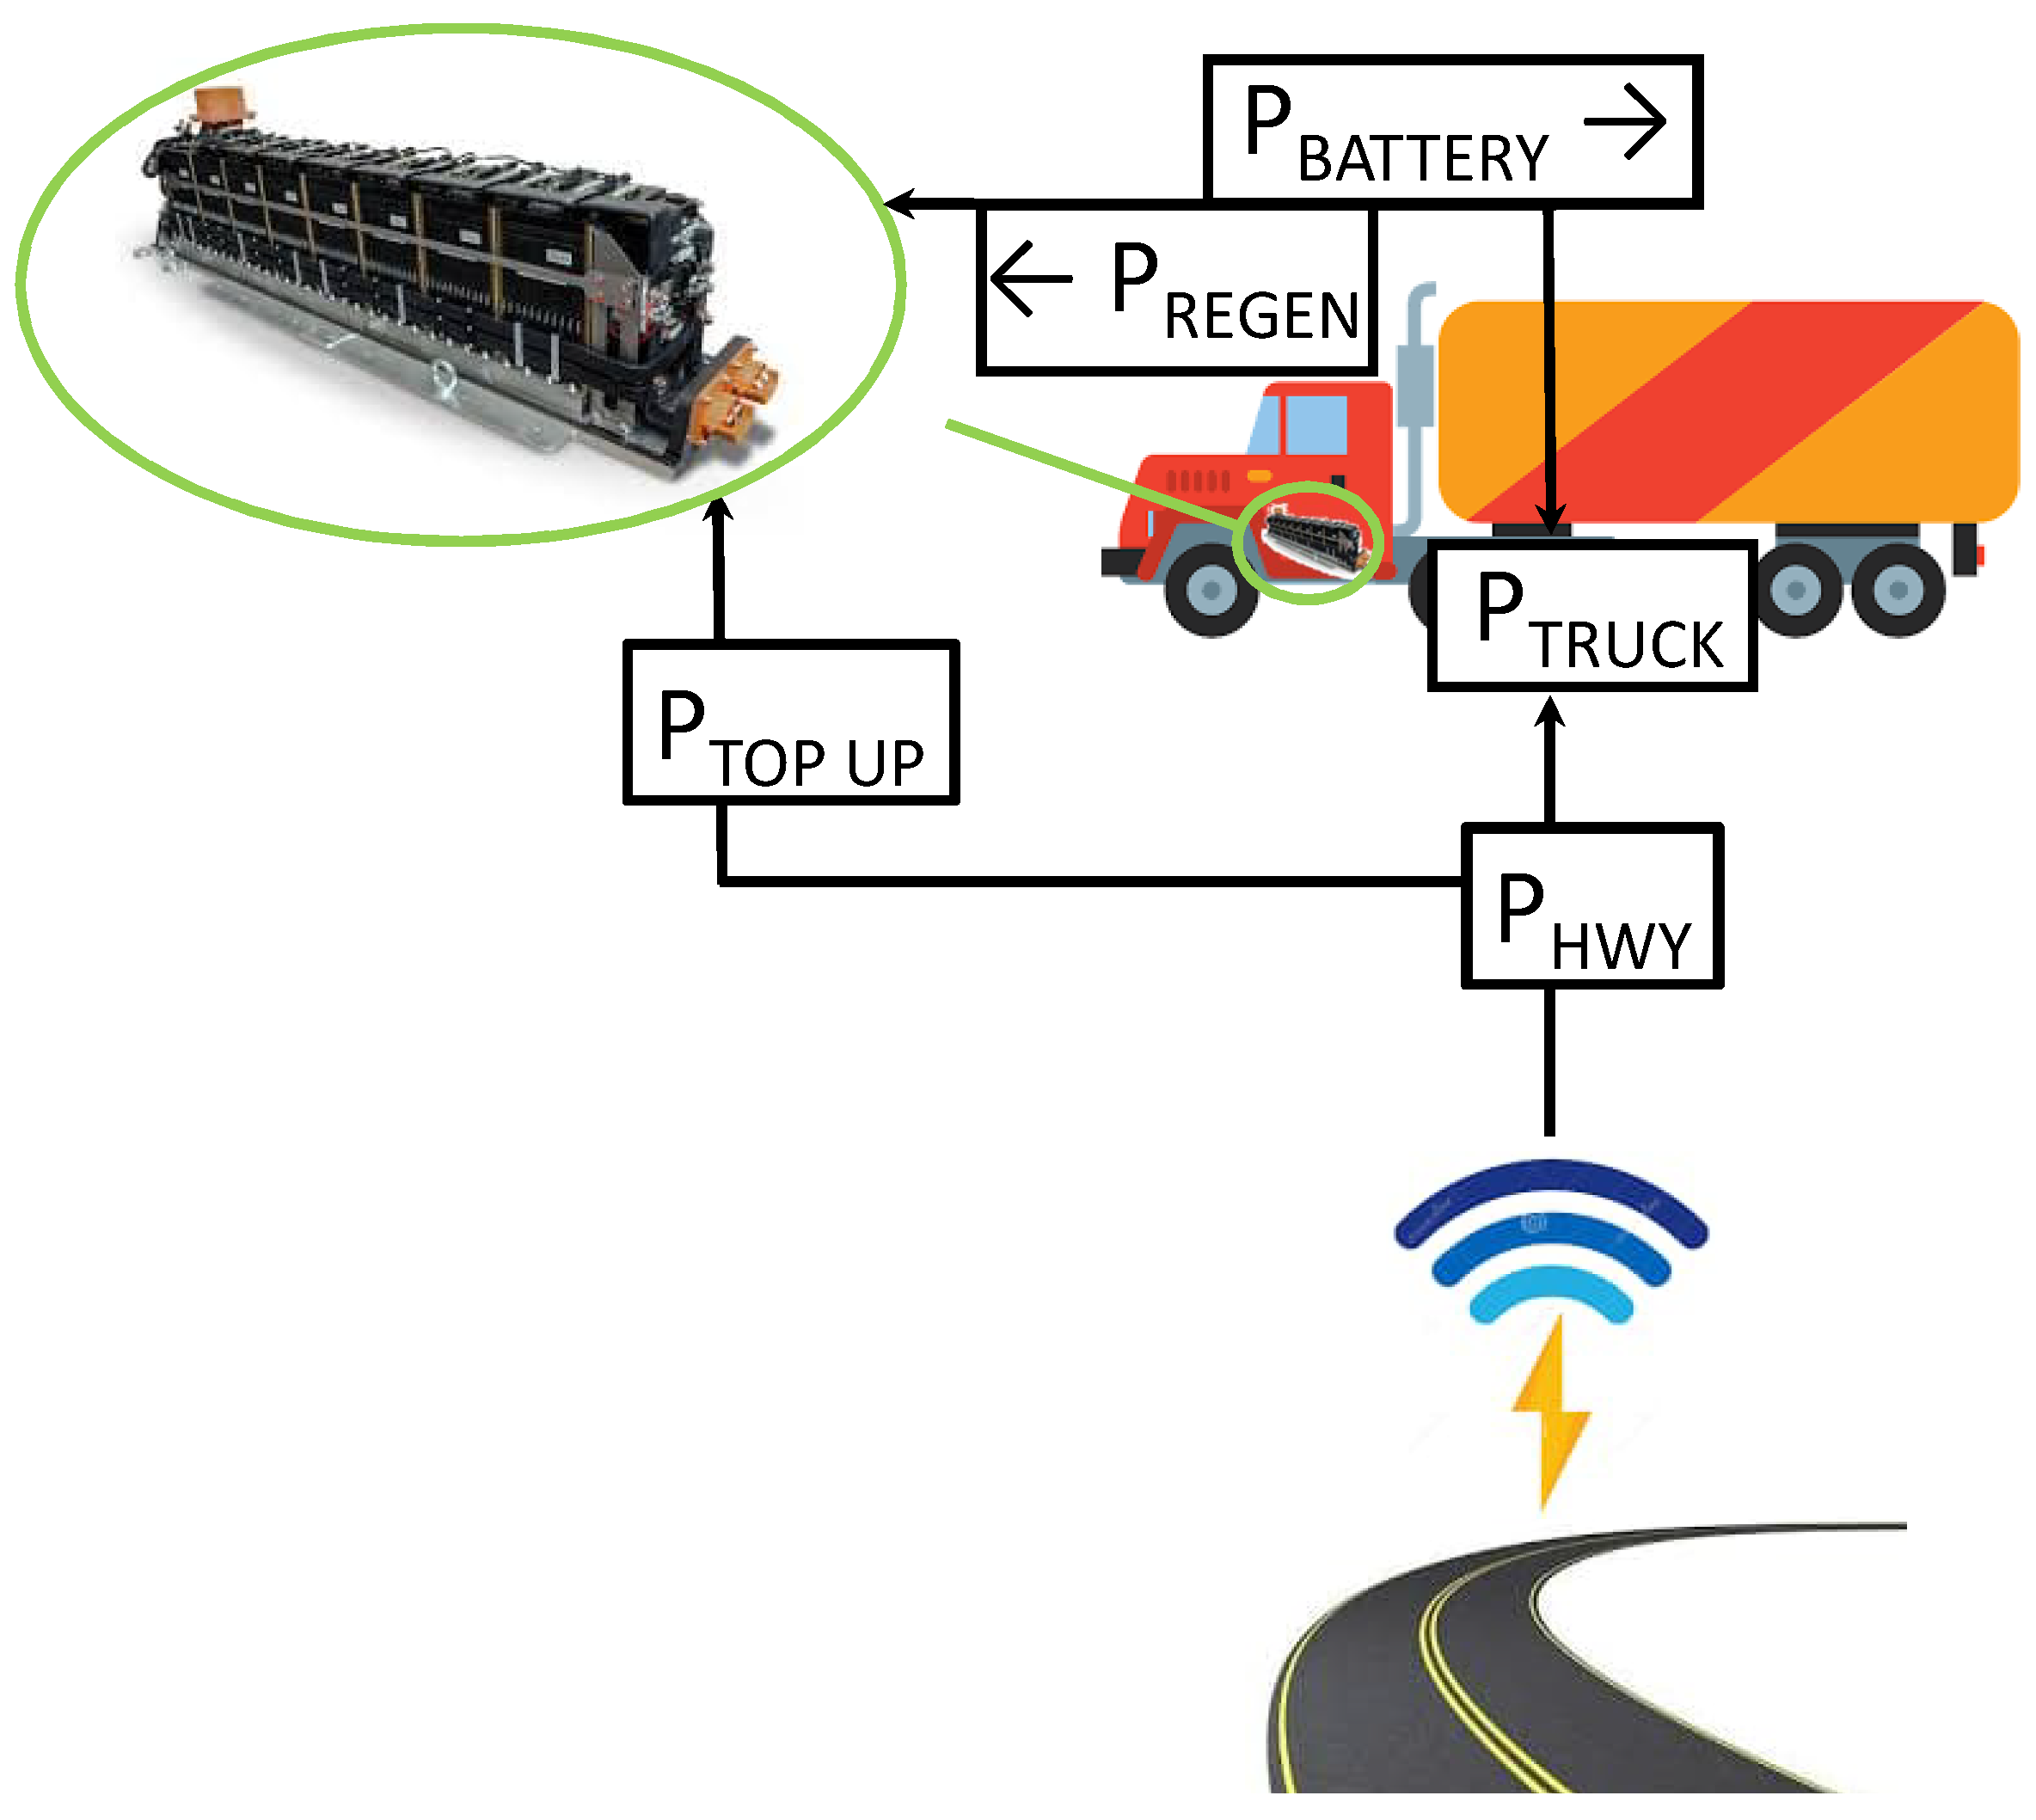
2.3. Truck and Battery Power Load Model

Truck power loads were determined by applying driving conditions in effect for short time steps to an expression from [30] given below.
P truck = ( μ r + sin α ) M g v ( t ) η eq + C d A v ( t ) 3 ρ 2 η eq + δ M a ( t ) v ( t ) η eq = η eff · I V
The terms in Equation (1) account for rolling resistance, elevation change, form drag and acceleration effects. The current demand for the battery can then be determined by the equivalence of P truck to η eff · I V , where η eff is the electric power transfer efficiency to the truck motor and I would be the current required from the battery pack at potential V. The simulation runs also employed some basic control logic, akin to the battery management system (BMS) found in an electric vehicle. In this case, the cell voltage range was restricted between 4.05 and 2.9 V. For the BET cases, the battery pack was fully charged to begin each driving trip.
The power flow dynamics inside the EHT are depicted below in the schematic diagram Figure 4.
The EHT power demand P truck is served by power provided by the e-Hwy P hwy , and supplemented by P battery if required. If P hwy was in excess of P truck , the excess power available was provided to the battery pack if the DOD (Depth of Discharge) was greater than 0.50 or some other specified value, and referred to as P top up . During some descents, regenerative braking power is sometimes generated, and would be supplied to the battery pack, referred to as P regen . The value of the parameter η eq used in Equation (1) was set at 0.81 for instances of regenerative braking, compared to its usual value of 0.84 used elsewhere in the simulations [30].
The electrified roadway itself was represented very simply in the simulations. Only the major highway portion of any trip could be electrified. When DWPT was available, it was assumed to supply power to the EHT at a specified level ranging from 100 to 500 kW, with the EHT having a power uptake efficiency of 85% [1]. Recent projects considering wireless power transfer are now reporting uptake efficiencies consistently upwards of 90% [31], so if anything, the 85% used here is a conservative parameter specification. The electrified roadways provide power at the prescribed level to all road traffic connected to its powering system, generally independent of traffic density. e-Hwy systems are designed to ensure that power provided by the electricity grid is stable, such that all traffic can be powered at the desired level [3].
The EHT power model, as well as simpler BET cases, were then linked to an equivalent circuit model for battery operation [21]. Thermal states were tracked using an empirical transient model for the battery packs which also accounted for ambient temperatures and battery function [32]. Battery electrochemical and thermal states then were applied to a capacity loss model to track cell State of Health (SOH). Batteries were assumed to have reached their end of life when their SOH was reduced to 60%. For the sake of brevity, electrochemical and thermal equations are not given here, but are detailed in [1].

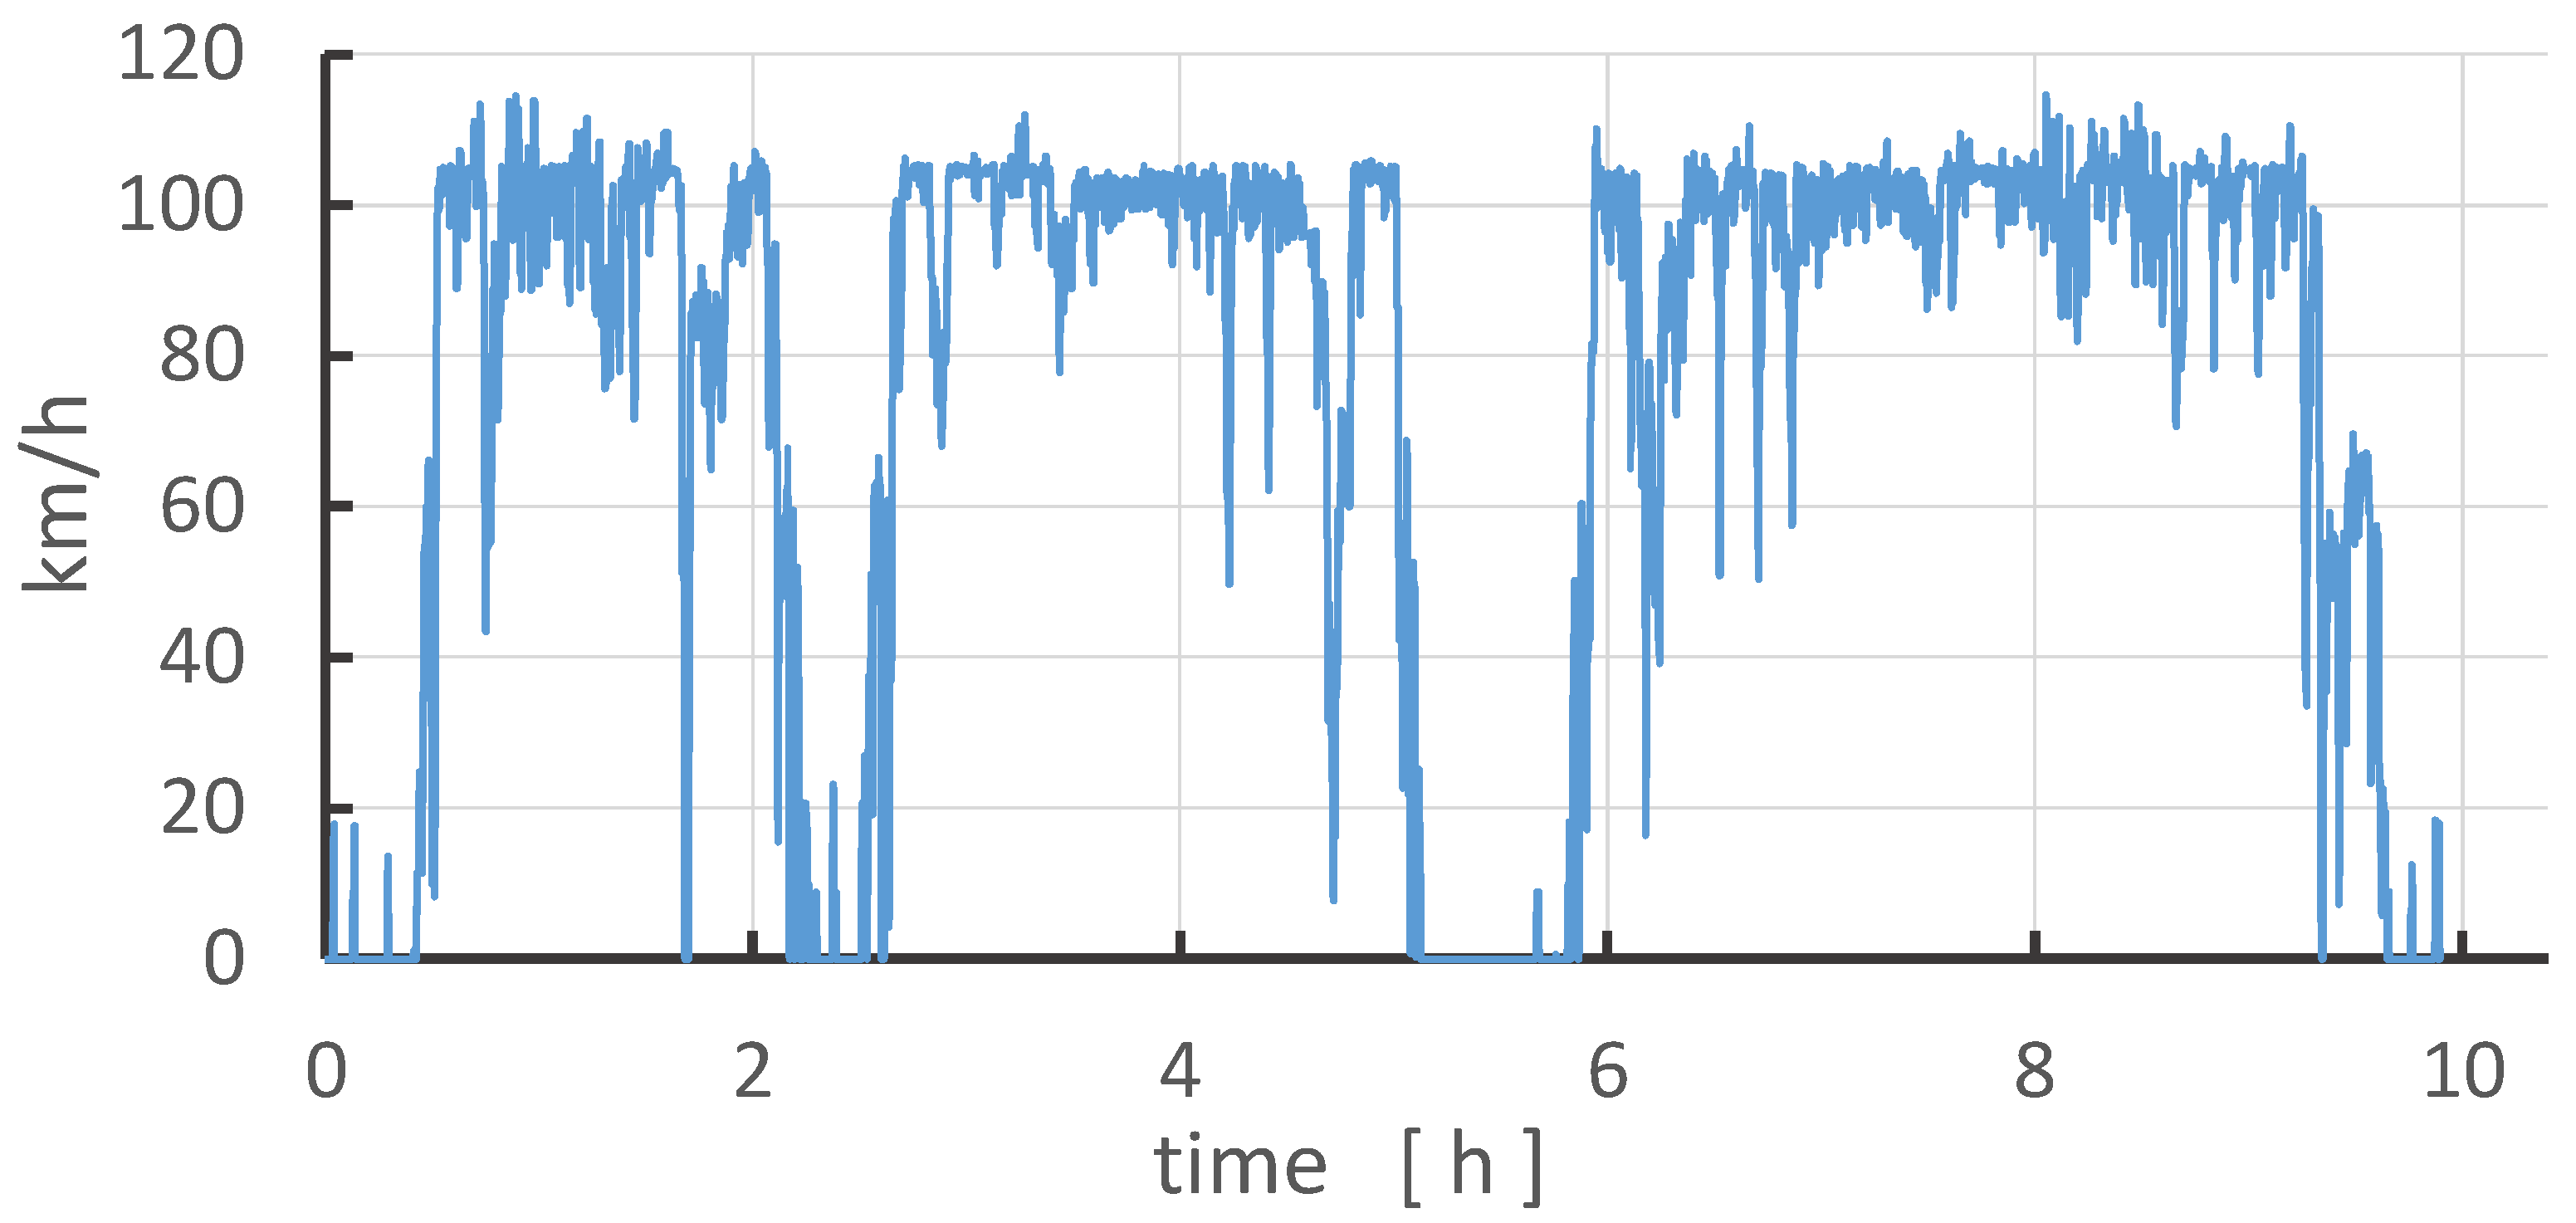
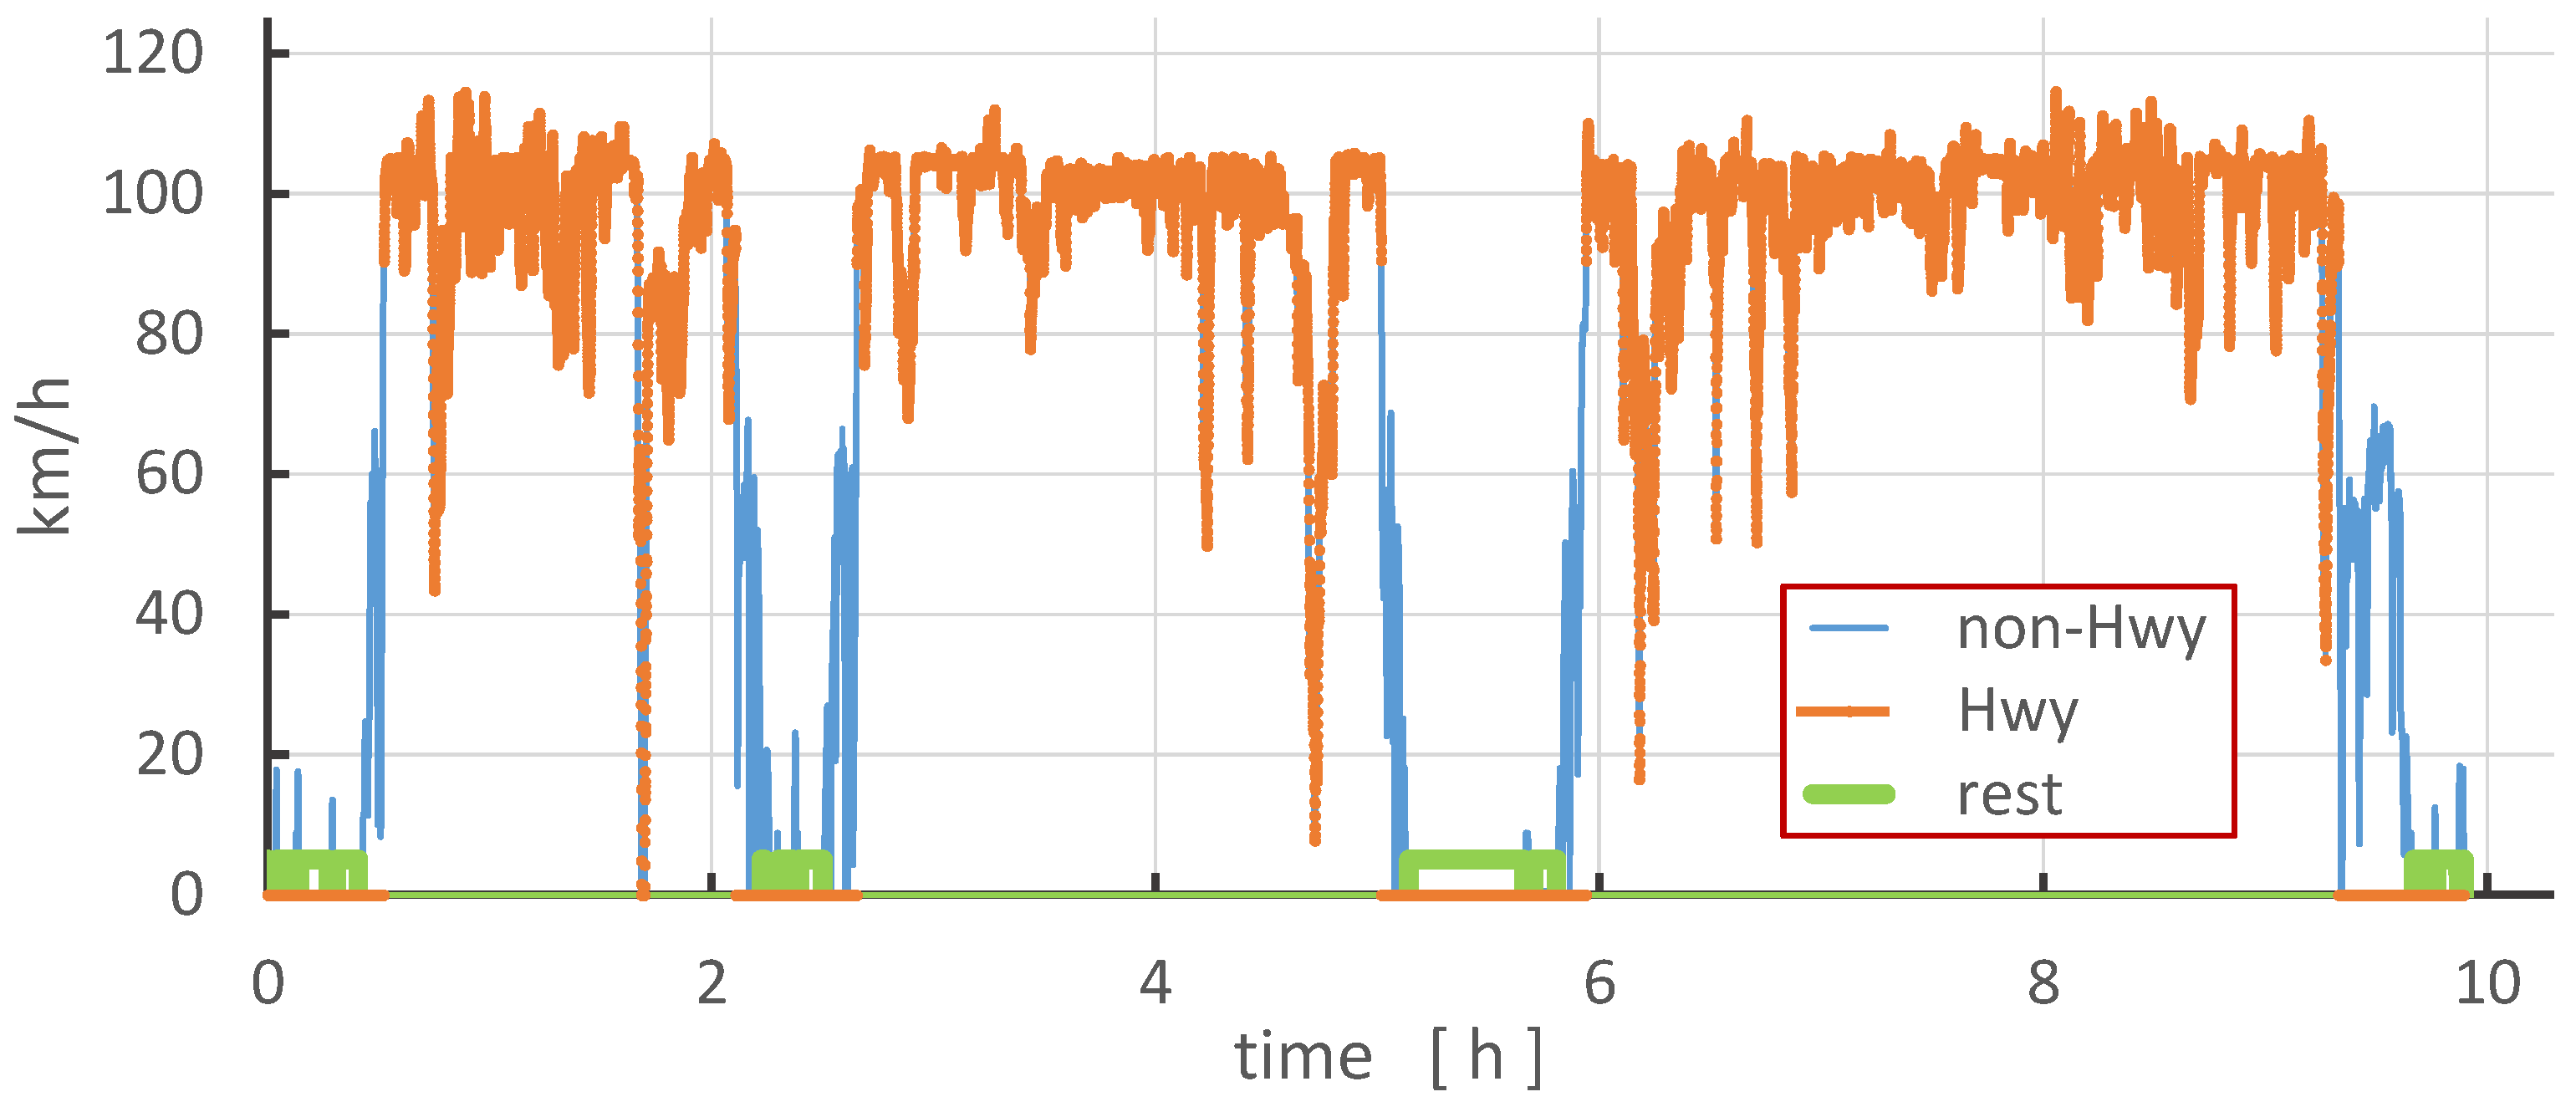
2.4. Characterization of Long-Haul Truck Driving

Raw data were provided by NESCAUM which is a nonprofit association of air quality agencies in the northeastern US that collected data on class-8 long-haul trucks for a study on their environmental impact [22]. This study was of great value here since it provided detailed one-second resolution driving speed profiles for five different trucks over about a one-month period of time. The data were also summarized to give a set of daily statistics such as duration of trip, trip distance, average speed, engine idle time and engine rest time.
On-road test data were collected between February and August 2020 from five different class 8 trucks using an HEM logger [33] attached to the J1939 port on each truck. The loggers were set to collect data whenever an engine RPM signal was detected, thus, whenever the truck engine was running. The collected raw data were then post-processed using DawnEdit2 software designed for use with the HEM logger and extracted to data files. Data were taken in time steps of one second. The end of a driving day was considered to be the last key-on event prior to a break of several hours or more. Breaks up to about 2 h were included in the test and did not signify the end of a trip, while longer breaks were interpreted as the end point of a day’s driving operation.

2.5. Duty Cycles from Detailed Day-by-Day On-Road Long Haul Truck Data

Figure 5 shows the one second resolution speed profile from day 1 of the truck number 490 data set. The five trucks in the data set were identified by numbers: 490, 530, 565, 568 and 583. These identifier numbers were used throughout this study.
For these raw data-based duty cycles, three operational regimes were identified: rest periods, highway driving and non-highway driving. From the detailed data provided, it was elementary to identify rest periods. Data entries where road speed and engine rev values were both zero were set as rest steps. Some interpretation was required to distinguish highway steps from non-highway steps for times when the truck was in motion. An initial criterion was that any driving speed above 90 km/h could be considered as highway driving. This criterion alone allowed for brief momentary slowdowns to get classed as non-highway. An additional condition was to then identify the durations of these slowdowns. Based on the profile context, usually by visual inspection, an adjustable threshold value ranging from 400 to 700 s was set allow slowdowns shorter than the threshold value to be included with the highway driving. The results of this data conditioning exercise as applied to the same data as shown in Figure 5 are shown in Figure 6.
For use in the simulation, the periods identified as e-Hwy in Figure 6 are set as steps where DWPT is available, and the geographical position along the Windsor–Quebec corridor will advance. For steps classed as non-e-Hwy, no DWPT would be available, the geographical position remains localized at its point along the main corridor, and movement is tracked along a 200 km long loop of transient phase secondary road. For steps classed as rest, the simulation can include mid-trip recharging operations according to scenario parameters in effect for the particular simulation case.

3. Simulation Cases—Study Scope

From the simulation context presented above, the following chart (Table 1) summarizes the scope of the study undertaken here, and shows the various independent parameter values input to a wide range of simulation cases.
The cases for the BET driving on a standard highway served as reference cases for other operational details or functionalities considered, and provided a basis for comparing and evaluating transport truck scenarios driving on e-Hwys. The recharging provided to BETs was at a power of 1.0 MW. The recharging operations were carried out with in a constant power constant voltage manner, not exceeding top end value of 4.05 V until the current dropped below 10.0 kW, or 1% of the nominal level.

4. Results

A very extensive set of simulation results were generated in this project, and results presented below were selected to highlight the effects of the input variables applied for both BET and EHT service lifetimes, as well as the effects of the daily driving profile basis chosen.

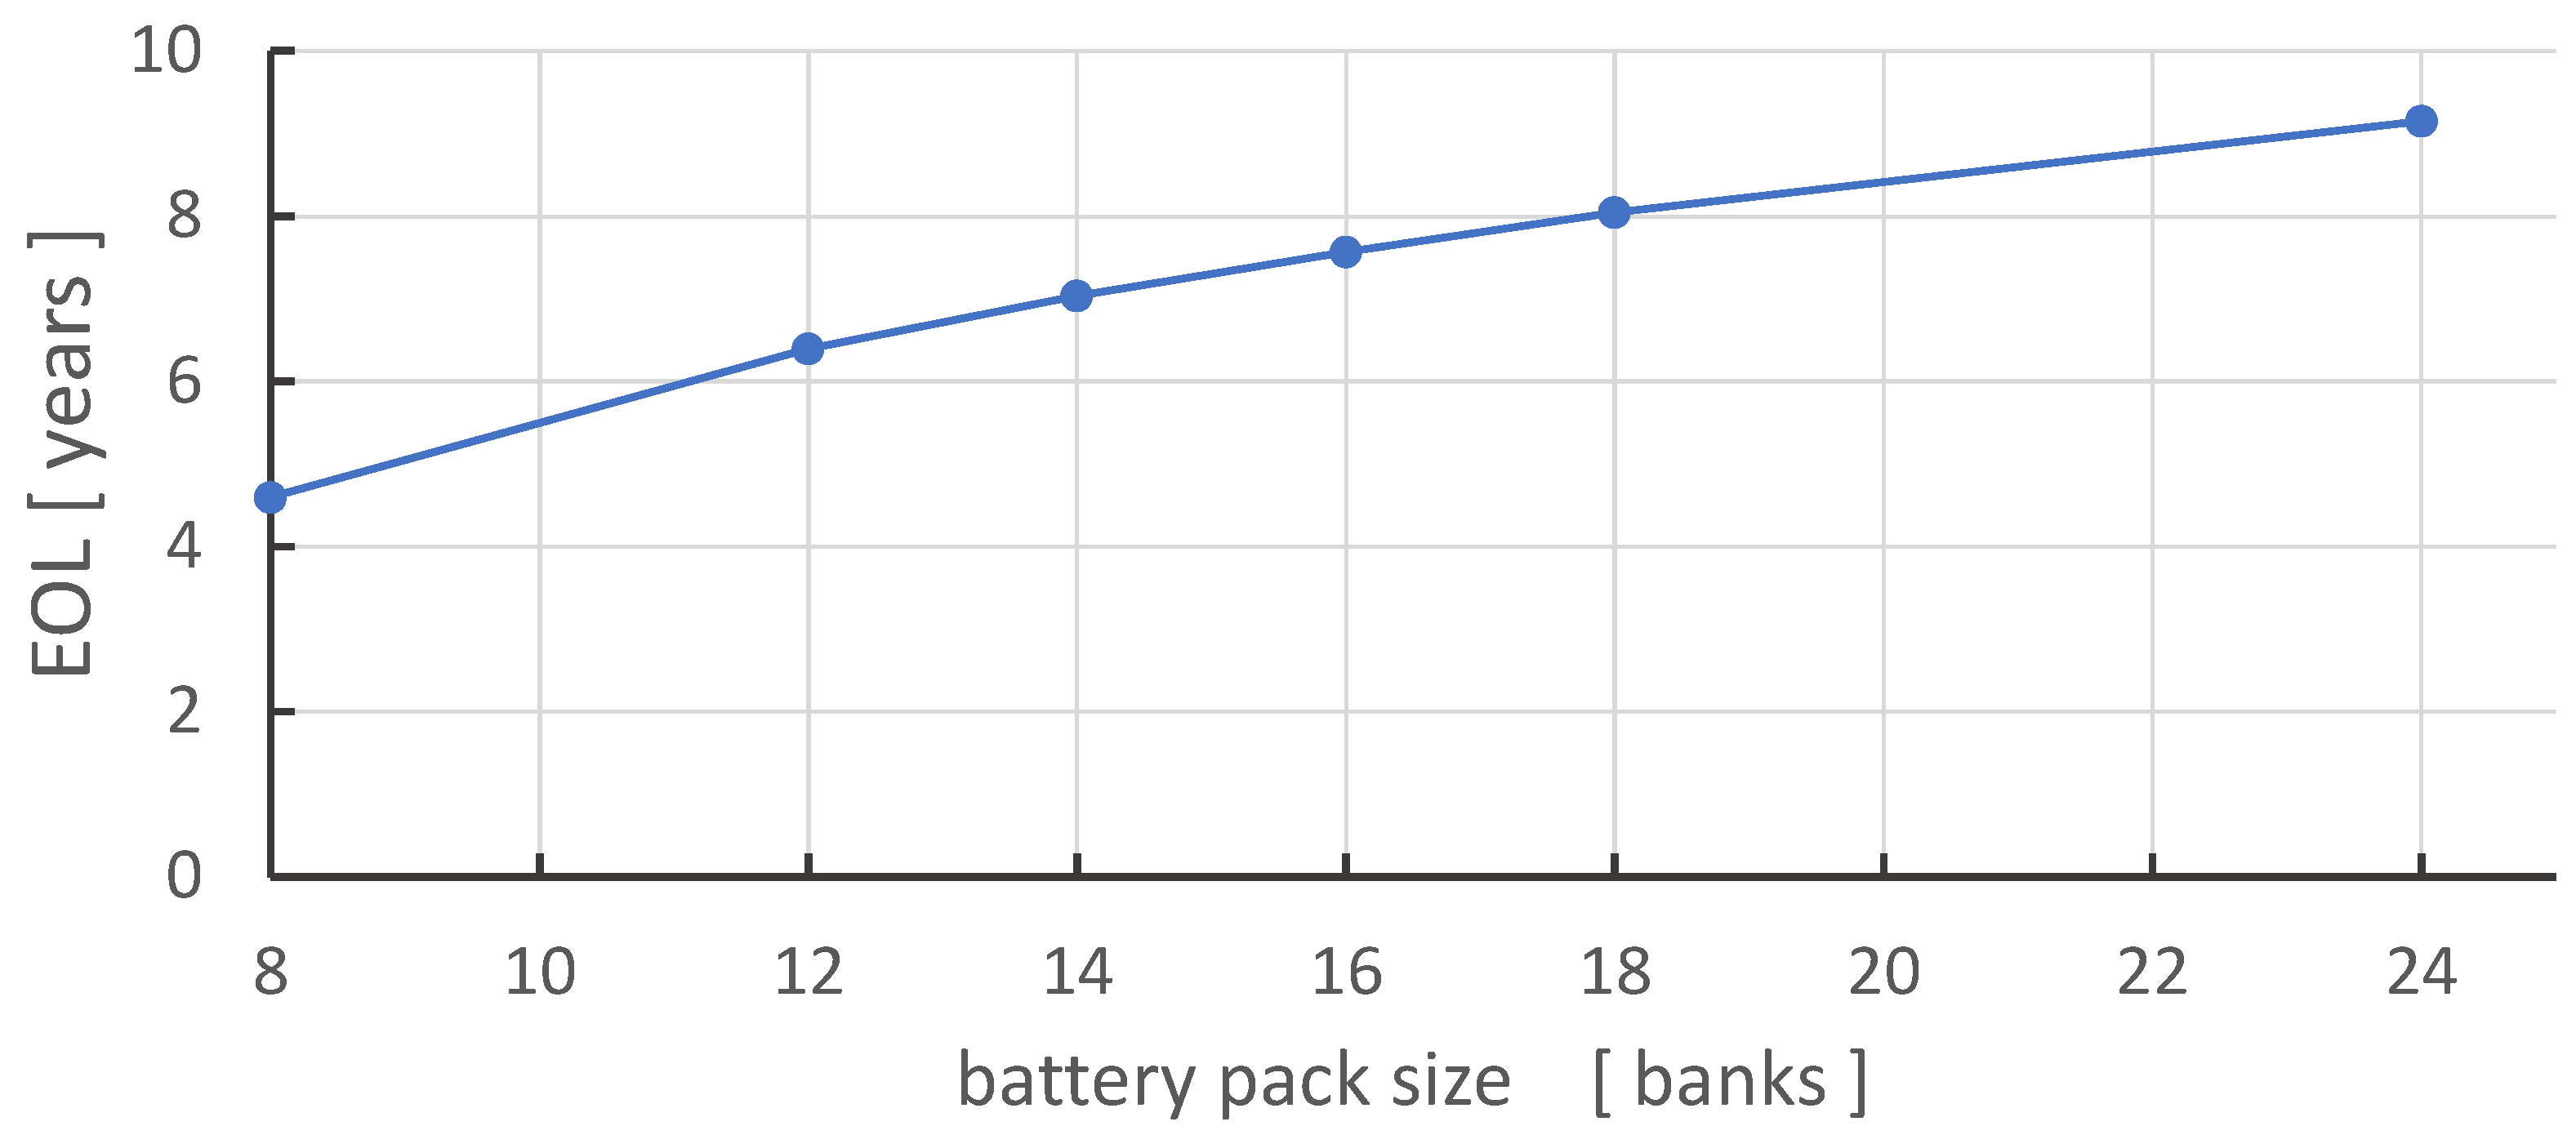
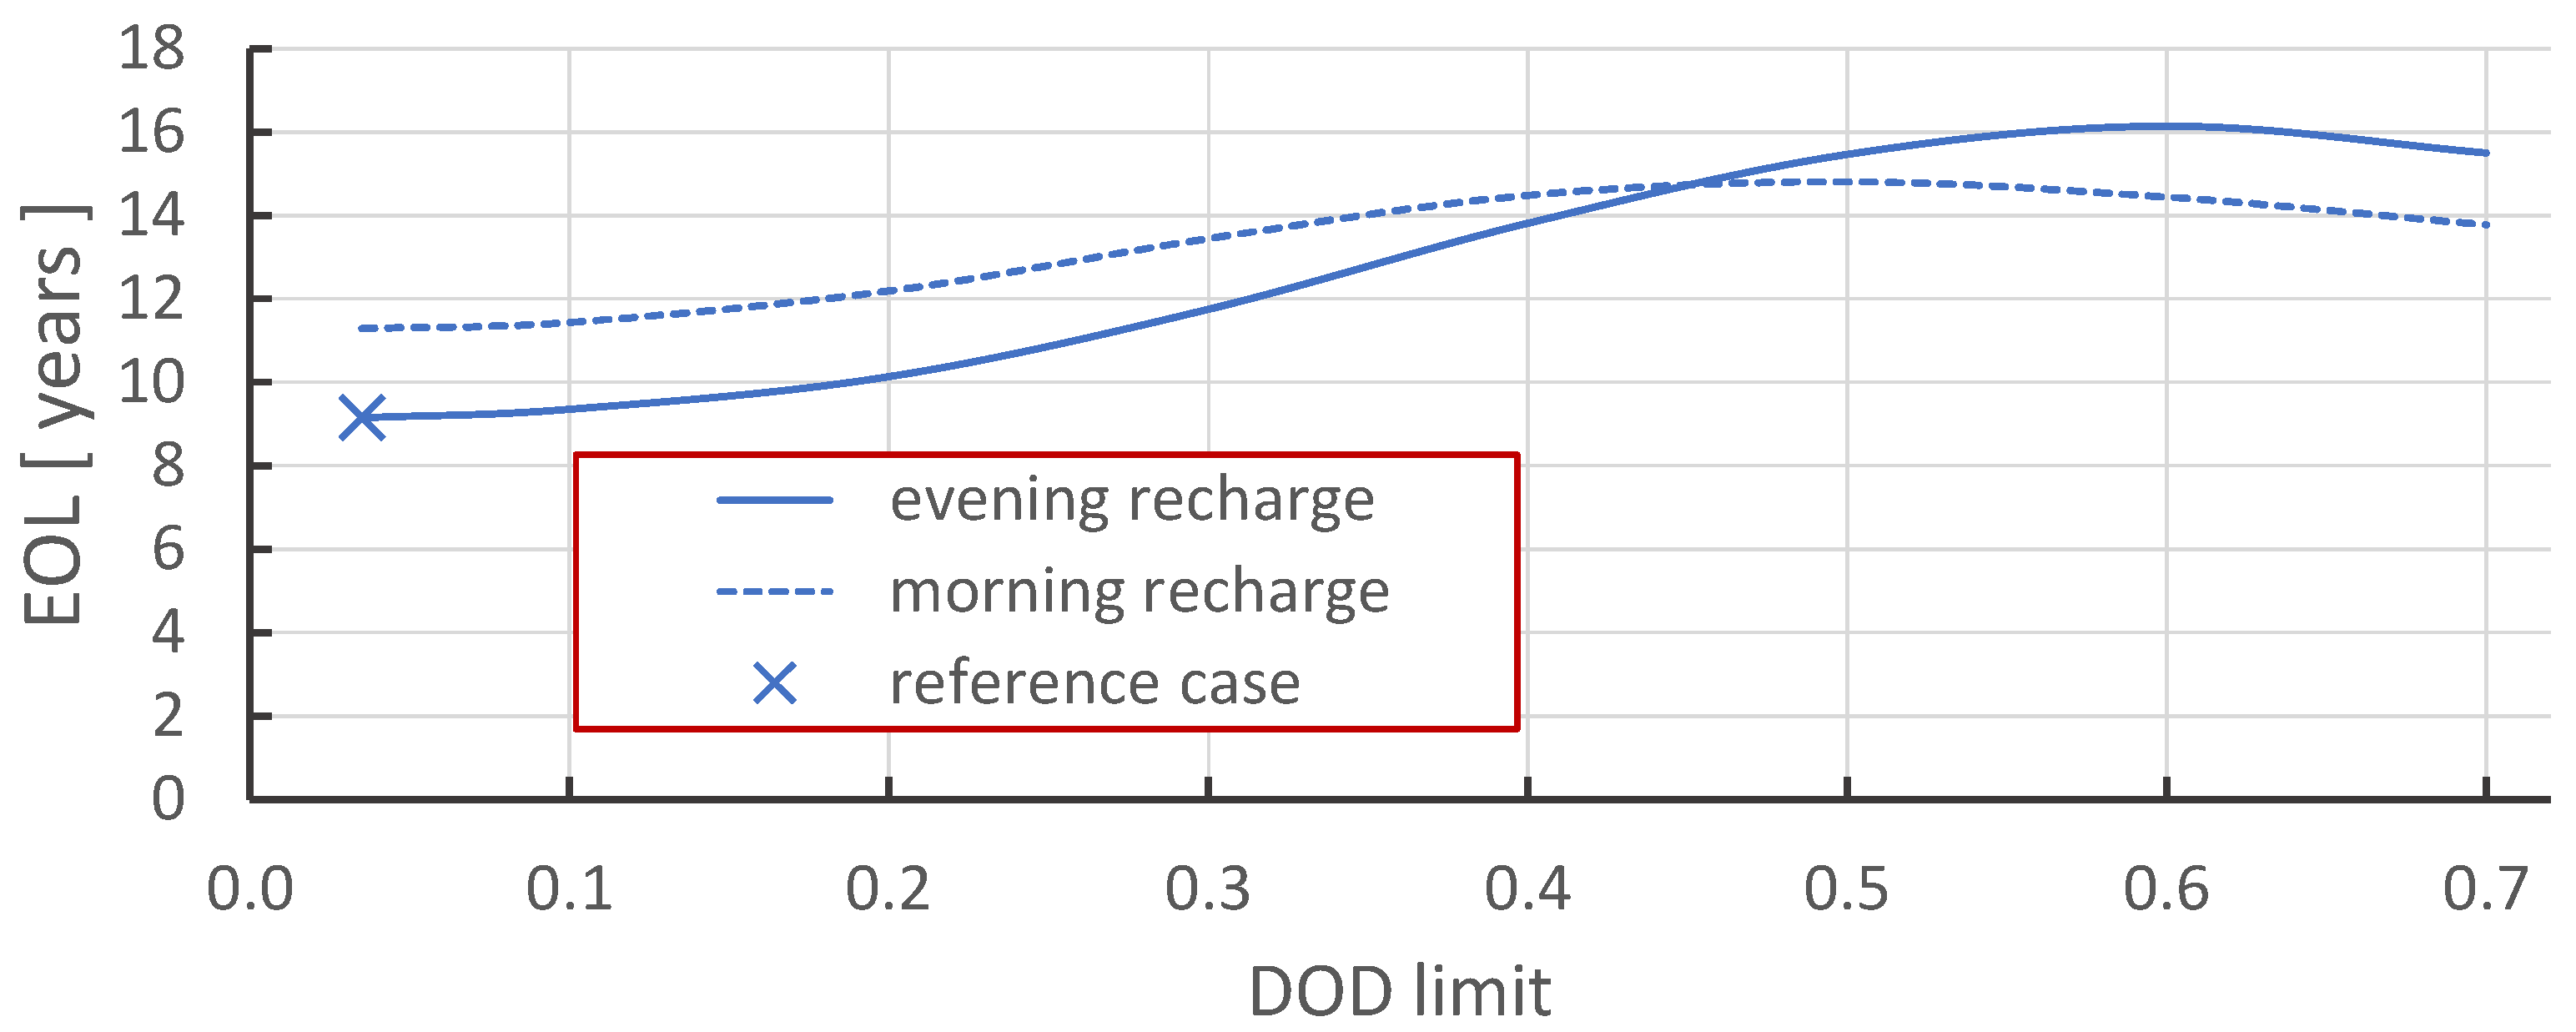
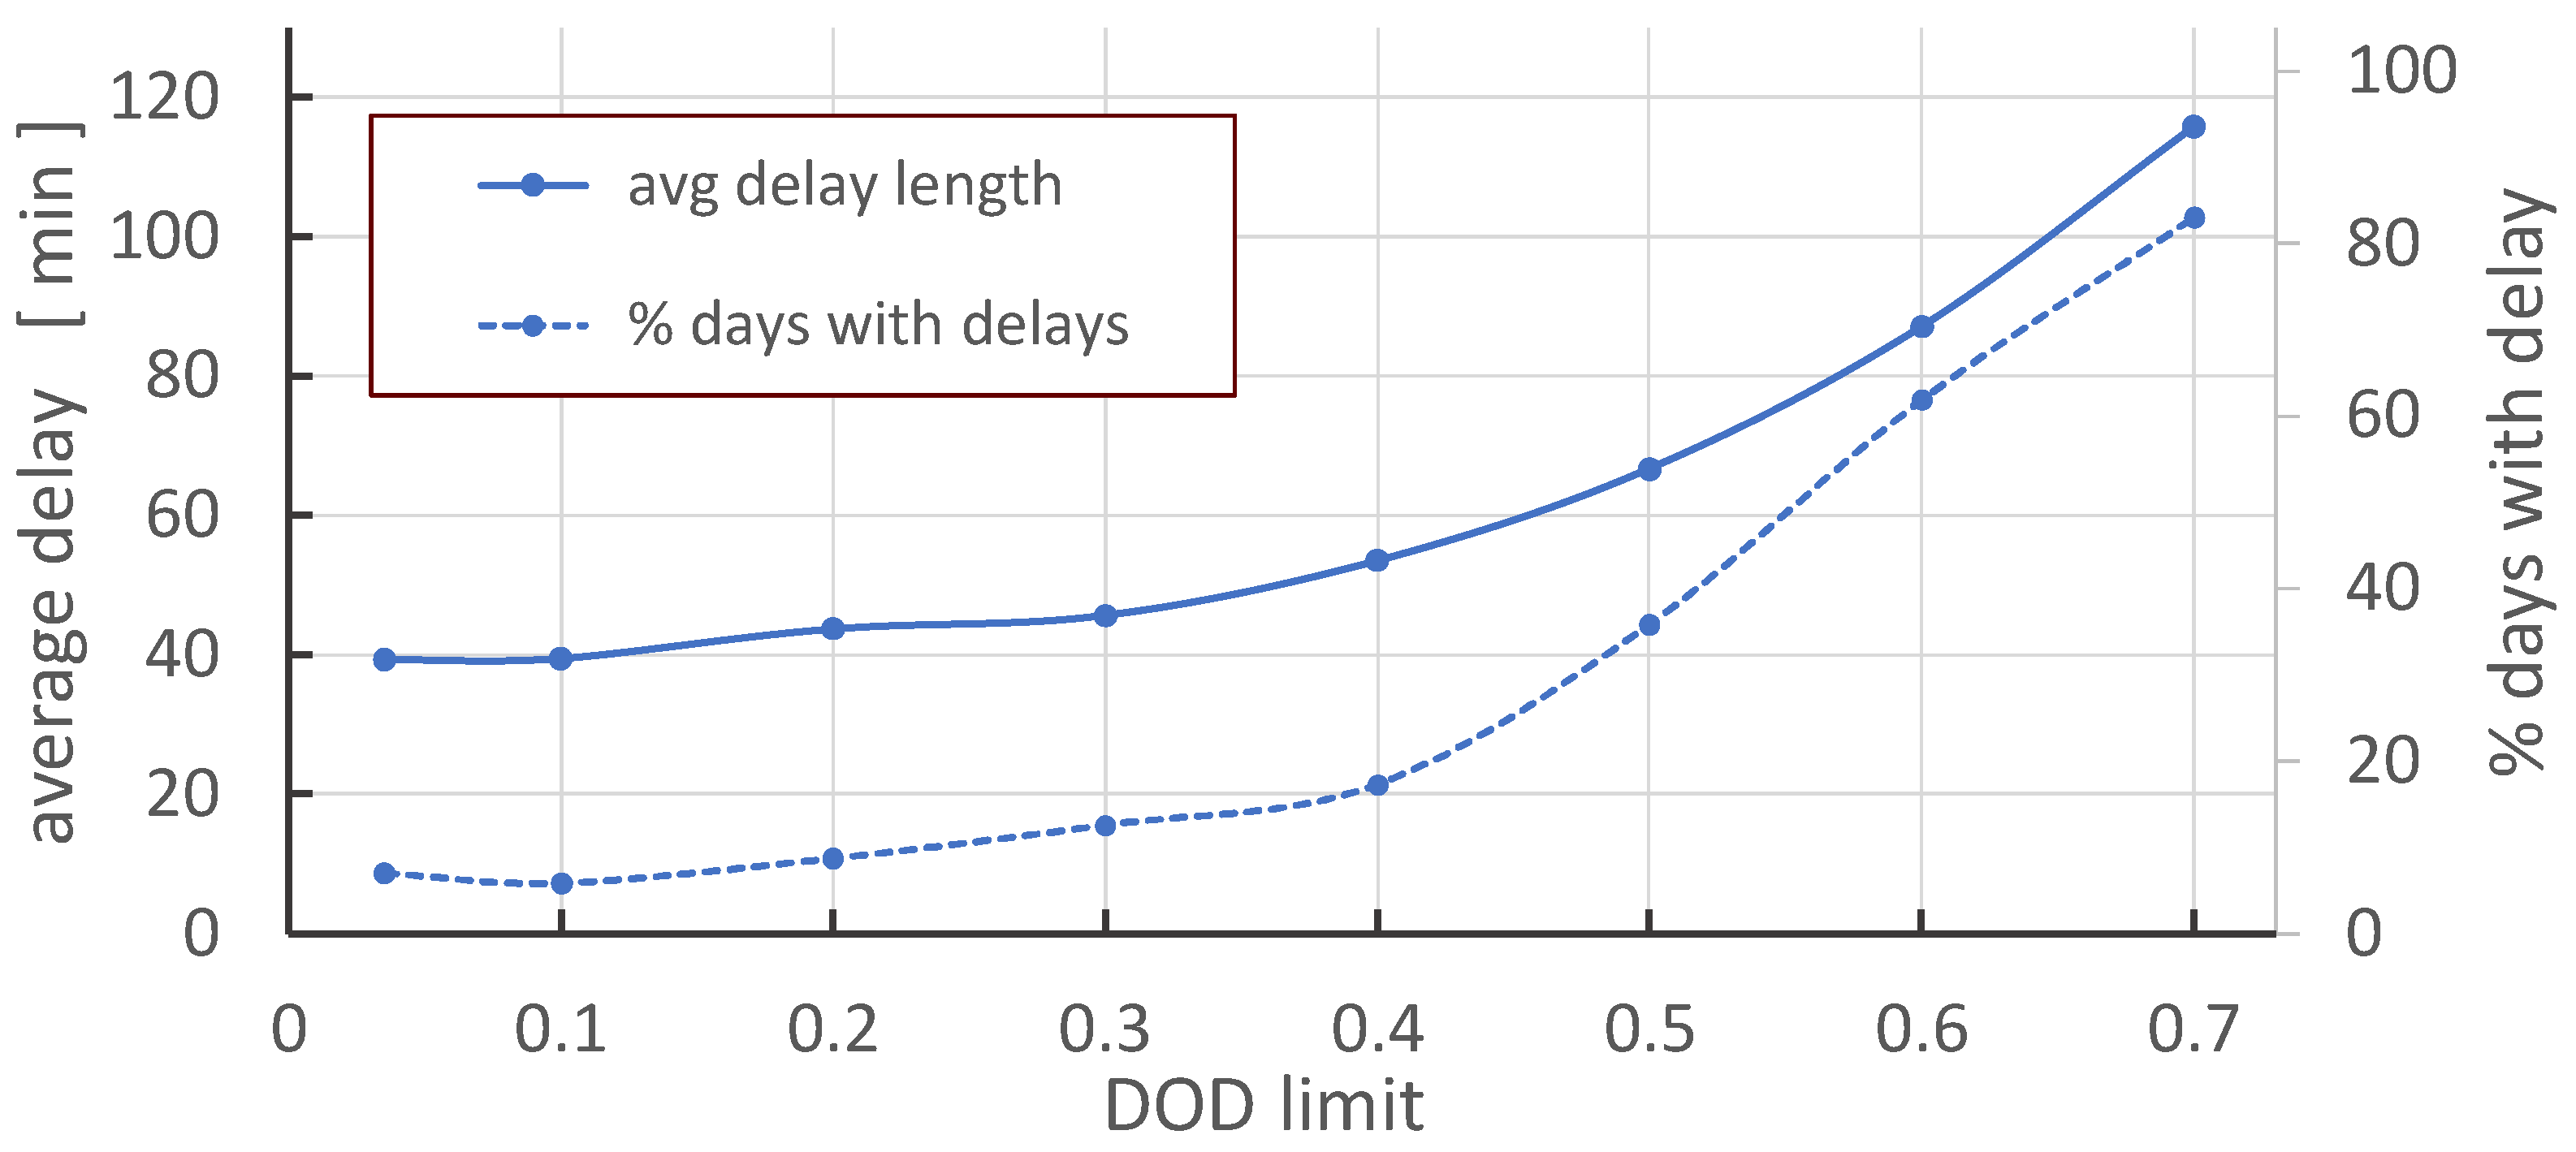
4.1. BET Reference Cases

A set of reference cases was run with BET vehicles operating on the highway route for the duration of the battery pack life. Figure 7 plots the BET end of life point (EOL) versus the size of the battery pack. The reference cases discussed here were carried out with the recharge operation performed immediately after completing the driving (evening recharge), to a DOD limit of 0.035.
As anticipated, the pack lifetimes increase as a function of their size, primarily through the lower currents required and lower heat generation rates experienced to perform the driving duty. Lifetimes ranged from about 4.5 years for an 8-bank battery (534 kWh capacity) to over 9 years for a 24-bank pack (1600 kWh).
For each of the five trucks in the data set which were modeled as BETs with 24-bank batteries, their EOL values were plotted Figure 8 versus daily driving distance averages. The EOL value is seen to decrease with a higher average daily distance requirement, or for these cases, at a cost of 0.78 years per additional 100 km per day.
Typically, heavy-duty long-haul trucks last 10–15 years, and can drive up to 1.6M km [34]. The 24-bank battery packs with their 8 to 9 year lifespans, showed an average odometer reading of about 1.3M km at EOL. Thus in terms of performance, a 24-bank BET comes close to, but does not exceed nominal performance specifications of a diesel long-haul transport truck. For now, a detailed techno-economic analysis has not been performed, but the economics of the BET would of course be enhanced by its significantly lower energy costs over its service lifetime.

Impact of Recharge Scheduling on BETs

A series of simulations were run for 24-bank BETs where the minimum DOD permitted was controlled as a variable parameter. The minimum DOD value served as a cut-off point for stopping recharge operations. These simulations were carried out to establish suitable DOD operational ranges. Indeed, outside of a central range where the DOD value is known to mitigate degradation rates [35], it is known in general that restricting the DOD to remain in a deep state of discharge may not allow sufficient energy for the driving duty to be completed without supplementary recharging, and rest state DODs may be non-ideal for battery preservation.
Figure 9 shows how a recharging DOD limit in a blunt sense impacts the EOL value for a BET. The values plotted in the graphic are average EOL values for all five trucks simulated. The longest vehicles lives are observed in the DOD limit range of about 0.40 to 0.70, which reflect the DOD values at which the lowest degradation rates occur. Two notable features observed in these results are the effects of the timing of the recharge operation, and secondly, the ensuing consequences when a mid-trip recharge is required. These points are discussed below.
The functionality surrounding morning or evening recharging is somewhat complex. The general guiding principle here would normally be that recharging the battery to a very low DOD value would place it in a state where rest period degradation rates are high, so fully recharging a battery should best be carried out just immediately prior to beginning the day’s driving, reflected in Figure 9 with longer EOL values for morning recharging to low DOD levels. For high DOD limits, the rest state is moved from a near depleted DOD to one that is higher, thereby mitigating the DOD state driver for degradation [24]. Thus a crossover point between DOD limits 0.4 and 0.5 can be seen when comparing the morning and evening recharge curves. Analysis showed that the trucks were driving about 19.4% of the time, with the remaining 80% of the time spent at rest, thus underlining the importance of maintaining mid-level DOD values during rest to mitigate needless degradation.
An additional consideration for BETs facing these duty cycles concerned any amount of additional time required to reach their daily destinations arising from needing supplementary mid-trip recharging. In these simulations, if mid-trip recharges were conducted, an energy requirement based on 1.8 kWh/km, plus a 15% additional buffer amount was determined as the quantity of recharging to be carried out simply for completing the trip with no additional delays. Recharges carried out during scheduled stops and rests were carried out to the DOD limit if time allowed, otherwise they were stopped 5 min before the driving was scheduled to resume. The extra time was calculated by comparing the time required for the simulated BET to complete its driving duty each day, compared to the total time reported in the daily driving data summaries for each truck by NESCAUM. The extra time was totaled over the vehicle lifetime and applied to determine a daily average considering only days when driving occurred.
It can be seen in Figure 10 that narrow DOD operating ranges ( i.e., high DOD limit values) offer less net driving range, and thus can be seen to require more daily time for supplementary recharging. Further, these restricted ranges become increasingly impractical. Above the DOD limit of about 0.3 or 0.4, the percentage of driving days requiring supplementary recharge begins to grow above 20% and the typical duration of the required charging reaches one hour or more.
When operational DOD limits are imposed for BETs, best performance was observed in the 0.4 to 0.5 range, which gave EOL values upwards of 12 years depending on operational choices, and low mid-trip recharge extra time requirements. The need for any mid-trip recharging is probably a more important detail than their actual duration. Up to DOD limits of 0.50, the times required are generally less than an hour.

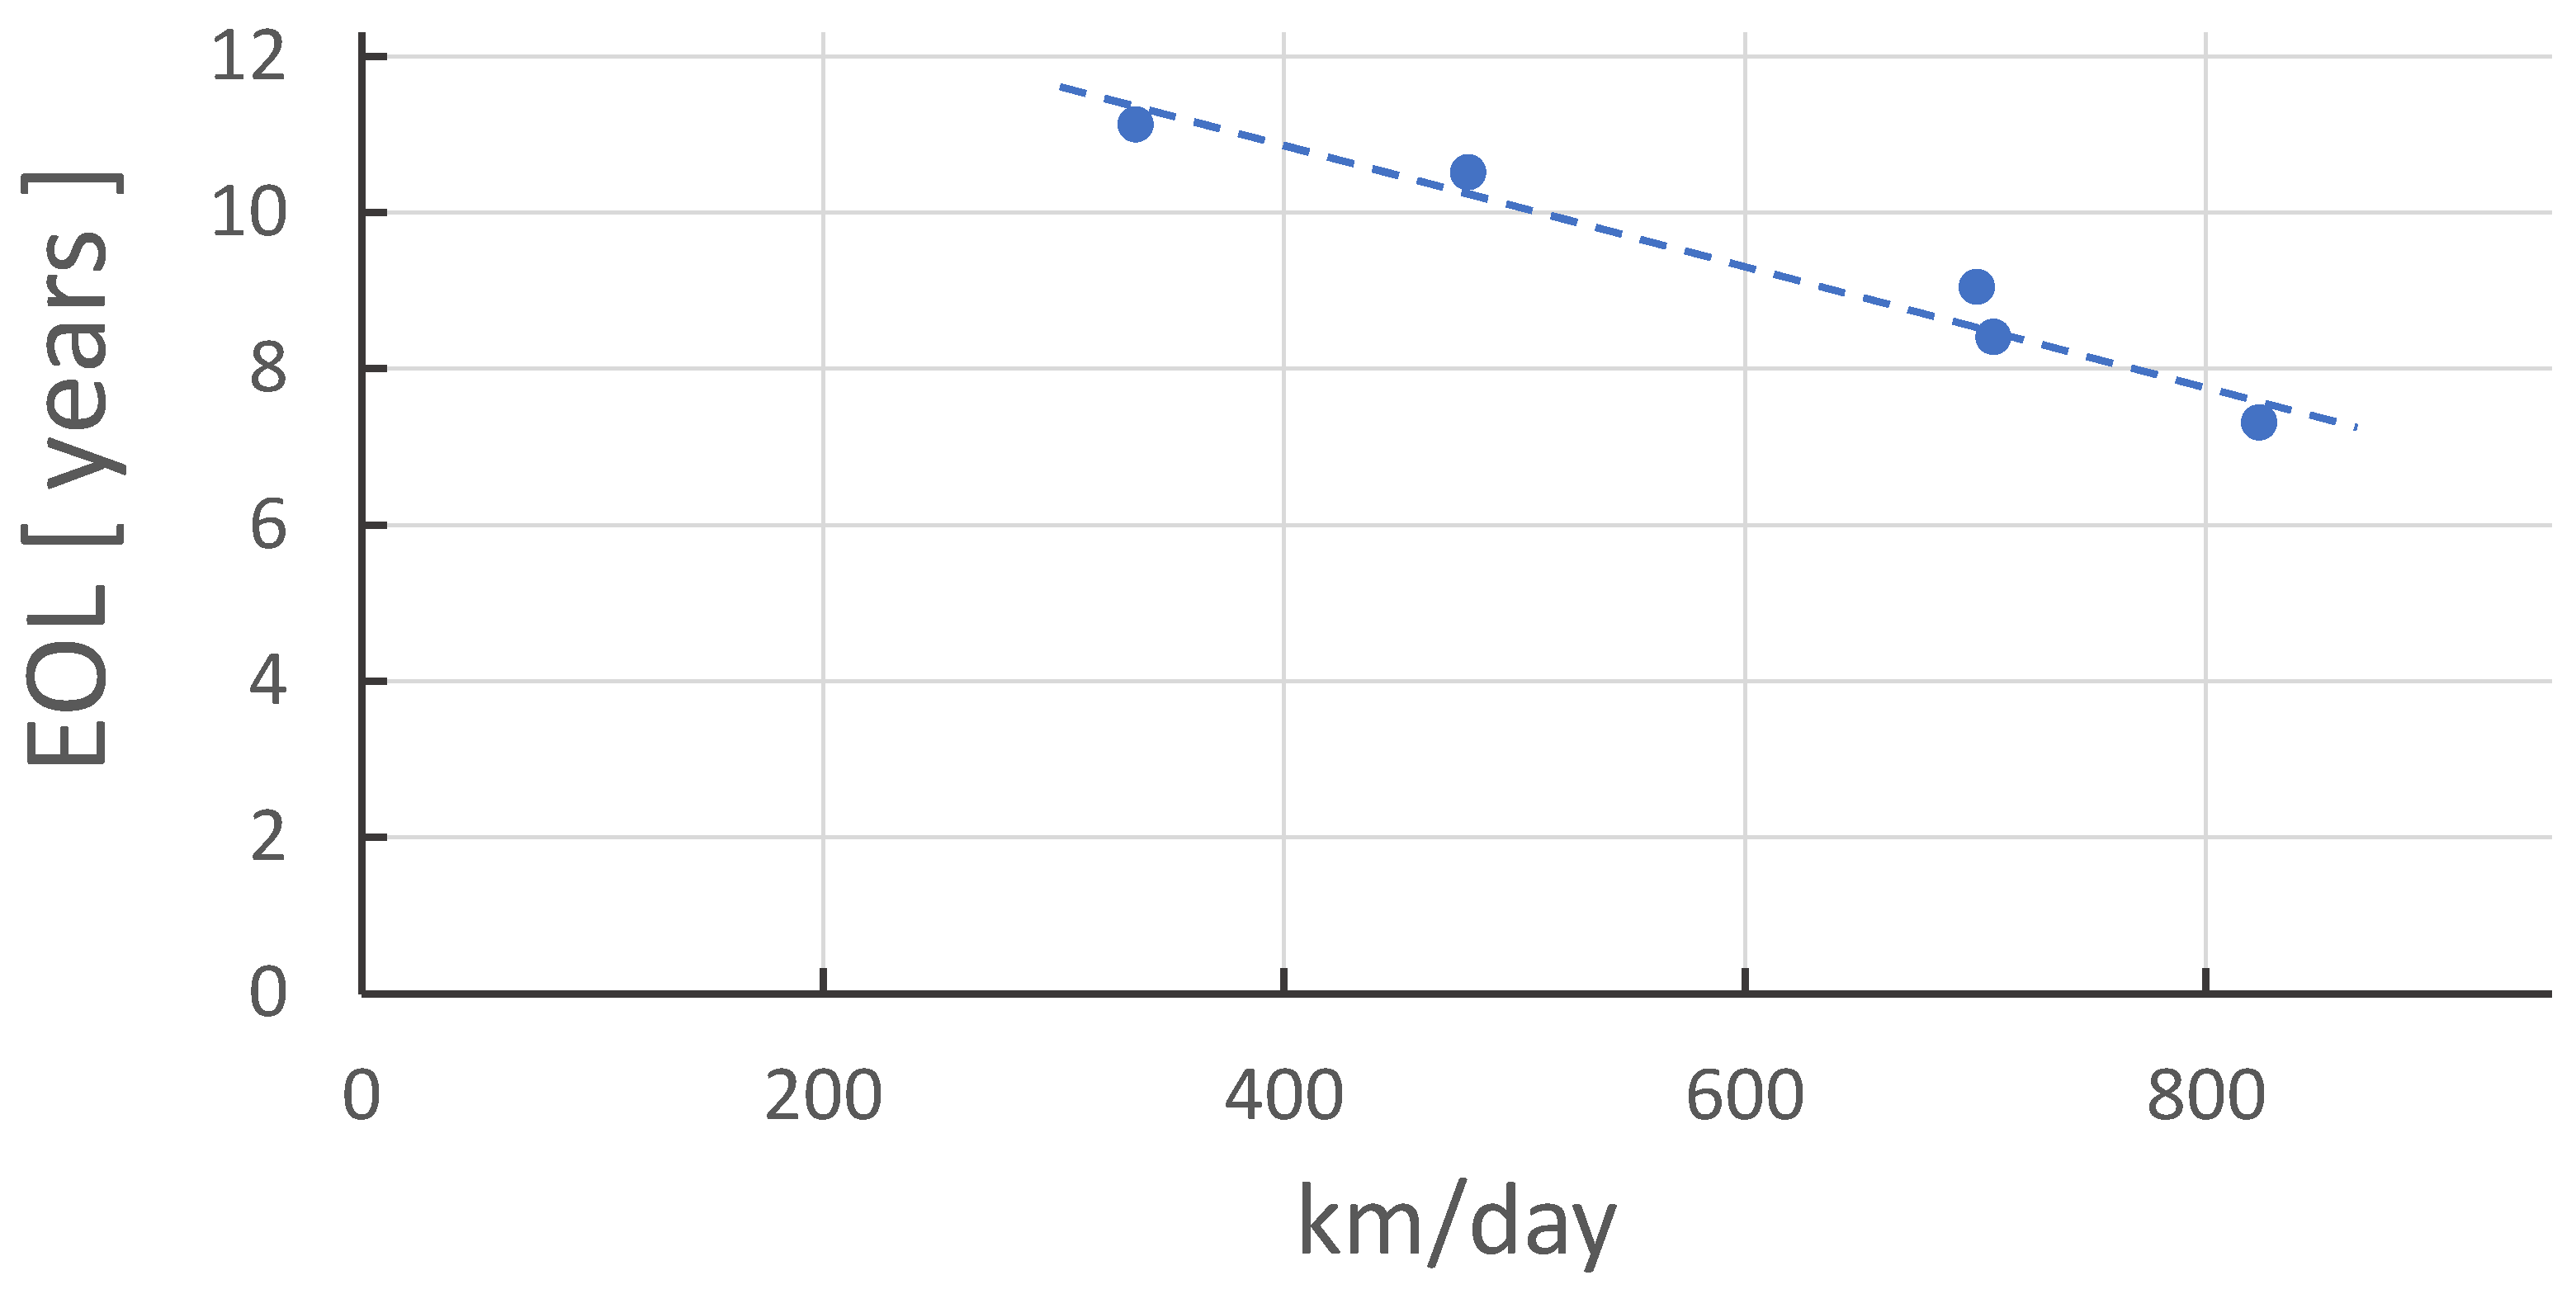
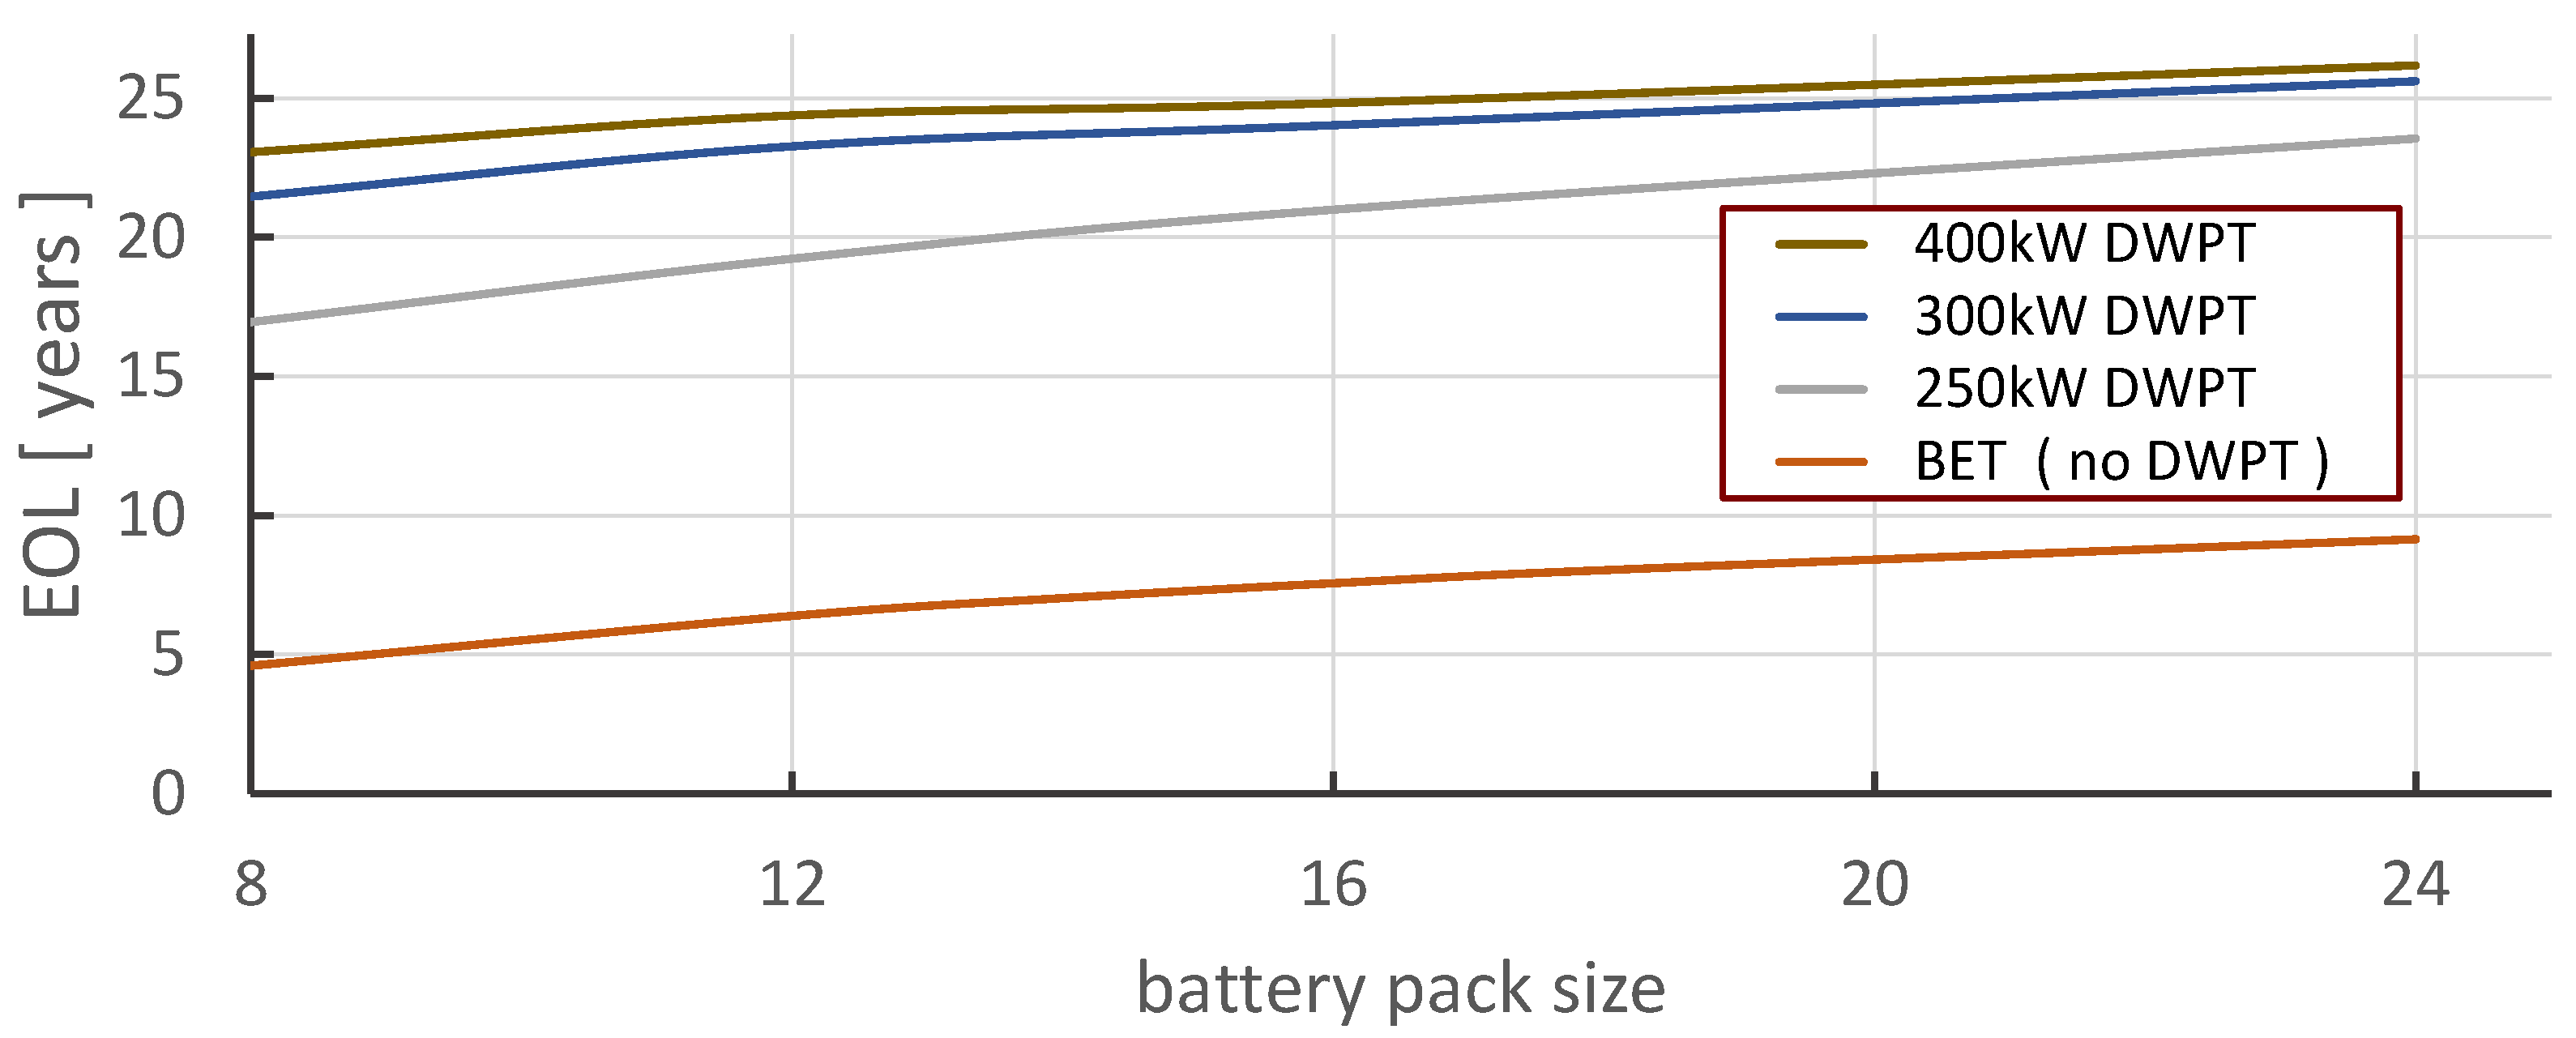
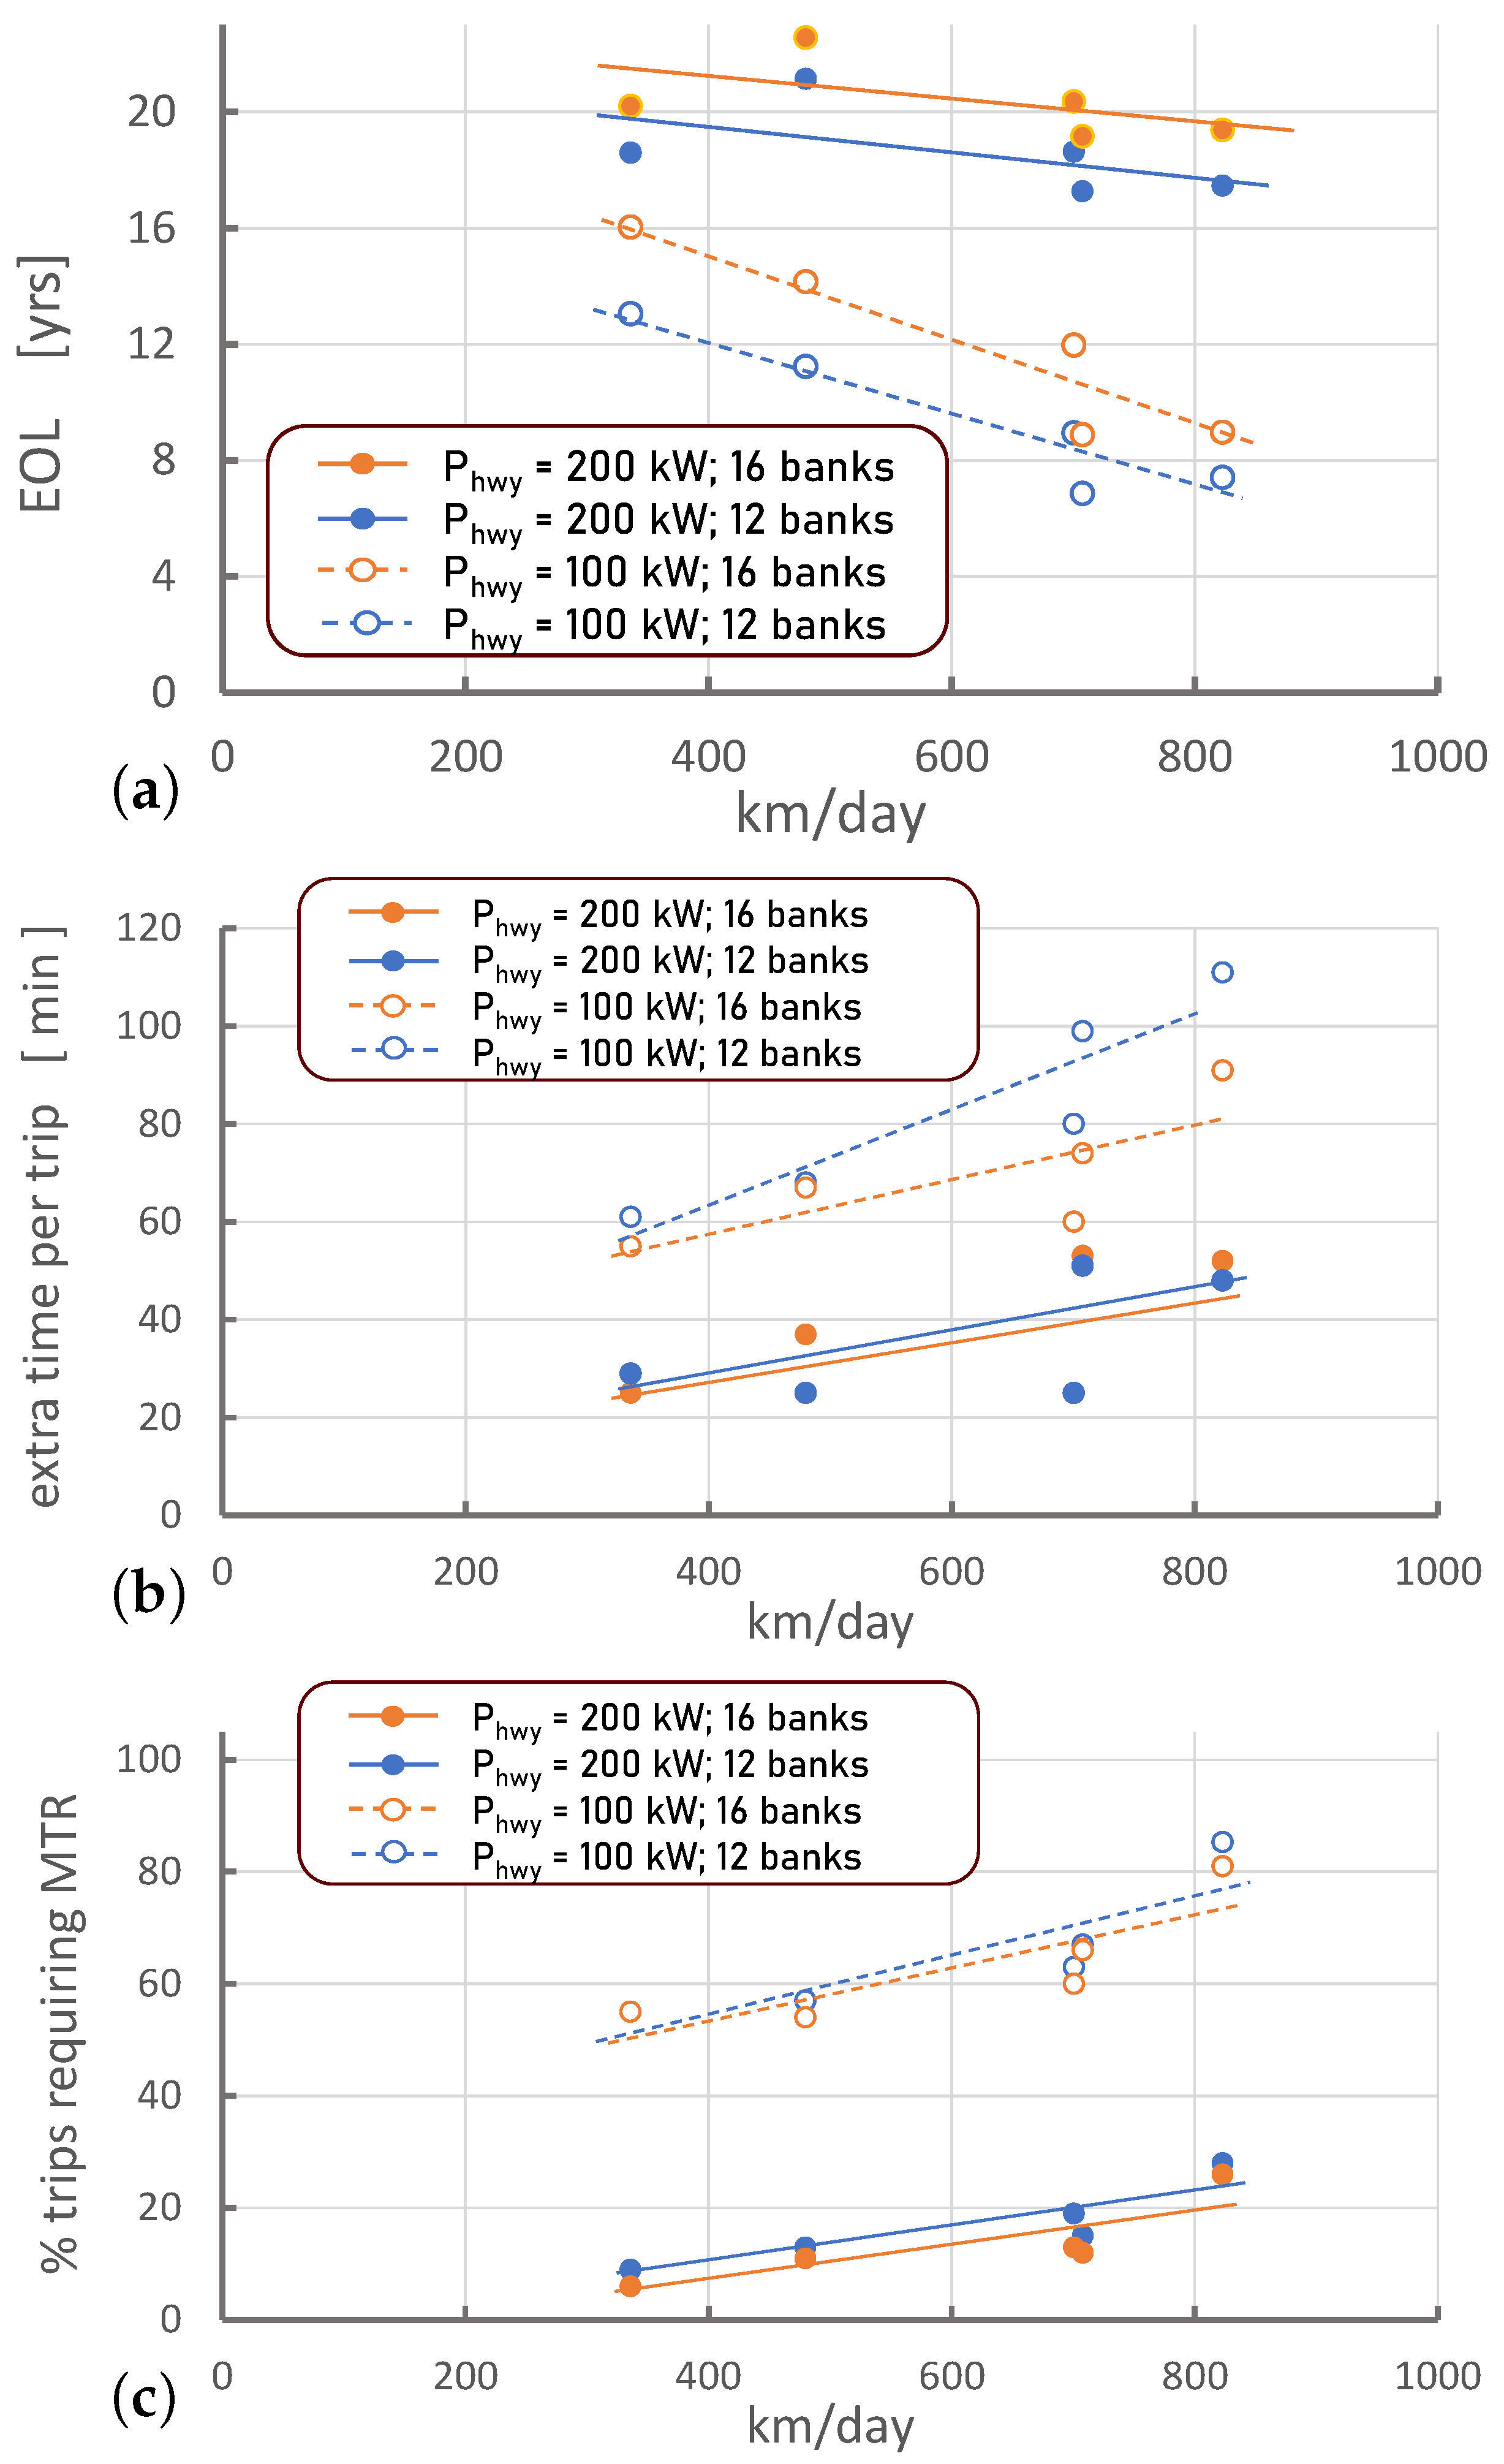
4.2. EHTs—Comparison to Reference BET Cases

The same driving duty was simulated for e-trucks operating as EHTs, as was performed in Section 4.1 with BETs. The EOL values showing the average durability of all five trucks is plotted in Figure 11. All EHTs were able to operate right down to 60% SOH, and showed battery lifetimes upwards of 15 years, normally exceeding typical diesel long-haul truck lifespans. Comparing EHTs to BETs with equivalent battery capacities, significantly longer EOL values were observed. At P hwy = 250 kW with 8-bank packs, the EHT lifetime was about 4.6 times that of a BET, and with a 24-bank pack, this factor was 2.6. With P hwy at 300 kW, these factors were respectively 4.6 and 2.8, and 5.0 and 2.9 for P hwy = 400 kW. The EHT service lifetimes ranged from 80 to 90% of the battery calendar life (about 27 years) determined under the given environmental conditions, indicating that an e-truck operating mainly on an e-Hwy, could do so with very minimal battery degradation. In terms of operating cost for fuel or power [34,36], a heavy-duty transport truck would typically consume 40 L per 100 km, roughly $47 US at present day prices in Ontario, Canada, compared to about $16 US for 100 km for the e-trucks.

BETs and EHTs—Comparison with Preliminary Study

Our first study on this subject reported in [1] presented a basically conceived range of cases, which notably employed daily driving duties modeled on daily out and back trips between depots in Toronto and Montreal, thus a 540 km transit, twice daily. For EHT cases, about 98% of this driving was on e-Hwys. The 8-bank battery case at 400 kW P hwy level was conducted in both studies, with an EOL of 20.1 years in the preliminary study, and an EOL of 24.4 years in the present one. For BETs, a comparison can be made for a truck with a 16-bank battery pack, which had a service lifetime down to a battery SOH of 60% of 7.57 years in the present study, versus 7.03 years in the preliminary study.
The intensity of driving in the preliminary study was far higher, with the e-truck driving almost 350,000 km per year, compared to an average of about 150,000 km per year in the present study. Also, in the preliminary study, the e-truck was on the road every day, whereas the real-life on-road data used here had the total percentage of days with the e-truck on the road ranging from 55 to 85%. Detailed long-haul on-road data for individual trucks is difficult to find; there does not seem to be much reporting of it in the literature. Typically, e-truck forecasting studies have employed constrained driving profiles for long-haul which obey hour-of-service regulations which vary by jurisdiction, but result in a maximum allowed percentage of blocks of time to be actually driving to around 35% [37]. The overall amount of on-road driving time determined from the NESCAUM data used here was just under 20%, compared to around 45% in [1].
On a normalized performance basis, the preliminary study was modeled with a uniform speed profile on highways, such that only positive elevation changes required acceleration power. Traffic based speed fluctuations that arise in real-life driving reflected in the present study did not occur in [1], as the duty cycle was set to simply use a uniform speed according to the local speed limit. In view of these differences, the present study determined higher energy requirements for the real-life on-road data; 1.74 kWh/km for BETs and 1.81 kWh/km for EHTs, compared to respective values of 1.66 and 1.74 kWh/km reported in [1].

4.3. EHT DWPT Power Provision Level

As discussed above in Section 4.2, the durability increases according to battery pack size for EHT driving, and for pack sizes above 12 banks, the benefit is likely insignificant as well as already being in a range where the battery pack lifetime may well not be the limiting factor for the overall vehicle lifetime [34].
Sustainable e-Hwy power levels were investigated in [1], where it was found that a P hwy level of 250 kW was required to allow a heavy-duty long haul truck to complete the imposed duty cycles without requiring mid-trip recharging. In view of this limitation, lower P hwy values were investigated with the understanding that mid-trip recharging with a 1.0 MW unit would be necessary for the EHTs to complete their driving duty. Figure 12 shows results from simulations conducted with P hwy set to either 100 or 200 kW, for EHTs with 12 and 16-bank battery packs.
The larger P hwy level could be seen to roughly double the EOL and reduce the daily extra time considerably. In general the EOL values were acceptable at P hwy level of 200 kW, but are not good at the 100 kW level. Mid-trip recharging contributing to daily extra time and the percentage of days when MTR occurred may suggest that a P hwy level of 100 kW is impractical for heavy transport, and even at 200 kW, daily distances above 500 km would not work well. In general, the results in Figure 12 indicate that for practical e-Hwy performance, situations requiring a mid-trip recharge occur too frequently below P hwy levels of 250 kW, and would ideally be avoided. As mentioned previously, at P hwy = 250 kW or above, the driving duties of the five trucks could all be completed without mid-trip recharging.
The energy efficiency of the various simulation scenarios is an important output. The vehicle simulated here was chosen as a maximum weight heavy-duty long-haul truck weighing 36,000 kg, which is the maximum allowable weight in North America. For such a heavy vehicle, the simulations are reporting energy consumption levels in the 1.65 to 1.81 kWh/km range. By contrast, the Tesla Semi is advertised as using only 1.25 kWh/km [28]. A typical weight of an empty class-8 truck would be about 16,000 kg [38]. The differences in energy consumption and battery pack lifetimes are summarized in Table 2. The simulations of empty trucks showed energy consumption values which corresponded to the value cited by Tesla. In Table 2, the EHTs show a significantly longer service life, but also a slightly worse energy efficiency, attributable to transfer efficiencies from the DWPT source.

5. Conclusions

The reference cases simulated with battery-only BETs determined end-of-life values at 60% SOH of 4 to 5 years for 534 kWh (8-bank) capacity battery packs, and lifetimes up to 8 to 9 years for 1600 kWh (24-bank) packs. These values are averaged from five different trucks, simulated as BETs which followed a driving schedule based on detailed measured on-road data. The five trucks all had individual usage characteristics, with the total percentage of days on the road ranging from 55 to 85%. The 24-bank battery packs with their 8 to 9 year lifespans, showed an average odometer reading of about 1.3M km at EOL, slightly less than the 1.6M km that good performing diesel long-haul trucks can attain. BET lifetimes were also assessed according to recharge scheduling and a DOD limit range for recharging. In general, recharging just prior to starting a trip as opposed to just after finishing a trip extended the EOL by 1 to 2 years, by virtue of having extended rest periods for the battery pack at higher DOD levels which degrade at lower rates than fully charged packs. Restricting the DOD range was found to increase EOL values by up to 2 years, but at the expense of requiring an additional 1 to 2 h per trip to reach the daily destinations.
On electrified roadways, it was found that smaller battery pack sizes of 12 or 16 banks were sufficient to complete the driving duty to 60% SOH without any mid-trip recharging for most of the cases. EHTs that were able to work to 60% SOH, had battery lifetimes that were upwards of 15 or 20 years, comparing favorably to diesel trucks as well as the nominal cell calendar life. It was found that a minimum threshold e-Hwy power provision level was required for an EHT to complete its driving duty without requiring supplementary recharging. For an 8-bank battery pack, a P hwy level of 250 kW was sufficient for being able to drive indefinitely until EOL for a 36 tonne truck. An 8-bank battery pack could provide at most 230 km of off-highway transient driving. Thus, off-highway requirements greater than 230 km would require a proportionally larger battery pack size.
This present study is an early phase step towards gaining an understanding of the broader implications of long-haul transport electrification and e-Hwy prospects. There were several areas of study, and through them, subjects of interest for further study became apparent. The impact of charging unit power levels was not explored, notably exploring power levels below one megawatt for overnight charging. This study only considered a DOD limit as a control on dynamic recharging. Exploring a more sophisticated BMS role where DOD thresholds, anticipated upcoming driving duty demands and variable current levels for top-up charging should all provide some scope for improving system performance. This study focused on the impact of different long-haul truck electrification strategies on battery pack durability. Future research plans to make use of these technical finding for making techno-economic evaluations for guiding the eventual adoption of long-haul trucking electrification systems in a broad regional or national context.

Author Contributions

K.D.: code development, simulation strategy, data analysis, manuscript preparation; H.R.: project commissioning, simulation strategy, technical oversight, techno-economic analysis; E.S.: running simulations, organizing and presenting data; G.L.: running simulations, organizing and presenting data. All authors have read and agreed to the published version of the manuscript.

Funding

Support and funding for this work was provided by CanmetENERGY of Natural Resources Canada and the Clean and Energy-efficient Transportation program of the National Research Council of Canada.

Data Availability Statement

Data are contained within the article.

Acknowledgments

We gratefully acknowledge Kieran Humphries of Environment and Climate Change Canada for his valuable assistance with data conditioning and preparation, and Coralie Cooper of NESCAUM for kindly making the detailed on-road long-haul truck data available to our study.

Conflicts of Interest

The authors declare no conflicts of interest.

Abbreviations

The following abbreviations are used in this manuscript:
BETbattery electric truck
BMSbattery management system
CPTconductive power transfer
DODdepth of discharge
DWPTdynamic wireless power transfer
e-Hwyelectrified roadway furnishing DWPT
EOLbattery EOL life value, in years
EVelectric vehicle
OCVopen-circuit voltage
P2Dpseudo two-dimensional
SEIsolid-electrolyte interface
SOCstate of charge
SOHstate of health

References

  1. Darcovich, K.; Ribberink, H.; Qiu, K.; Soufflet, E. Battery Pack Prospects for Long-Haul Transport Trucks Considering Electrified Highways and Megawatt Charging. World Electr. Veh. J. 2023, 14, 60. [Google Scholar] [CrossRef]
  2. Ribberink, H.; Wu, Y.; Lombardi, K.; Yang, L. Electrification Opportunities in the Medium-and Heavy-Duty Vehicle Segment in Canada. World Electr. Veh. J. 2021, 12, 86. [Google Scholar] [CrossRef]
  3. Afridi, K Wireless charging of electric vehicles. Front. Eng. 2017, 47, 17–22.
  4. Qiu, K.; Ribberink, H.; Entchev, E. Economic feasibility of electrified highways for heavy-duty electric trucks. Appl. Energy 2022, 326, 119935. [Google Scholar] [CrossRef]
  5. Haddad, D.; Konstantinou, T.; Aliprantis, D.; Gkritza, K.; Pekarek, S.; Haddock, J. Analysis of the financial viability of high-powered electric roadways: A case study for the state of Indiana. Energy Policy 2022, 171, 113275. [Google Scholar] [CrossRef]
  6. Mayer, J.; Archbold, W.K.; Harte, C.R.; Osgood, F.; Murray, W.S. Discussion on Overhead Electric Traction. Trans. Am. Soc. Civ. Eng. 1908, 60, 539–562. [Google Scholar] [CrossRef]
  7. Gibson, S. Transportation 1990: Toll Roads? Transit Incentives? Electrified Freeways? Trucks In Diamond Lanes? Calif. J. 1980, 417–420. [Google Scholar]
  8. Kanafani, A.; Parsons, R.E. Program on advanced technology for the highway: Vehicle/highway research and development. In Proceedings of the Conference Record of Papers Presented at the First Vehicle Navigation and Information Systems Conference (VNIS’89), Toronto, ON, Canada, 11–13 September 1989; IEEE: New York, NY, USA, 1989; pp. 270–272. [Google Scholar]
  9. Bender, J.G. An overview of systems studies of automated highway systems. IEEE Trans. Veh. Technol. 1991, 40, 82–99. [Google Scholar] [CrossRef]
  10. Jones, P.T.; Onar, O. Impact of wireless power transfer in transportation: Future transportation enabler, or near term distraction. In Proceedings of the 2014 IEEE International Electric Vehicle Conference (IEVC), Florence, Italy, 17–19 December 2014; IEEE: New York, NY, USA, 2014; pp. 1–7. [Google Scholar]
  11. Rakhymbay, A.; Bagheri, M.; Lu, M. A simulation study on four different compensation topologies in EV wireless charging. In Proceedings of the 2017 International Conference on Sustainable Energy Engineering and Application (ICSEEA), Jakarta, Indonesia, 23–24 October 2017; IEEE: New York, NY, USA, 2017; pp. 66–73. [Google Scholar]
  12. Soares, L.; Wang, H. A study on renewed perspectives of electrified road for wireless power transfer of electric vehicles. Renew. Sustain. Energy Rev. 2022, 158, 112110. [Google Scholar] [CrossRef]
  13. Osieczko, K.; Zimon, D.; Płaczek, E.; Prokopiuk, I. Factors that influence the expansion of electric delivery vehicles and trucks in EU countries. J. Environ. Manag. 2021, 296, 113177. [Google Scholar] [CrossRef] [PubMed]
  14. Wiegmans, B.; Champagne-Gelinas, A.; Duchesne, S.; Slack, B.; Witte, P. Rail and road freight transport network efficiency of Canada, member states of the EU, and the USA. Res. Transp. Bus. Manag. 2018, 28, 54–65. [Google Scholar] [CrossRef]
  15. Gustavsson, M.G.H. Research & Innovation for Electric Roads. In Proceedings of the EVS35 Symposium, Oslo, Norway, 11–15 June 2022. [Google Scholar]
  16. Dhayarkar, S.; Sontakke, S.; Shinde, V.; Ghuge, N. Electric Heavy Vehicle Transportation Highway (By Catenary System). In Proceedings of the ITM Web of Conferences, EDP Sciences, Navi, Mumbai, 7–8 April 2022; Volume 44, p. 01004. [Google Scholar]
  17. Gouvernement de France, Ministère de la Transition énérgetique, Système de route électrique, Groupe de travail no1. Décarboner le transport routier de marchandise par l’ERS, enjeux et stratégie, (2021) July; Gouvernement de France, Ministère de la Transition énérgetique, Système de route électrique, Groupe de travail n°1: Paris, France; 196p.
  18. Edelstein, S. Short-Loop Electric Bus Serves as a Proving Ground for Dynamic Wireless Charging. Available online: https://www.greencarreports.com/news/1131665_short-loop-electric-bus-serves-as-a-proving-ground-for-dynamic-wireless-charging (accessed on 12 January 2023).
  19. Shoman, W.; Karlsson, S.; Yeh, S. Benefits of an electric road system for battery electric vehicles. World Electr. Veh. J. 2022, 13, 197. [Google Scholar] [CrossRef]
  20. Openshaw, S.; Etta, D.; Maji, S.; Ruan, T.; Afridi, K.K. Investigation of Commercial Viability and Public Perception of Electrified Roadways with Dynamic Wireless Charging. In Proceedings of the 2023 IEEE Wireless Power Technology Conference and Expo (WPTCE), San Diego, CA, USA, 4–8 June 2023; IEEE: New York, NY, USA, 2023; pp. 1–6. [Google Scholar]
  21. Darcovich, K.; Ribberink, H.; Michelet, C.; Lombard, K.; Ghorab, M. The Feasibility of Electric Vehicles as Taxis in a Canadian Context. In Proceedings of the 2019 Electric Vehicles International Conference (EV), Bucharest, Romania, 3–4 October 2019; IEEE: New York, NY, USA, 2019; pp. 1–6. [Google Scholar]
  22. Humphries, K.; Cooper, C.; Ahmadi, M. Heavy-Duty Diesel Truck In-Use NOx Emissions Evaluation Using On-BoardSensors; SAE Technical Paper 2022-01-5098; SAE: Warrendale, PA, USA, 2022. [Google Scholar] [CrossRef]
  23. Council of the European Union. Interinstitutional File: 2021/0197(COD), Proposal for a Regulation of the European Parliament and of the Council Amending Regulation (EU) 2019/631 as Regards Strengthening the CO2 Emission Performance Standards for New Passenger Cars and New Light Commercial Vehicles in Line with the Union’s Increased Climate Ambition. Brussels, 25 June 2022; Council of the European Union: Brussels, Belgium; p. 22.
  24. Darcovich, K.; Recoskie, S.; MacNeil, D.D.; Darcovich, A. Operational intra-cycle temporal and current mode effects on battery capacity loss. eTransportation 2022, 13, 100185. [Google Scholar] [CrossRef]
  25. Darcovich, K.; Ribberink, H.; Qiu, K.; Soufflet, E. Investigation of Electric Highway Alternatives to MegaWatt Charging. In Proceedings of the EVS35 Symposium, Oslo, Norway, 11–15 June 2022. [Google Scholar]
  26. Google Earth. Available online: https://earth.google.com (accessed on 7 March 2022).
  27. Environment Canada. Historical Weather Data. Available online: http://climate.weather.gc.ca/historical_data/search_historic_data_e.html (accessed on 11 March 2022).
  28. Tesla. Available online: https://www.tesla.com/en_ca/semi (accessed on 2 October 2022).
  29. Knapton, D.A. Investigation of Truck Size and Weight Limits—Technical Supplement. Vol. 3. Truck and Rail Fuel Effects of Truck Size and Weight Limits; Deptartament of Transportation, Office of the Secretary: Washington, DC, USA, 1981.
  30. Foote, A.; Onar, O.C.; Debnath, S.; Chinthavali, M.; Ozpineci, B.; Smith, D.E. Optimal sizing of a dynamic wireless power transfer system for highway applications. In Proceedings of the 2018 IEEE Transportation Electrification Conference and Expo (ITEC), Long Beach, CA, USA, 13–15 June 2018; pp. 1–6. [Google Scholar]
  31. Eriksson, R. Volvo Cars to test new wireless charging technology in green city zone. In Proceedings of the EVS35 Symposium, Oslo, Norway, 11–15 June 2022. [Google Scholar]
  32. Ribberink, H.; Lombardi, K.; Humphries, K.; Loiselle-Lapointe, A.; Stefopulos, N.; Varghese, S.; Pundsack, N. Impact of Ambient Temperature and Battery Activity on Internal Battery Temperatures of Electric Vehicles. In Proceedings of the 32nd International Electric Vehicle Symposium and Exhibition (EVS32), Lyon, France, 19–22 May 2019. [Google Scholar]
  33. J1939 Mini Logger. Available online: https://hemdata.com/products/dawn/j1939-mini-logger/ (accessed on 10 August 2022).
  34. Talebian, H.; Herrera, O.E.; Tran, M.; Mérida, W. Electrification of road freight transport: Policy implications in British Columbia. Energy Policy 2018, 115, 109–118. [Google Scholar] [CrossRef]
  35. Darcovich, K.; Recoskie, S.; Fattal, F. Fast operational mode switching effects on battery degradation. J. Appl. Electrochem. 2020, 50, 111–124. [Google Scholar] [CrossRef]
  36. Ontario Energy Board. Available online: https://www.oeb.ca/consumer-information-and-protection/electricity-rates (accessed on 10 March 2023).
  37. Tong, F.; Wolfson, D.; Jenn, A.; Scown, C.D.; Auffhammer, M. Energy consumption and charging load profiles from long-haul truck electrification in the United States. Environ. Res. Infrastruct. Sustain. 2021, 1, 025007. [Google Scholar] [CrossRef]
  38. Schmidt, F.; Jacob, B.; Domprobst, F. Investigation of truck weights and dimensions using WIM data. Transp. Res. Procedia 2016, 14, 811–819. [Google Scholar] [CrossRef]
Figure 1. Truck simulation 1152 km driving route along with elevation profile inset.
Wevj 15 00149 g001
Figure 2. Schematic showing first two driving day distances for truck 490, for both the 200 km off-highway and the 1152 km on-highway virtual routes.
Wevj 15 00149 g002
Figure 3. Hourly temperature data for three cities along the driving route taken by Environment Canada in 2020.
Wevj 15 00149 g003
Figure 4. Power flow configuration for simulation EHT. The inset in the green oval shows the truck battery pack.
Wevj 15 00149 g004
Figure 5. One second resolution speed profile from day 1 of the truck 490 data set.
Wevj 15 00149 g005
Figure 6. Interpretation of on-road one second data from day 1 of the truck 490 data set for integration into e-Hwy simulations.
Wevj 15 00149 g006
Figure 7. Battery pack EOL versus pack size using on-road driving profiles for BETs with megawatt charging.
Wevj 15 00149 g007
Figure 8. EOL versus daily km driven corresponding to the five individual trucks in the data set, simulated as BETs with 24-bank batteries.
Wevj 15 00149 g008
Figure 9. EOL versus DOD charging limit for 24-bank BET, comparing evening (Re) and morning (Rm) recharging strategies for the real-life driving profile data.
Wevj 15 00149 g009
Figure 10. Daily extra time for BET trips compared to the trip times for the data from diesel trucks, versus DOD charging limit for 24-bank BETs. The values are the average from five trucks.
Wevj 15 00149 g010
Figure 11. EOL vs battery pack size (in banks) for EHTs at 250, 300 and 400 kW P hwy levels, average value for all five trucks. Also shown is an EOL curve for a BET with the same range of battery pack sizes.
Wevj 15 00149 g011
Figure 12. Lifetime characteristics of the five EHTs operating on low power e-Hwys where mid-trip recharging operations were permitted. Plots versus daily average driving distance: (a) EOL given in years, (b) t extra in minutes per day, and (c) percentage of trips requiring mid-trip recharge.
Wevj 15 00149 g012
Table 1. Table of parameter value ranges for simulation cases. MTR refers to e-Hwy cases where mid-trip recharging was allowed.
Battery Pack Size
bankskWh/bank
8 to 2473
e-Hwy DWPT uptake
P hwy [kW]efficiency [%]
300–40085
recharge parameters
TypeDOD range
Morning rchgsmallest: 0.70–0.95
Evening rchglargest: 0.035–0.95
MTR
Table 2. Comparison of battery pack lifetimes and energy use efficiencies for maximum weight and empty long-haul transport trucks, simulated with the raw on-road data.
VehicleBattery P hwy WeightEOLEnergy Use
Pack Size (kW) (kg) (years) (kWh/km)
BET24 banks-36,000 (maximum)8.331.74
BET24 banks-16,000 (empty)10.391.21
EHT12 banks30036,000 (maximum)23.931.81
EHT12 banks30016,000 (empty)26.211.24
Disclaimer/Publisher’s Note: The statements, opinions and data contained in all publications are solely those of the individual author(s) and contributor(s) and not of MDPI and/or the editor(s). MDPI and/or the editor(s) disclaim responsibility for any injury to people or property resulting from any ideas, methods, instructions or products referred to in the content.

