Abstract
Over the past decade, enterprises have sought to minimize their ecological footprints through cleaner production strategies. Evidence can be gathered to support either the view that adopting environmental management standards (EMS) is a cost burden on firms and is detrimental to competitiveness, or that adopting standards increases savings giving firms competitive advantage in the long run. To resolve this seeming paradox in an emerging country context, the relationship between adopting EMS certificate and resource efficiency is examined empirically using a panel sample of 1333 manufacturing SMEs in Vietnam for the (2011–2013) period. Applying an instrumental variable approach, the results indicate that certification leads to resource savings reflected by less use of electricity, fuel and water for each unit of output. Additionally, there is a heterogeneous effect of certification on the extent of resource saving depending on the sector of operation. The paper also highlights determinants of certificate adoption among SMEs which should be considered in the promotion of environmental certificates, especially in developing countries. To successfully roll out the adoption of environmental certificates on a larger scale, better knowledge among business owners on potential competitive and environmental sustainability gains from EMS must be disseminated.
1. Introduction
In recent years, the importance of shifting to more sustainable patterns of consumption and production has been globally recognized. Such transition requires policies capable of promoting the adoption of production systems. This would enhance the efficient use of resources and reduce the negative externalities associated with the life cycle of product manufacture. Given the projected increase in global population and demand for raw materials, tackling concerns related to future resource scarcity will be key for sustainability. As such, policy makers have adopted a wide range of industrial policy instruments to hold business operations accountable for pollution and waste management [1,2]. Although most success stories of green industrial policies relate to large-scale enterprises in industrialized countries, little is known about the effectiveness of these policies on resource conservation in small and medium-sized enterprises (SMEs) in an emerging country context [2,3,4].
Achieving resource efficiency or conservation is more than just a question of environmental sustainability. Theoretical approaches to sustainability emphasize the role of environmentally sound technologies in reconciling reductions in resource use, while maintaining economic prosperity and social well-being [5,6]. From a technical point of view, these technologies can contribute to the reduction in environmental impacts by maximizing the input-output efficiency, i.e., higher output per unit of input [7,8]. Resource efficiency can be seen as a way to spur firms’ competitiveness through cost reductions or increases in revenues for example, by increased sales resulting from green reputation [7,9,10]. Beyond this, environmentally sound production techniques unlock additional competitive opportunities, as drivers of innovation [11] as well as opening new markets for firms in developing countries and higher profits [12,13,14,15,16,17,18,19].
Environmental management standards/systems (EMS) certificates are the set of organizational or technical procedures that firms undertake to reduce the environmental impact of their operations [20]. EMS have been increasingly adopted in Asia as a policy instrument designed to encourage industries to control, minimize and monitor environmental impact of producing goods and preventing ecological damage [21,22,23]. Vietnam is an example where such a policy instrument became mandatory for polluting industries of the manufacturing sector to address environmental degradation. Given the projected higher demand on raw material and energy, the government of Vietnam has highlighted the importance of EMS certification as a core element in its National Strategy for Environmental Protection for 2010–2020 [24]. Specifically, it aims to increase certification rate of EMS of manufacturing enterprises from 50% in 2010 to 80% by 2020. Since 97.6% of enterprises in Vietnam are small and medium-sized enterprises (SMEs) and which account for an estimated 40% of GDP in 2014 and 77% of total employment [25], the rate of compliance of SMEs is likely to determine success or failure of the national plan in environmental protection and cleaner production strategy [26].
Available empirical studies on the effectiveness of environmental policy instruments (such as EMS) suggest mixed evidence on firms’ market performance [27,28,29,30,31]. Only in recent years, the focus on SMEs environmental management practices in developing and emerging markets has grown due to their non-negligible environmental footprint [32]. The few empirical studies on developing countries typically focus on a set of economic (e.g., export, productivity) or financial indicators (e.g., return on assets, return on equity, profit margins) or study the determinants of adopting voluntary international standards certificates [3,12,13,21,23,33,34,35,36,37,38,39,40,41]. While achieving resource efficiency is claimed to be a by-product of EMS certification, such evidence is empirically lacking on two fronts: (1) on SMEs, which usually face financing or knowledge constraints, and (2) on emerging markets, who rely more on environmental resources for economic development [42].
Given this context, the paper fills this research gap and tests if the adoption of mandatory EMS certificates by SMEs in Vietnam contributes to resource efficiency in the manufacturing sector over the (2011–2013) period. Using a panel of 1333 manufacturing SMEs, I use resource costs (water, electricity and fuel) per unit of output as the dependent variable and apply an instrumental variable (IV) approach to control for endogeneity arising from the reverse causality between certificate adoption and resource efficiency. According to the World bank and the Vietnamese government definitions, small scale enterprises are up to 50 employees and medium-sized enterprises are up to 300 [43].
Three main findings emerge. First, the results show that adopting EMS certificates contributes to higher aggregate resource efficiency (i.e., less resource use for each unit of output). The high investment cost needed for installing the required equipment as well as the poor level of knowledge of environmental regulations partly explain the low adoption rate of certificates among SMEs. Second, the extent of resource efficiency differed between heavy and light industries, where higher resource saving is observed across firms in light industries. Also, there is no evidence that certification led to substitution between resources: water, fuel and electricity. Third, receiving government assistance (i.e., consulting services and subsidies) and using larger share of raw material from households contribute to higher resource efficiency.
The rest of the paper is structured as follows. Section 2 provides contextual background on industrial development and on EMS certification scheme in Vietnam. Section 3 presents the main theoretical framework and empirical evidence. Section 4 describes data and estimation strategy. Section 5 presents results and discusses main findings. Finally, Section 6 concludes, highlighting the policy implications.
2. Background and Context
2.1. Industrialization and Associated Environmental Problems
In recent years, the rapid industrial development in Vietnam spurred by the Doi Moi economic liberalization in 1986, followed by the country’s recent accession to the World Trade organization (WTO) in 2007 [44] have proved to be key drivers for economic growth and poverty reduction. Although Vietnam’s economic development started later than newly industrialized economies of Asia (Hong Kong, China, the Republic of Korea, Singapore) [45], its annual per capita GDP growth rate has grown from 2.9% in 1990 to 5.7% in 2017; a rate that exceeds newly industrialized economies. Industrial output made up on average 37.6% of GDP at current market prices for the 2000–2017 period compared to 20.5% of GDP from agriculture and forestry [45].
The country’s gradual transformation to a market economy is reflected in the shift from heavy industry to light industry, such as apparel, food and beverages, leather and wood products [46,47]. Currently, light and heavy industrial products and handicraft goods constitute 85% of total export value [48]. Most of the industrial production is concentrated in five provinces: Ha Noi and Hai Phong in the North and Ho Chi Minh City (HCMC), Binh Duong, and Dong Nai in the South [48]. The Government of Vietnam has set out targets in its Socio-Economic Development Plan, where it aims to reach industrialized nation status by 2020 with a focus on a group of industries, such as machinery and equipment serving agriculture, automobiles and mechanical spare parts, and steel for production [49].
Industrialization in Vietnam had negative environmental impacts, which provoked growing concerns about the rapid depletion of natural resources, pollution and wastewater discharge in resource intensive industries [46]. Of primary concern is the manufacture of chemicals, fertilizers and leather products due to their impact on air and water pollution [50]. Major pollution at three river basins (Cau, Nhue-Day and Sai Gon-Dong Nai) located in key industrial zones has already reached alarming levels due to metals, suspended solids and oil discharged into these rivers. In addition, industrial activities accounted for approximately 70% of sulfur dioxide emissions [51].
2.2. Environmental Regulations and EMS Certificates
The government of Vietnam took some steps in 2005 to promote sustainable industrial development by issuing the Environmental Protection law (No. 52/2005/QH11) [52]. The first version of the law was passed by the national assembly in 1993. The law aims to provide a foundational framework for managing the country’s resources in an environmentally sustainable way. According to the regulations of the law, it is mandatory for firms engaged in specific polluting sectors (the list of eligible sectors are detailed in Decree 29/2011, which includes 144 types of activities and excludes those of the recycling and services sectors.), regardless of legal status, to submit an environmental impact assessment (EIA) report of their activities to the State Environmental Protection Agency. The reports must include the following information: (i) assessment of the present state of the environment in the area of operation of the project or the enterprise; (ii) assessment of the effect exerted on the environment by the operation of the project/enterprise; and (iii) proposed plan and measures for environmental protection [53]. Firms are granted the certificate acknowledging satisfaction of environmental standards if they comply with the requirements set forth in the EIA, specifying the environmental factor firm owners are aiming to treat. These include addressing water pollution, air quality, waste disposal, soil degradation, noise and heat. The certificate is renewable and valid for a period of three years for enterprises using toxic or radioactive waste and for five years for other enterprises.
The number of national environmental management standards (referred to as TCVN) issued by national agencies has increased from 97 to more than 400 standards between 1996 and 2005. The directorate of Standardization, Metrology and Quality of Vietnam (STAMEQ) under the Ministry of Science and Technology is the institutional entity responsible for preparing national policies of standards and coordinating with different national and international agencies such as the ISO organization. The standards are developed based on regional and international experiences [54] and address ambient air, surface and ground water quality, industrial emissions, land and noise [55]. Since Vietnam’s WTO membership the system of standards is being developed progressively to conform with international economic and trade integration.
3. Theoretical Foundation and Literature Review
3.1. Theoretical Framework
Environmental policies may trigger certain organizational and technical innovations that contribute to both improving the environmental quality of products and to increasing the resource efficiency of products [56]. In the long run, efficiency gains related to input-cost reductions or material productivity may enhance firms’ competitiveness [8]. Koirala (2018) points out to several channels through which greening production in SMEs can reduce costs. These channels are; infrastructure efficiency (i.e., saving associated with insulation and heating, energy-efficiency lighting), materials savings (i.e., materials substitution, materials re-use or recycling), product design (i.e., redesign product to reduce packaging costs), and manufacturing efficiency (i.e., reduce waste through improved use of by-products and less input per unit) [57].
The debate on the relationship between environmental policy and firm’s competitiveness is centered around three main areas; whether, under which conditions and how environmental issues are related to innovation and competitiveness at the firm level [58,59]. As a result, three theoretical views have emerged. The first one is referred to as the ‘traditionalist’ view, and which reflects neo-classical theory [60]. It argues that environmental regulation measures tend to burden firms with higher production costs, while decreasing the marginal benefit of economic performance [30,61]. As such, the regulation is usually associated with additional costs that can have adverse effects on profitability, prices, innovation, productivity and investment decisions of the affected industries [62].
The competing view commonly known as the “revisionist view” [63] refer to the “porter hypothesis” [64]. This view suggests that properly implemented environmental regulation can increase firms comparative advantage and product quality and hence improve competitiveness and corporate image [10,65,66]. Pollution abatement costs or compliance costs are thus offset by reduction of expenditures on raw material and energy [59,60].
The third approach known as “resource-based” view supports the idea that there is no direct obvious link between environmental and economic performance of the firm [67]. Competitive gains are therefore dependent on capabilities, quantity and quality of enterprise resources as well as market conditions, such as consumers willingness to pay, business regulations and the available technology [6,68,69].
Advocates of the three approaches emphasize that not all forms of environmental regulations would generate the same positive/negative outcome. Much of the empirical evidence on the impact of environmental regulation on productivity and investment seem to be industry and methodology dependent [70]. Also, as argued by Testa et al. (2011) the different types of environmental regulations, whether they are direct regulations (i.e., command and control instruments such as standards and licensing), economic instruments (e.g., duties, tradeable emission permits) or soft instruments (e.g., voluntary industry agreements) and their degree of flexibility can have different effects on measures of competitive and environmental performance of firms [62,71].
3.2. Empirical Evidence
An extensive amount of research has been carried out that examines the impact of the different instruments of environmental regulations on environmental and financial performance of the firm [72]. Most empirical studies on EMS relate to voluntary international standards such as the ISO 14001 or the Eco-management and Audit Scheme (EMAS). Although international certificates are becoming increasingly adopted in developing countries, most studies have focused on enterprises or SMEs in industrialized countries [3], with little evidence on SMEs experience in developing countries, in general and on the causal link between EMS certificates and resource efficiency, in particular. The number of studies that consider SMEs growing contribution to environmental degradation and efficiency of resource use in developing countries remains small.
The context of application of the certificate and the strength of regulatory and institutional environments can determine how stakeholders and investors view the scheme of certification and hence can have different impact on financial or environmental outcomes [23]. For example, in the USA, ISO 14001 certified manufacturing firms did not report reduction in natural resource use, while in Japan the probability of reduction was significant and ranged between 0.24–0.56 for natural resource use, 0.35 for waste generation and 0.18 for waste water discharge [73]. Zobel (2013) compared the change in resource use for the 1997–2002 period in 2331 manufacturing firms in Sweden. Resource use of water and fuels in certified firms has increased by 1% but decreased by 7% in non-certified firms, while energy use has been reduced by 2% and 13% in both groups respectively [74].
In India, Shetty and Kumar (2017) report insignificant effect of the adoption of voluntary environmental program and environmental efficiency for 49 firms in the cement, steel and power sectors [75]. On the other hand, Singh et al. (2015) find that among 63 SMEs in Delhi and Noida, ISO 14001 certified SMEs achieved a reduction in waste by 25% in the manufacture and services sectors [4]. De Oliveira et al. (2010) mention that only 4.77% of 69 company managers in Brazil reported a reduction in energy, water, gas and fuel consumption after adoption of EMS [38]. A technical assistance program in Palestine deploying cleaner production methods in the leather tanning industry resulted in the reduction of water use by 58% [76]. Another cleaner production initiative was implemented in SMEs in Mexico during the (2005–2010) period. Raw material conservation recorded by firms was substantial (426,292 ton), in addition to water savings (15,438,427 m) and energy savings (1,102,145 ton CO) [77]. In Malaysia, the cost reduction from material saving was on average 16% among 18 firms which adopted EMS since 1998 [78]. Kamande and Lokina (2013) measure eco-efficiency of resources (water, fuel oil and electricity) resulting from EMS adoption in a sample of 235 manufacturing firms in Kenya during the 2001–2002 period. EMS adopters were more eco-efficient in the use of water and waste. However, eco-efficiency was insignificant for profitability [79].
Proponents of the “revisionist” view have found that EMS contribute to better financial performance of the firm when measured on indicators such as Tobin’s Q, return on assets (ROA), return on sales (ROS) and stock performance [18,80,81]. According to several authors, these positive effects could occur either through (1) increased market demand, domestically or internationally, for environmentally friendly products [16,82,83], or (2) improved productivity and innovation implementing new sustainable business models or green technologies which could save energy and result in eco-friendly product designs [22,41,68,84]. However, there is also evidence that these positive outcomes could be outweighed by the added costs of adopting certificates and the accompanying costs of installing new technology, trainings and maintenance fees [27,28,30,85]. These costs are expected to be substantially higher in less-developed and institutionally weak countries [12].
The heterogeneity of results on the relationship between environmental management of the firm and its economic performance could be attributed to three main factors. First, data availability has limited the applicability of causal estimation techniques to establish empirical relationship between environmental and firm performance. This constraint has often led to applying correlation tests or ANOVA tests [61]. The second factor is related to the research methodology. Often, authors do not control for endogeneity, i.e., it could be the case that firms which are already successful or being environmentally committed are adopting EMS [6,86]. This is likely to be problematic in voluntary environmental standards [1] since it would be difficult to distinguish between a “treatment effect” and a “selection effect” of EMS [87]. Third, the national context and the sector where the different types of EMS are being implemented could influence the results [85]. For example, the adoption of standards may have a different net effect across industries, sectors and even across countries, as Yang et al. (2011) find a positive effect of EMS on firm performance in a set of developed countries but such effect did not occur in developing countries [88]. As such, other factors like the stringency of environmental regulation, stakeholders trust, market structure, customer behavior, or macroeconomic institutional quality can mediate the relationship between EMS and firm performance [12,23].
The increasingly growing literature on firm owners’ motives for adopting management standards certification differentiate between internal and external benefits of certification. Internal benefits refer to the set of operational, financial or staff benefits at the firm level. Improved quality of management and training, improved working conditions and safety [41] and encouraging innovation and productivity [89] are associated with standards certification. Other internal benefits include cost savings from material, energy and waste reductions and increased employee motivation [32,90]. External benefits on the other hand refer to the positive outcomes from the implementation of an EMS that relate to the external interactions of a firm, and which can be grouped into environmental, commercial and communication benefits [32,91]. Achieving higher levels of customer satisfaction and gaining new customer base by tapping new markets which enhance competitive advantage are among the commercial benefits. Certificates as communication tools are capable of signaling to external suppliers, firms’ unobserved characteristics such as its credibility and reliability, thus improving its market image and reputation [12,86,92].
4. Data and Methodology
4.1. Data
To examine the impact of adopting national EMS certificate on resource efficiency in SMEs in Vietnam, I use secondary panel dataset of the small-scale manufacturing enterprise survey (SME) for the years 2011 and 2013 [93]. The survey instrument and data are publicly available at United Nations University World Institute for Development Economics Research (UNU-WIDER) dataset archive. The sample is representative at the province level and includes 10 out of the 64 provinces of Vietnam: Hanoi, Ha Tay, Hai Phong, Ho Chi Minh City (HCMC), Phu Tho, Nghe An, Quang Nam, Khanh Hoa, Lam Dong, and Long An. These provinces were selected for the fieldwork as they comprise about 30% of all manufacturing enterprises in 2005 when the sampling frame was established [43]. Data was collected based on face-to-face interviews in Vietnamese with owners/managers of enterprises during the months of June-August to assess Vietnamese business environment.
The enterprises surveyed are stratified by ownership type to cover the different legal ownership types, such as household-owned, limited liability, private, cooperative and joint stock ownership. Firms are distributed across approximately 17 manufacturing industry such as: food processing, fabricated metal products, chemicals and manufacturing of wood products. Table A1 in the Appendix A shows the overview of the distribution of enterprises across sectors. It is noticeable that the three largest sectors in terms of the number of enterprises are food and beverages, fabricated metal products, and manufacturing of wood products. Firms in the services and recycling sectors are dropped from the sample as they are not eligible for certification. Certification is mandatory for sectors that have an environmental protection commitment which cover all manufacturing activities/sectors in the dataset except for the services and recycling sectors.
The analysis is based on the balanced sample of enterprises which have participated in the two rounds of the survey between 2011 and 2013. This limits the sample size from 2892 firms (unbalanced) to 1333 (balanced). Although the survey round for 2015 is available, the question on resource cost was not included in the survey of 2015, which is crucial in constructing the dependent variable. This leads to limiting the period of study to 2011 and 2013. Other publicly available datasets on manufacturing enterprises in Vietnam such as the World Bank Enterprise Survey, GSO’s Technology and Competitiveness Survey and GSO’s Vietnam Enterprise Survey either have a limited sample size or lack the breadth of information needed to test the hypothesis.
The independent variable, which is the adoption of EMS certificates among manufacturing SMEs, is a binary variable denoting the status of adoption. Firm owners/managers were asked whether or not “they have certificate for registration of satisfaction of environmental standards”. Due to the likelihood of misreporting respondents were requested to show the certificate for verification by the survey team if they answered yes to the question. Regarding the main dependent variable, there are several approaches to define and measure resource efficiency at the firm level. Empirical studies have pointed out that efficiency is achieved by either increasing resource productivity or by reducing resource intensity [8,94,95,96].
In this paper, I use reported data on real total cost of resources (water, fuel and electricity) for each firm and the total output produced to construct a variable for resource intensity (RI). It is expressed as:
where represents the real total cost of resources in (million 2010 VND) of firm i at time t. is the total output units, such that .
4.2. Empirical Model
4.2.1. Panel Regression Method
The basic panel model specification to estimate the impact of certification on resource intensity is expressed as follows:
where i, s, p, t are subscripts representing the firm, sector, province and year, respectively; is the dependent variable reflecting firms’ resource intensity. EMS certificate is the key explanatory variable that indicates whether firm has adopted a certificate (a dummy variable equals one) or not; and is a vector of control variables at the firm level such as firm size, investments in new technology and association membership among other variables. Finally, I include the sector dummies (), province dummies (), legal status dummies () and year dummies () to capture the different forms of heterogeneity that might affect a firm’s performance. is the error term. Robust clustered errors are clustered at the firm level to account for heteroskedasticity.
4.2.2. Problem of Endogeneity: Instrumental Variable Approach
The regression may suffer from endogeneity for the following reasons. First, unobserved heterogeneity among firms (e.g., managerial style) that could be correlated with certification and resource efficiency, may bias the results. To address the bias from time-invariant unobservable characteristics, I use firm, sector, legal status and province fixed effects. Second, the problem of sample selection bias or reverse causality may arise, in the sense that already resource efficient firms may have a higher probability to adopt the certificate. Those firms might possess technical capabilities and willingness to innovate that make them more likely to engage in resource productive investments [97]. This raises the concern that OLS estimates may be biased. To address the endogeneity issue arising from time-varying unobservable heterogeneity, I apply a two-stage least square (2SLS) procedure using an instrumental variable (IV) [98].
As an instrument, I use an interaction variable between the share of EMS certificate adoption by sector-province-year and firm owners’ social network. To elaborate, the social network for firm i would be business owners operating in the same sector and province with which the owner of firm i has regular contact with. Knowledge about local competitors’ certification status is likely to be positively correlated with the individual firm owner decision to adopt the certificate, hence satisfying the relevance condition of an IV. On the other hand, knowledge about other firms certificate adoption is not directly related to the firm i resource intensity, thus satisfying the exogeneity condition of an IV. A similar rationale for choosing instruments for certificate adoption has been used in the literature, arguing that social networks as a source of information about standards among firms, can influence certificates adoption (see [41,89,99,100]). As such, firm owners located in provinces where there is a higher share of EMS certificate in their sector and with a larger social networks are more likely to be better informed about the certificate and, thus more likely to adopt it.
5. Results and Discussion
5.1. Results
5.1.1. Descriptive Statistics
Table 1 provides definitions of the main variables and the summary statistics regardless of certificate adoption for the balanced and unbalanced sample of firms. Although EMS certificates are mandatory by law, compliance rate is very low. It has slightly increased from 18% in 2011 to 20% only in 2013. In general, firms have experienced a fall in resources costs between 2011 and 2013, yet the share of those costs remained almost constant over time and constituted about 52% of the total indirect costs. The status of innovation among firms has deteriorated between 2011 and 2013 as the proportion of firms that have reported introducing a new technology or a new product group fell from 51% to 23%.

Table 1.
Summary Statistics for all Firms (2011–2013).
In Table 2, I report differences in means over the variables by certificate adoption using the balanced sample of firms. On average, certified firms tend to be approximately three times larger than non-certified ones, with average labor force size of 29 workers. Consequently, providing training of existing and new workers is likely to be observed in certified firms (27%). A higher share of certified firms has applied for formal loans and are engaged in e-trade for selling their outputs. The share of raw materials from households in the production process is relatively similar between certified and non-certified firms. Increasing shares of raw material from households are important in the context of measuring resource intensity because the use of resources would be different depending on whether the raw material is semi-manufactured, recycled or raw.
Table 2.
Differences in SME characteristics by Certification Status.
Some aspects related to the distribution of certified firms across provinces, legal status and sectors are shown in Figure 1. Approximately 40% of certified firms in the sample are in the food and beverages sector, followed by the rubber industry (11%) (panel a). In general, the share of adoption across sectors has either increased or remained constant over the (2011–2013) period. The decrease in certification rate between 2011 and 2013 in some sectors, for example, food and beverages, could be explained by either EMS certificate being revoked or non-renewed by the firm owner. With regards to the legal status of certified firms (panel b), on average two thirds of the certified firms are in the form of household enterprises. Over the survey years, several firms have changed their ownership type from household to limited liability, which explains the rise in the certification share for this particular type of ownership. The geographical distribution of certified firms (panel c) shows concentration of certified firms in two main provinces: Ho Chi Minh city (HCMC) and Hanoi.
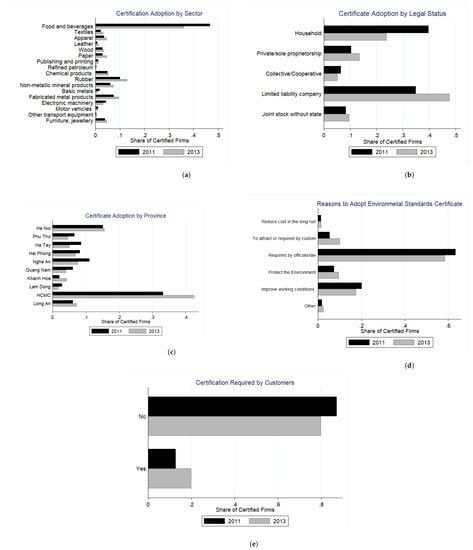
Figure 1.
Distribution of EMS certificate in Manufacturing Sector (2011–2013). Panel (a) Distribution across sectors; Panel (b) Distribution across ownership Status; Panel (c) Distribution across regions; Panel (d) Reasons of Adoption; Panel (e) Customers Request.
It is worth noting that firm owners have different motivations for adopting EMS. About 60% of certificate holders have reported that the main motivation for certification is compliance to the environmental law (panel d). Certificates are also expected to contribute to improving working condition for labor, probably through implementing some health and safety standards dictated by the certificate. A small share of certificate adopters believe that certificates are cost saving in the long run. The role of customers as stakeholders and pressure factors for adoption cannot be neglected in the case of Vietnam. Panel (e) shows that 20% of certificate holders acknowledge that they have been requested by customers to adopt EMS certificates, this effect is increasing over time. Due to data limitations, it is not clear whether those customers are local or foreign.
Another important factor determining the decision to adopt is related to the cost of certificate. The average cost of investment in equipment as a prerequisite for EMS certification varies according to which environmental factor is being treated as shown in Figure 2. For example, firm owners reported that the treatment of fire, heat and air quality requires on average investments below 50 million VND (The exchange rate is approximately 1 USD for 20,000 VND (Vietnamese Dong) for the 2011–2013 [101])), while on average, it costs approximately 130 million VND for treating water pollution.
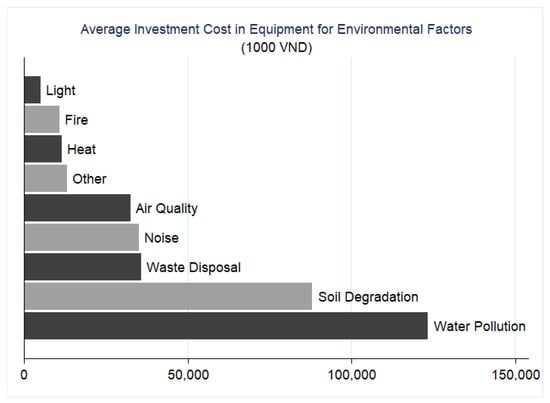
Figure 2.
Average Cost of Investment (2011–2013). Source: Author’s calculation based on Vietnamese manufacturing SMEs surveys for balanced sample (2011–2013).
5.1.2. Empirical Results
Table A2 in the appendix presents results on the likelihood of adopting an EMS certificate using different estimation models, including the first stage regression result for the two-stage least square of Equation (2) in columns (3–8). Although investments in physical innovations such as new machinery and introducing new technology do not have a significant effect on the probability of certification, firms which are actively engaged in online marketing and selling (e-trade) are more likely to be certified. The availability of capital as compared to labor is a significantly important variable in the decision to adopt certification as the coefficient on the capital-labor ratio is significant at 1% in all models, similar to the finding in the literature [41]. This variable could also enable the firm to increase its production capacity by 25% or higher in the next year, which is also significantly positive in explaining adoption.
As expected, the chosen instrument is positive and significant at 1% and 5% significance level in all model specifications, even when controlling for province, year, legal status and sector fixed effects. The first stage results show that for firms that are facing competition, and which are members of a business association tend to adopt the certificate. This finding is in line with Bansal and Bogner (2002) who argue that certification is a way for firms to improve their reputation, distinguish themselves and gain advantage over competitors [28].
Table 3 shows the results of the different estimation models, where the log of resource intensity is the dependent variable. Column (1) indicates that the effect of certificates on resource intensity using pooled OLS and without any controls or fixed effects is a decrease of about 39.6% (the coefficients for dummy variables are interpreted as 100[exp()-1] as it is a semi-log model specification). As resource efficiency could arise from unobserved heterogeneity, such as location of firms and legal status, as well as self-selection of firms, i.e., resource efficient firms will choose to be certified, fixed effects and instrumental variable approach are applied in columns (2–7). The results are consistent across most models showing that the adoption of EMS certificates in SMEs in the manufacturing sector contributes to reducing resource intensity by at least 74% depending on model specification. However, when either year or firm fixed effects are included (models 6 and 7), the coefficient is no longer significant. This suggests that firms unobserved heterogeneity is an important factor in explaining differences in resource savings across SMEs. Moreover, diagnostic tests of the instrument’s statistical validity include the Kleibergen–Paap Wald F-statistics and LM statistics for weak instrument and under-identification test. Results reported in Table A2 show that the instrument is valid as F-statistics is larger than 10 which is the rule of thumb suggested by Staiger and Stock (1997) [102].
Table 3.
Impact of EMS Certificates on Resource Intensity.
With regards to the control variables, receiving government assistance is likely to be an important factor in achieving resource efficiency, as it could be allocated for investments in new machinery or providing training, which can potentially decrease resource intensity as shown in columns (3) and (4). Although providing training and being engaged in innovative activities (i.e., improving an existing product, introducing new technology or product group) are expected to contribute to overall efficiency of production, this hypothesis is not supported by the results. There are two possible explanations for this finding. First, it could be that the type of training provided is not directly related to the efficient use of resources, for example training related to sales or marketing rather than a production or waste minimization related training. Second, there is a time lag between innovative activities or trainings and resource saving. it takes time for the adjustment in production lines to accommodate the new product or technology. Thus, longer time series would be needed to capture the dynamic effects of training and innovation on resource intensity.
Since resource costs account for more than 57% of total indirect cost of manufacturing SMEs in Vietnam, competition is argued to motivate firms to cut their resource consumption to enable firms to charge lower prices for their output [103]. This proposition is rejected by the results; firms facing competition have on average higher resource intensity at 10% significance level; however, this result is not robust across all models. In line with literature on resource efficiency, recycling and using raw materials from households are sources of reducing input cost [8,57]. The results show that using higher share of raw material from households (i.e., recycling) is likely to minimize resource use per unit of output.
I extend the results further and test the impact of EMS certificate on resource intensity disaggregated by the type of resource; electricity, fuel and water as it can be argued that implementing environmental standards might lead to a reallocation of resources, i.e., less use of water but more of electricity. The results in Table 4 do not support this hypothesis as there are efficiency gains across the three types of resources, with larger savings in electricity use and fuel consumption per unit of output compared to water consumption.
Table 4.
Disaggregated Resource Intensity by Resource.
Additionally, I test whether the magnitude of resource saving is uniform across the different types of industrial activities, since it has been shown that different industries react differently to environmental regulations (Wagner et al., 2002). In this respect, I divided the sectors of the sample into two groups; light industrial activities(include food and beverages, textile, apparel, wood, printing and publishing, leather and paper) and heavy industrial activities (including fabricated metal, machinery, refined petroleum, rubber, chemical products, furniture, basic metals, electronics, vehicles). Table 5 shows that EMS certificates have a heterogeneous effect on the extent of resource saving depending on the sector of operation. For example, light industrial activities achieved resource saving up till 98% depending on model specification at 1% significance level, while in heavy industrial activities, resource savings is still high but only with a threshold of 91%.
Table 5.
Disaggregated Resource Intensity by Type of Industrial Activity.
5.2. Robustness Checks
To check the validity of the results, I conduct two robustness test. First, I test if firms surveyed in both rounds of the survey in 2011 and 2013 (i.e., balanced sample) are not systematically different from firms existing in 2013 round with respect to their resource use. For that purpose, I replicated the main results of Table 3 using the unbalanced sample, following Verbeek and Nijman (1992) to test for selectivity bias [104]. Intuitively, if there is selection bias, then estimates from the balanced and unbalanced sample will be different. Results in Table A3 indicate that the average resource saving in the full sample is comparably similar to the estimates obtained using the balanced sample of firms. However, the coefficients on EMS certificate in models 5 and 6 are insignificant when full set of fixed effects are controlled for.
The second robustness check is related to testing the validity of the instrument, which follows the same application as in Trifković (2017) [41]. The falsification test rests on the idea that if the instrument is significant in explaining the adoption of EMS certificate using a probit model but is statistically insignificant on the dependent variable (resource intensity) for certificate non-adopters, then this suggests no direct effect of the IV on the dependent variable other than through EMS certificate adoption. The results of the significance of the IV on EMS has been shown and discussed earlier. Table A4 in Appendix B shows that the instrument is insignificant in explaining resource intensity in non-adopting firms using both the balanced and unbalanced samples. This result is an indication that the instrument is valid.
5.3. Discussion
The results show that on average certified SMEs in the manufacturing sector in Vietnam tend to have lower resource intensity than non-certified firms despite the fact that the real total cost of resources (water, fuel and electricity) and the share of those costs from total indirect costs are significantly higher in certified firms. This can be explained by: (1) the higher volume of production output in certified firms which is approximately 50% higher, and (2) the emphasis on employees training. This result is in line with previous findings of Goedhuys and Sleuwaegen (2013) [12] who find that certificates are associated with better managerial and operational practices that improve productivity of firms in developing countries. The size of the firm and the scale of operation are considered important dimensions affecting the ability of firms to bear the upfront cost of certification. Evidence in the literature support this finding [37,85,105].
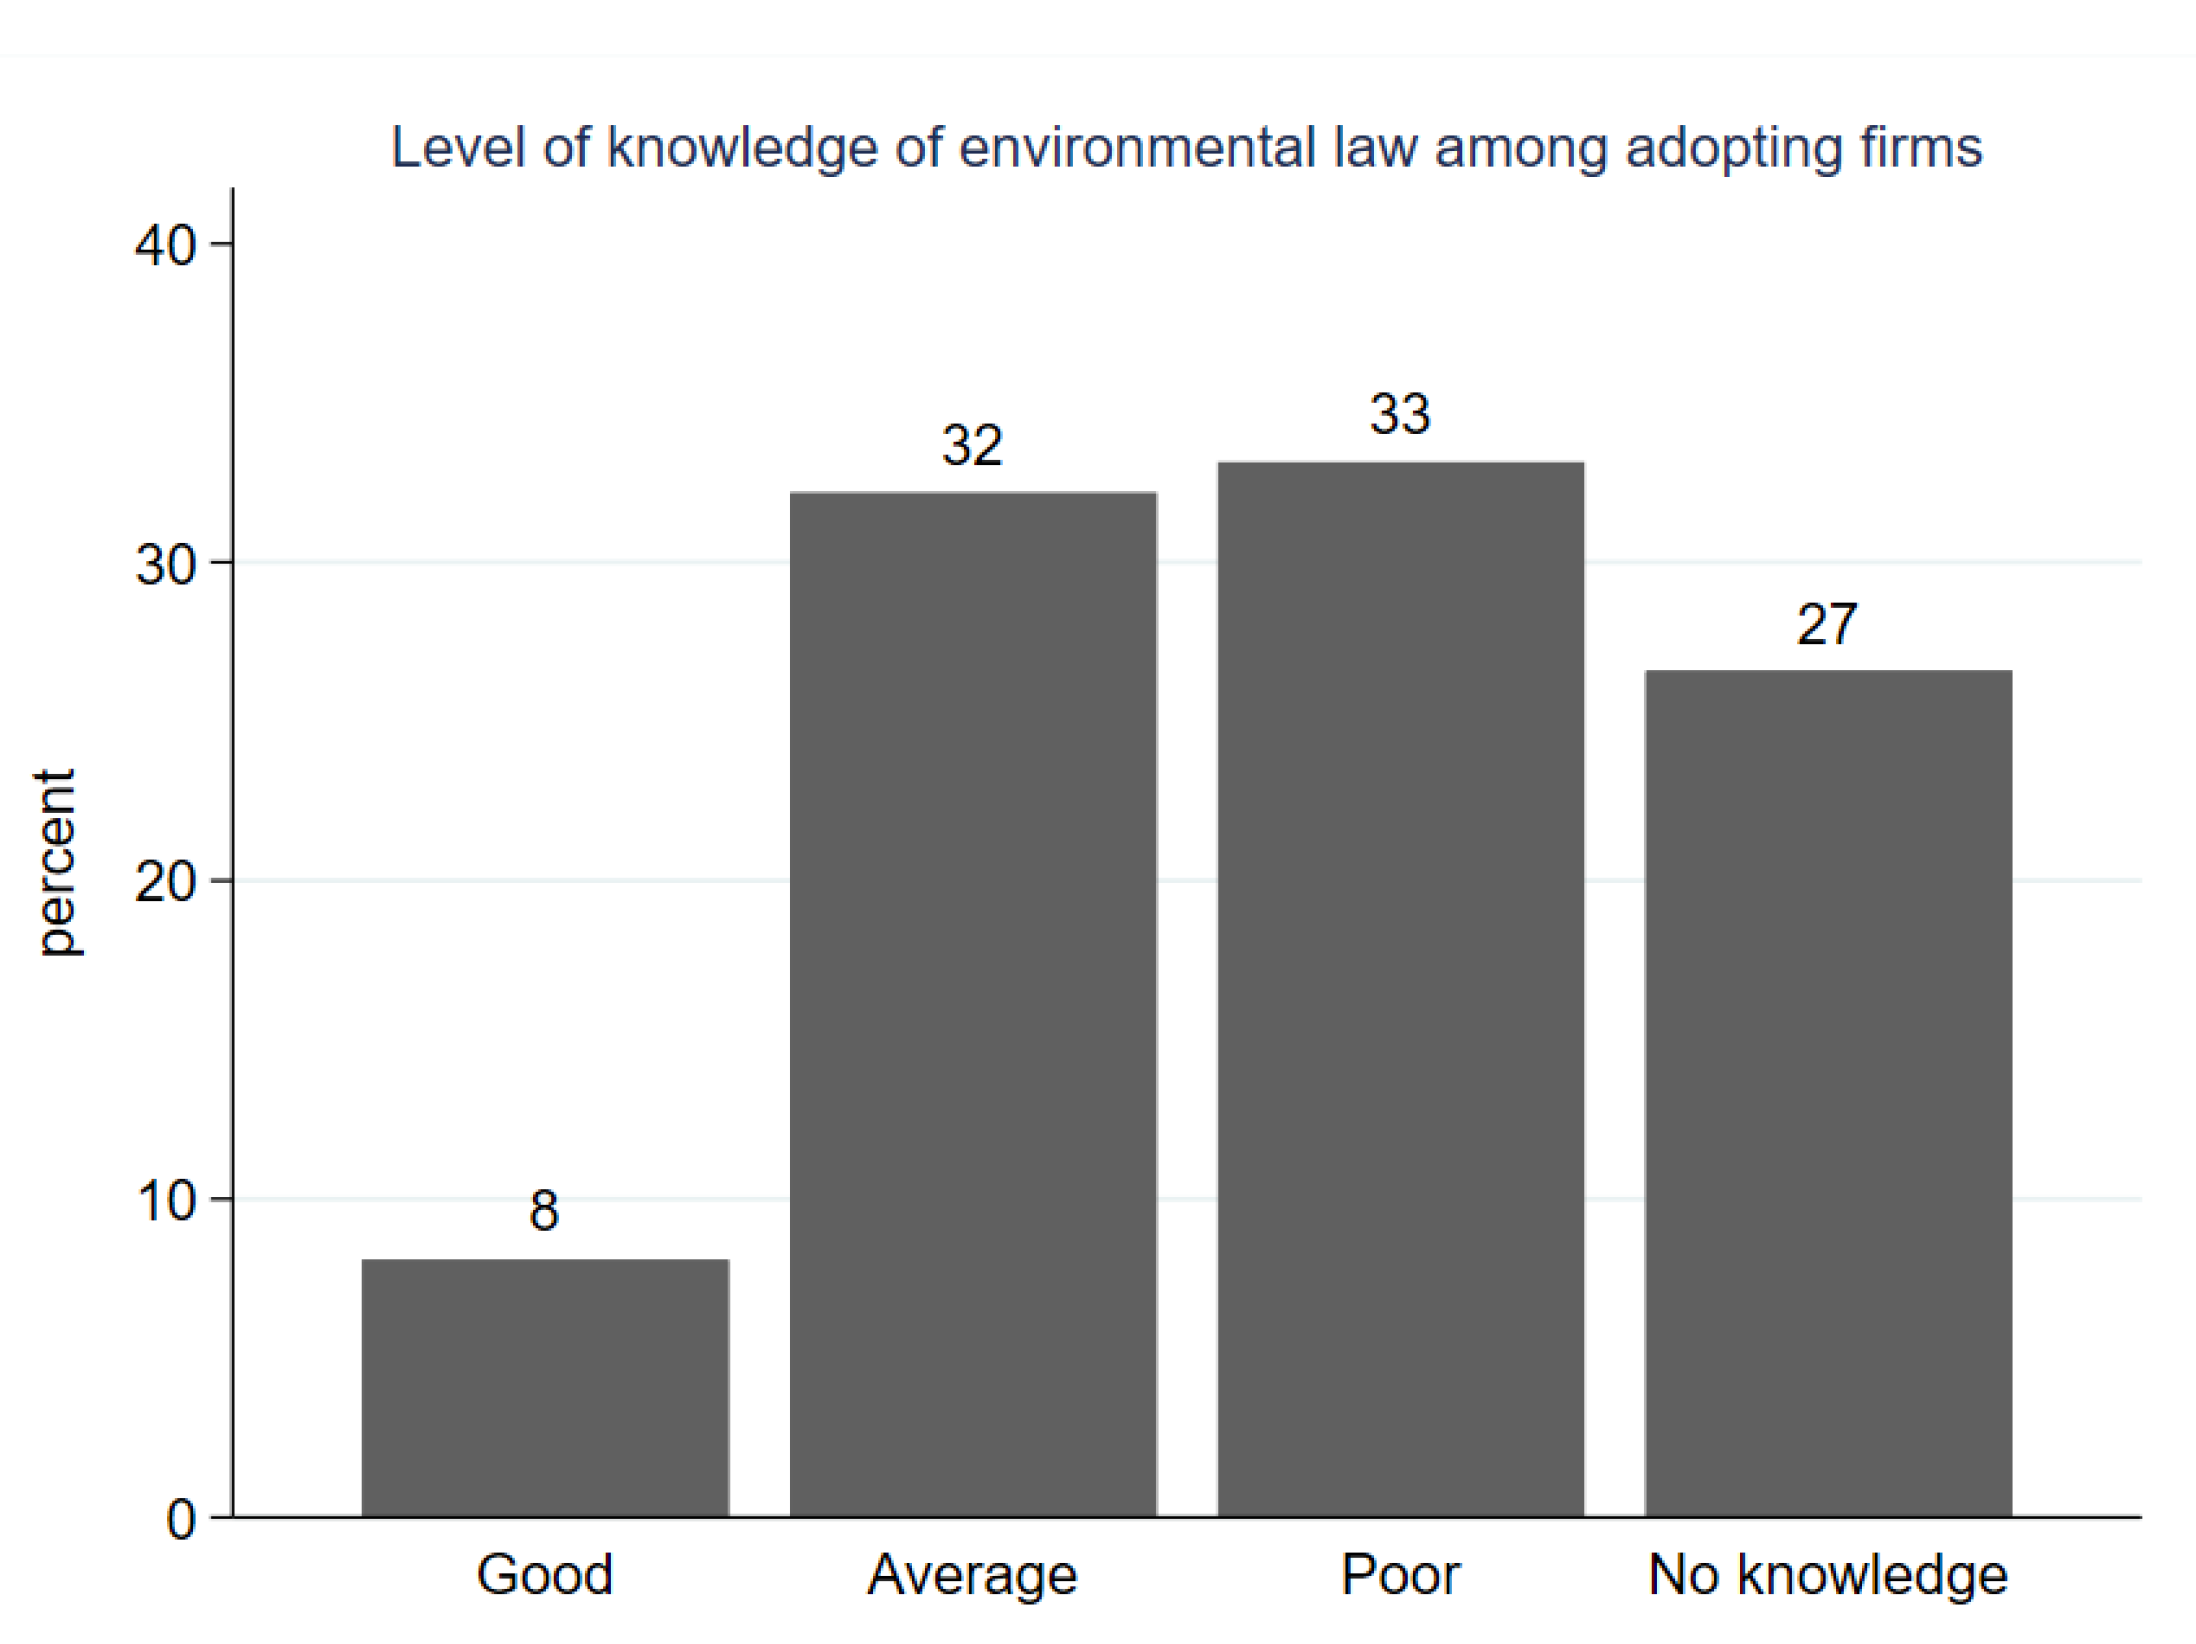
The level of knowledge about the certificates, especially when it is mandatory by law on manufacturing enterprises, influences adoption rate of EMS certificates. In the case of Vietnam, about 46% of the sampled firms had no knowledge about the environmental protection law in place. Such a high rate of lack of information in an environment where inspection capacities are weak justifies the low compliance rate (20% in 2013). Even among certificate holders, the trend is not very different. Figure A1 shows a similar trend where 27% of business owners reported no knowledge about the law. Although this is an area that requires government intervention, the picture is not totally bleak. The group of certified firms but without knowledge about the law have other motivations for adoption as highlighted in Figure 1 panel (d). The fact that there are very few firm owners that perceive the certificate as a potentially cost reducing instrument coincides with some views in the literature that the lack of awareness among SMEs on the potential benefits of improved environmental management. The belief that adopting EMS is just a matter of business survival—be it fear of fines or closure undermine successful implementation of EMS [106,107]
The magnitude and significance of coefficients on EMS certificates on resource intensity using the 2SLS IV estimates are different from OLS estimates, highlighting the endogeneity bias discussed earlier. The downward bias of OLS estimates compared to IV models have also been reported in other studies [41,84]. It indicates that unobserved heterogeneity is correlated negatively with EMS certificate.
6. Conclusions
The role of EMS certificates as effective tools to nudge producers towards sustainable production patterns is gaining interest in the literature; however, different aspects related to adoption barriers, incentives and outcomes of EMS certificates in emerging and developing countries still remain under-explored. Unlike the existing literature, this study goes beyond conventional economic, financial and organizational performance measures used in other studies to show that the adoption of EMS certificates contributes to improvements in resource use among manufacturing SMEs in Vietnam for the period 2011–2013. The extent of resource saving is heterogeneous across manufacturing activities where light industries stand to gain more from certification compared to heavy manufacturing activities.
The findings are not only relevant in the context of Vietnam, but also to many developing and emerging countries where SMEs are one of main engines of economic growth, diversification, sources of employment generation and innovation. In developing countries, SMEs contribute up to 45% of total employment and 33% of GDP [108], a rate that is comparable to Vietnam. Vietnam is a case of a successful structural transformation story that emerged from a combination of series of institutional reforms, trade liberalization and labor moving out of agriculture to higher value-added industries. As such, evidence on the effectiveness of specific environmental interventions on SMEs operation can be a valuable case study for countries embarking on manufacturing led development. Increasing consumer awareness about environmental degradation and the demand for goods that are produced in an environmentally friendly manner have accelerated EMS certificates in Vietnam. This finding epitomizes the notion that EMS certificates can be used by firms in developing countries for green marketing in developed countries.
Important policy implications emerge from this study. First, as the evidence shows, it might not the optimal choice for policy makers to impose one-size fits all environmental policy on firms in the manufacturing sector regardless of the type of industrial activity. Some industries are by nature more resource intensive and have higher environmental footprint, hence they might require more stringent policies and different monitoring system. Second, the high cost of implementing EMS and lack of knowledge of the benefits of certification among firms justify the need for higher governments financial and technical support to spur adoption of EMS certificates among SMEs.
The study is among the first studies on the impacts of mandatory EMS certificate on resource use in an emerging country context, implying that they could be tools to achieve the dual target of boosting competitiveness while being environmentally sustainable. Methodologically, the use of panel data and addressing the problem of endogeneity of certificate adoption by using a robust instrument is an improvement over existing studies using cross-section data. One limitation of this study is that I was not able to compare resource savings before and after adoption due to the shorter time frame and the very few firms who switched from non-adopter to adopters between 2011 and 2013.
This study identifies some avenues for future research. For example, more work is needed to identify and better understand the channels through which environmental management practices in industrial processes can improve resource productivity, and, more importantly, to understand what is the appropriate role of public policy in addressing the challenge of low adoption rates among SMEs. Also, comparative studies from a micro-economic perspective are needed, such as a comparison between the effectiveness of mandatory EMS certificates versus voluntary certificates (such as ISO 14001). Future work could also investigate further the reasons for the low adoption and compliance rates considering the long run benefits of certificates.
Funding
This research received no external funding.
Acknowledgments
I would like to thank participants at the research seminar of the Bio-economics division, KU Leuven for constructive feedback on an earlier version of the paper. Also, I am thankful to Francisco Pereira Fontes for useful comments on the overall paper, in general and on the methodology section, in particular.
Conflicts of Interest
The author declares no conflict of interest.
Abbreviations
The following abbreviations are used in this manuscript:
| EMS | Environmental Management Standards |
| FE | Fixed Effects |
| GOV | Government of Vietnam |
| GSO | General Statistics Office |
| IV | Instrumental Variable |
| SME | Small and Medium-Size Enterprises |
| WDI | World Development Indicators |
| WTO | World Trade Organization |
| 2SlS | Two-stage least squares |
Appendix A. Tables and Figures
Table A1.
Overview of the sample of manufacturing SMEs surveyed per year, by sector.
Table A1.
Overview of the sample of manufacturing SMEs surveyed per year, by sector.
| 2011 | 2013 | All Years, Balanced | All Years, Unbalanced | |||||
| Sector | Freq. | Percent | Freq. | Percent | Freq. | Percent | Freq. | Percent |
| Food and beverages | 301 | 22.58 | 298 | 22.36 | 599 | 22.47 | 1466 | 30.99 |
| Fabricated metal products | 275 | 20.63 | 275 | 20.63 | 550 | 20.63 | 842 | 17.80 |
| Wood | 136 | 10.20 | 144 | 10.80 | 280 | 10.50 | 491 | 10.38 |
| Furniture, jewelry | 130 | 9.75 | 125 | 9.38 | 255 | 9.56 | 392 | 8.29 |
| Rubber | 81 | 6.08 | 86 | 6.45 | 167 | 6.26 | 238 | 5.03 |
| Apparel | 81 | 6.08 | 73 | 5.48 | 154 | 5.78 | 235 | 4.97 |
| Non-metallic mineral products | 68 | 5.10 | 72 | 5.40 | 140 | 5.25 | 209 | 4.42 |
| Textiles | 57 | 4.28 | 64 | 4.80 | 121 | 4.54 | 192 | 4.06 |
| Electronic machinery | 46 | 3.45 | 44 | 3.30 | 90 | 3.38 | 129 | 2.73 |
| Paper | 41 | 3.08 | 41 | 3.08 | 82 | 3.08 | 131 | 2.77 |
| Publishing and printing | 30 | 2.25 | 27 | 2.03 | 57 | 2.14 | 108 | 2.28 |
| Chemical products etc. | 25 | 1.88 | 26 | 1.95 | 51 | 1.91 | 87 | 1.84 |
| Leather | 23 | 1.73 | 25 | 1.88 | 48 | 1.80 | 97 | 2.05 |
| Basic metals | 23 | 1.73 | 18 | 1.35 | 41 | 1.54 | 60 | 1.27 |
| Motor vehicles etc. | 9 | 0.68 | 8 | 0.60 | 17 | 0.64 | 26 | 0.55 |
| Other transport equipment | 4 | 0.30 | 3 | 0.23 | 7 | 0.26 | 14 | 0.30 |
| Refined petroleum etc. | 3 | 0.23 | 4 | 0.30 | 7 | 0.26 | 14 | 0.30 |
| Total | 1333 | 100.00 | 1333 | 100.00 | 2666 | 100.00 | 4731 | 100.00 |
Note: Includes only non-state manufacturing enterprises. The sampling frame of surveys was established in 2005, where the population of non-state manufacturing enterprises in the selected provinces was established based on two data sources from the General Statistics Office of Vietnam (GSO); the Establishment Census from 2002 and the Industrial Survey of 2002–2004. The enterprise population size was 164,468 (Rand and Tarp, 2012).
Table A2.
Determinants of EMS certificate Adoption.
Table A2.
Determinants of EMS certificate Adoption.
| Dependent Variable: Adoption of EMS Certificate | ||||||||
|---|---|---|---|---|---|---|---|---|
| (1) | (2) | (3) | (4) | (5) | (6) | (7) | (8) | |
| Variables | Probit Full | Probit Balance | 2SLS | 2SLS | 2SLS | 2SLS | 2SLS | 2SLS |
| Pooled | RE | |||||||
| EMS Adoption: IV | 0.364 *** | 0.306 *** | 0.290 *** | 0.199 *** | 0.191 *** | 0.088 ** | ||
| (0.023) | (0.023) | (0.024) | (0.026) | (0.027) | (0.043) | |||
| Firm Age (logs) | 0.0889 * | 0.111 | 0.005 | 0.006 | 0.002 | 0.001 | 0.266 *** | |
| (0.0497) | (0.120) | (0.012) | (0.013) | (0.013) | (0.014) | (0.091) | ||
| Firm size (logs) | 0.424 *** | 0.727 *** | 0.102 *** | 0.093 *** | 0.090 *** | 0.096 *** | −0.011 | |
| (0.0403) | (0.0997) | (0.011) | (0.013) | (0.012) | (0.012) | (0.025) | ||
| Innovation (dummy) | −0.143 ** | 0.0873 | −0.019 | −0.019 | 0.002 | −0.001 | 0.022 | |
| (0.0603) | (0.124) | (0.015) | (0.016) | (0.015) | (0.016) | (0.022) | ||
| Training (dummy) | 0.0235 | −0.168 | 0.012 | 0.002 | −0.002 | 0.001 | −0.014 | |
| (0.0630) | (0.120) | (0.018) | (0.018) | (0.017) | (0.018) | (0.023) | ||
| Intermediate output (%) | −0.00202 ** | −0.00130 | 0.000 | 0.000 | 0.000 | 0.000 | −0.000 | |
| (0.000902) | (0.00196) | (0.000) | (0.000) | (0.000) | (0.000) | (0.000) | ||
| Association (dummy) | 0.104 | 0.435 ** | 0.044 | 0.04 | 0.057 * | 0.060 ** | 0.040 | |
| (0.0951) | (0.213) | (0.029) | (0.030) | (0.030) | (0.030) | (0.048) | ||
| Loans (dummy) | 0.0638 | −0.0616 | 0.008 | 0.001 | 0.005 | −0.001 | −0.016 | |
| (0.0651) | (0.135) | (0.017) | (0.017) | (0.017) | (0.017) | (0.024) | ||
| Raw Material from Household (%) | −0.00352 | −0.0113 ** | −0.001 ** | −0.001 * | −0.002 *** | −0.002 *** | −0.001 | |
| (0.00256) | (0.00519) | (0.001) | (0.001) | (0.001) | (0.001) | (0.001) | ||
| KL Ratio | 0.168 *** | 0.231 *** | 0.025 *** | 0.031 *** | 0.019 *** | 0.023 *** | 0.014 | |
| (0.0274) | (0.0615) | (0.007) | (0.007) | (0.007) | (0.007) | (0.012) | ||
| Capacity (dummy) | 0.00907 | 0.255 ** | 0.030 ** | 0.028 * | 0.036 ** | 0.034 ** | 0.040 * | |
| (0.0601) | (0.126) | (0.015) | (0.015) | (0.015) | (0.015) | (0.023) | ||
| E-trade (dummy) | 0.126 | 0.316 | 0.067 * | 0.065 * | 0.059 * | 0.066 * | −0.022 | |
| (0.101) | (0.194) | (0.036) | (0.037) | (0.036) | (0.036) | (0.045) | ||
| Competition (dummy) | 0.0102 | 0.321 * | 0.034 | 0.031 | 0.037 * | 0.040 * | 0.030 | |
| (0.0918) | (0.188) | (0.023) | (0.023) | (0.023) | (0.023) | (0.035) | ||
| Assistance (dummy) | −0.0862 | −0.150 | −0.029 | −0.029 | −0.028 | −0.026 | −0.008 | |
| (0.0759) | (0.159) | (0.020) | (0.020) | (0.021) | (0.020) | (0.026) | ||
| Vintage (%) | −0.0000 | −0.00137 | 0.000 | 0.000 | 0.000 | 0.000 | 0.000 | |
| (0.00108) | (0.00224) | (0.000) | (0.000) | (0.000) | (0.000) | (0.000) | ||
| Constant | −2.703 *** | −3.900 *** | 0.068 *** | −0.221 *** | −0.297 *** | −0.061 | −0.128 * | 0.278 |
| (0.218) | (0.551) | (0.009) | (0.047) | (0.058) | (0.056) | (0.066) | (0.236) | |
| Observations | 3.680 | 2.662 | 2.666 | 2.666 | 2.666 | 2.666 | 2.666 | 2.666 |
| Number of id | 2.350 | 1.332 | 1.333 | 1.333 | 1.333 | 1.333 | 1.333 | 1.333 |
| R-squared Adj. | 0.1562 | 0.143 | 0.215 | 0.226 | 0.25 | 0.253 | ||
| t-stats | 15.58 | 13.23 | 12.02 | 7.67 | 7.14 | |||
| Legal FE | YES | YES | NO | NO | YES | YES | YES | NO |
| Province FE | YES | YES | NO | NO | YES | NO | YES | NO |
| Sector | NO | YES | NO | NO | NO | YES | YES | NO |
| Year FE | YES | YES | NO | NO | YES | YES | YES | YES |
| Firm FE | NO | NO | NO | NO | NO | NO | NO | YES |
| Kleibergen–Paap F-statistic (weak) | 242,606 | 175,04 | 144,694 | 58,978 | 51,043 | 4.178 | ||
| Kleibergen–Paap LM-statistic (under) | 134,677 | 125,488 | 110,373 | 45,012 | 40,296 | 8.282 | ||
| Cragg–Donald Wald F-statistic (weak) | 445,593 | 31,533 | 255,064 | 99,847 | 85,719 | 12,911 | ||
*, **, *** denote statistical significance at the 10%, 5% and 1% level, respectively. Numbers in parentheses represent clustered standard errors at the firm level. All numbers in the table were rounded to 3 decimal places. Real values are calculated using annual GDP deflator with 2010 as base year. Calculations are based on the balanced sample for the 2011 and 2013 waves.
Table A3.
Impact of EMS on Resource Intensity Using Unbalanced Sample.
Table A3.
Impact of EMS on Resource Intensity Using Unbalanced Sample.
| Dependent Variable: Resource Intensity (Logs) | ||||||
|---|---|---|---|---|---|---|
| Variables | (1) | (2) | (3) | (4) | (5) | (6) |
| EMS Certificate | −1.769 *** | −2.497 *** | −2.993 *** | −1.283 * | −0.182 | −3.592 |
| (0.395) | (0.572) | (0.586) | (0.760) | (0.835) | (3.208) | |
| Firm Age (logs) | 0.341 *** | −0.028 | −0.014 | −0.118 * | 1.084 | |
| (0.079) | (0.081) | (0.067) | (0.067) | (0.981) | ||
| Firm size (logs) | 0.088 | 0.271 *** | 0.091 | 0.1 | −0.077 | |
| (0.102) | (0.100) | (0.097) | (0.107) | (0.129) | ||
| Innovation (dummy) | −0.995 *** | 0.217 ** | 0.066 | 0.097 | 0.082 | |
| (0.115) | (0.099) | (0.085) | (0.082) | (0.123) | ||
| Training (dummy) | 1.075 *** | 0.197 | 0.223 ** | 0.158 | −0.008 | |
| (0.140) | (0.122) | (0.105) | (0.105) | (0.147) | ||
| Intermediate inputs (%) | −0.001 | 0.002 | −0.001 | 0 | −0.002 | |
| (0.002) | (0.002) | (0.001) | (0.001) | (0.002) | ||
| Association | 0.754 *** | 0.165 | 0.146 | −0.116 | −0.047 | |
| (0.191) | (0.174) | (0.155) | (0.154) | (0.274) | ||
| Loans (dummy) | 0.742 *** | 0.496 *** | 0.517 *** | 0.353 *** | 0.068 | |
| (0.122) | (0.109) | (0.094) | (0.093) | (0.141) | ||
| Raw material from households (%) | 0.039 *** | −0.001 | 0.001 | 0.006 | −0.015 *** | |
| (0.005) | (0.004) | (0.004) | (0.004) | (0.005) | ||
| KL ratio | −0.228 *** | 0.107 ** | 0.086 ** | 0.121 *** | 0.146 * | |
| (0.050) | (0.048) | (0.040) | (0.042) | (0.078) | ||
| Capacity | 0.286 ** | −0.025 | 0.092 | −0.055 | 0.085 | |
| (0.117) | (0.102) | (0.088) | (0.089) | (0.165) | ||
| E-trading (dummy) | 0.633 *** | 0.569 *** | 0.349 * | 0.286 | 0.636 *** | |
| (0.232) | (0.213) | (0.190) | (0.184) | (0.229) | ||
| Competition | 0.328 * | 0.07 | −0.096 | −0.093 | −0.086 | |
| (0.182) | (0.156) | (0.140) | (0.136) | (0.207) | ||
| Assistance (dummy) | −0.530 *** | −0.275 ** | −0.204 * | −0.190 * | −0.276 ** | |
| (0.159) | (0.132) | (0.116) | (0.112) | (0.138) | ||
| Vintage | 0 | 0 | 0 | −0.001 | 0 | |
| (0.002) | (0.002) | (0.001) | (0.001) | (0.002) | ||
| Constant | −0.965 *** | −1.823 *** | −4.231 *** | −4.648 *** | −4.751 *** | −0.313 |
| (0.078) | (0.337) | (0.374) | (0.262) | (0.295) | (1.609) | |
| Observations | 4733 | 3685 | 3685 | 3685 | 3685 | 3685 |
| Year FE | No | No | Yes | Yes | Yes | Yes |
| Province FE | No | No | Yes | No | Yes | No |
| Legal FE | No | No | Yes | Yes | Yes | No |
| Sector FE | No | No | No | Yes | Yes | No |
| Firm FE | No | No | No | No | No | Yes |
*, **, *** denote statistical significance at the 10%, 5% and 1% level, respectively. Numbers in parentheses represent clustered standard errors at the firm level. All models are IV estimates. All numbers in the table were rounded to 3 decimal places. Calculations of the balanced sample are based on 2011 and 2013 waves.
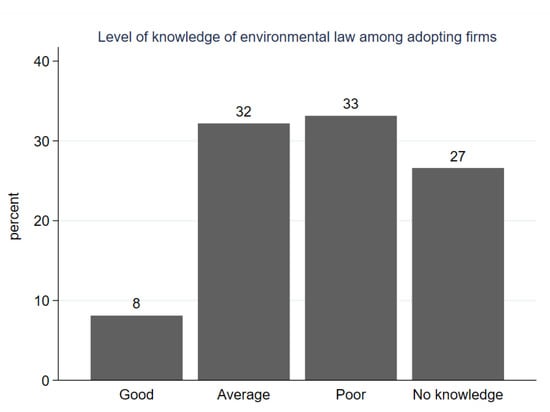
Figure A1.
Self-evaluation of firms about level of knowledge of the law. Source: Author’s calculation based on balanced sample of adopting firms (2011–2013). N = 519.
Figure A1.
Self-evaluation of firms about level of knowledge of the law. Source: Author’s calculation based on balanced sample of adopting firms (2011–2013). N = 519.
Appendix B. Robustness Checks Tests
Table A4.
Falsification Test of the Instrument.
Table A4.
Falsification Test of the Instrument.
| Dependent Variable: Resource Intensity (Logs) | ||
|---|---|---|
| Balanced | Unbalanced | |
| VARIABLES | Model 1 | Model 2 |
| IV | −0.122 | 0.0218 |
| (0.173) | (0.167) | |
| Constant | −4.637 *** | −4.455 *** |
| (0.389) | (0.323) | |
| Observations | 2147 | 2980 |
| Number of id | 1157 | 1990 |
| Legal FE | Yes | Yes |
| Province FE | Yes | Yes |
| Sector | Yes | Yes |
| Year FE | Yes | Yes |
Models 1 and 2 are fixed effects models on the sample of non-adopters of EMS certificates. Numbers in parentheses represent clustered standard errors at the firm level. All numbers in the table were rounded to 3 decimal places. Controls are the same as in Table 3.
References
- Borck, J.C.; Coglianese, C. Voluntary environmental programs: Assessing their effectiveness. Ann. Rev. Environ. Resour. 2009, 34, 305–324. [Google Scholar]
- Harrison, A.; Martin, L.A.; Nataraj, S. Green Industrial Policy in Emerging Markets. Ann. Rev. Resour. Econ. 2017, 9, 253–274. [Google Scholar]
- Ferenhof, H.A.; Vignochi, L.; Selig, P.M.; Lezana, Á.G.R.; Campos, L.M. Environmental management systems in small and medium-sized enterprises: An analysis and systematic review. J. Clean. Prod. 2014, 74, 44–53. [Google Scholar]
- Singh, M.; Brueckner, M.; Padhy, P.K. Environmental management system ISO 14001: Effective waste minimisation in small and medium enterprises in India. J. Clean. Prod. 2015, 102, 85–301. [Google Scholar]
- Chen, F.; Ngniatedema, T.; Li, S. A cross-country comparison of green initiatives, green performance and financial performance. Manag. Dec. 2018, 56, 1008–1032. [Google Scholar]
- Schaltegger, S.; Synnestvedt, T. The link between green and economic success: Environmental management as the crucial trigger between environmental and economic performance. J. Environ. Manag. 2002, 65, 339–346. [Google Scholar]
- Del Río González, P. Analysing the factors influencing clean technology adoption: A study of the Spanish pulp and paper industry. Bus. Strateg. Environ. 2005, 14, 20–37. [Google Scholar]
- Flachenecker, F.; Rentschler, J. (Eds.) Investing in Resource Efficiency: The Economics and Politics of Financing the Resource Transition; Springer: New York, NY, USA, 2018. [Google Scholar]
- Van Ewijk, S. An Introduction to Resource Efficiency: Concepts and Definitions. In Investing in Resource Efficiency: The Economics and Politics of Financing the Resource Transition; Flachenecker, F., Rentschler, J., Eds.; Springer: New York, NY, USA, 2018; pp. 13–29. [Google Scholar]
- Porter, M.E.; Van Der Linde, C. Toward a new conception of the environment-competitiveness relationship. J. Econ. Perspect. 1995, 9, 97–118. [Google Scholar]
- Shrivastava, P. Environmental technologies and competitive advantage. Strateg. Manag. J. 1995, 16, 183–200. [Google Scholar]
- Goedhuys, M.; Sleuwaegen, L. The impact of international standards certification on the performance of firms in less developed countries. World Dev. 2013, 47, 87–101. [Google Scholar]
- Goedhuys, M.; Sleuwaegen, L. International standards certification, institutional voids and exports from developing country firms. Int. Bus. Rev. 2016, 25, 1344–1355. [Google Scholar]
- Darnall, N.; Rigling Gallagher, D.; Andrews, R.N.; Amaral, D. Environmental management systems: Opportunities for improved environmental and business strategy? Environ. Qual. Manag. 2000, 9, 1–9. [Google Scholar]
- Khanna, M.; Damon, L. EPA’s voluntary 33/50 program: Impact on toxic releases and economic performance of firms. J. Environ. Econ. Manag. 1999, 37, 1–25. [Google Scholar]
- Fontagné, L.; Orefice, G.; Piermartini, R.; Rocha, N. Product standards and margins of trade: Firm-level evidence. J. Int. Econ. 2015, 97, 29–44. [Google Scholar]
- Nishitani, K. Demand for ISO 14001 adoption in the global supply chain: An empirical analysis focusing on environmentally conscious markets. Resour. Energy Econ. 2010, 32, 395–407. [Google Scholar]
- Nishitani, K. An empirical analysis of the effects on firms’ economic performance of implementing environmental management systems. Environ. Resour. Econ. 2011, 48, 569–586. [Google Scholar]
- Maertens, M.; Swinnen, J. Trade, Standards, and Poverty: Evidence from Senegal. World Dev. 2009, 37, 161–178. [Google Scholar]
- Cramer, J. Environmental management: From ‘fit’ to ‘stretch’. Bus. Strateg. Environ. 1998, 7, 162–172. [Google Scholar]
- Massoud, M.A.; Fayad, R.; Kamleh, R.; El-Fadel, M. Environmental Management System (ISO14001) Certification in Developing Countries: Challenges and Implementation Strategies. Environ. Sci. Technol. 2010, 44, 1884–1887. [Google Scholar]
- Pesce, M.; Shi, C.; Critto, A.; Wang, X.; Marcomini, A. SWOT analysis of the application of international standard ISO 14001 in the Chinese context. A case study of Guangdong Province. Sustainability 2018, 10, 3196. [Google Scholar]
- Riaz, H.; Saeed, A.; Baloch, M.S.; Khan, Z.A. Valuation of Environmental Management Standard ISO 14001: Evidence from an Emerging Market. J. Risk Financ. Manag. 2019, 12, 21. [Google Scholar]
- GOV. Decision No. 256/2003/QD-TTg on Approval of the National Environment Protection Strategies to 2010 with Vision to 2020. 2003. Available online: www.wisdom-vn.org/organisational_documents/legal_documents/en/Decision%2025-2003-QD-TTg.pdf (accessed on 3 March 2018).
- Yoshino, N.; Wignaraja, G. SMEs Internationalization and Finance in Asia; Asian Development Bank Institute: Tokyo, Japan, 2015; Available online: www.imf.org/external/np/seminars/eng/2015/jica2015/pdf/1-B1.pdf (accessed on 3 June 2018).
- GOV. Strategy on Cleaner Industrial Production to 2020. 2009. Available online: http://www.chinhphu.vn/portal/page/portal/English/strategies/strategiesdetails?categoryId=30&articleId=10051863 (accessed on 25 March 2018).
- Babakri, K.A.; Bennett, R.A.; Franchetti, M. Critical factors for implementing ISO 14001 standard in United States industrial companies. J. Clean. Prod. 2003, 11, 749–752. [Google Scholar]
- Bansal, P.; Bogner, W.C. Deciding on ISO 14001: Economics, institutions and context. Long Range Plan. 2002, 35, 269–290. [Google Scholar]
- Endrikat, J.; Guenther, E.; Hoppe, H. Making sense of conflicting empirical findings: A meta-analytic review of the relationship between corporate environmental and financial performance. Eur. Manag. J. 2014, 32, 735–751. [Google Scholar]
- Jaffe, A.B.; Peterson, S.R.; Portney, P.R.; Stavins, R.N. Environmental Regulation and International Competitiveness: What Does the Evidence Tell Us? J. Econ. Lit. 1995, 33, 132–163. [Google Scholar]
- Molina-Azorin, J.F.; Tarí, J.J.; Claver-Cortés, E.; López-Gamero, M.D. Quality management, environmental management and firm performance: A review of empirical studies and issues of integration. Int. J. Manag. Rev. 2009, 11, 197–222. [Google Scholar]
- Hillary, R. Environmental management systems and the smaller enterprise. J. Clean. Prod. 2004, 12, 561–569. [Google Scholar]
- Agan, Y.; Acar, M.F.; Borodin, A. Drivers of environmental processes and their impact on performance: A study of Turkish SMEs. J. Clean. Prod. 2013, 51, 23–33. [Google Scholar]
- Campos, L.M. Environmental management systems (EMS) for small companies: A study in Southern Brazil. J. Clean. Prod. 2012, 32, 141–148. [Google Scholar]
- Gavronski, I.; Ferrer, G.; Paiva, E.L. ISO 14001 certification in Brazil: Motivations and benefits. J. Clean. Prod. 2008, 16, 87–94. [Google Scholar]
- Nguyen, Q.A.; Hens, L. Environmental performance of the cement industry in Vietnam: The influence of ISO 14001 certification. J. Clean. Prod. 2015, 96, 362–378. [Google Scholar]
- Masakure, O.; Cranfield, J.; Henson, S. Factors affecting the incidence and intensity of standards certification evidence from exporting firms in Pakistan. Appl. Econ. 2011, 43, 901–915. [Google Scholar]
- De Oliveira, O.J.; Serra, J.R.; Salgado, M.H. Does ISO 14001 work in Brazil? J. Clean. Prod. 2010, 18, 1797–1806. [Google Scholar]
- Rao, P.; la O’Castillo, O.; Intal, P.S., Jr.; Sajid, A. Environmental indicators for small and medium enterprises in the Philippines: An empirical research. J. Clean. Prod. 2006, 14, 505–515. [Google Scholar]
- Seiffert, M.E.B. Environmental impact evaluation using a cooperative model for implementing EMS (ISO 14001) in small and medium-sized enterprises. J. Clean. Prod. 2008, 16, 1447–1461. [Google Scholar]
- Trifković, N. Spillover effects of international standards: Working Conditions in the Vietnamese SMEs. World Dev. 2017, 97, 79–101. [Google Scholar]
- Rietbergen-McCracken, J.; Abaza, H. (Eds.) Economic Instruments for Environmental Management: A Worldwide Compendium of Case Studies; Routledge: London, UK, 2014. [Google Scholar]
- Rand, J.; Tarp, F. Characteristics of the Vietnamese Business Environment: Evidence from a SME Survey in 2011; Central Institute for Economic Management (CIEM): Hanoi, Vietnam, 2012. [Google Scholar]
- The World Bank. The World bank in Vietnam (2018); The World Bank: Washington, DC, USA, 2018; Available online: www.worldbank.org/en/country/vietnam/overview (accessed on 21 January 2018).
- Asian Development Bank. Economic and Social Data: Viet Nam, Key Indicators; ADB Economic Research and Regional Cooperation Department (ERCD): Manila, Philippines, 2018. [Google Scholar]
- Frijns, J.; Phuong, P.T.; Mol, A.P. Developing countries: Ecological modernisation theory and industrialising economies: The case of Viet Nam. Environ. Politics 2000, 9, 257–292. [Google Scholar]
- Vu-Thanh, T.A. The Political Economy of Industrial Development in Viet Nam. In The Practice of Industrial Policy: Government-Business Coordination in Africa and East Asia; Oxford University Press: New York, NY, USA, 2017. [Google Scholar]
- GSO. General Statistics Office of Viet Nam. 2019. Available online: https://www.gso.gov.vn/default_en.aspx?tabid=780 (accessed on 18 February 2019).
- GOV. Resolution on Five-Year Socio-Economic Plan from 2016–2020. 2019. Available online: http://www.chinhphu.vn/portal/page/portal/English/strategies/strategiesdetails?categoryId=30&articleId=10057712 (accessed on 3 June 2018).
- Dore, G.; Brylski, P.; Nygard, J.; Tran, T.T.P. Review and Analysis of the Pollution Impacts from Vietnamese Manufacturing Sectors; The World Bank: Washington, DC, USA, 2008. [Google Scholar]
- Hoang, T.A.; Chu, N.X.; Van Tran, T. The Environmental Pollution In Vietnam: Source, Impact and Remedies. Int. J. Sci. Technol. Res. 2017, 6, 249–253. [Google Scholar]
- GOV. Law on Environmental Protection No. 52/2005/QH11. 2005. Available online: https://www.ilo.org/dyn/natlex/natlex4.detail?p_lang=en&p_isn=73671&p_country=VNM&p_count=548 (accessed on 30 March 2018).
- GOV. Decree No. 175/CP on Providing Guidance for the Implementation of the Law on Environmental Protection. 1994. Available online: https://www.aecen.org/sites/default/files/vietnam_eia_decree_175cp_1994.pdf (accessed on 2 March 2018).
- IISD International Institute for Sustainable Development. Trade and Sustainable Development in Vietnam Report; IISD: Winnepeg, MB, Canada, 2003. [Google Scholar]
- USAID. Vietnam 2005 Rapid Country Assessment Report: Environmental Compliance and Enforcement Program; USAID: Washington, DC, USA, 2005. [Google Scholar]
- Rennings, K. Redefining innovation-ecoinnovation research and the contribution from ecological economics. Ecol. Econ. 2000, 32, 319–332. [Google Scholar]
- Koilara, S. SMEs: Key Drivers of Green and Inclusive Growth; OECD Policy Paper; OECD: Paris, France, 2018. [Google Scholar]
- Iraldo, F.; Testa, F.; Frey, M. Is an environmental management system able to influence environmental and competitive performance? The case of the eco-management and audit scheme (EMAS) in the European union. J. Clean. Prod. 2009, 17, 1444–1452. [Google Scholar]
- Ambec, S.; Lanoie, P. Does it pay to be green? A systematic overview. Acad. Manag. Perspect. 2008, 22, 45–62. [Google Scholar]
- Wagner, M.; Van Phu, N.; Azomahou, T.; Wehrmeyer, W. The relationship between the environmental and economic performance of firms: An empirical analysis of the European paper industry. Corp. Soc. Responsib. Environ. Manag. 2002, 9, 133–146. [Google Scholar]
- Wagner, M.; Schaltegger, S.; Wehrmeyer, W. The relationship between the environmental and economic performance of firms. Greener Manag. Int. 2001, 34, 94–111. [Google Scholar]
- Testa, F.; Iraldo, F.; Frey, M. The effect of environmental regulation on firms’ competitive performance: The case of the building and construction sector in some EU regions. J. Environ. Manag. 2011, 92, 2136–2144. [Google Scholar]
- Horváthová, E. Does environmental performance affect financial performance? A meta-analysis. Ecol. Econ. 2010, 70, 52–59. [Google Scholar]
- Porter, M.E. America’s Green Strategy. Sci. Am. 1991, 264, 168. [Google Scholar]
- Babool, A.; Reed, M. The impact of environmental policy on international competitiveness in manufacturing. Appl. Econ. 2010, 42, 2317–2326. [Google Scholar]
- Lanoie, P.; Laurent-Lucchetti, J.; Johnstone, N.; Ambec, S. Environmental policy, innovation and performance: New insights on the Porter hypothesis. J. Econ. Manag. Strateg. 2011, 20, 803–842. [Google Scholar]
- Hart, S.L. A natural-resource-based view of the firm. Acad. Manag. Rev. 1995, 20, 986–1014. [Google Scholar]
- Hart, S.L.; Ahuja, G. Does it pay to be green? An empirical examination of the relationship between emission reduction and firm performance. Bus. Strateg. Environ. 1996, 5, 30–37. [Google Scholar]
- Russo, M.V.; Fouts, P.A. A resource-based perspective on corporate environmental performance and profitability. Acad. Manag. J. 1997, 40, 534–559. [Google Scholar]
- Jaffe, A.B.; Newell, R.G.; Stavins, R.N. Environmental policy and technological change. Environ. Resour. Econ. 2002, 22, 41–70. [Google Scholar]
- Hawkins, R. The use of economic instruments and green taxes to complement an environmental regulatory regime. Water Air Soil Pollut. 2000, 123, 379–394. [Google Scholar]
- Blanco, E.; Rey-Maquieira, J.; Lozano, J. The economic impacts of voluntary environmental performance of firms: A critical review. J. Econ. Surv. 2009, 23, 462–502. [Google Scholar]
- Arimura, T.H.; Hibiki, A.; Katayama, H. Is a voluntary approach an effective environmental policy instrument? A case for environmental management systems. J. Environ. Econ. Manag. 2008, 55, 281–295. [Google Scholar]
- Zobel, T. ISO 14001 certification in manufacturing firms: A tool for those in need or an indication of greenness? J. Clean. Prod. 2005, 43, 37–44. [Google Scholar]
- Shetty, S.; Kumar, S. Are voluntary environment programs effective in improving the environmental performance: Evidence from polluting Indian Industries. Environ. Econ. Policy Stud. 2017, 19, 659–676. [Google Scholar]
- Nazer, D.W.; Siebel, M.A. Reducing the environmental impact of the unhairing-liming process in the leather tanning industry. J. Clean. Prod. 2006, 14, 65–74. [Google Scholar]
- Van Hoof, B.; Lyon, T.P. Cleaner production in small firms taking part in Mexico’s Sustainable Supplier Program. J. Clean. Prod. 2013, 41, 270–282. [Google Scholar]
- Tan, L.P. Implementing ISO 14001: Is it beneficial for firms in newly industrialized Malaysia? J. Clean. Prod. 2005, 13, 397–404. [Google Scholar]
- Kamande, M.W.; Lokina, R.B. Clean production and profitability: An eco-efficiency analysis of kenyan manufacturing firms. J. Environ. Dev. 2013, 22, 169–185. [Google Scholar]
- Dowell, G.; Hart, S.; Yeung, B. Do corporate global environmental standards create or destroy market value? Manag. Sci. 2000, 46, 1059–1074. [Google Scholar]
- Ziegler, A.; Schröoder, M.; Rennings, K. The effect of environmental and social performance on the stock performance of European corporations. Environ. Resour. Econ. 2007, 37, 661–680. [Google Scholar]
- Konar, S.; Cohen, M.A. Does the market value environmental performance? Rev. Econ. Stat. 2001, 83, 2814–2890. [Google Scholar]
- Bellesi, F.; Lehrer, D.; Tal, A. Comparative advantage: The impact of ISO 14001 environmental certification on exports. Environ. Sci. Technol. 2005, 39, 1943–1953. [Google Scholar]
- Delmas, M.A.; Pekovic, S. Environmental standards and labor productivity: Understanding the mechanisms that sustain sustainability. J. Organ. Behav. 2013, 34, 230–252. [Google Scholar]
- King, A.; Lenox, M. Who Adopts Management Standards Early? An Examination of ISO 14001 Certifications. Proc. Acad. Manag. Ann. Conf. 2001, 2001, A1–A6. [Google Scholar]
- Potoski, M.; Prakash, A. Green clubs and voluntary governance: ISO 14001 and firms’ regulatory compliance. Am. J. Political Sci. 2005, 49, 235–248. [Google Scholar]
- Heras-Saizarbitoria, I.; Molina-Azorín, J.F.; Dick, G.P. ISO 14001 certification and financial performance: Selection-effect versus treatment-effect. J. Clean. Prod. 2011, 19, 1–12. [Google Scholar]
- Yang, M.G.M.; Hong, P.; Modi, S.B. Impact of lean manufacturing and environmental management on business performance: An empirical study of manufacturing firms. Int. J. Prod. Econ. 2011, 129, 251–261. [Google Scholar]
- Calza, E.; Goedhuys, M.; Trifković, N. Drivers of productivity in Vietnamese SMEs: The role of management standards and innovation. Econ. Innov. New Technol. 2019, 28, 23–44. [Google Scholar]
- Sampaio, P.; Saraiva, P.; Guimarães Rodrigues, A. ISO 9001 Certification Research: Questions, Answers and Approaches’. Int. J. Qual. Reliab. Manag. 2009, 26, 38–58. [Google Scholar]
- Sartor, M.; Orzes, G.; Touboulic, A.; Culot, G.; Nassimbeni, G. ISO 14001 standard: Literature review and theory-based research agenda. Qual. Manag. J. 2019, 26, 32–64. [Google Scholar]
- Djupdal, K.; Westhead, P. Environmental certification as a buffer against the liabilities of newness and smallness: Firm performance benefits. Int. Small Bus. J. 2015, 33, 148–168. [Google Scholar]
- Viet Nam SME Survey. CIEM, ILSSA, UCPH, and UNU-WIDER (2011 and 2013 Rounds). Available online: https://www.wider.unu.edu/database/viet-nam-sme-database (accessed on 10 February 2018).
- Cleveland, C.J.; Ruth, M. Indicators of Dematerialization and the Materials Intensity of Use. J. Ind. Ecol. 1998, 2, 15–50. [Google Scholar]
- Bahn-Walkowiak, B.; Steger, S. Resource targets in Europe and worldwide: An overview. Resources 2015, 4, 597–620. [Google Scholar]
- OECD. Resource Productivity in the G8 and the OECD: A Report in the Framework of the Kobe 3R Action Plan; OECD Publishing: Paris, France, 2011; Available online: http://www.oecd.org/env/waste/47944428.pdf (accessed on 20 May 2018).
- Calantone, R.J.; Cavusgil, S.T.; Zhao, Y. Learning orientation, firm innovation capability, and firm performance. Ind. Market. Manag. 2002, 31, 515–524. [Google Scholar]
- Wooldridge, J. Econometric Analysis of Cross-Section and Panel Data; The MIT Press: Cambridge, MA, USA; London, UK, 2002. [Google Scholar]
- Halila, F. Networks as a means of supporting the adoption of organizational innovations in SMEs: The case of Environmental Management Systems (EMSs) based on ISO 14001. Corp. Soc. Responsib. Environ. Manag. 2007, 14, 167–181. [Google Scholar]
- Barla, P. ISO 14001 certification and environmental performance in Quebec’s pulp and paper industry. J. Environ. Econ. Manag. 2007, 53, 291–306. [Google Scholar]
- World Development Indicators Database. Available online: https://databank.worldbank.org/source/world-development-indicators (accessed on 30 June 2018).
- Staiger, D.; Stock, J.H. Instrumental variables regression with weak instruments. Econometrica 1997, 65, 557–586. [Google Scholar]
- Fischer, S.; O’Brien, M. Eco-innovation in Business: Reducing cost and increasing profitability via Material Efficiency Measures. Eco-Innov. Obs. 2012, 10, 1–6. [Google Scholar]
- Verbeek, M.; Nijman, T. Testing for selectivity bias in panel data models. Int. Econ. Rev. 1992, 33, 681–703. [Google Scholar]
- Nakamura, M.; Takahashi, T.; Vertinsky, I. Why Japanese Firms Choose to Certify: A Study of Managerial Responses to Environmental Issues. J. Environ. Econ. Manag. 2001, 42, 23–52. [Google Scholar]
- Hillary, R. (Ed.) Small and Medium-Sized Enterprises and the Environment: Business Imperatives; Greenleaf Publishing: Sheffield, UK, 2000. [Google Scholar]
- Biondi, V.; Frey, M.; Iraldo, F. Environmental management systems and SMEs. Greener Manag. Int. 2000, 29, 55–69. [Google Scholar]
- OECD. Enhancing the Contributions of SMEs in Global and Digitalised Economy; OECD Publishing: Paris, France, 2017; Available online: https://www.oecd.org/industry/C-MIN-2017-8-EN.pdf (accessed on 20 August 2020).
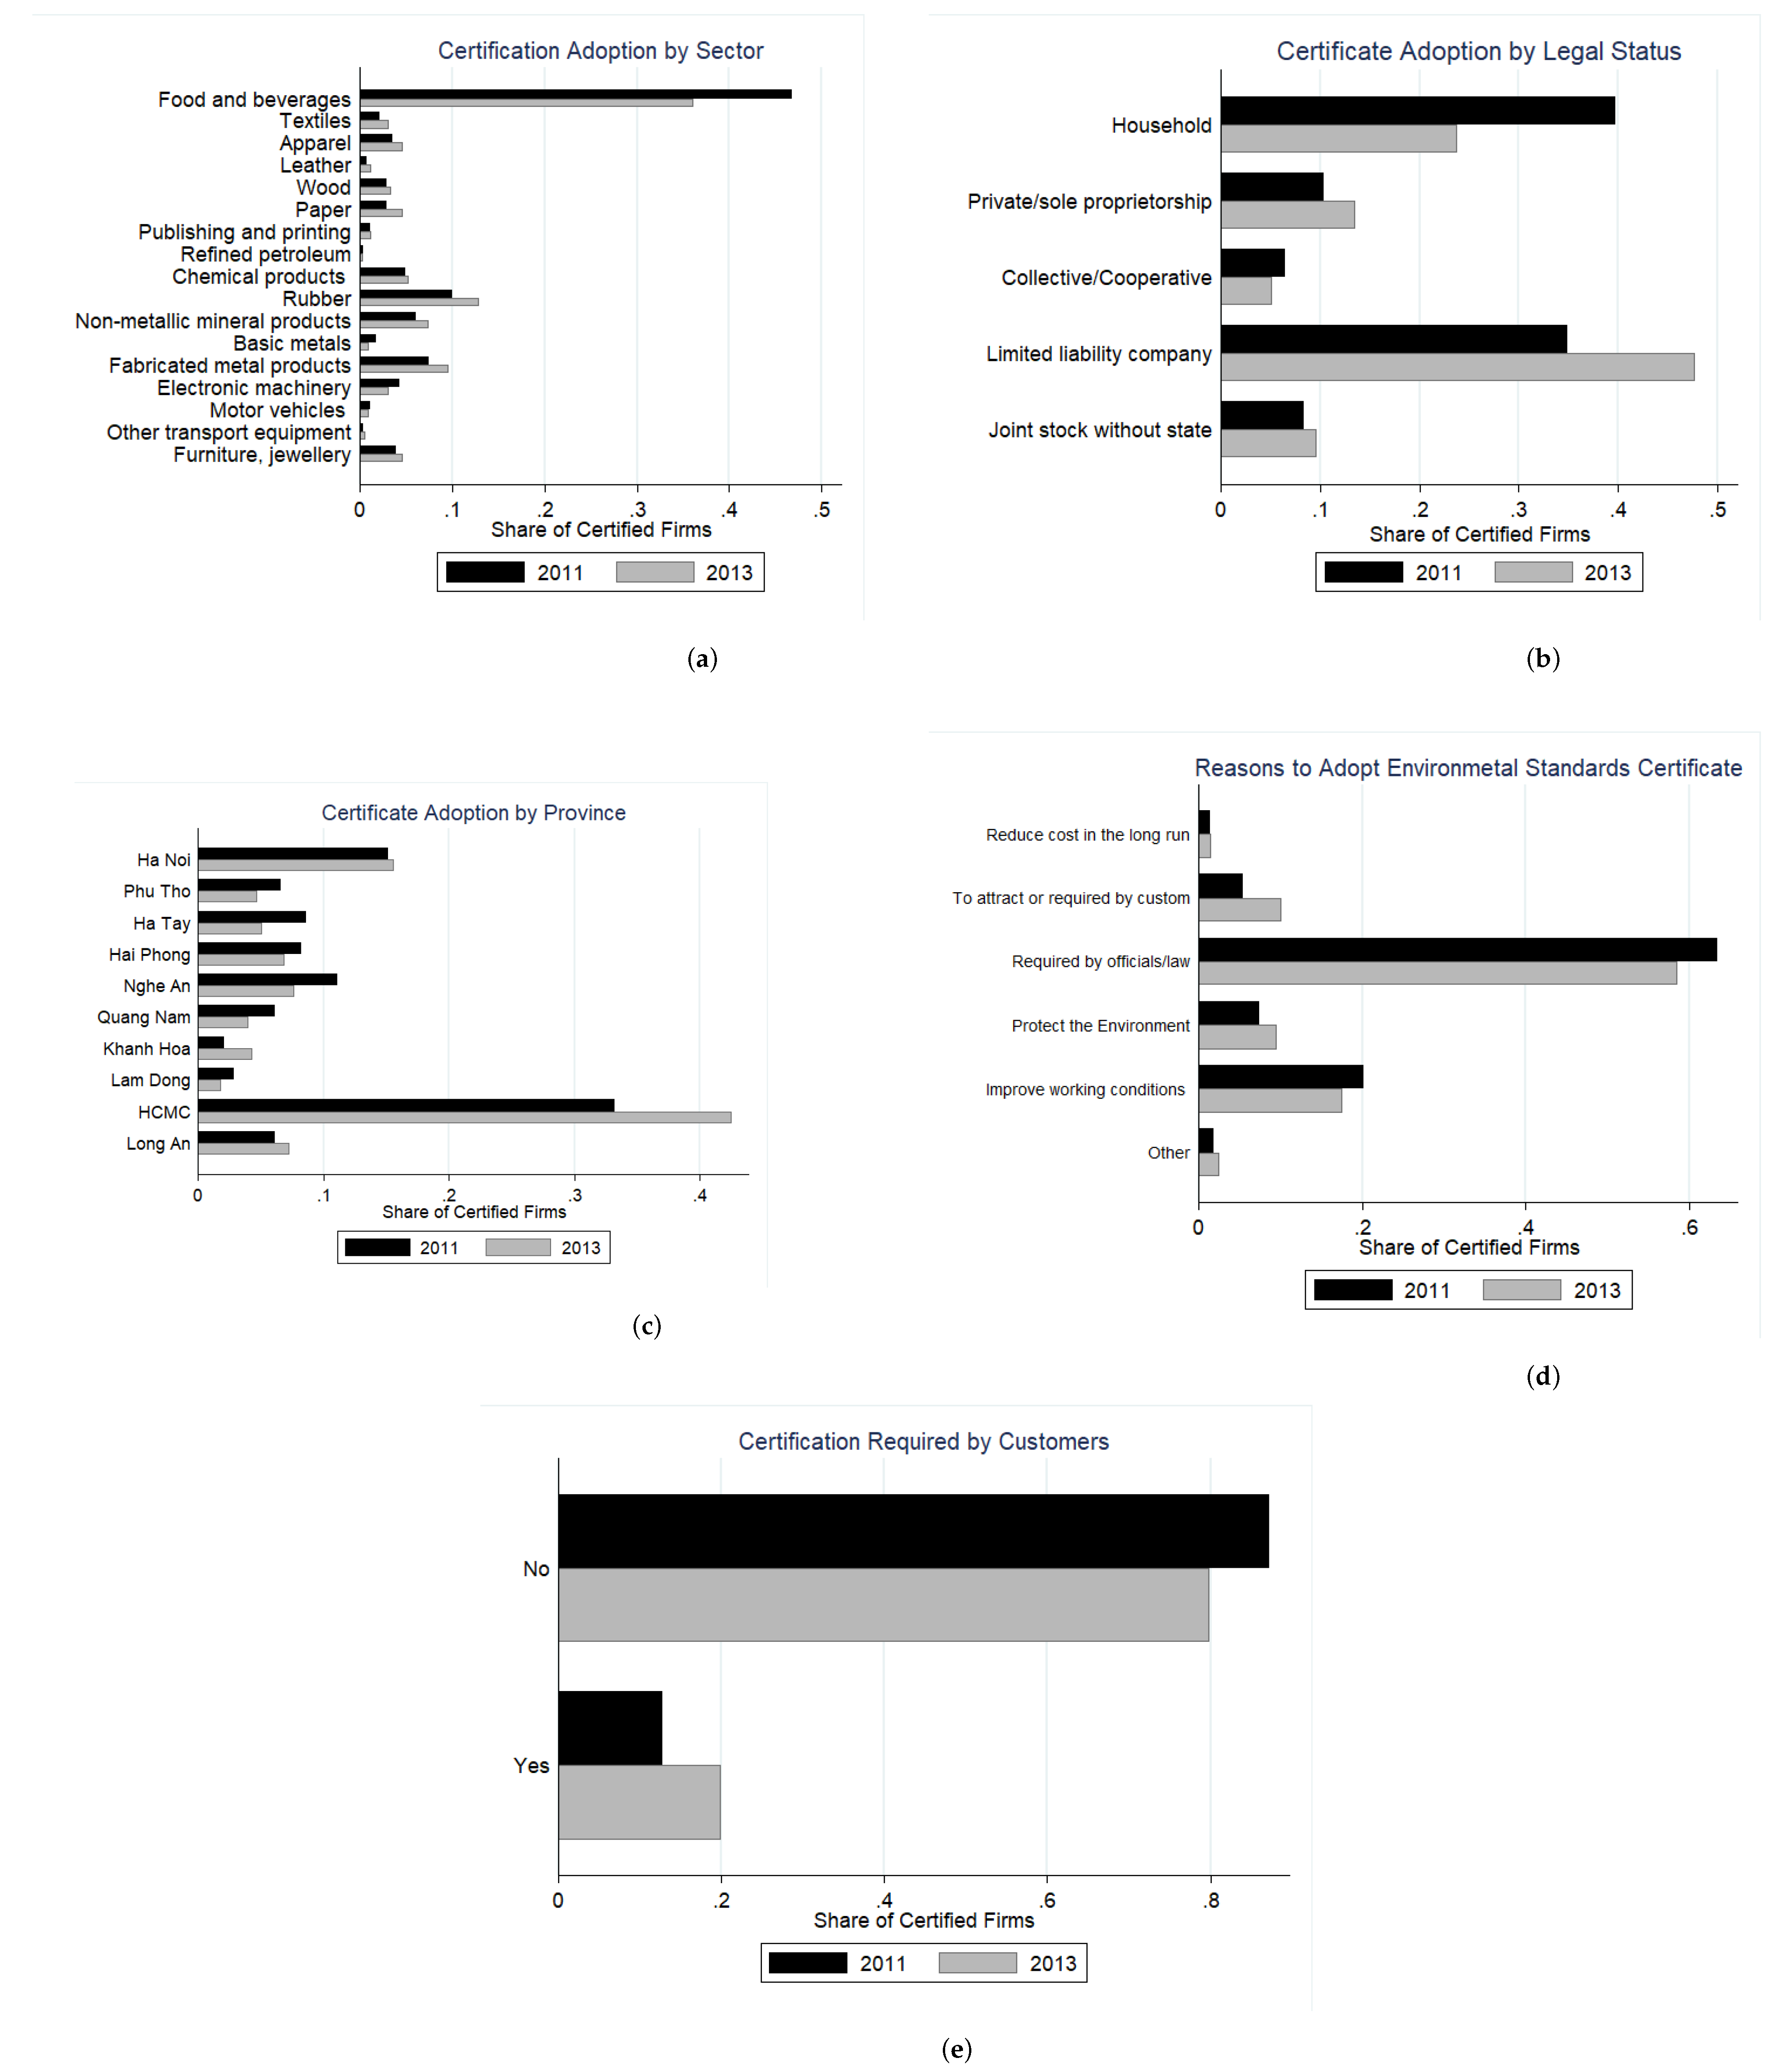
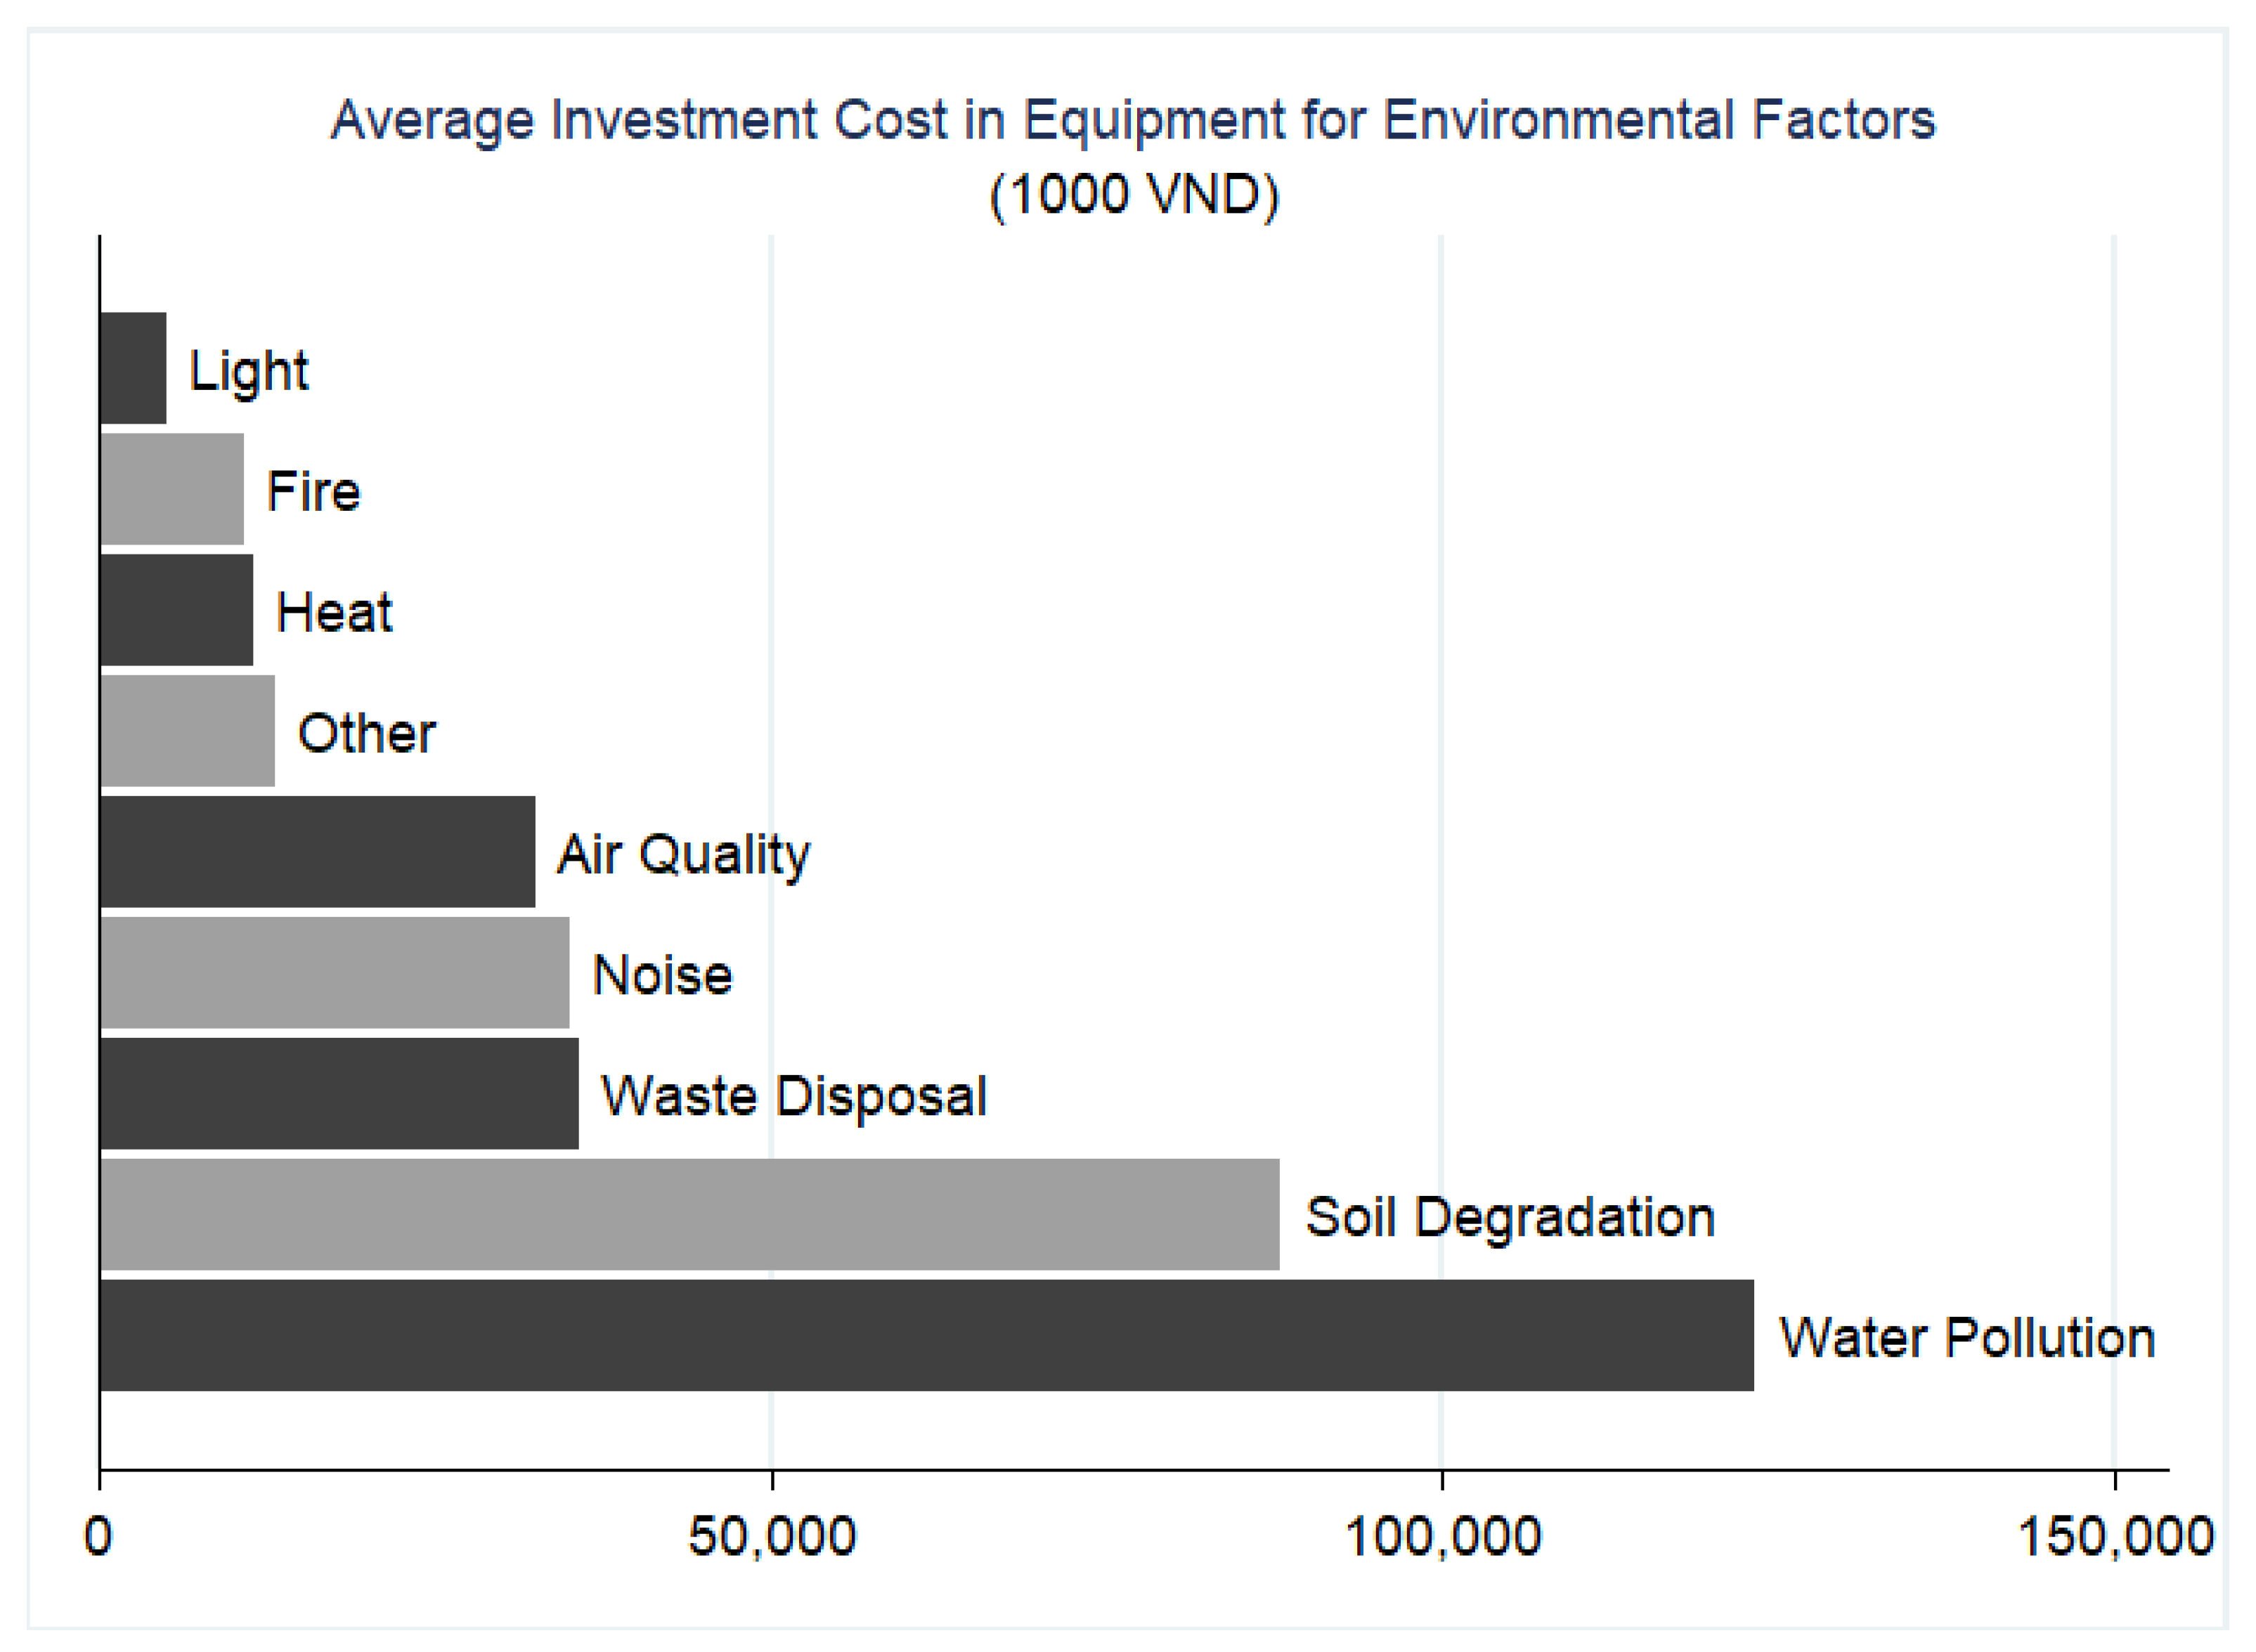
© 2020 by the author. Licensee MDPI, Basel, Switzerland. This article is an open access article distributed under the terms and conditions of the Creative Commons Attribution (CC BY) license (http://creativecommons.org/licenses/by/4.0/).