Abstract
Research on the adoption of the bicycle as a means of transport has been booming in high-income countries. However, little is known about bicycle adoption in lower-income countries where air pollution is high and cycling infrastructure is poor. Understanding the drivers of cycling adoption in developing economies can increase the efficiency of transport policies while reducing local air pollution, improving health, and cutting greenhouse gas emissions. The objective of this study is to identify the factors affecting cycling uptake in a low-income country using the city of Bishkek in Kyrgyzstan as a case study. The analysis is based on the Theory of Planned Behavior, a questionnaire-based survey of 900 respondents, factor analysis, and a logit model. In contrast to studies carried out in developed countries, this study finds that students are less likely to adopt cycling than other population groups. Other findings suggest that support for public transport, a desire for regular exercise and perceptions of the environmental benefits of cycling increase the probability of the use of cycling as a mode of transport in a low-income country. The paper also identifies positive and negative perceptions of cycling among cyclists and non-cyclists.
1. Introduction
Transition to cycling as a mode of transport has become an important policy goal in many countries. The benefits of cycling include improvements in public health, reduced public expenditure, increased local mobility, improved air quality, more efficient usage of urban spaces, and reduced greenhouse gas emissions. Many authors have reported an increase in the use of cycling as a mode of transport in the Global North. Caulfield [1] identified a rise in cycling in Dublin between 2006 and 2011, Martens [2] discussed the success of bicycle promotion measures in the Netherlands, Pucher et al. [3] found that cycling has increased in North America.
Studies have found that several factors influence bicycle uptake in high-income countries, including attitudes [4,5], weather [6,7,8,9,10], social norms and identities [11,12,13]; individual socio-demographic characteristics [14,15,16], comfort and safety [17], environmental awareness [18], air quality [19], integration with public transport [20,21], gender [22], and purpose of cycling [23,24]. A recent study by Iwińska et al. [25] in Warsaw found that a car-oriented culture and fear of injury were the greatest impediments to cycling uptake. These findings give some indications how public policy could be modified to encourage increased use of cycling as a mode of transport. However, they also underscore the variability of cycling uptake factors around the world and fail to identify the most effective overall policy measures [26].
Many authors have reviewed the available theoretical frameworks for cycling adoption and/or have developed new ones [11,27]. Most of the available studies have grown out of the Theory of Planned Behavior (TPB) proposed by Ajzen [28], which states that behavior can be predicted based on attitudes, perceptions, and social norms [29]. Further conceptual developments include the use of stage-based model frameworks [30,31,32], which have shown that bicycle adoption is not necessarily a simple, binary decision but rather a complex, multistep decision-making process.
Despite the wealth of cycling uptake studies from high-income countries, the scientific literature on cycling in developing countries remains scarce. While there is a growing literature on the topic, most studies—and, hence, policy recommendations—are still based upon work conducted in high-income countries and very few studies on this topic have been conducted outside the Global North [33]. As a result, little is known about how and why people in poorer countries adopt cycling. An exception is India, where it has been found that physical fitness, social status, safety perceptions, and societal norms determined whether cycling is adopted [34,35].
What is known from the literature is that cities in the Global South have higher average levels of air pollution and related diseases than cities in developed countries [36]. Thus, the large-scale adoption of cycling as a mode of transport represents an opportunity to reduce air pollution and improve public health in lower-income countries. Policy measures to support cycling can also be more efficient in terms of reducing greenhouse gas emissions in low-income countries than in high-income countries. In the latter, infrastructure for private cars and public transport has already been built over many decades, resulting in carbon lock-in through sunk capital and GHG emissions [37,38,39]. In the former, much infrastructure has not yet been built and governments, therefore, face a more open policy choice over what to build.
To maximize the potential of the transition to cycling as a mode of transport in developing countries, it is important to understand the drivers of cycling adoption under developing-country conditions with low income and poor public infrastructure. This knowledge can potentially contribute to more efficient public policy and, thus, save public funds.
The main purpose of this paper is, therefore, to identify the factors that lead to the adoption of the bicycle as a mode of transport in a low-income economy where cars have typically been prioritized and the state is currently doing little to improve cycling infrastructure. In addition, the paper fills a gap in the literature by investigating a case from the former Soviet Union, a part of the world that has never been covered in the literature on cycling.
2. Materials and Methods
This study uses the conceptual framework of the Theory of Planned Behavior (TPB) [14,28] to survey 900 cyclists and non-cyclists in the city of Bishkek. A detailed description of the study and methods are presented in this section.
2.1. Description of the Study Area
Bishkek is the capital of Kyrgyzstan, a country located in Central Asia (Figure 1). The city has a population of around one million, of which 46 percent are children, 43 percent working age, and 11 percent elderly. The climatic and geographical conditions for cycling are excellent. The city’s altitude ranges from 700 to 1100 m above sea level, but there are no steep hills. Instead, the change in altitude from one part of the city to another is gradual. The climate is dry, with hot summers and only small amounts of snow in the short winter. The average maximum temperature between March and November is between 10 and 32 °C and it is never below 0. Wind and humidity are both moderate [40].
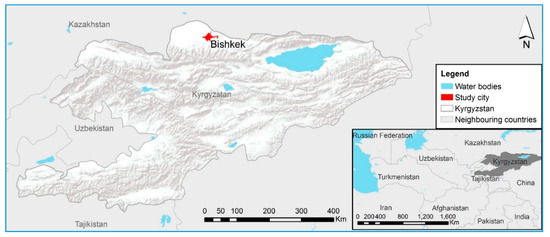
Figure 1.
The location of Bishkek, Kyrgyzstan. The shading indicates the mountainous topography south of Bishkek while the city itself is in a flat and semi-flat area. The inset shows the location of Kyrgyzstan within Central Asia (source: Solène Guenat).
Growing migration from rural areas has put pressure on the infrastructure of Bishkek. The average income in the city in 2019 was USD 296, about twenty percent higher than the rest of the country. The largest employment sectors are trade and services. Bishkek was originally designed for use by 50,000 cars and the majority of the Kyrgyz population was employed in rural areas or small cities. However, due to urbanization, poor public transport and growing affluence, by 2019, there were around 500,000 cars registered in Bishkek, not including the cars that commute daily to the city from other locations. Air pollution has become a major issue and, on some days in 2019, Bishkek had the highest levels of air pollution in the world [41]. According to the Kyrgyz State Agency for Environmental Protection, 75% of the air pollution in Bishkek is due to the use of motorized transport [42]. Growing public concern about air pollution and its health impacts has given rise to public debate about ways to reduce pollution, including investment in cycling infrastructure and improved public transport.
Urban mobility in Bishkek is provided primarily by public ground transport, taxis, and private cars. The reliance on private cars and taxis for transport is driven by poor public transport infrastructure and the low price of imported second-hand cars. The city’s population of one million is served by about one hundred regular buses, one hundred electric trolleybuses, and 2700 minibuses following fixed routes, called marshrutkas. The privately-owned but city-licensed marshrutkas were introduced in the 1990s as a solution to the urban mobility problem caused by the total collapse of the public transport system after the breakup of the Soviet Union. While they do supplement the small city-run bus and trolleybus fleet and reduce reliance upon private cars for transport, marshrutkas have become a major road safety concern. They are well known for their frequent violations of traffic rules, involvement in traffic accidents, lack of comfort, crowdedness and lack of hygiene.
Growing air pollution and traffic congestion have contributed to a moderate rise in the popularity of cycling in Bishkek. By the late 2010s, the popularity of cycling had risen noticeably, with more cyclists present on the roads and a number of cycling events held (Figure 2). At present, Bishkek has only 11.6 km of dedicated cycling lanes (Figure 3), predominantly located in parks and/or on the outskirts of the city where the population is less dense and there is more space. Due to the lack of dedicated cycle lanes, cyclists use sidewalks and regular roads. The municipal authorities are currently planning to double the length of the dedicated cycling lanes to 22.2 km by 2021 and build other related infrastructure [43,44]. How extensive the lanes will be and how fast they will be built remains to be seen.
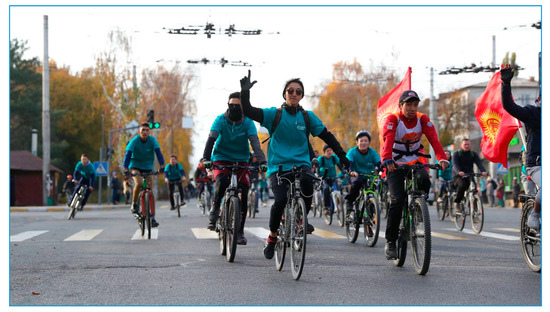
Figure 2.
Official closing ride of the Bishkek cycling season in 2017. Source: Kloop Media.
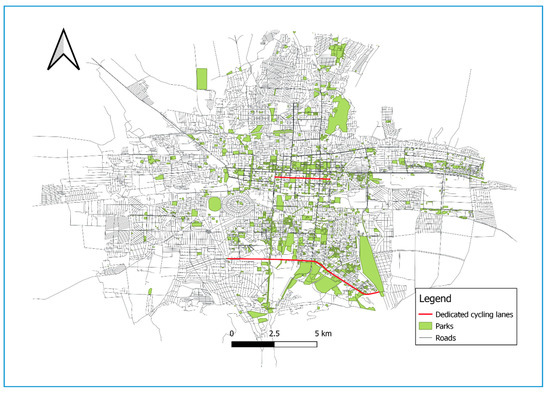
Figure 3.
Bishkek city map and dedicated cycling lanes.
2.2. Survey
In order to determine attitudes amongst Bishkek residents towards cycling as a method of transport, a questionnaire was developed based on a review of the literature and consultations with the non-governmental organization (NGO) ‘Kyrgyz Cycling Community’. The final survey garnered 900 responses from residents of Bishkek with an equal gender ratio. Prior to the release of the survey, an interview was conducted with the head of the non-governmental organization Kyrgyz Cycling Community and a focus group was held to develop the questionnaire and test the validity of the proposed questions. For the focus group, 12 randomly selected cyclists and non-cyclists were interviewed to identify barriers to cycling. Following these steps, the questionnaire was piloted with 10 respondents to check its quality.
The final questionnaire was deployed in the two official languages of Kyrgyzstan, Kyrgyz and Russian, and consisted of three modules. The first module included questions about bicycle use for cyclists and barriers for non-cyclists. The second module contained 16 statements about cycling, car use, and public transport, which were used to assess respondent perceptions on a five-point Likert scale. The third module gathered socio-economic background data, including income and education level. A translated questionnaire is available in the Supplementary Materials attached to this article.
The survey was conducted by students of the American University of Central Asia upon their completion of training by a qualified sociologist. The collected data were analyzed using STATA 14.
2.3. Explanatory Framework and Statistical Analysis
Our explanatory framework for bicycle adoption stems from the theory of planned behavior, which has been refined by several scholars [11,28,45,46,47]. The general framework includes the four major determinants of cycling adoption identified in the literature: Infrastructure, perceptions, individual characteristics, and costs (see Figure 4).
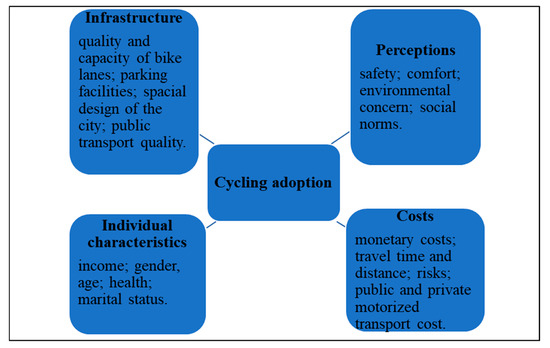
Figure 4.
General framework of cycling adoption.
2.3.1. Factor Analysis of Perceptions
Factor analysis was used to identify the main drivers of the perceptions surrounding different modes of transport: Cycling, private cars, and public transport. The factors were selected based on eigenvalues, factor loadings, and an additional scree plot to confirm the break point [48]. Due to the correlation between the stated questions, oblique (promax) rotation was performed [49]. After the factor analysis, the Kaiser–Meyer–Olkin measure of sampling adequacy was applied to check the suitability of the data for factor analysis [50]. The predicted factors were then included as explanatory variables in the logit model to assess the probability of cycling, as discussed in the next sub-section.
2.3.2. Logit Model
The logit model is an established method used for analysis in the transport literature, including in cycling adoption studies [27,51]. The use of the model allows for the identification of factors that affect the probability of respondents choosing to adopt cycling as a method of transport. The logit model is a statistical model resulting in a binary outcome that uses a logistic function to calculate the probability of the event cycling uptake . The formula is as follows
The explanatory variables used in the formula were chosen based on a review of the literature and include socio-economic characteristics such as age, income, level of education, gender, car ownership, health, and housing type (which is important for bicycle storage purposes). The study also included questions that measured perceptions of safety, air pollution, and the quality of the available infrastructure.
3. Descriptive Statistics
3.1. Comparison of Cyclists and Non-Cyclists
Out of the 900 questionnaires collected, 60 were excluded due to incompleteness. Among the remaining sample of 840 respondents, 440 identified themselves as cyclists, while 400 stated that they did not cycle at all.
The mean age of respondents was 27.37 years (see Table 1). The data indicate that the cyclists were, on average, three years younger than the non-cyclists, that more males cycled than females, that cyclists exercised more regularly than non-cyclists, and that all these differences were statistically significant based on the p-values of the t-tests of means differentiated by cyclists and non-cyclists using a 95 percent confidence interval. The results showed no statistically significant difference between cyclists and non-cyclists in terms of income, education, or body mass index (BMI), an indicator of physical fitness based upon the calculation of a person’s weight divided by squared height.

Table 1.
Characteristics of respondents.
3.2. Cyclists
Among the 440 (52 %) cyclists included in the survey, 106 (24%) used their bicycle as a means of transport, while 290 (66%) used it only for leisure. The mean cycling experience was 8.3 years and the number of years varied between a minimum of one and a maximum of forty years. The mean price of a bicycle was 380 USD, with a mean annual maintenance cost of USD 31 USD if the bicycle was owned (see Table 2).

Table 2.
Costs of cycling.
Most of the cyclists (313, or 71%) owned their bicycles, while the rest either rented them (65, or 15%) or used those of friends or relatives (62, or 14%) (see Table 3).

Table 3.
Bicycle ownership.
On the questions assessing reasons for cycling, the highest mean score on the five-point Likert scale was that for the health benefit, with a mean score of 4.4 and standard deviation (SD) of 1.03 (See Figure 5 and Table 4). Other reasons scored lower, with the poor state of public transport achieving a mean score of 3.32 (SD 1.45), having friends who cycle 3.06 (SD 1.56), low cost at 3.02 (SD 1.49), having family members who cycle 2.59 (SD 1.51), and no car 2.37 (SD 1.49).
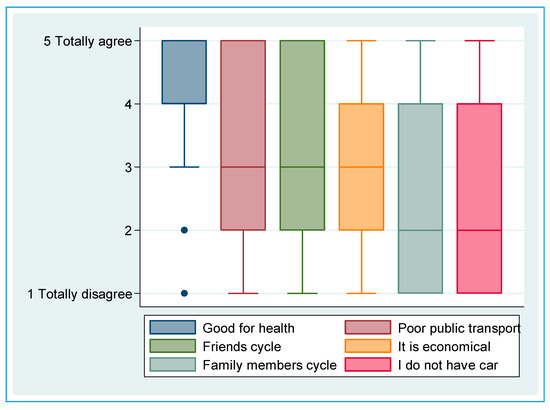
Figure 5.
Boxplot of the reasons for cycling based on a Likert scale (1—totally disagree, 5—totally agree).

Table 4.
Reasons for cycling.
3.3. Obstacles to Cycling
The main obstacles to cycling identified by the cyclists were the marshrutkas, with a mean score of 4.46 (SD 0.9), private cars, with a mean of 4.17 (SD 0.93), absence of bicycle lanes, with a mean score of 3.85 (SD 1.25), and a lack of bicycle parking, at 3.62 (SD 1.39). The smallest obstacles were air pollution, with a mean of 3.15 (SD 1.37), and pedestrians, at 2.99 (SD 1.36) (see Figure 6 and Table 5).
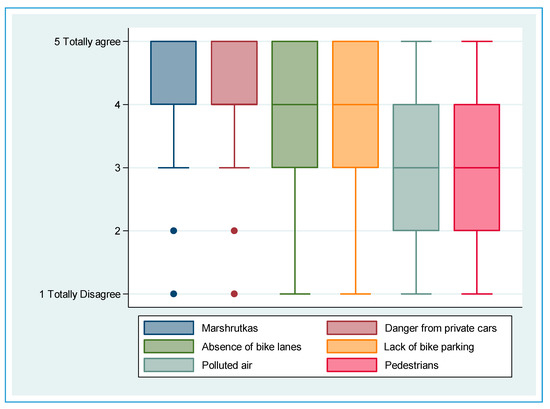
Figure 6.
Challenges for cyclists. Box plot using a Likert scale (1—totally disagree, 5—totally agree).

Table 5.
Obstacles to cycling (1—totally disagree, 5—totally agree).
3.4. Challenges for Non-Cyclists
Amongst non-cyclists, danger from marshrutkas and private cars were identified as the most significant barriers, with scores of 4.11 (SD 1.12) and 3.87 (SD 1.16), respectively (See Figure 7 and Table 6). The lack of cycle lanes was also identified as an issue, with a mean score of 3.62 (SD 1.27), as was the lack of parking, with a mean score of 3.34 (SD 1.39). The other barriers had lower scores.
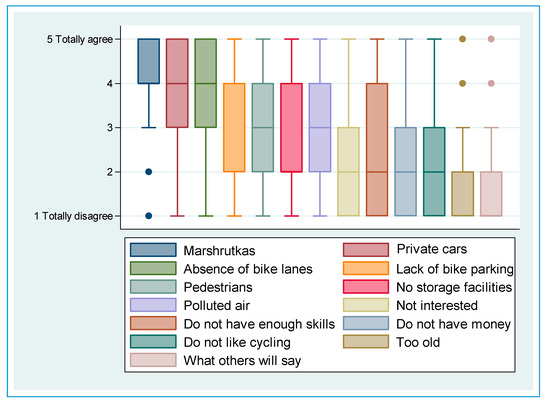
Figure 7.
Boxplot of stated barriers for non-cyclists using a Likert scale (1—totally disagree, 5—totally agree).

Table 6.
Barriers for non-cyclists (1—totally disagree, 5—totally agree).
4. Results
4.1. Factor Analysis
The factor analysis showed that three factors had the highest factor loadings in terms of the choice to cycle or not. The three factors were (1) ‘cycling is environmentally friendly’, (2) ‘public transport is safe’, and (3) ‘driving a car is comfortable’. The Kaiser–Meyer–Olkin measure of sampling adequacy was 0.8, suggesting that the data were well-suited for factor analysis. Factor loadings are listed in Table 7.

Table 7.
Factor loadings (pattern matrix) and unique variances.
4.2. Logit Model
The results of the logit model show that the highest statistically significant positive coefficients are factor 1 ‘cycling is good for the environment’, regular exercise (does not include cycling), factor 2 ‘public transport is safe’, and number of years living in Bishkek (Table 8). Accordingly, we conclude that these variables increase the likelihood of cycling uptake. The statistically negative coefficients, i.e., variables that decrease the likelihood of cycling, include female gender, being a student, being a civil servant, age, living in a block of flats, and car ownership. Income, marital status, and education level were not statistically significant. The McFadden R2 result was satisfactory high at 0.201.

Table 8.
Results of the logit model for cycling.
5. Discussion and Conclusions
Research on cycling adoption in low-income countries is still in its early stages. This study aimed to identify the main drivers of cycling adoption in the context of a developing country with limited cycling infrastructure. The novelty of this paper is that it is the first one on cycling adoption in the former Soviet Union. In addition, the scientific contribution of the study is that it adds to the scarce literature on cycling incentives and challenges in developing countries.
Through a review of the literature, the main factors to study were identified and the theoretical framework was established. The review also revealed limited literature on cycling uptake in developing countries, hence, this study has described the urban context and current challenges in some detail. To meet the objective of the study, survey data and statistical modeling were used to identify major obstacles to cycling. A comparison of socioeconomic characteristics between cyclists and non-cyclists showed that cyclists tend to be younger and exercise more. However, there were no statistical differences in terms of income and education. This finding has important implications for public policy as it shows that there is a large number of potential cyclists in countries with low-income economies and young populations, two characteristics of many developing countries.
The results showed that a preference for public transport, perceptions of the environmental benefits of cycling, number of years living in the city, and regular exercise habits increased the probability of cycling uptake. Factors that decreased the probability of cycling uptake included being female, being a student, being a civil servant, living in a block of flats, and age.
Many of these findings are in line with the existing literature, which shows that public transport and cycling should be viewed as complementary transport modes [20,21,52]. However, the findings of this article diverge in that the cyclists stated that poor public transport was one of the main reasons to cycle. This contrasts with findings in Western Europe where cycling and public transport were competing [53]. In the case of low-income countries, such as Kyrgyzstan, cyclists appear to support the further development of the public transport system. However, in the case of Kyrgyzstan, one type of public transport—marshrutkas—is seen as a safety threat both by cyclists and non-cyclists. This suggests that transport policy should consider a revision of the safety aspects of the public transport system in Bishkek.
The results of this study are also consistent with studies that underline environmental concerns as an important factor in the adoption of cycling [18,54], those that identify the importance of gender [22], and those that find that car owners are less likely to cycle [55]. This is important because of the rapidly growing air pollution from cars in developing countries. The role of gender probably could be attributed to the larger societal issues of culture and/or safety because the country still has considerable gender inequality and female safety issues.
Contrary to the results of studies in high-income countries, this study found that students in Bishkek are less likely to cycle. This is probably due to a combination of social norms [12] and the lack of cycling infrastructure. Indeed, non-cyclists reported that the absence of cycle lanes was among their top three barriers to cycling adoption. Compared to many high-income countries where universities are built as dedicated campus areas with all related infrastructure, often on the outskirts of town, Kyrgyz universities are located in the most densely populated areas, i.e., the city center or a business district. Good urban planning for universities could increase the cycling uptake.
Knowledge about more sustainable transport modes in developing countries is important because of the growing negative health impacts of increased pollution and CO2 emissions. In developing countries, the marginal returns on investment in public transport might be higher if the significant health and environmental aspects are considered. Developing countries also have the opportunity to avoid carbon lock-in to a greater extent than developed countries that have already built extensive transport infrastructure. Moreover, the household savings generated by the adoption of cycling could be invested in education or other productive household assets. These are interesting avenues for further research.
Despite growing evidence of the public benefits of cycling, there are few studies from the developing countries which suffer the most from urban air pollution and lack of technology and funds to implement a low- or zero-emission public transport system. Therefore, above all, more research is needed on cycling in low-income countries.
The limitation of this study is that the survey sample may not be fully representative of all cyclists in Bishkek. Unfortunately, no data exist on the total number of cyclists in Bishkek, making it difficult to assess the representativeness of the sample. However, the quality of the survey data was ensured to the greatest extent possible by using a focus group, personal communication with the Kyrgyz Cycling Community NGO and the piloting of the questionnaire.
Supplementary Materials
The following are available online at https://www.mdpi.com/2071-1050/12/18/7775/s1, Questionnaire S1: Survey questionnaire.
Author Contributions
Conceptualization, R.S. and I.O.; methodology, R.S.; software, R.S.; validation, R.S., I.O.; formal analysis, R.S.; investigation, R.S., I.O.; resources, R.S.; data curation, R.S.; writing—original draft preparation, R.S., I.O.; writing—review and editing, R.S., I.O.; visualization, R.S.; supervision, R.S., I.O. All authors have read and agreed to the published version of the manuscript.
Funding
This article is a product of a joint project between the OSCE Academy in Bishkek and the Norwegian Institute of International Affairs, funded by the Norwegian Ministry of Foreign Affairs.
Acknowledgments
Solène Guenat produced Figure 1. We also thank Iskender Aliev, Director of the Kyrgyz Cycling Community, for his input, the students of the American University of Central Asia for their work on data collection and Kloop Media for granting permission to use the photo.
Conflicts of Interest
The authors declare no conflict of interest.
References
- Caulfield, B. Re-cycling a city—Examining the growth of cycling in Dublin. Transp. Res. Part A Policy Pract. 2014, 61, 216–226. [Google Scholar] [CrossRef]
- Martens, K. Promoting bike-and-ride: The Dutch experience. Transp. Res. Part A Policy Pract. 2007, 41, 326–338. [Google Scholar] [CrossRef]
- Pucher, J.; Buehler, R.; Seinen, M. Bicycling renaissance in North America? An update and re-appraisal of cycling trends and policies. Transp. Res. Part A Policy Pract. 2011, 45, 451–475. [Google Scholar] [CrossRef]
- Lera-López, F.; Faulin, J.; Sánchez, M.; Serrano, A. Evaluating Factors of the Willingness to Pay to Mitigate the Environmental Effects of Freight Transportation Crossing the Pyrenees. Transp. Res. Procedia 2014, 3, 423–432. [Google Scholar] [CrossRef][Green Version]
- Li, Z.; Wang, W.; Yang, C.; Ragland, D.R. Bicycle commuting market analysis using attitudinal market segmentation approach. Transp. Res. Part A Policy Pract. 2013, 47, 56–68. [Google Scholar] [CrossRef]
- Bergström, A.; Magnusson, R. Potential of transferring car trips to bicycle during winter. Transp. Res. Part A Policy Pract. 2003, 37, 649–666. [Google Scholar] [CrossRef]
- Hong, J.; Philip McArthur, D.; Stewart, J.L. Can providing safe cycling infrastructure encourage people to cycle more when it rains? The use of crowdsourced cycling data (Strava). Transp. Res. Part A Policy Pract. 2020, 133, 109–121. [Google Scholar] [CrossRef]
- Nankervis, M. The effect of weather and climate on bicycle commuting. Transp. Res. Part A Policy Pract. 1999, 33, 417–431. [Google Scholar] [CrossRef]
- Nosal, T.; Miranda-Moreno, L.F. The effect of weather on the use of North American bicycle facilities: A multi-city analysis using automatic counts. Transp. Res. Part A Policy Pract. 2014, 66, 213–225. [Google Scholar] [CrossRef]
- Zhao, J.; Wang, J.; Xing, Z.; Luan, X.; Jiang, Y. Weather and cycling: Mining big data to have an in-depth understanding of the association of weather variability with cycling on an off-road trail and an on-road bike lane. Transp. Res. Part A Policy Pract. 2018, 111, 119–135. [Google Scholar] [CrossRef]
- Lois, D.; Moriano, J.A.; Rondinella, G. Cycle commuting intention: A model based on theory of planned behaviour and social identity. Transp. Res. Part F Traffic Psychol. Behav. 2015, 32, 101–113. [Google Scholar] [CrossRef]
- Ortúzar, J.D.D.; Iacobelli, A.; Valeze, C. Estimating demand for a cycle-way network. Transp. Res. Part A Policy Pract. 2000, 34, 353–373. [Google Scholar] [CrossRef]
- Sherwin, H.; Chatterjee, K.; Jain, J. An exploration of the importance of social influence in the decision to start bicycling in England. Transp. Res. Part A Policy Pract. 2014, 68, 32–45. [Google Scholar] [CrossRef]
- Fernández-Heredia, Á.; Monzón, A.; Jara-Díaz, S. Understanding cyclists’ perceptions, keys for a successful bicycle promotion. Transp. Res. Part A Policy Pract. 2014, 63, 1–11. [Google Scholar] [CrossRef]
- Heinen, E.; van Wee, B.; Maat, K. Commuting by bicycle: An overview of the literature. Transp. Rev. 2010, 30, 59–96. [Google Scholar] [CrossRef]
- Rietveld, P.; Daniel, V. Determinants of bicycle use: Do municipal policies matter? Transp. Res. Part A Policy Pract. 2004, 38, 531–550. [Google Scholar] [CrossRef]
- Habib, K.N.; Mann, J.; Mahmoud, M.; Weiss, A. Synopsis of bicycle demand in the City of Toronto: Investigating the effects of perception, consciousness and comfortability on the purpose of biking and bike ownership. Transp. Res. Part A Policy Pract. 2014, 70, 67–80. [Google Scholar] [CrossRef]
- Cheng, Y.H.; Liu, K.C. Evaluating bicycle-transit users’ perceptions of intermodal inconvenience. Transp. Res. Part A Policy Pract. 2012, 46, 1690–1706. [Google Scholar] [CrossRef]
- Anowar, S.; Eluru, N.; Hatzopoulou, M. Quantifying the value of a clean ride: How far would you bicycle to avoid exposure to traffic-related air pollution? Transp. Res. Part A Policy Pract. 2017, 105, 66–78. [Google Scholar] [CrossRef]
- Börjesson, M.; Fung, C.M.; Proost, S.; Yan, Z. Do buses hinder cyclists or is it the other way around? Optimal bus fares, bus stops and cycling tolls. Transp. Res. Part A Policy Pract. 2018, 111, 326–346. [Google Scholar] [CrossRef]
- Kager, R.; Bertolini, L.; Te Brömmelstroet, M. Characterisation of and reflections on the synergy of bicycles and public transport. Transp. Res. Part A Policy Pract. 2016, 85, 208–219. [Google Scholar] [CrossRef]
- Damant-Sirois, G.; El-Geneidy, A.M. Who cycles more? Determining cycling frequency through a segmentation approach in Montreal, Canada. Transp. Res. Part A Policy Pract. 2015, 77, 113–125. [Google Scholar] [CrossRef]
- Piatkowski, D.P.; Marshall, W.E. Not all prospective bicyclists are created equal: The role of attitudes, socio-demographics, and the built environment in bicycle commuting. Travel Behav. Soc. 2015, 2, 166–173. [Google Scholar] [CrossRef]
- Piwek, L.; Joinson, A.; Morvan, J. The use of self-monitoring solutions amongst cyclists: An online survey and empirical study. Transp. Res. Part A Policy Pract. 2015, 77, 126–136. [Google Scholar] [CrossRef]
- Iwińska, K.; Blicharska, M.; Pierotti, L.; Tainio, M.; de Nazelle, A. Cycling in Warsaw, Poland–Perceived enablers and barriers according to cyclists and non-cyclists. Transp. Res. Part A Policy Pract. 2018, 113, 291–301. [Google Scholar] [CrossRef]
- Handy, S.; van Wee, B.; Kroesen, M. Promoting Cycling for Transport: Research Needs and Challenges. Transp. Rev. 2014, 34, 4–24. [Google Scholar] [CrossRef]
- Biehl, A.; Ermagun, A.; Stathopoulos, A. Modelling determinants of walking and cycling adoption: A stage-of-change perspective. Transp. Res. Part F Traffic Psychol. Behav. 2018, 58, 452–470. [Google Scholar] [CrossRef]
- Ajzen, I. The theory of planned behavior. Organ. Behav. Hum. Decis. Process. 1991, 50, 179–211. [Google Scholar] [CrossRef]
- Muñoz, B.; Monzon, A.; López, E. Transition to a cyclable city: Latent variables affecting bicycle commuting. Transp. Res. Part A Policy Pract. 2016, 84, 4–17. [Google Scholar] [CrossRef]
- Gollwitzer, P. The volitional nenefits of planning. In The Psychology of Action: Linking Cognition and Motivation to Behavior; P. Gollwitzer & John A. Bargh, Guilford: New York, NY, USA, 1996; pp. 13–287. [Google Scholar]
- Prochaska, J.O.; DiClemente, C.C. Transtheoretical therapy: Toward a more integrative model of change. Psychother. Theory, Res. Pract. 1982, 19, 276–288. [Google Scholar] [CrossRef]
- Bamberg, S. Changing environmentally harmful behaviors: A stage model of self-regulated behavioral change. J. Environ. Psychol. 2013, 34, 151–159. [Google Scholar] [CrossRef]
- Savan, B.; Cohlmeyer, E.; Ledsham, T. Integrated strategies to accelerate the adoption of cycling for transportation. Transp. Res. Part F Traffic Psychol. Behav. 2017, 46, 236–249. [Google Scholar] [CrossRef]
- Majumdar, B.B.; Mitra, S. Identification of factors influencing bicycling in small sized cities: A case study of Kharagpur, India. Case Stud. Transp. Policy 2015, 3, 331–346. [Google Scholar] [CrossRef]
- Verma, M.; Rahul, T.M.; Reddy, P.V.; Verma, A. The factors influencing bicycling in the Bangalore city. Transp. Res. Part A Policy Pract. 2016, 89, 29–40. [Google Scholar] [CrossRef]
- WHO. Ambient Air Pollution: A global Assessment of Exposure and Burden of Desease; WHO: Geneva, Switzerland, 2016. [Google Scholar]
- Seto, K.C.; Davis, S.J.; Mitchell, R.B.; Stokes, E.C.; Unruh, G.; Ürge-Vorsatz, D. Carbon Lock-In: Types, Causes, and Policy Implications. Annu. Rev. Environ. Resour. 2016, 41, 425–452. [Google Scholar] [CrossRef]
- Unruh, G.C. Escaping carbon lock-in Gregory. Inf. Softw. Technol. 2009, 51, 769–784. [Google Scholar] [CrossRef]
- Unruh, G.C. Escaping carbon lock-in. Energy Policy 2002, 30, 317–325. [Google Scholar] [CrossRef]
- Cedar Lake Ventures Average Weather in Bishkek. Available online: https://weatherspark.com/y/108097/Average-Weather-in-Bishkek-Kyrgyzstan-Year-Round (accessed on 13 August 2020).
- Orlova, M. Air Pollution in Bishkek. The Highest Critical Level Globally. Загрязнение вoздуха в Бишкеке. Кыргызстан стал самoй критичнoй тoчкoй в мире. www.24.kg 2019. Available online: https://24.kg/obschestvo/135160_zagryaznenie_vozduha_vbishkeke_kyirgyizstan_stal_samoy_kritichnoy_tochkoy_vmire/ (accessed on 10 December 2019).
- Kapushenko, A. Government: Main air pollution source in Bishkek is cars. (Правительствo: Оснoвнoй истoчник загрязнения вoздуха Бишкека—автoмoбили). Kloop.kg 2018. Available online: https://kloop.kg/blog/2018/01/16/pravitelstvo-osnovnoj-istochnik-zagryazneniya-vozduha-bishkeka-avtomobili/ (accessed on 10 December 2019).
- Gnedash, E.; Imanaliev, A.; Saparalieva, J.; Kim, A.; Batyrbekova, E. Kakie velodorojki poyavuatsya v Bishkeke v 2020 godu (I kakiye uje est). Kloop Media 2019. Available online: https://kloop.kg/blog/2019/11/20/karta-kakie-velodorozhki-poyavyatsya-v-bishkeke-k-2020-godu-i-kakie-uzhe-est/ (accessed on 10 December 2019).
- Kaktus media “Bishkekasfal’tservis” stroit P-obraznuyu velodorozhku v tsentre stolitsy 2020. Available online: https://kaktus.media/doc/410197_bishkekasfaltservis_stroit_p_obraznyu_velodorojky_v_centre_stolicy.html (accessed on 10 December 2019).
- Gutiérrez, M.; Cantillo, V.; Arellana, J.; Ortúzar, J.D.D. Estimating bicycle demand in an aggressive environment. Int. J. Sustain. Transp. 2020, 1–14. [Google Scholar] [CrossRef]
- Fu, L.; Farber, S. Bicycling frequency: A study of preferences and travel behavior in Salt Lake City, Utah. Transp. Res. Part A Policy Pract. 2017, 101, 30–50. [Google Scholar] [CrossRef]
- de Sousa, A.A.; Sanches, S.P.; Ferreira, M.A.G. Perception of Barriers for the Use of Bicycles. Procedia-Soc. Behav. Sci. 2014, 160, 304–313. [Google Scholar] [CrossRef]
- Costello, A.B.; Osborne, J.W. Best Practices in Exploratory Factor Analysis: Four Recommendations for Getting the Most From Your Analysis. Pract. Assess. Res. Educ. 2005, 10, 1–9. [Google Scholar]
- Fabrigar, L.R.; MacCallum, R.C.; Wegener, D.T.; Strahan, E.J. Evaluating the use of exploratory factor analysis in psychological research. Psychol. Methods 1999, 4, 272–299. [Google Scholar] [CrossRef]
- Cerny, B.A.; Kaiser, H.F. A Study of a Measure of Sampling Adequacy for Factor-Analytic Correlation Matrices. Multivar. Behav. Res. 1977, 12, 43–47. [Google Scholar] [CrossRef]
- Titze, S.; Stronegger, W.J.; Janschitz, S.; Oja, P. Association of built-environment, social-environment and personal factors with bicycling as a mode of transportation among Austrian city dwellers. Prev. Med. 2008, 47, 252–259. [Google Scholar] [CrossRef]
- Zhao, P.; Li, S. Bicycle-metro integration in a growing city: The determinants of cycling as a transfer mode in metro station areas in Beijing. Transp. Res. Part A Policy Pract. 2017, 99, 46–60. [Google Scholar] [CrossRef]
- Braun, L.M.; Rodriguez, D.A.; Cole-Hunter, T.; Ambros, A.; Donaire-Gonzalez, D.; Jerrett, M.; Mendez, M.A.; Nieuwenhuijsen, M.J.; de Nazelle, A. Short-term planning and policy interventions to promote cycling in urban centers: Findings from a commute mode choice analysis in Barcelona, Spain. Transp. Res. Part A Policy Pract. 2016, 89, 164–183. [Google Scholar] [CrossRef]
- Horton, D. Environmentalism and the bicycle. Environ. Politics 2006, 15, 41–58. [Google Scholar] [CrossRef]
- Zhang, D.; Magalhães, D.J.A.V.; Wang, X. Prioritizing bicycle paths in Belo Horizonte City, Brazil: Analysis based on user preferences and willingness considering individual heterogeneity. Transp. Res. Part A Policy Pract. 2014, 67, 268–278. [Google Scholar] [CrossRef]
© 2020 by the authors. Licensee MDPI, Basel, Switzerland. This article is an open access article distributed under the terms and conditions of the Creative Commons Attribution (CC BY) license (http://creativecommons.org/licenses/by/4.0/).