Abstract
Deterministic safety analysis (DSA) is essential for nuclear power plant licensing. The conservative method followed CFR50 Appendix K, which will lead to a large margin. As one of the DSA methodologies, best estimate plus uncertainty (BEPU) generates more realistic results that can be used in the license application of nuclear power plants (NPPs). However, uncertainty evaluation of parameters is needed in BEPU. In this article, the safety regulatory focuses on the large break loss of coolant accident (LBLOCA) of an advanced PWR. The BEPU analysis is mainly performed by TRACE V5.0 patch 4 code, and the uncertainty analysis is conducted based on DAKOTA code. For correlation coefficients analysis, the sample size is enlarged reasonably. According to the results, this NPP meets the acceptance criteria effectively in LBLOCA with enough margin. By statistic assessment, the set of PCTs calculated has typical normal distribution characters. Based on BEPU, the uncertainties of parameters are studied. Additionally, the influence of sample size on the correlation of parameters is considered too. It could be seen that more samples could permit a more accurate estimation for Spearman partial correlation coefficient (abbreviated as SPCC). The conclusions of this article can provide technical support for the subsequent review of the safety analysis report and the design changes of NPPs.
1. Introduction
Compared with coal, gas, and other energy types, nuclear energy, as an important clean energy, has no air pollution, no carbon dioxide, high energy density, and stable power generation. It is also the only green energy source until now that can be continuously supplied in the form of a low ecological impact and low-carbon source and can be used stably on a large scale as with fossil fuel energy. According to the data of the world nuclear energy association, as of January 2021, global nuclear power generation has accounted for 10.1% of the total global power generation. The operation of nuclear power in the world shows that nuclear power is a safe and sustainability energy [1]. It is not only an effective way to reduce energy and environmental pollution, but also an effective means to reduce greenhouse gas emissions. With the development of fourth generation nuclear power technologies such as high temperature gas cooled reactor and molten salt reactor [2,3,4], the role of nuclear energy in sustainable development will be strengthened day by day. However, some rules ensuring the safety of nuclear power plants have to be meet by nuclear power companies in the process of applying for operating license. There is a balance between safety and economy. So, more and more new analysis methods have been studied for the purpose of cost. According to the IAEA safety guide, different approaches are currently available for performing deterministic safety analysis (DSA) with different levels of conservatism [5]. The conservative method should be performed with conservative code, system assumptions, and boundary conditions. However, this method was usually adopted in the early days of safety analysis to simplify the analysis and eliminate the limitations in modeling and knowledge of physical phenomena, resulting in large safety margins. BEPU is one of the approaches to perform safety analyses of nuclear power plants (NPPs) with a relatively realistic result, using realistic code, system assumptions, and boundary conditions, plus uncertainty analysis [5]. For the LOCA/ECCS analysis [6], the automated statistical treatment of uncertainty method (ASTRUM), one of the BEPU methods, has already been accepted by the regulatory authority and been used for AP1000 (one type of NPP design by a US company) NPP licensing.
APPWR is an advanced generation III pressurized water reactor, the safety concept of which is similar to AP1000, but the nuclear power is increased. In APPWR licensing application and safety review processing, ASTRUM is also used. To review the design, the reviewers pay attention to the effectiveness of the uncertainty analysis of the designer, re-execute the best estimate and uncertainty analysis on APPWR LBLOCA, and analyze the uncertainty of key parameters. C. Queral [6] summarized the research status of BEPU and obtained a more reliable analysis by the sample size of 59, but the PCTs are not of typical normal distribution. In this article, the effect of sample size on PCT are studied, the whole processing of APPWR LBLOCA review calculation is introduced, the safety margin of the reactor on LBLOCA is studied, and uncertainty parameters are evaluated. The conclusions of this article give technical support for the subsequent review of the safety analysis report and the design changes of APPWR and other NPPs.
2. BEPU Methods
BEPU is an accident analysis method with realistic code, realistic system assumptions, and realistic boundary conditions, but propagation of uncertainty should be analyzed. This method is considered to gain a larger safety margin than the traditional conservative analysis method, so it is normally applied in some kinds of safety analysis, especially in LBLOCA analysis [7]. The pioneering BEPU methodology was code scaling, applicability, and uncertainty (CSAU) [8], sponsored by the USNRC, where the propagation of uncertainty to the results was performed using a surrogate model of the thermo-hydraulic code, namely a polynomial response surface. Around the turn of the century, a new type of propagation procedure gained acceptance, based on the original code and on the calculation of tolerance limits using nonparametric Wilks’ method [9,10]. A method called advanced statistical treatment of uncertainty method (ASTRUM) is one of the typical methodologies based on Wilks’ theory.
For ASTRUM and CSAU, the ranges of the uncertainty contributors remain unchanged. The main difference between them is the evaluation of final uncertainty. ASTRUM is based on the order statistic (OS) method to calculate the total uncertainty of figure of merit. In the order statistic method, the size of a matrix to combine total uncertainties is limited. The calculation uncertainty propagation from input to output was performed on the basis of simple random sample (SRS) [11]. The specified input parameters (uncertainty parameters) generate a set of random values (case results) for each case. The final product is an SRS of outputs, and specifically of the figure-of-merit. The peak cladding temperature (PCT) is the figure-of-merit for LBLOCA.
For license issues, the regulatory acceptance criteria should be met with a probability of at least 0.95 and a statistical confidence of at least 0.95. If the tolerance limit (with level 95/95) of PCT is lower than the regulatory criterion, the acceptance criterion is fulfilled with level 95/95.
According to Wilks’ theory, the required tolerance level α/β (α is the probability level and β is the confidence level) is related to the order of the OS and the random sample size, as shown in Equation (1) [12]:
where n is the sample size.
According to Equation (1), if the confidence and probability level remained at least 0.95, the minimum sample size should be 59. Sample size 59 is normally used such as it in reference [6], and the maximum (rank 1) (as shown in Table 1) value of figure-of-merit is the tolerance limit for this BEPU analysis.

Table 1.
Sample size with different tolerance limits [14].
However, in this article, the influence of sample size on the correlation of parameters is studied and a larger sample size is needed. The probability of overestimation is increased by increasing the sample size if always choosing the maximum value of figure-of-merit.
For increasing the sample size without overestimation, different ranks are used in Wilks’ theory, as shown in Table 1. That is, for a tolerance level of 95/95, when the minimum sample size is estimated to be 93, the second maximum of the sample (i.e., the OS of order n − 1) is used as tolerance limit [13].
According to Table 1, the sample size could be increased, but the tolerance interval under different confidence level should be considered. For an output variable, when sample size is 59, and assuming that the maximum value of the sample is ymax, the one-sided tolerance interval of the two 95% output variables is (−∞, ymax), which means that the probability that output function y falls into the interval in all calculation results is 95%, and the confidence level is 95%. For the present analysis, 124 has been chosen as the sample size. The 95/95 tolerance limit is obtained as the third maximum of the sampled values.
3. APPWR BEPU Evaluation Model and EM Verification
3.1. APPWR Introduction
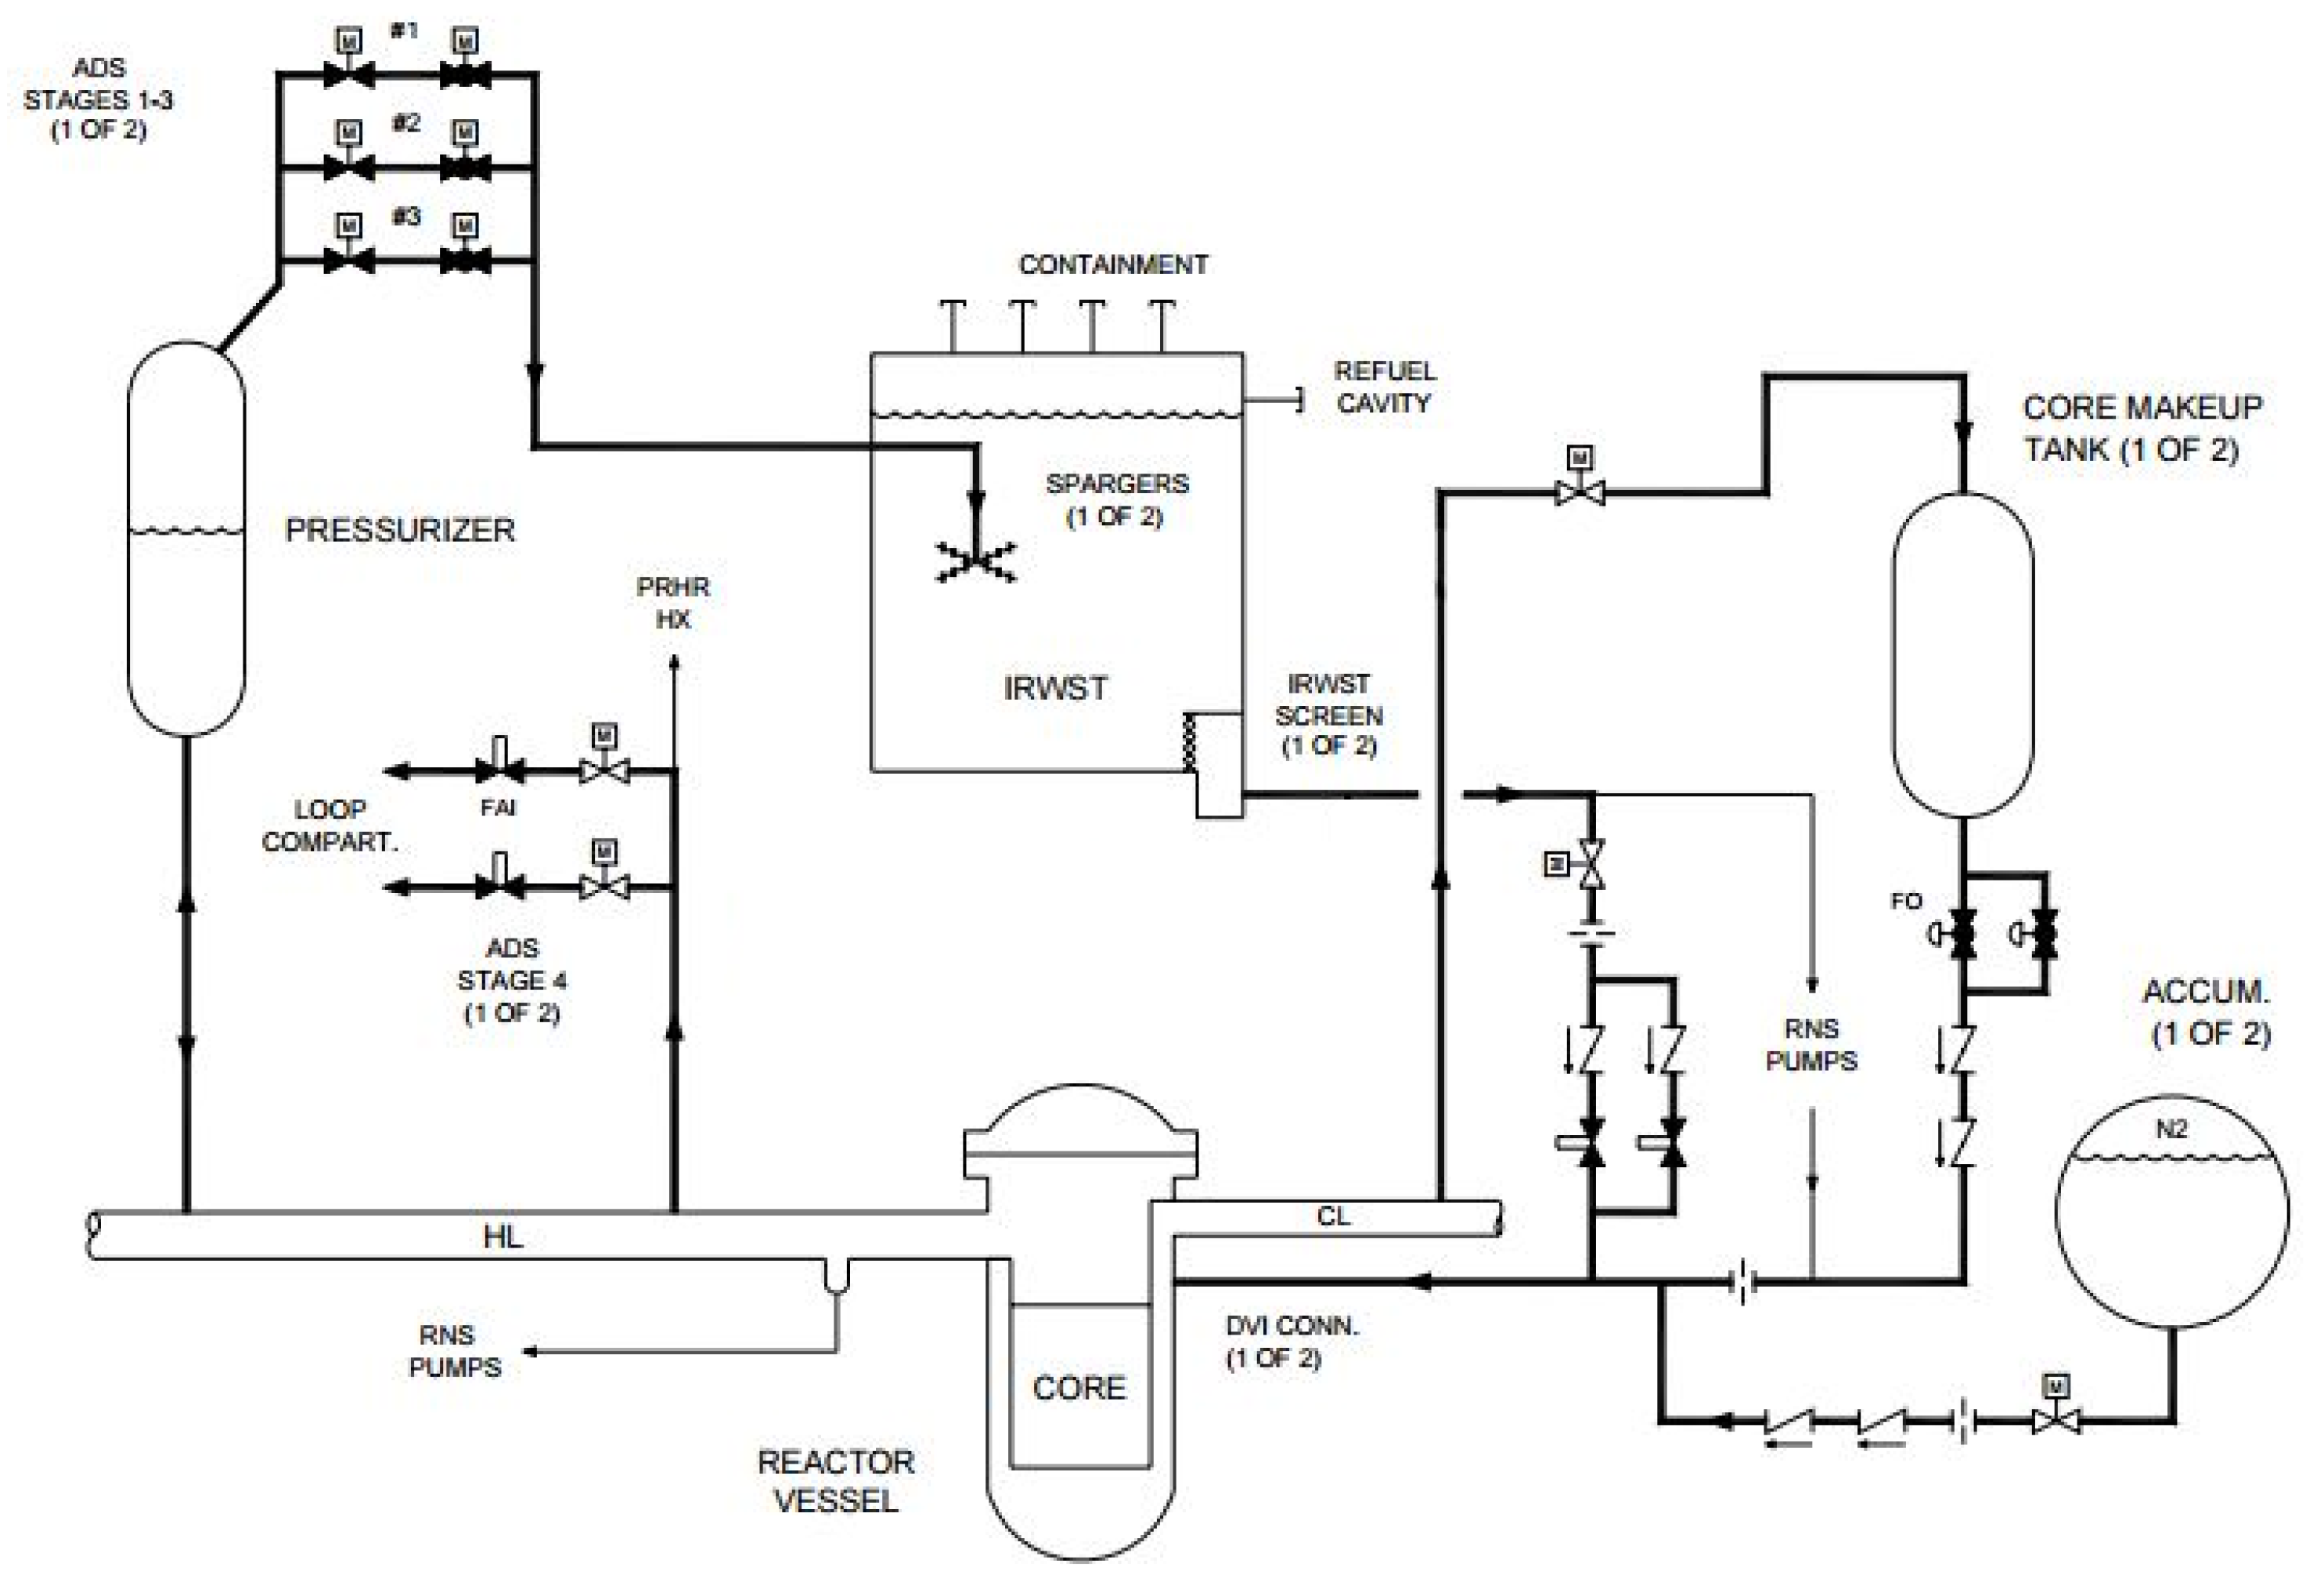
APPWR is the generation III pressurized water reactor technology developed by China. The initial rated reactor core thermal power for the APPWR certified design is 4040 megawatts, and electric power output is 1400 megawatts [15,16]. In order to minimize the linear heat rate, more fuel assemblies are loaded in the core. The passive ECCS contains two core makeup tanks (CMTs), two accumulators (ACCs), an in containment refueling water storage tank (IRWST) for long phase core cooling, and an automatic depressurization system (ADS) for automatic depressurization. As shown in Figure 1, the upper head of CMT is connected to one cold leg with the pressure balance line and the lower head is connected to the injection line. When the pressure of the main loop decreases below the default value, the CMT water can directly inject into the vessel through the direction vessel injection (DVI) line. The water in ACCs and IRWST will drain into the RCS by gravity through DVI too [17,18]. Different from the traditional design, the high-pressure safety injection system of this APPWR is removed to prevent the SGs from overflowing.
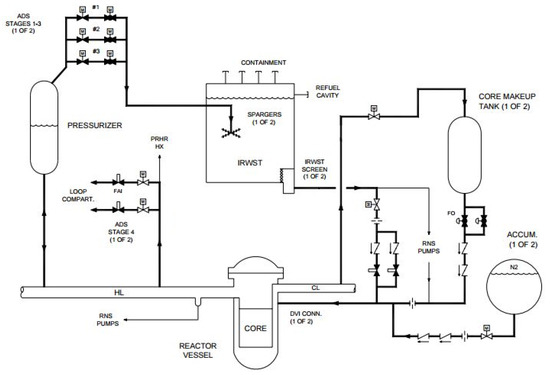
Figure 1.
Schematic of ECCS.
The major characteristics for APPWR are as shown in Table 2.
Table 2.
Major characteristics for APPWR.
3.2. Evaluation Models
According to the requirements of the Chinese government, the models in computer code used for nuclear safety evaluation should be verified in detail, and evaluation models must be able to describe the relevant physical processes during the reactor accident. For the LBLOCA of an APPWR, the following phenomena are in the spotlight: multidimensional two-phase flow, non-equilibrium thermodynamics, reflood, level tracking, etc.
TRACE code is a best-estimate reactor system code developed by NRC, which combines the advantages of four main systems codes, known as TRAC-P, TRAC-B, RELAP5, and RAMONA. Now, it has been transferred to the Chinese regulatory authority for the NPPs review calculation due to its distinguished performance on simulating LOCA. For instance, TRACE code can simulate several physical phenomena that are important in LBLOCA analysis for an APPWR, such as the ECC downcomer penetration and bypass, including the effects of countercurrent flow and hot walls, direct injection of subcooled ECC water without artificial mixing zones, etc. For this research, TRACE code is chosen as one of the thermal-hydraulic simulation tools.
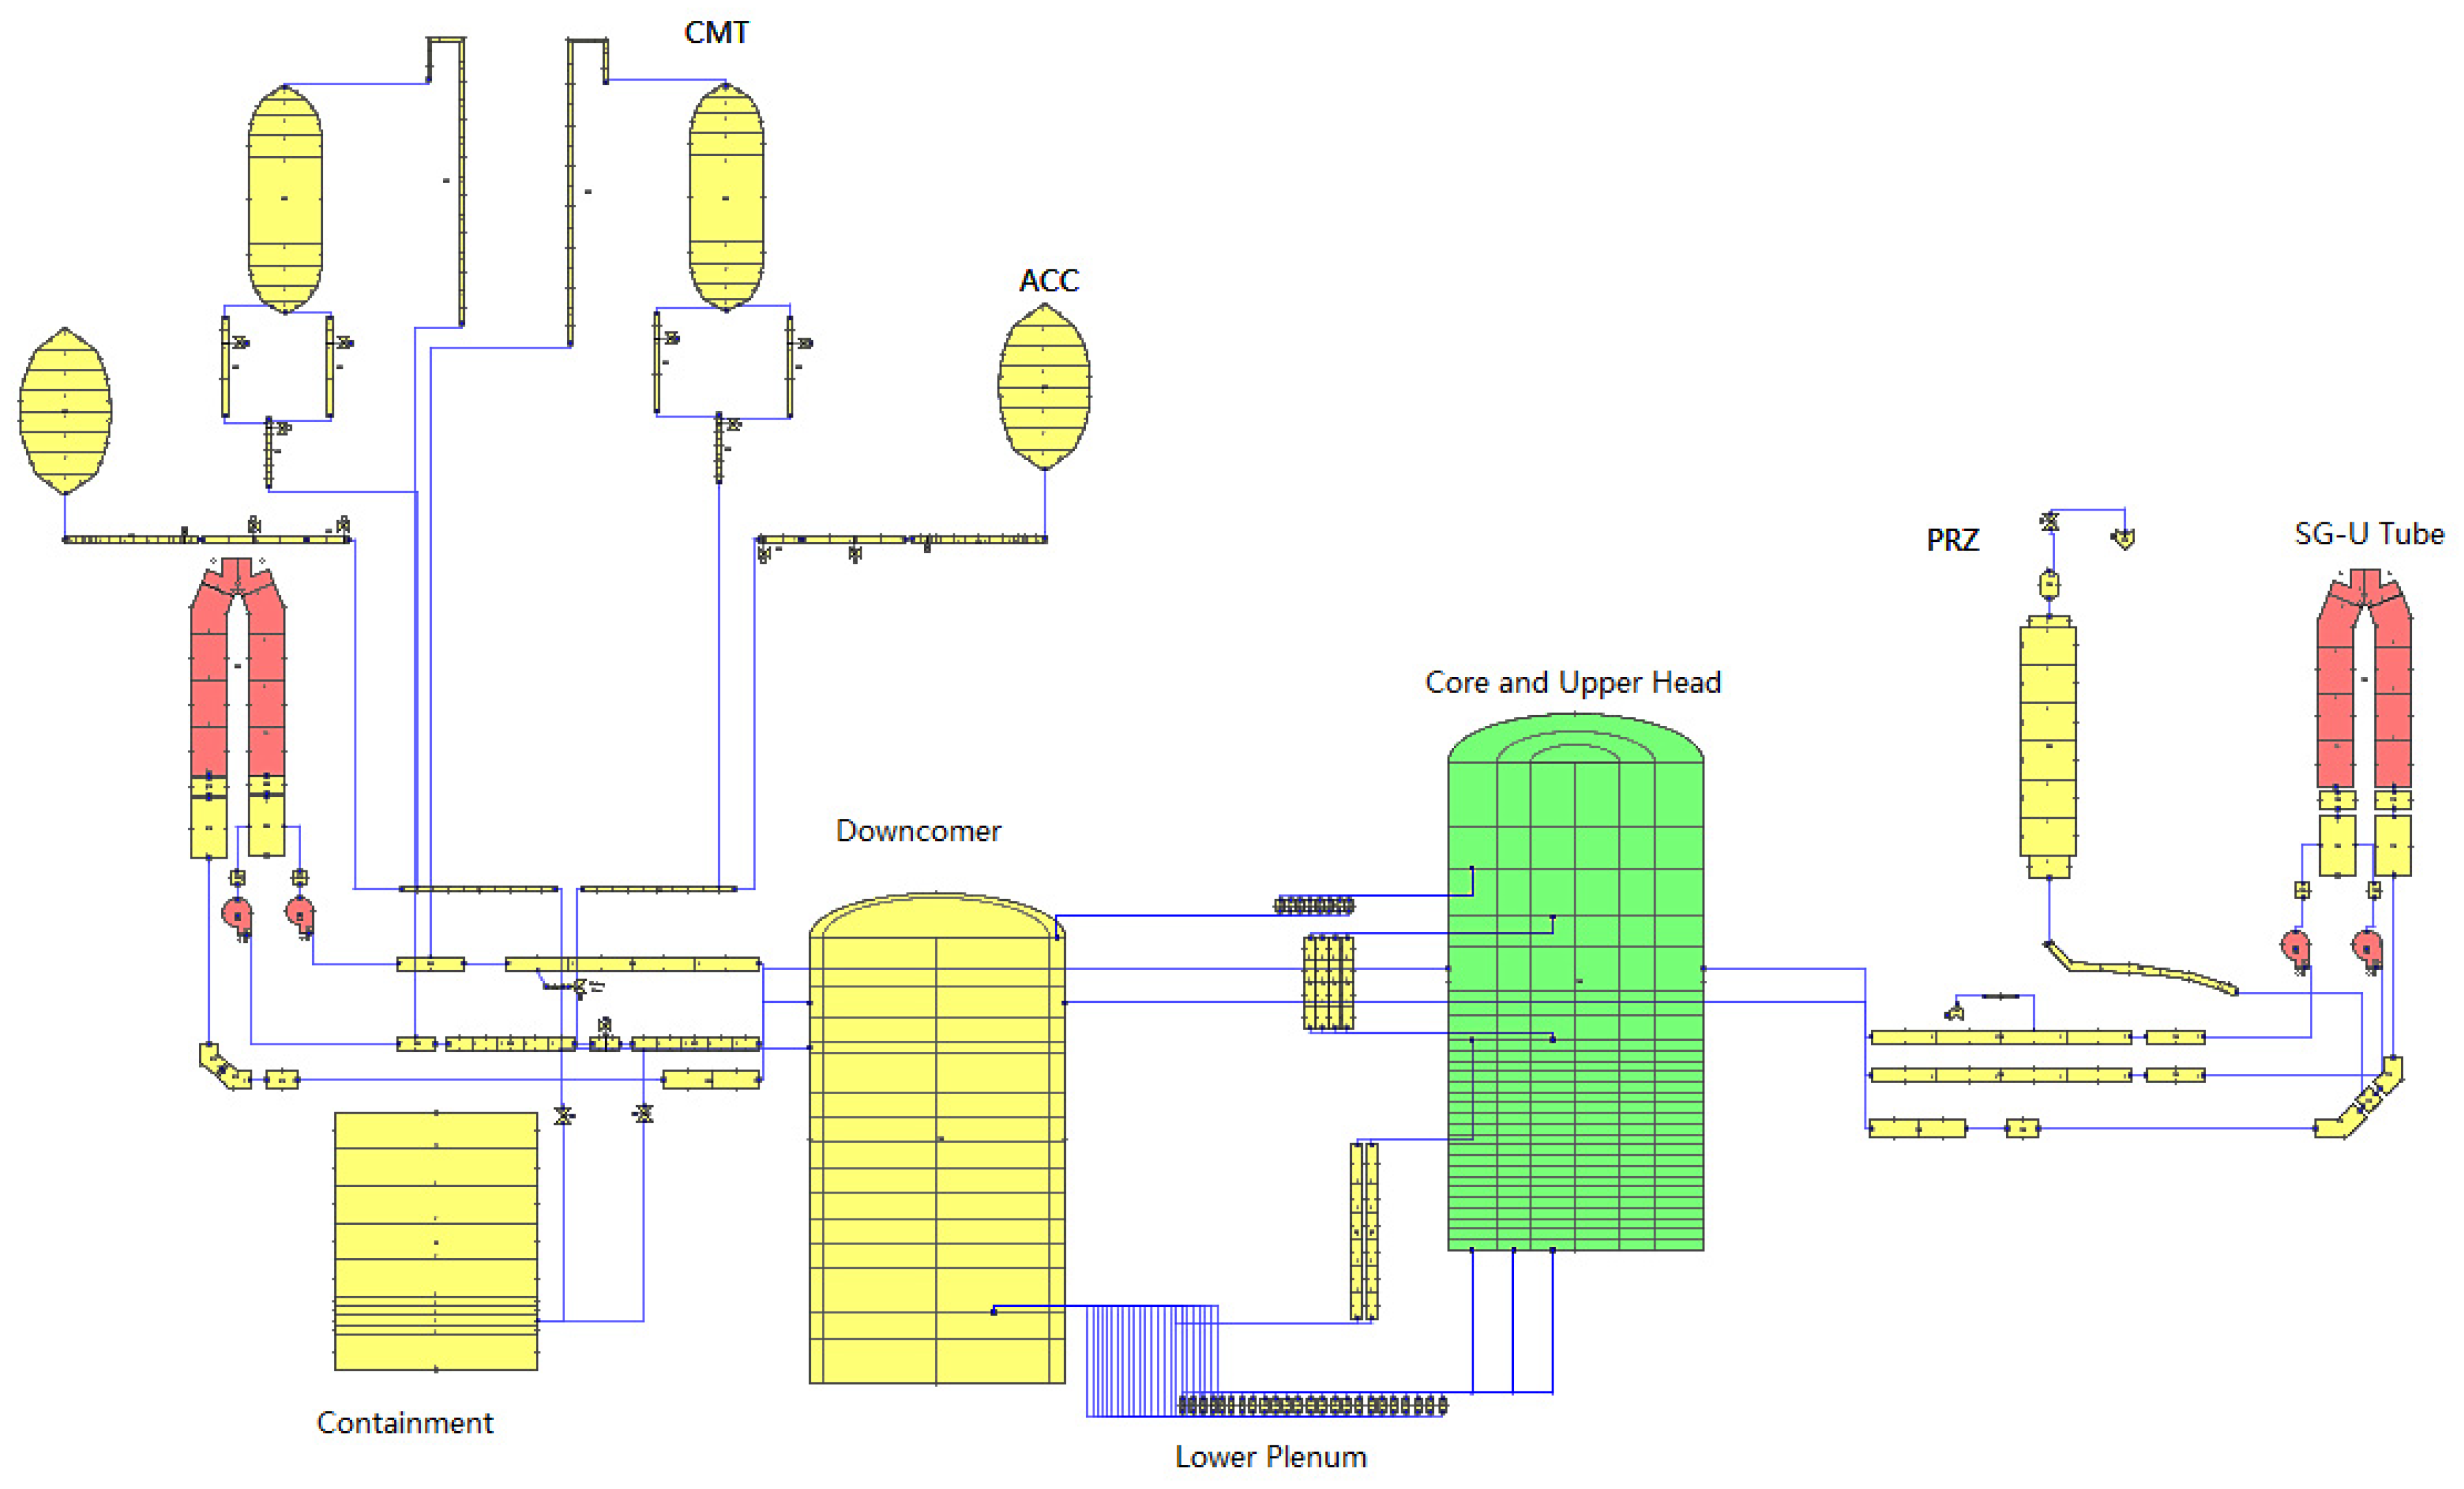
The APPWR NPP has some special features such as the different levels of cold and hot legs inlet and outlet connections to the vessel. As a result, two vessel models are applied, as shown in Figure 2. The downcomer and lower head are simulated in Vessel 1, while the core and upper head are located in Vessel 2. The parameters of junctions between two vessels are set to suit the mass flow of downcomer bypass and other hydraulic phenomena.

Figure 2.
Nodalization model for APPWR first loop and safety injection system.
Vessel 1 is split into two radial parts and eight azimuthal parts. In this way, the model can simulate the distribution of inlet flow and injection flow in the core. Three radial cells and four azimuthal cells are contained in Vessel 2. The lower core plenum connects the downcomer, and the reactor core is simulated by 32 pipes.
The TRACE model contains two loops, four pumps, two SGs, and one ECCS. The ECCS is consist of two CMTs, two ACCs, one IRWST, and one heat exchanger. The containment for LBLOCA is considered in this case for the pressure situation of the break. The containment pipe is divided into 10 cells. Two break valves connect to the containment in cell No.3. The geometry of the cells nearby the break is smaller than the others to achieve easier convergence. The simulation model is shown in Figure 2.
3.3. Model Verification of BEPU
The basic case is used to verify the numerical model. Compared with the analysis result in the preliminary safety analysis report (PSAR), the basic case uses the same initial condition and trigger signal, but with different code for calculation. The design data from the vendor are used to make sure that the results from the BEPU analysis have the same trend and that the results can be explained.
The main parameters in BEPU analysis and the design data are compared (in a non-dimensional form or error according to the non-disclosure agreement) in Table 3. The simulated mass flow rate in the main loop and reactor core match the design flow rate well. The power and pressure of the reactor coolant system (RCS) coincide exactly with the design data. The temperature and SG-out-dome pressure have much larger errors than the remainder, but the errors can be accepted for the analysis of the LBLOCA transient. It should be stated that the long-term phase of the transient is not included in the present analysis.
Table 3.
Errors with respect to design data in APPWR steady state.
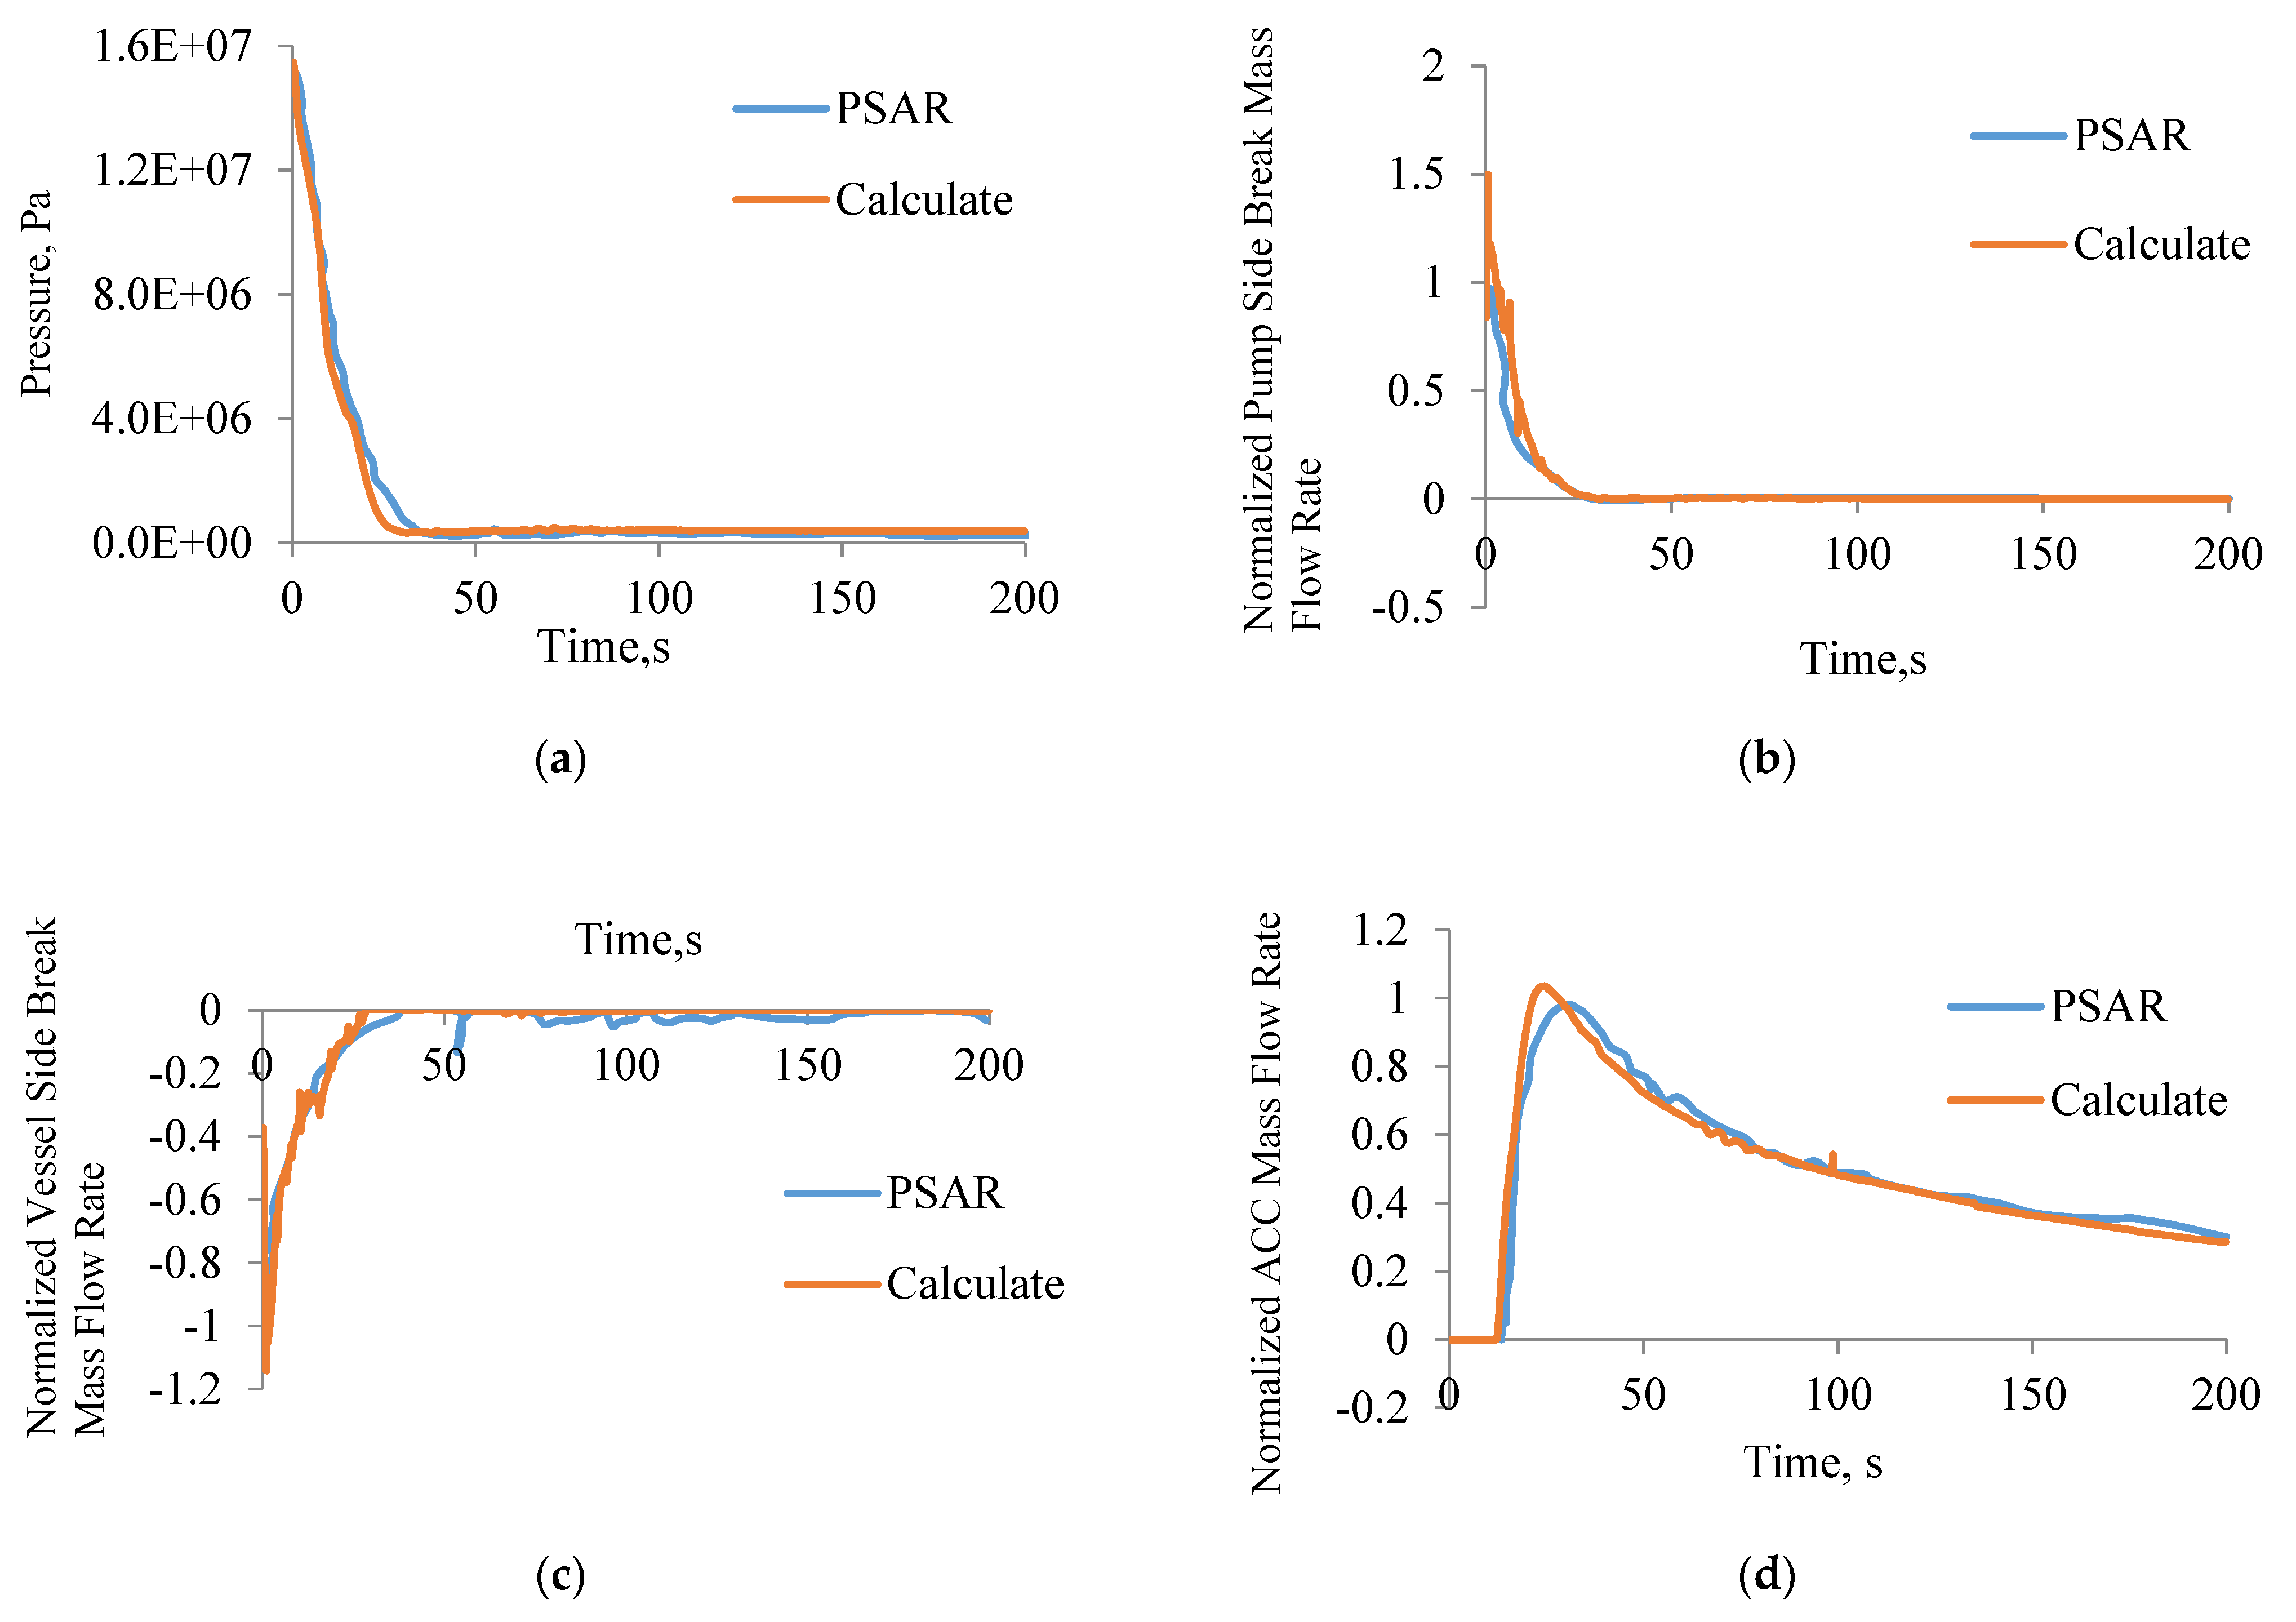
The basic case is executed by TRACE code, and the results are used to verify the numerical model. A comparison of the event sequence with the design data is shown in Table 4. Since the NPP data belong to the company, it is not possible to publish the design parameters. As shown in Table 4 and Figure 3, the break occurs at 0 sec, and the pressure of the pressurizer (first loop) decreases sharply. According to the accident safety logic design, the containment high pressure or pressurizer low pressure signal will trigger the CMT isolation valve open; the RCPs then trip, and main feedwater is shut down with a delay of few seconds as the S signal occurs. The reactor scrams automatically, following the signal of PZR low pressure. At the beginning of the transient, CMT injection quickly starts, but the RCS depressurizes quickly so that the ACC set-point could be reached in a few seconds, and then the injection of CMT is cut off.
Table 4.
The Comparison of Event Sequences.
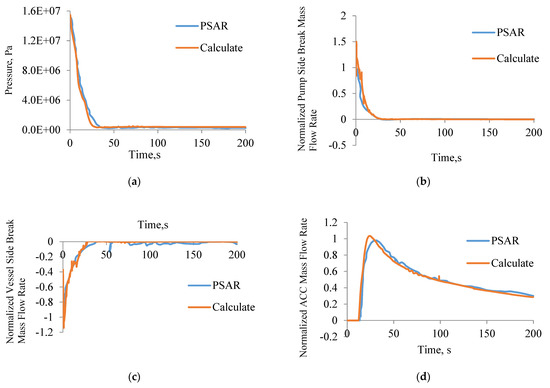
Figure 3.
Basic comparison: (a) pressure of first loop; (b) mass flow rate of pump side break; (c) mass flow rate of vessel side break; (d) ACC mass flow rate.
According to Table 4, the activated sequences of main components are almost the same. This implies that the mass flow rate into the vessel or out of the vessel is consistent with the design value. The other reason for this is that the S-signal is triggered by containment high pressure when the condensation of coolant is not obvious. The CMT isolation valves and RCPs follow the S-signal, with a delay of several seconds.
Because the discharge mass flow is higher than the design value, the pressure decreases faster than the former. Safeguards signal (S) triggered by containment pressure is earlier than design data, as well as the activated time of ACC injection. Pressure and ACC mass flow rate are shown in Figure 3.
The comparison between the results obtained by TRACE and those by PSAR demonstrates that similar phenomena are leading the transient evolution in the basic case. It can be used as a base case in further safety analysis with the BEPU method.
However, mass flow rate through the break is higher than the design data. During the first 5 seconds, the pump side mass flow rate is much higher than the data from the PSAR. The broken model (including choked flow and discharge coefficients) is different.
4. APPWR BEPU Analysis
4.1. Uncertainty Parameters for BEPU Analysis
The phenomenon identification and ranking table (PIRT) was a basic part of the BEPU methodology, and it is extensively used in the BEPU realm. The physical phenomena that govern the evolution of the transient are identified and ranked according to their importance in PIRT (i.e., their influence on the results of the transient).
APPWR PIRT is used to identify the most important uncertainty input parameters. These parameters were chosen based on the key phenomena governing the transient. Since the design company refuses to announce APPWR LBLOCA PIRT, the details of the PIRT are not shown in this article. However, uncertainty parameters are chosen from the high-level parameters in APPWR LBLOCA PIRT. However, some high-level parameters in PIRT are not selected. Because some parameters, such as the core resistance, reflood heat-transfer equation, cannot be sampled in the TRACE code, some high-level parameters in PIRT are treated conservatively. Other parameters are selected as uncertain parameters, and the probability density functions (PDF) of uncertain parameters is provided by design company.
Generally speaking [19,20,21,22,23], the accident process was divided into four stages according to the typical characteristics of thermal–hydraulic phenomena, namely blowdown phase, refilling phase, reflooding phase, and long-term cooling phase. The gap conductance of fuel influences fuel average temperature and fuel storage energy under steady-state condition and further influences PCT during large break LOCA process. The average linear power density mainly affects the initial temperature of the fuel rods and fuel energy storage and has a greater impact on the refilling phase, while the decay heat is much more important during reflooding phase. The water of the accumulator is injected into the core in the early stage of the refilling phase. The parameters of ACC are the key factors to PCT. The important ranks of the uncertain parameters can be seen in sensitivity analyses conducted for scale-down passive test facilities or similar NPPs [24].
Table 5 shows the probability density functions (PDF) assigned to the parameters.
Table 5.
Uncertain parameters and associated PDFs.
4.2. Uncertainty Analysis
For each uncertainty parameter, DAKOTA performs a Monte Carlo sampling according to range and deviation and producing a set of value as the input of TRACE code for each calculation. After 124 cases are executed, the PCT values are generated as the result of BEPU.
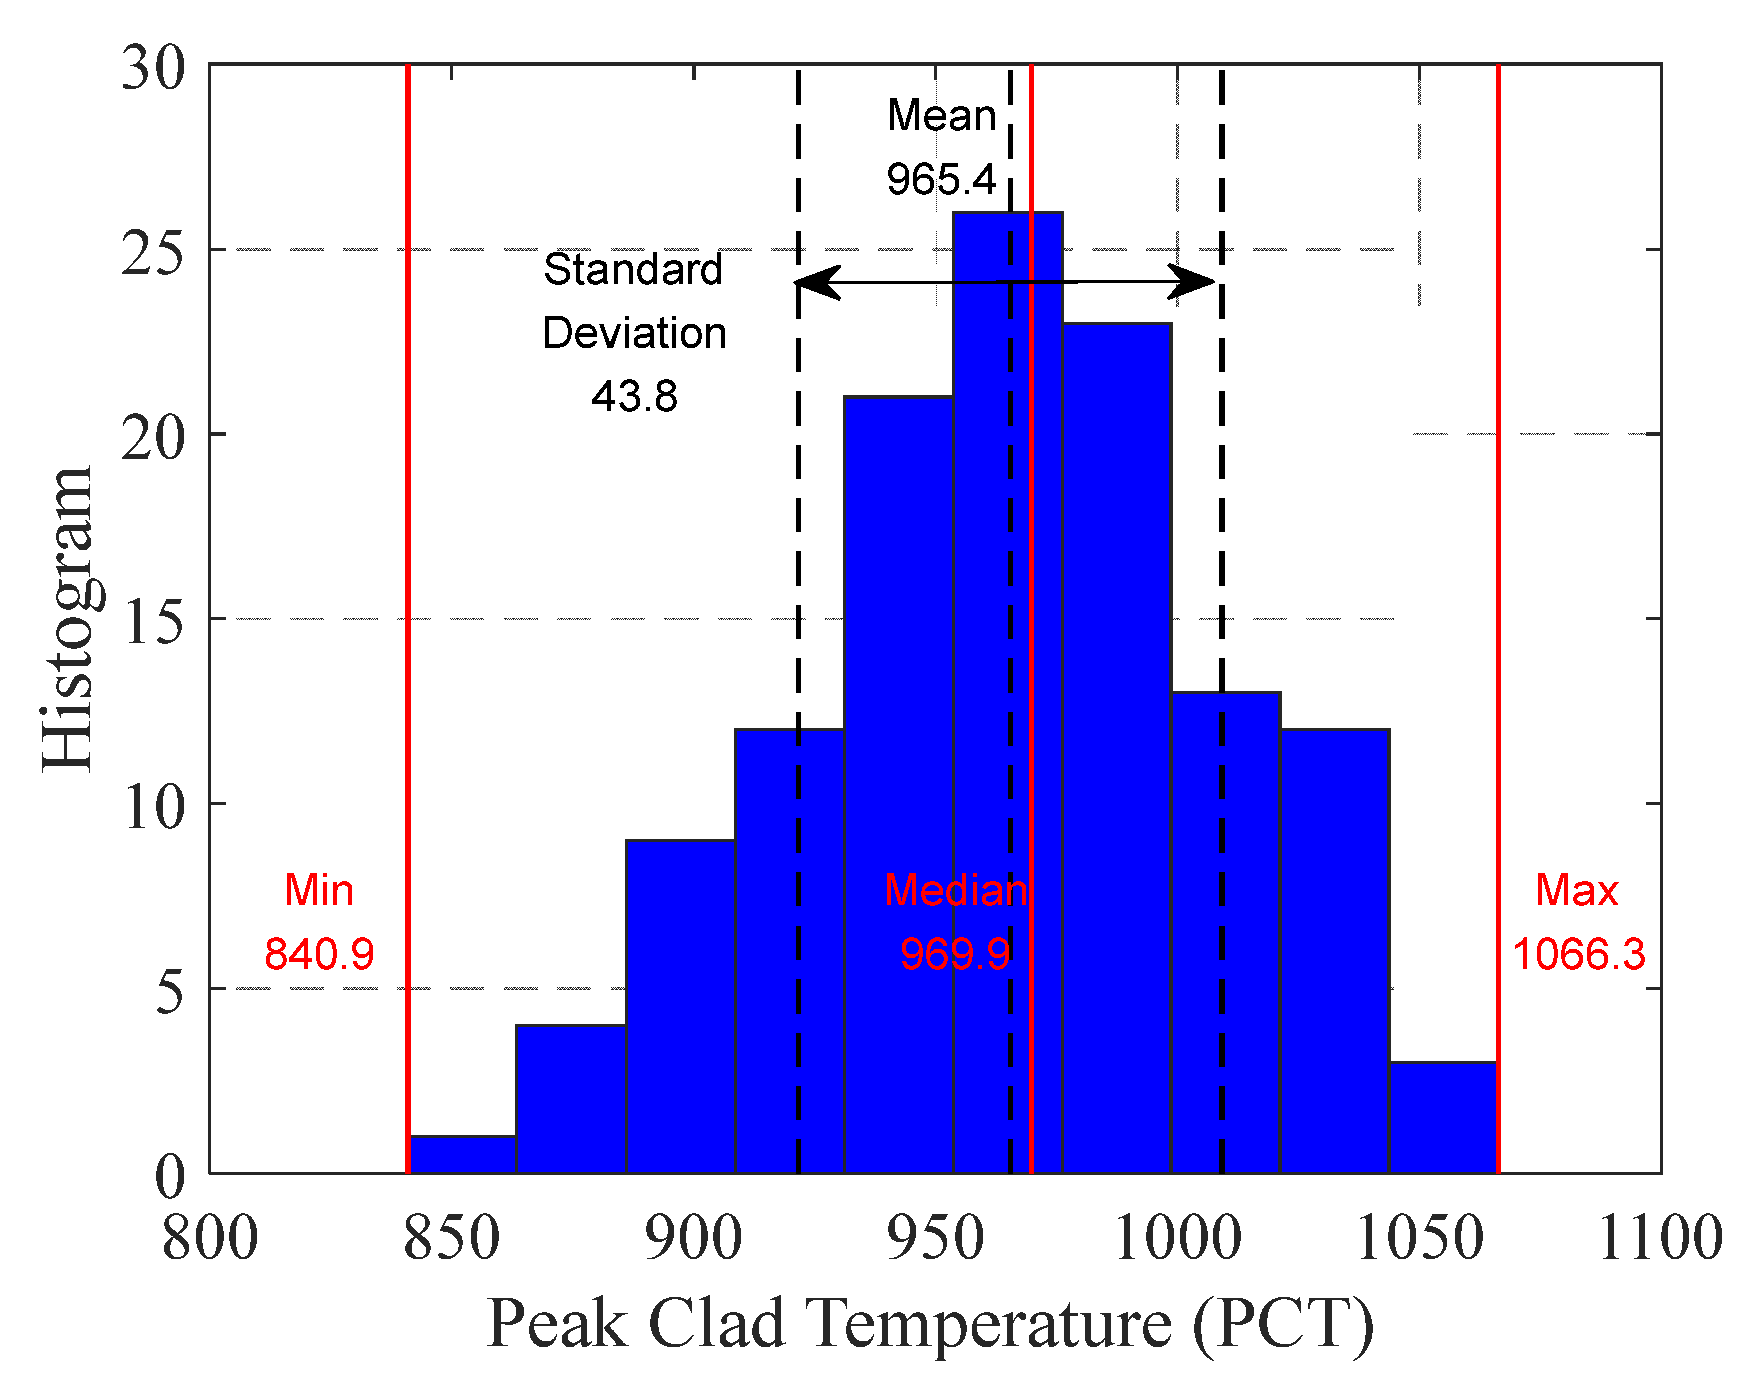
The first three ranks of PCT are shown in Table 6. The third maximum (i.e., the 95/95 tolerance limit) is 1050.53 K, significantly lower than the regulatory limit of 1477 K. Therefore, a major outcome of the BEPU LOCA/ECCS analysis is the fulfillment of the regulatory criterion of PCT. Based on DAKOTA, empirical PDF as a histogram and basic statistical results for PCT is shown in Figure 4. The mean of PCT is 965.4K. The standard deviation is 43.8, representing a large difference between most of the values and its average.
Table 6.
PCT ranks.

Figure 4.
PCT empirical CDF (Histogram) and Statistical results in 124 cases.
Based on probability analysis, a further statistical test is carried out. The results show that the test of the probability distribution is passed by SW test with 95% confidence.
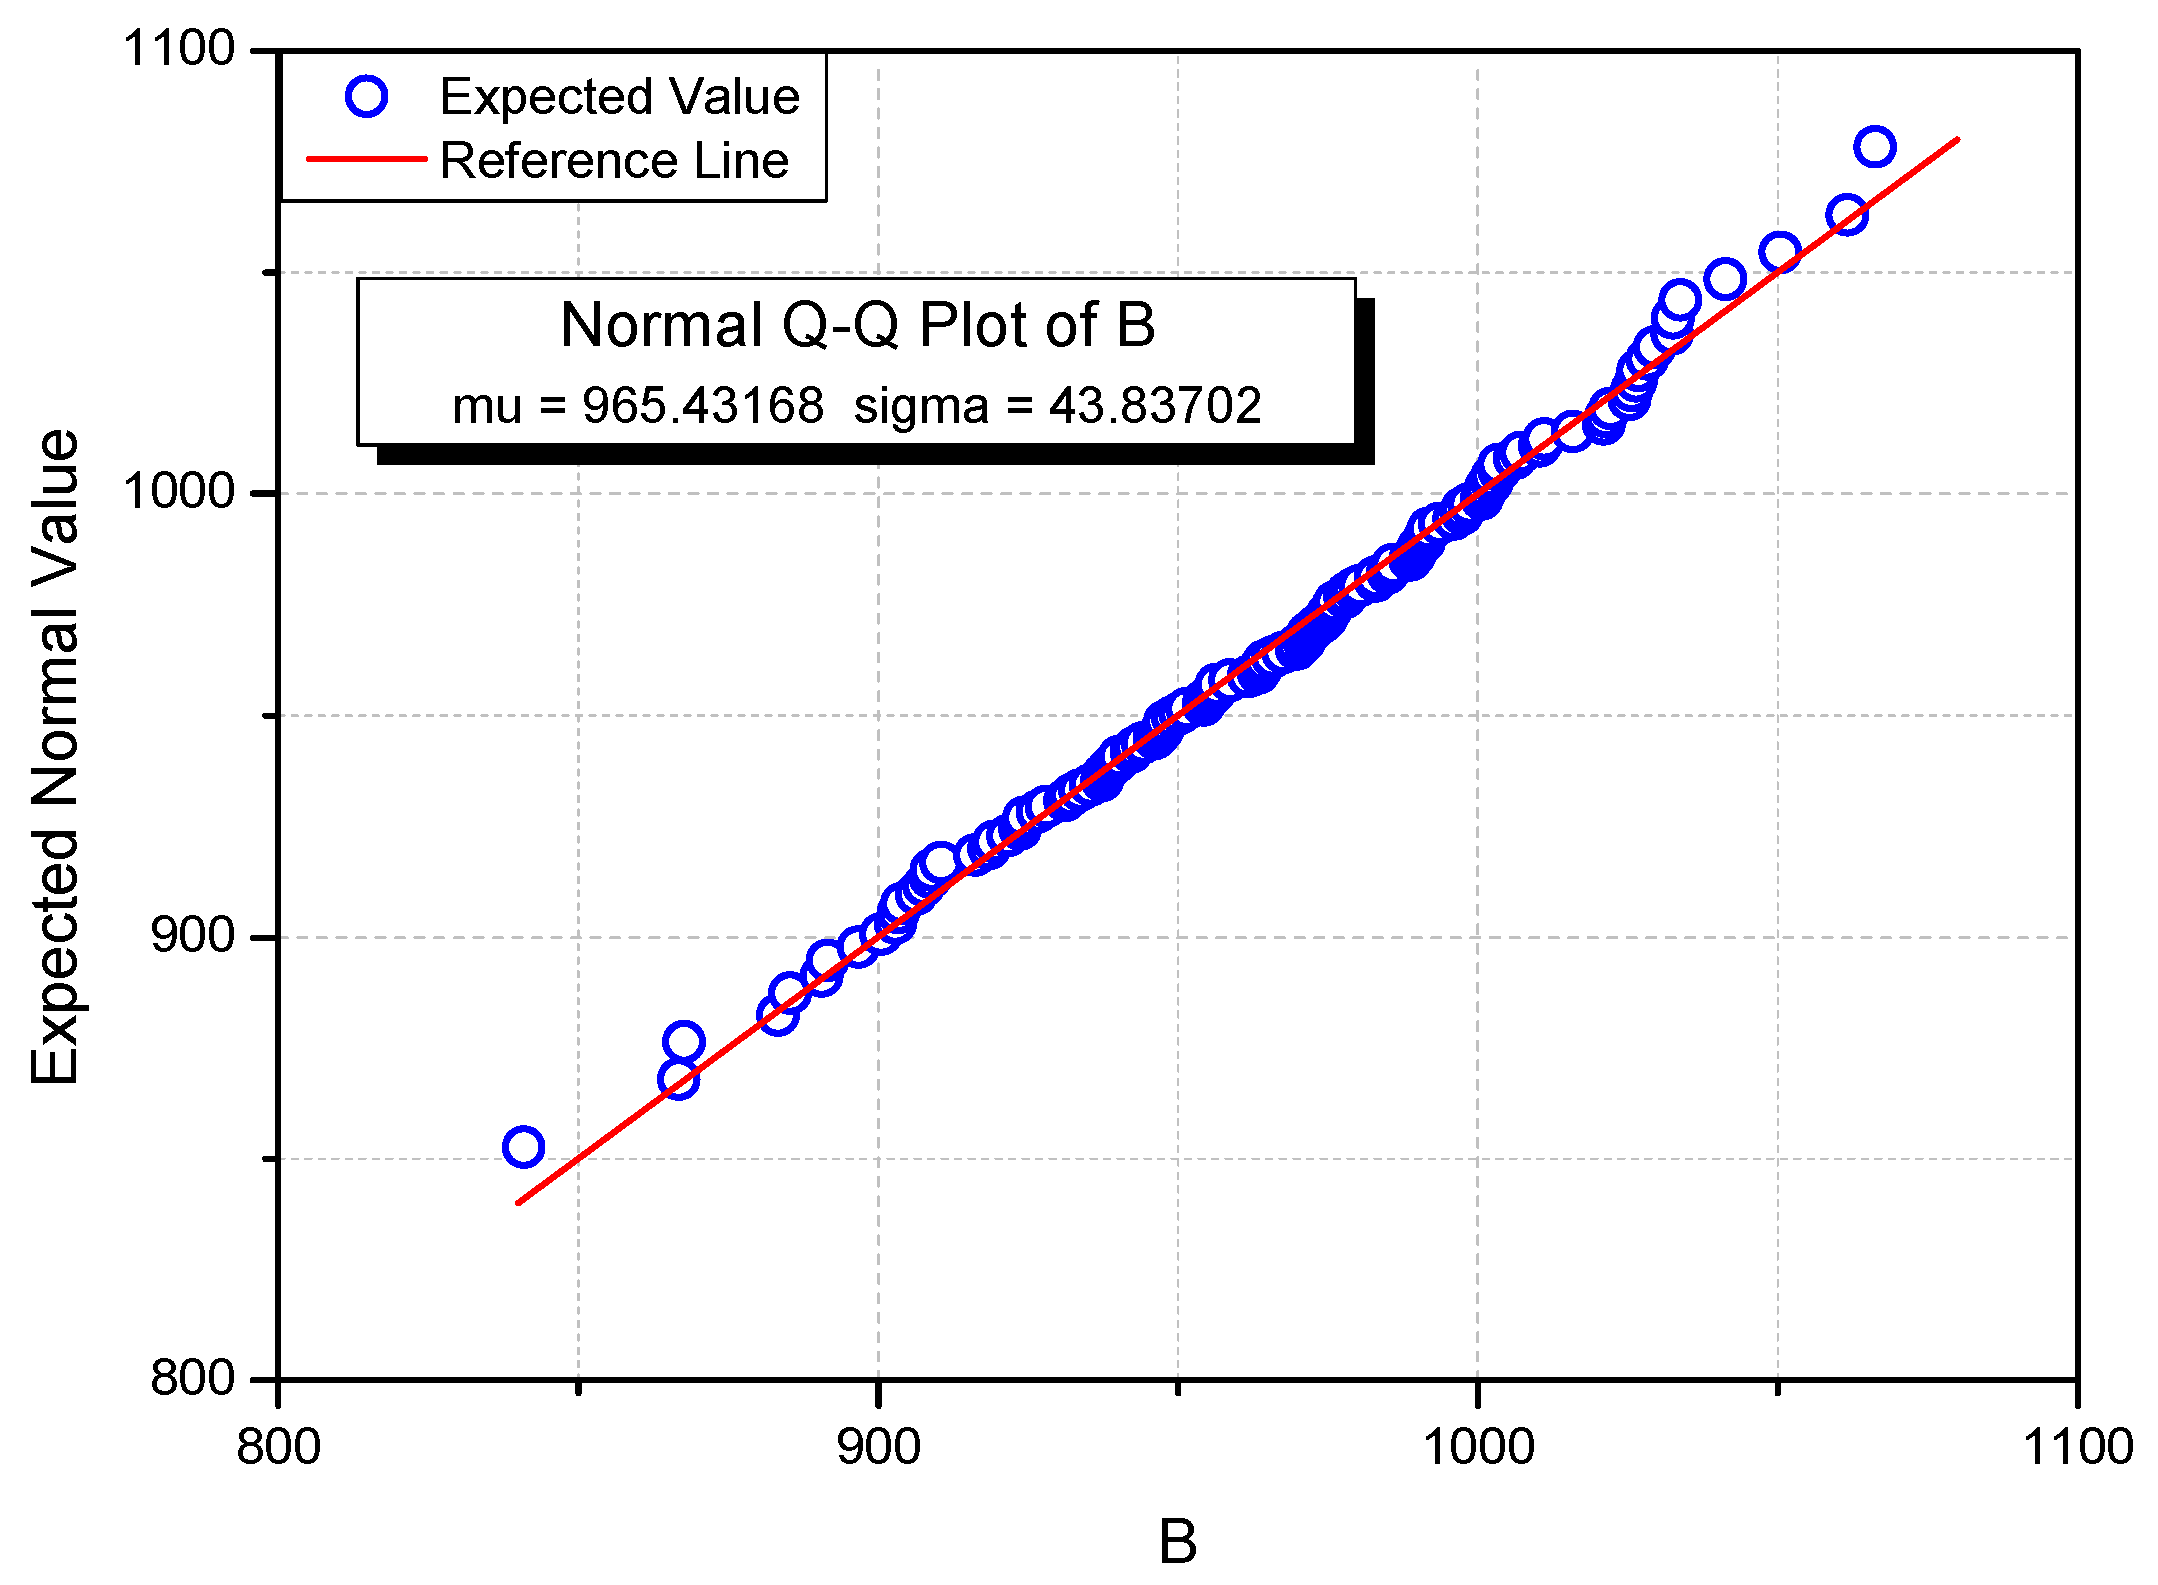
In addition, Figure 5 shows that the distribution of sample points has good linearity and is very close to the trend line. Except for the points near the ends, the sample points are basically distributed around the trend line and conform to the normal distribution.
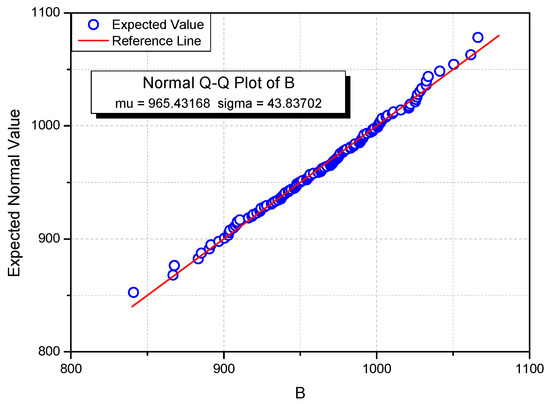
Figure 5.
Distribution of sample points.
4.3. Sensitivity Analysis
A number of techniques exist for assessing the importance of the input parameters in a BEPU analysis [25,26,27,28]. Here, importance may be understood as an influence on the figures-of-merit (PCT). In the present analysis, the 124 samples of inputs–outputs of the calculations may be used to assess the relative influence of the input parameters on the PCT.
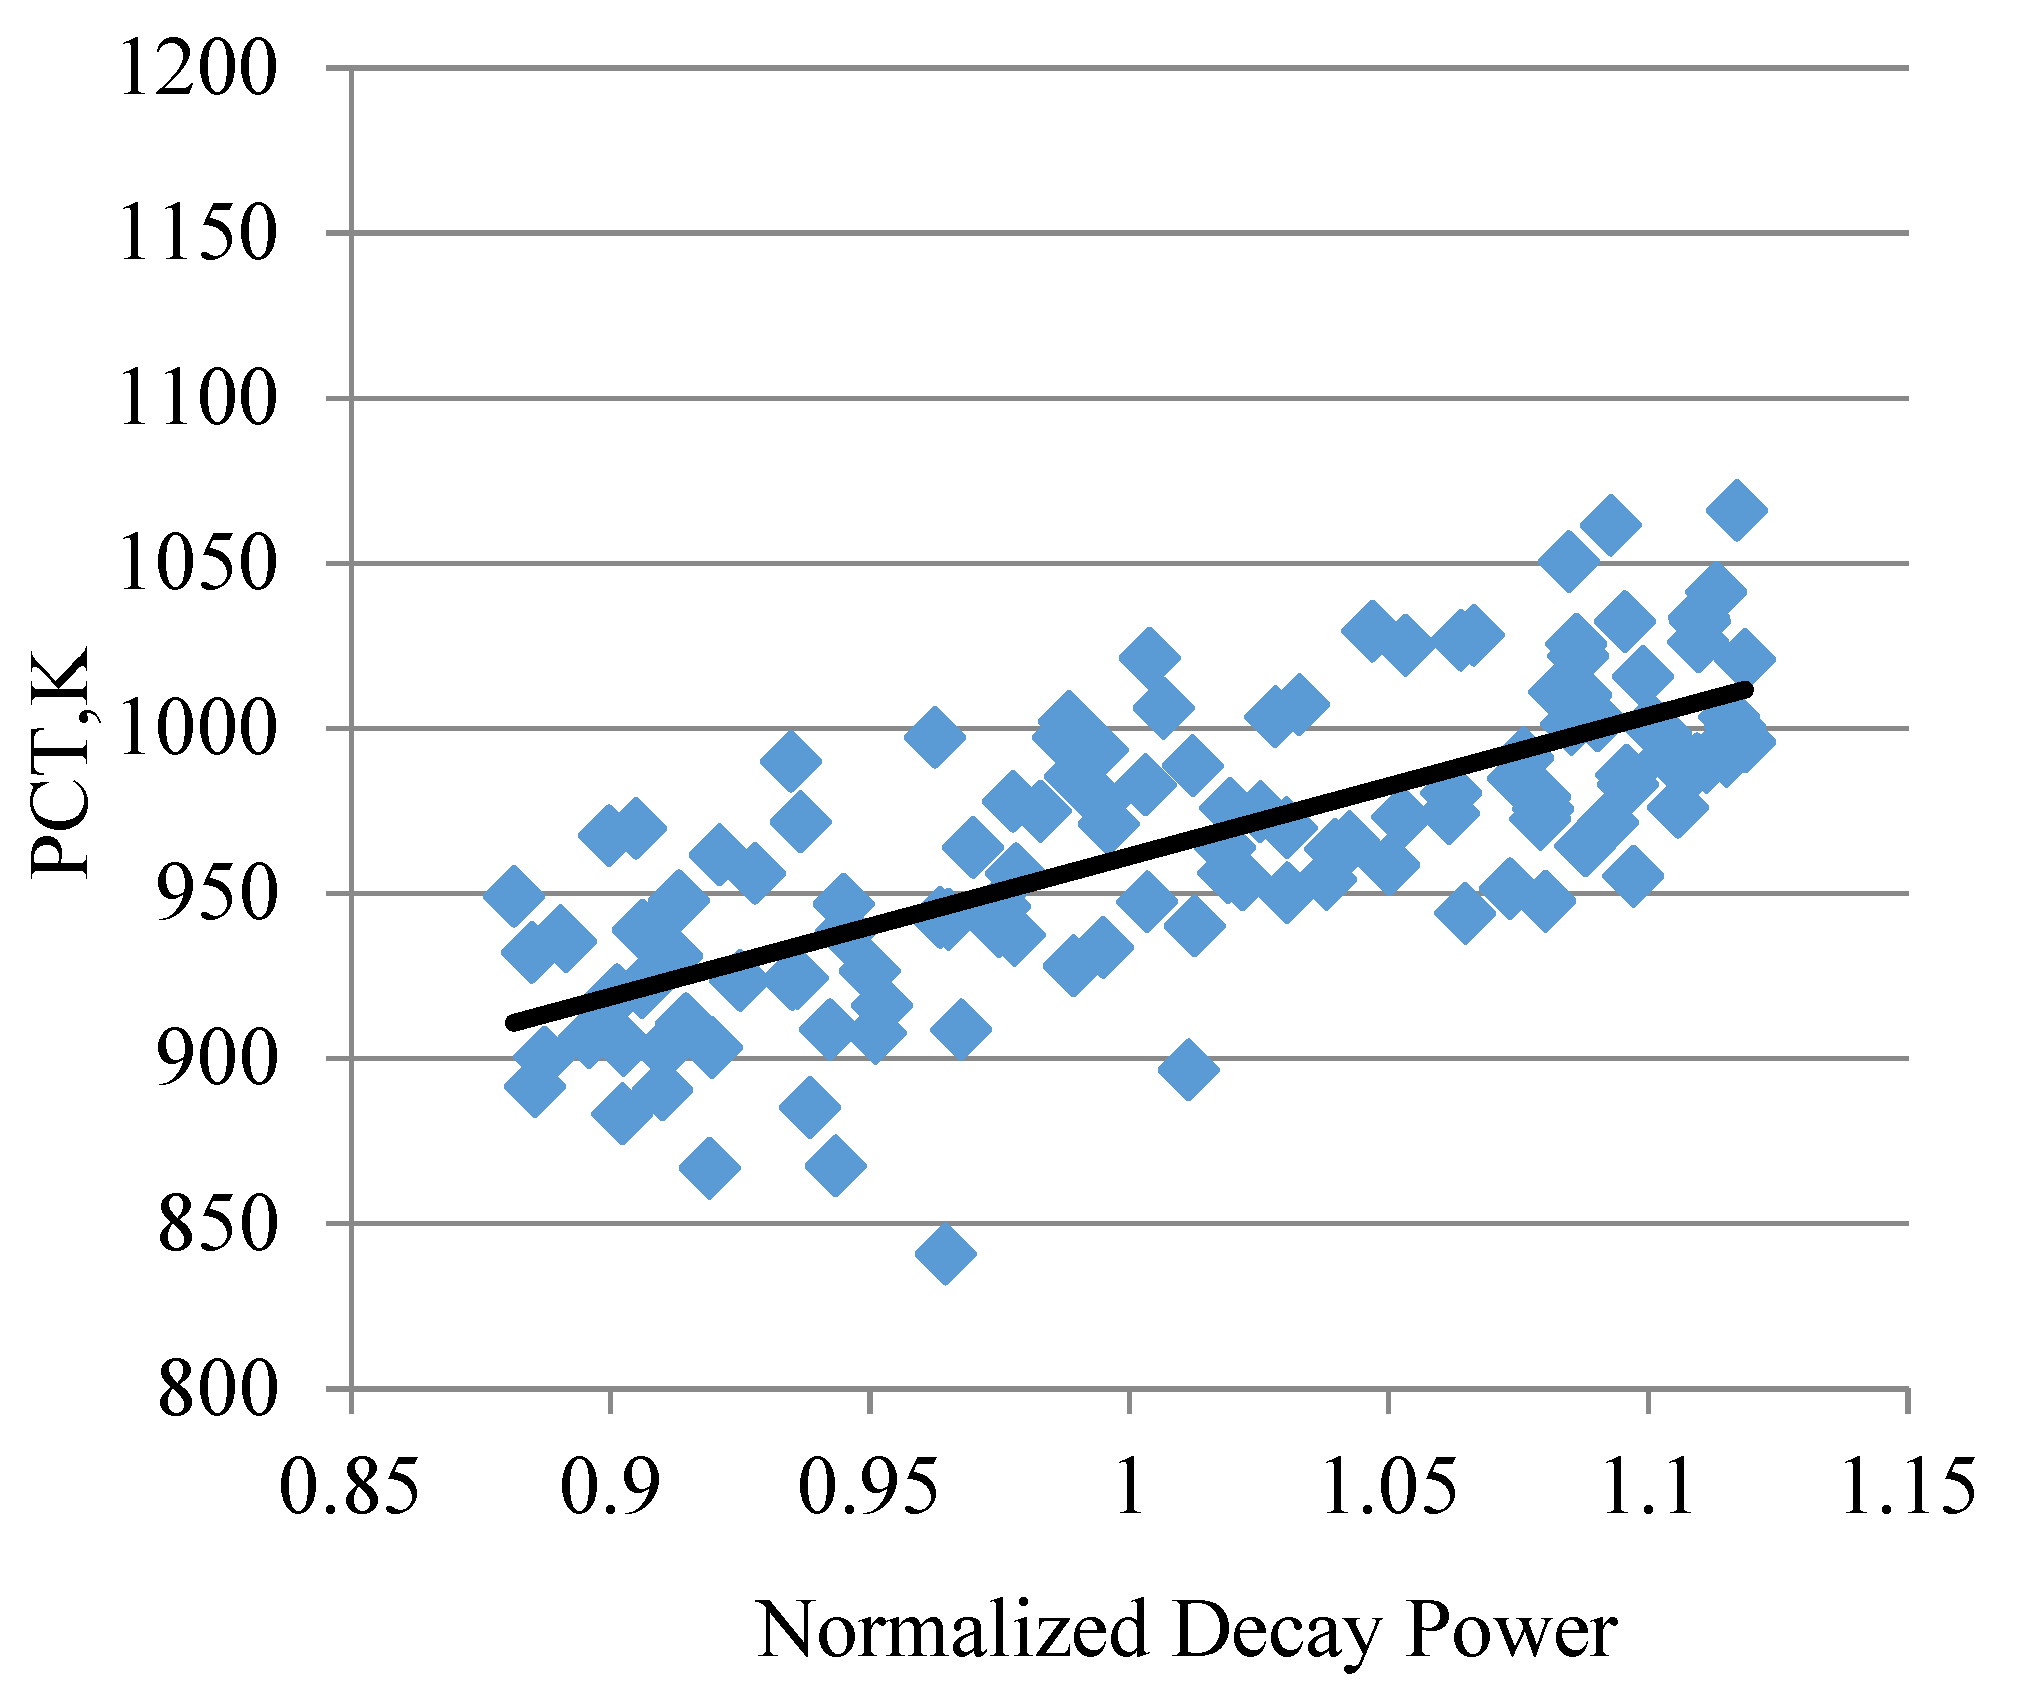
A very well-known technique is that of scatter plots, where the figure-of-merit is plotted against input parameters for the sampled values. Scatter plots with a uniformly distributed cloud of points indicate parameters with little influence on the results, whereas scatter plots with a non-uniform shape of the cloud indicate parameters that are more significant. Figure 6 is a typical scatter plot of PCT against decay heat coefficient. The positive correlation of PCT with decay heat coefficient is apparent.

Figure 6.
PCT vs. Decay Heat Coefficient Scatter Plot.
A simple technique for quantitatively assessing the importance of input parameters is based on the calculation of ‘raw’ correlation coefficients: the simple (i.e., Pearson) and the partial one [29,30]. Additional techniques would be based on rank correlation coefficients, obtained when the numerical values of the magnitudes are replaced by their rank [11].
The uncertain parameters in Table 5 are considered independent. For that reason, it is expected that simple and partial correlation coefficients will give very similar values for the present analysis.
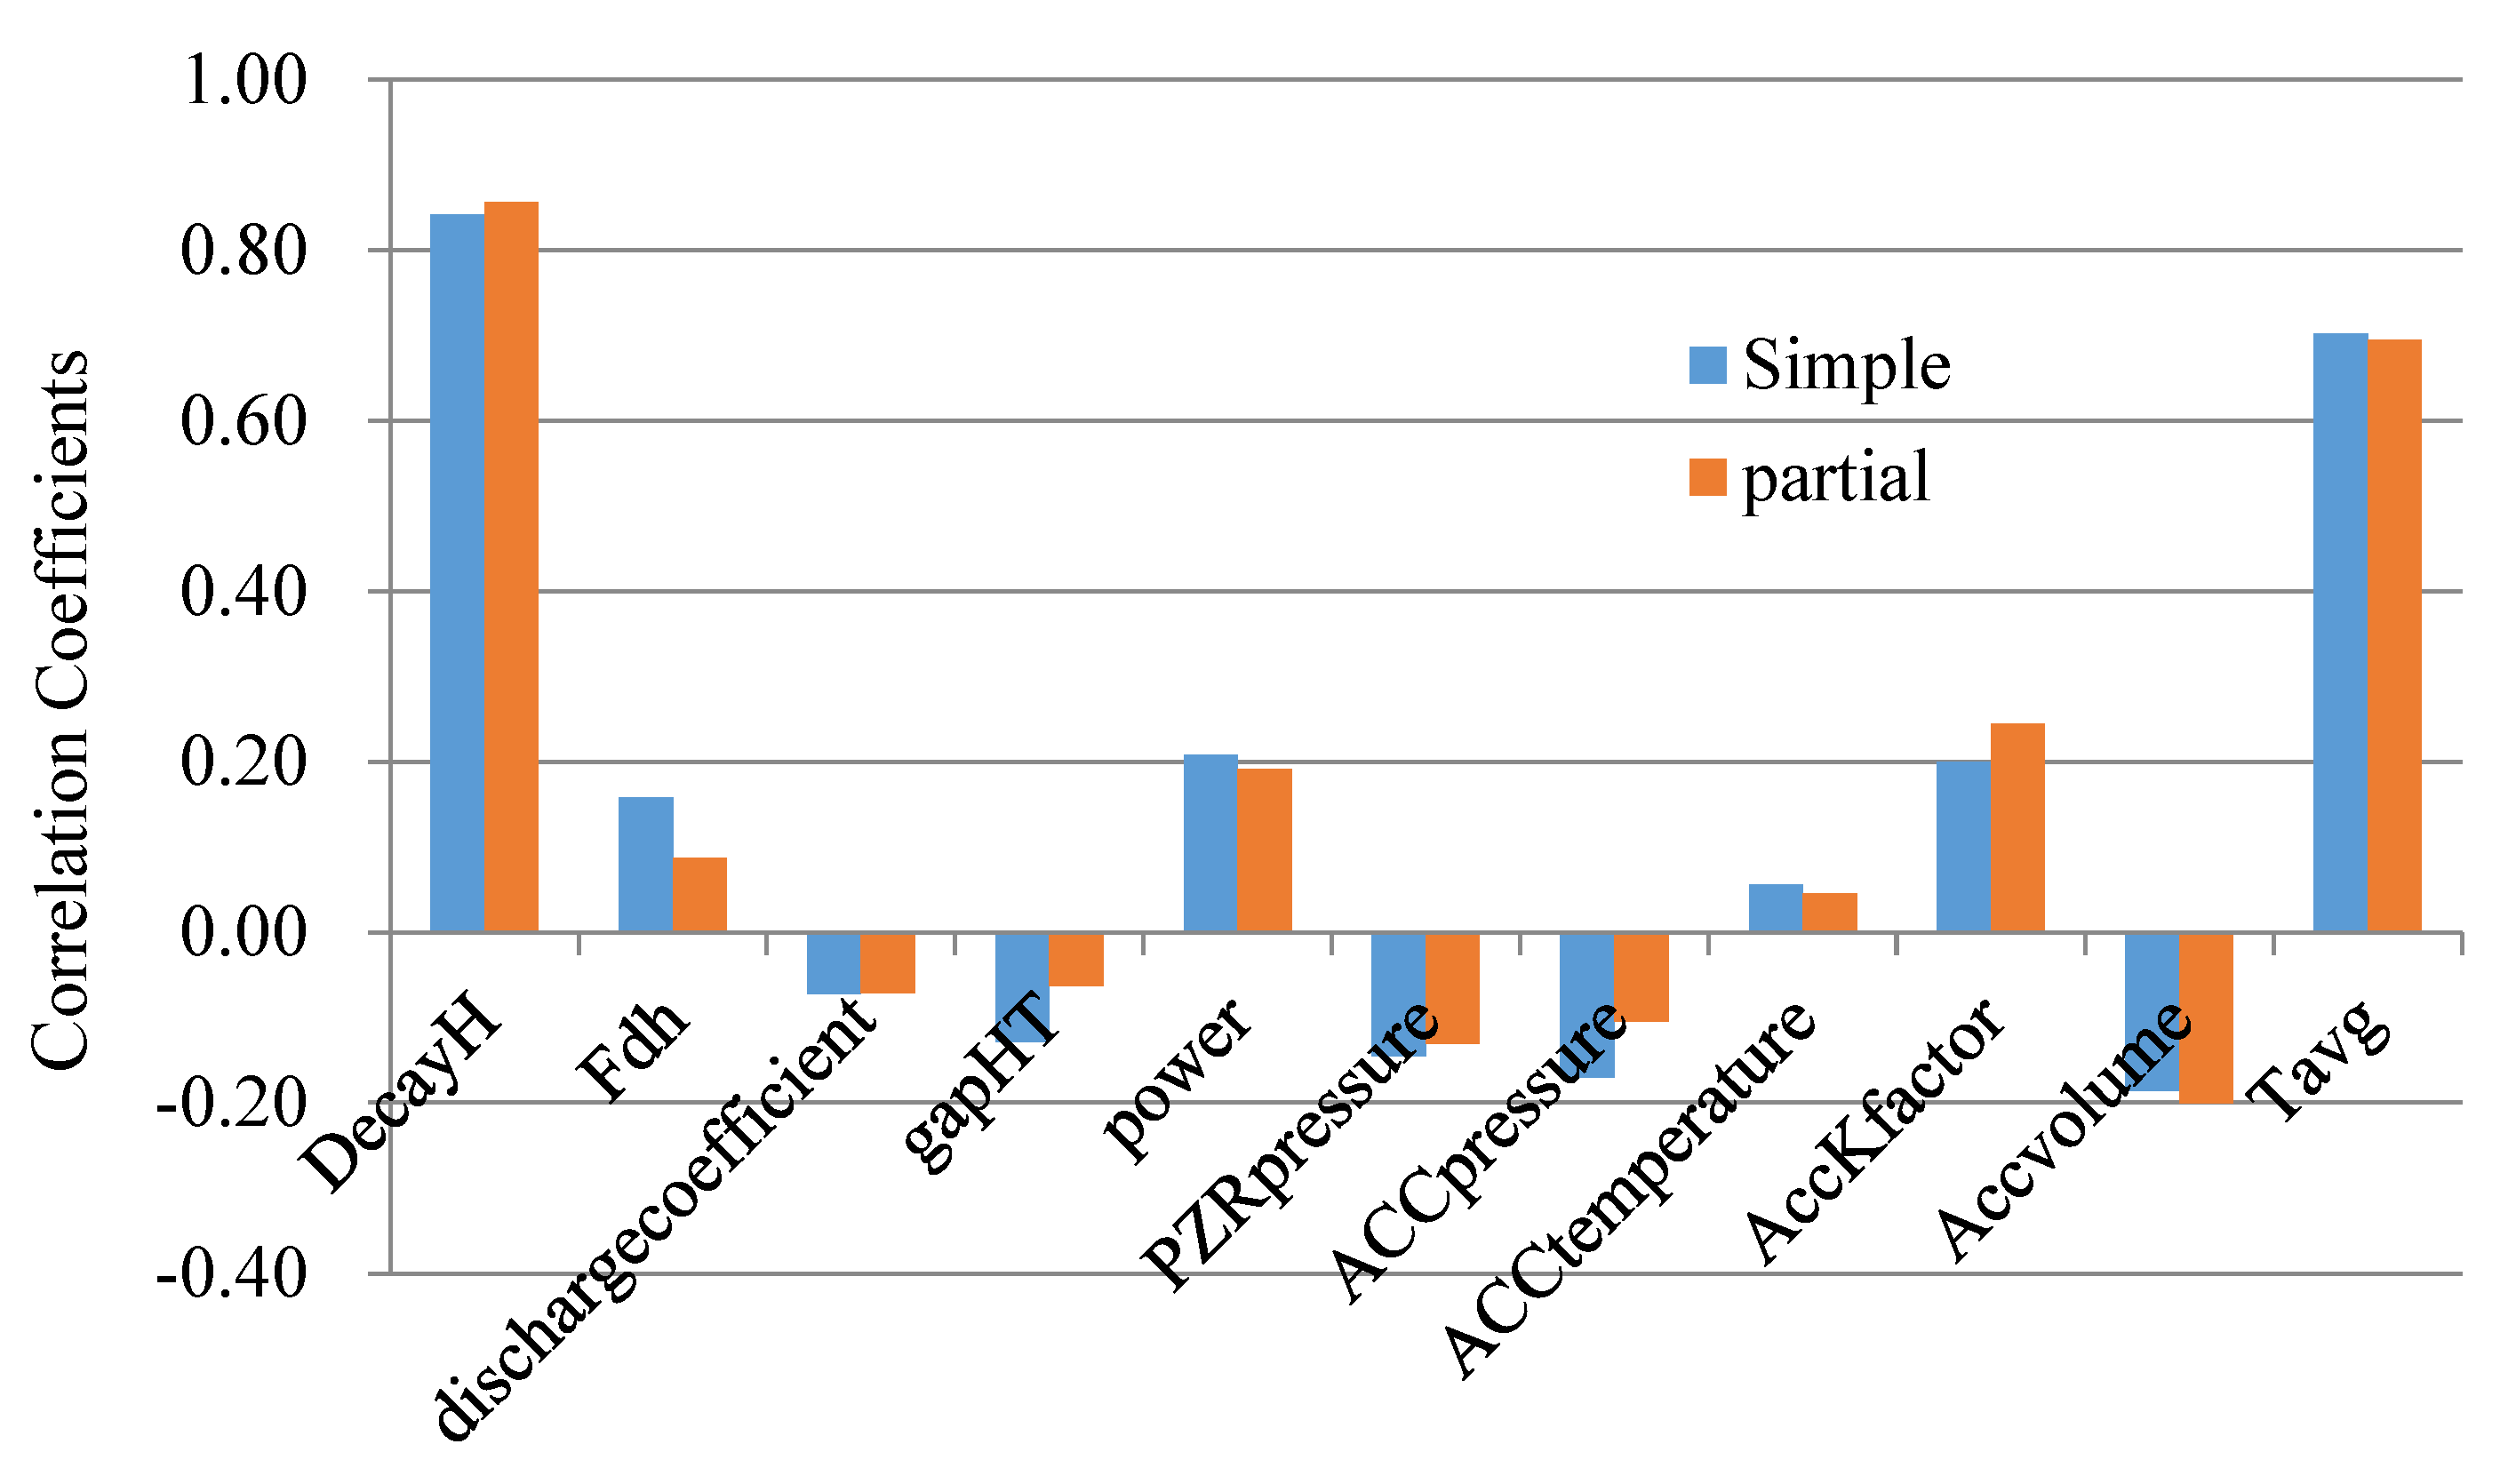
Figure 7 shows the “raw” simple and partial coefficients. It is apparent that decay heat coefficient and average temperature of RCS are the two most influential factors on PCT. The impacts of Fdh, average linear power density, and ACC friction factor on PCT are not particularly significant. However, some negative correlations with PCT are obtained for the parameters such as discharge coefficient in the break, gap conductance, initial condition of ACC, and pressure of RCS.
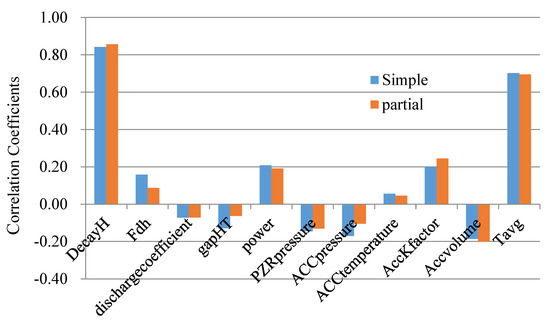
Figure 7.
Simple and partial ‘raw’ of input parameters with PCT.
For the subsequent design, the changed item involves the decay power, or the average temperature of the coolant will strongly impact the PCT in LBLOCA.
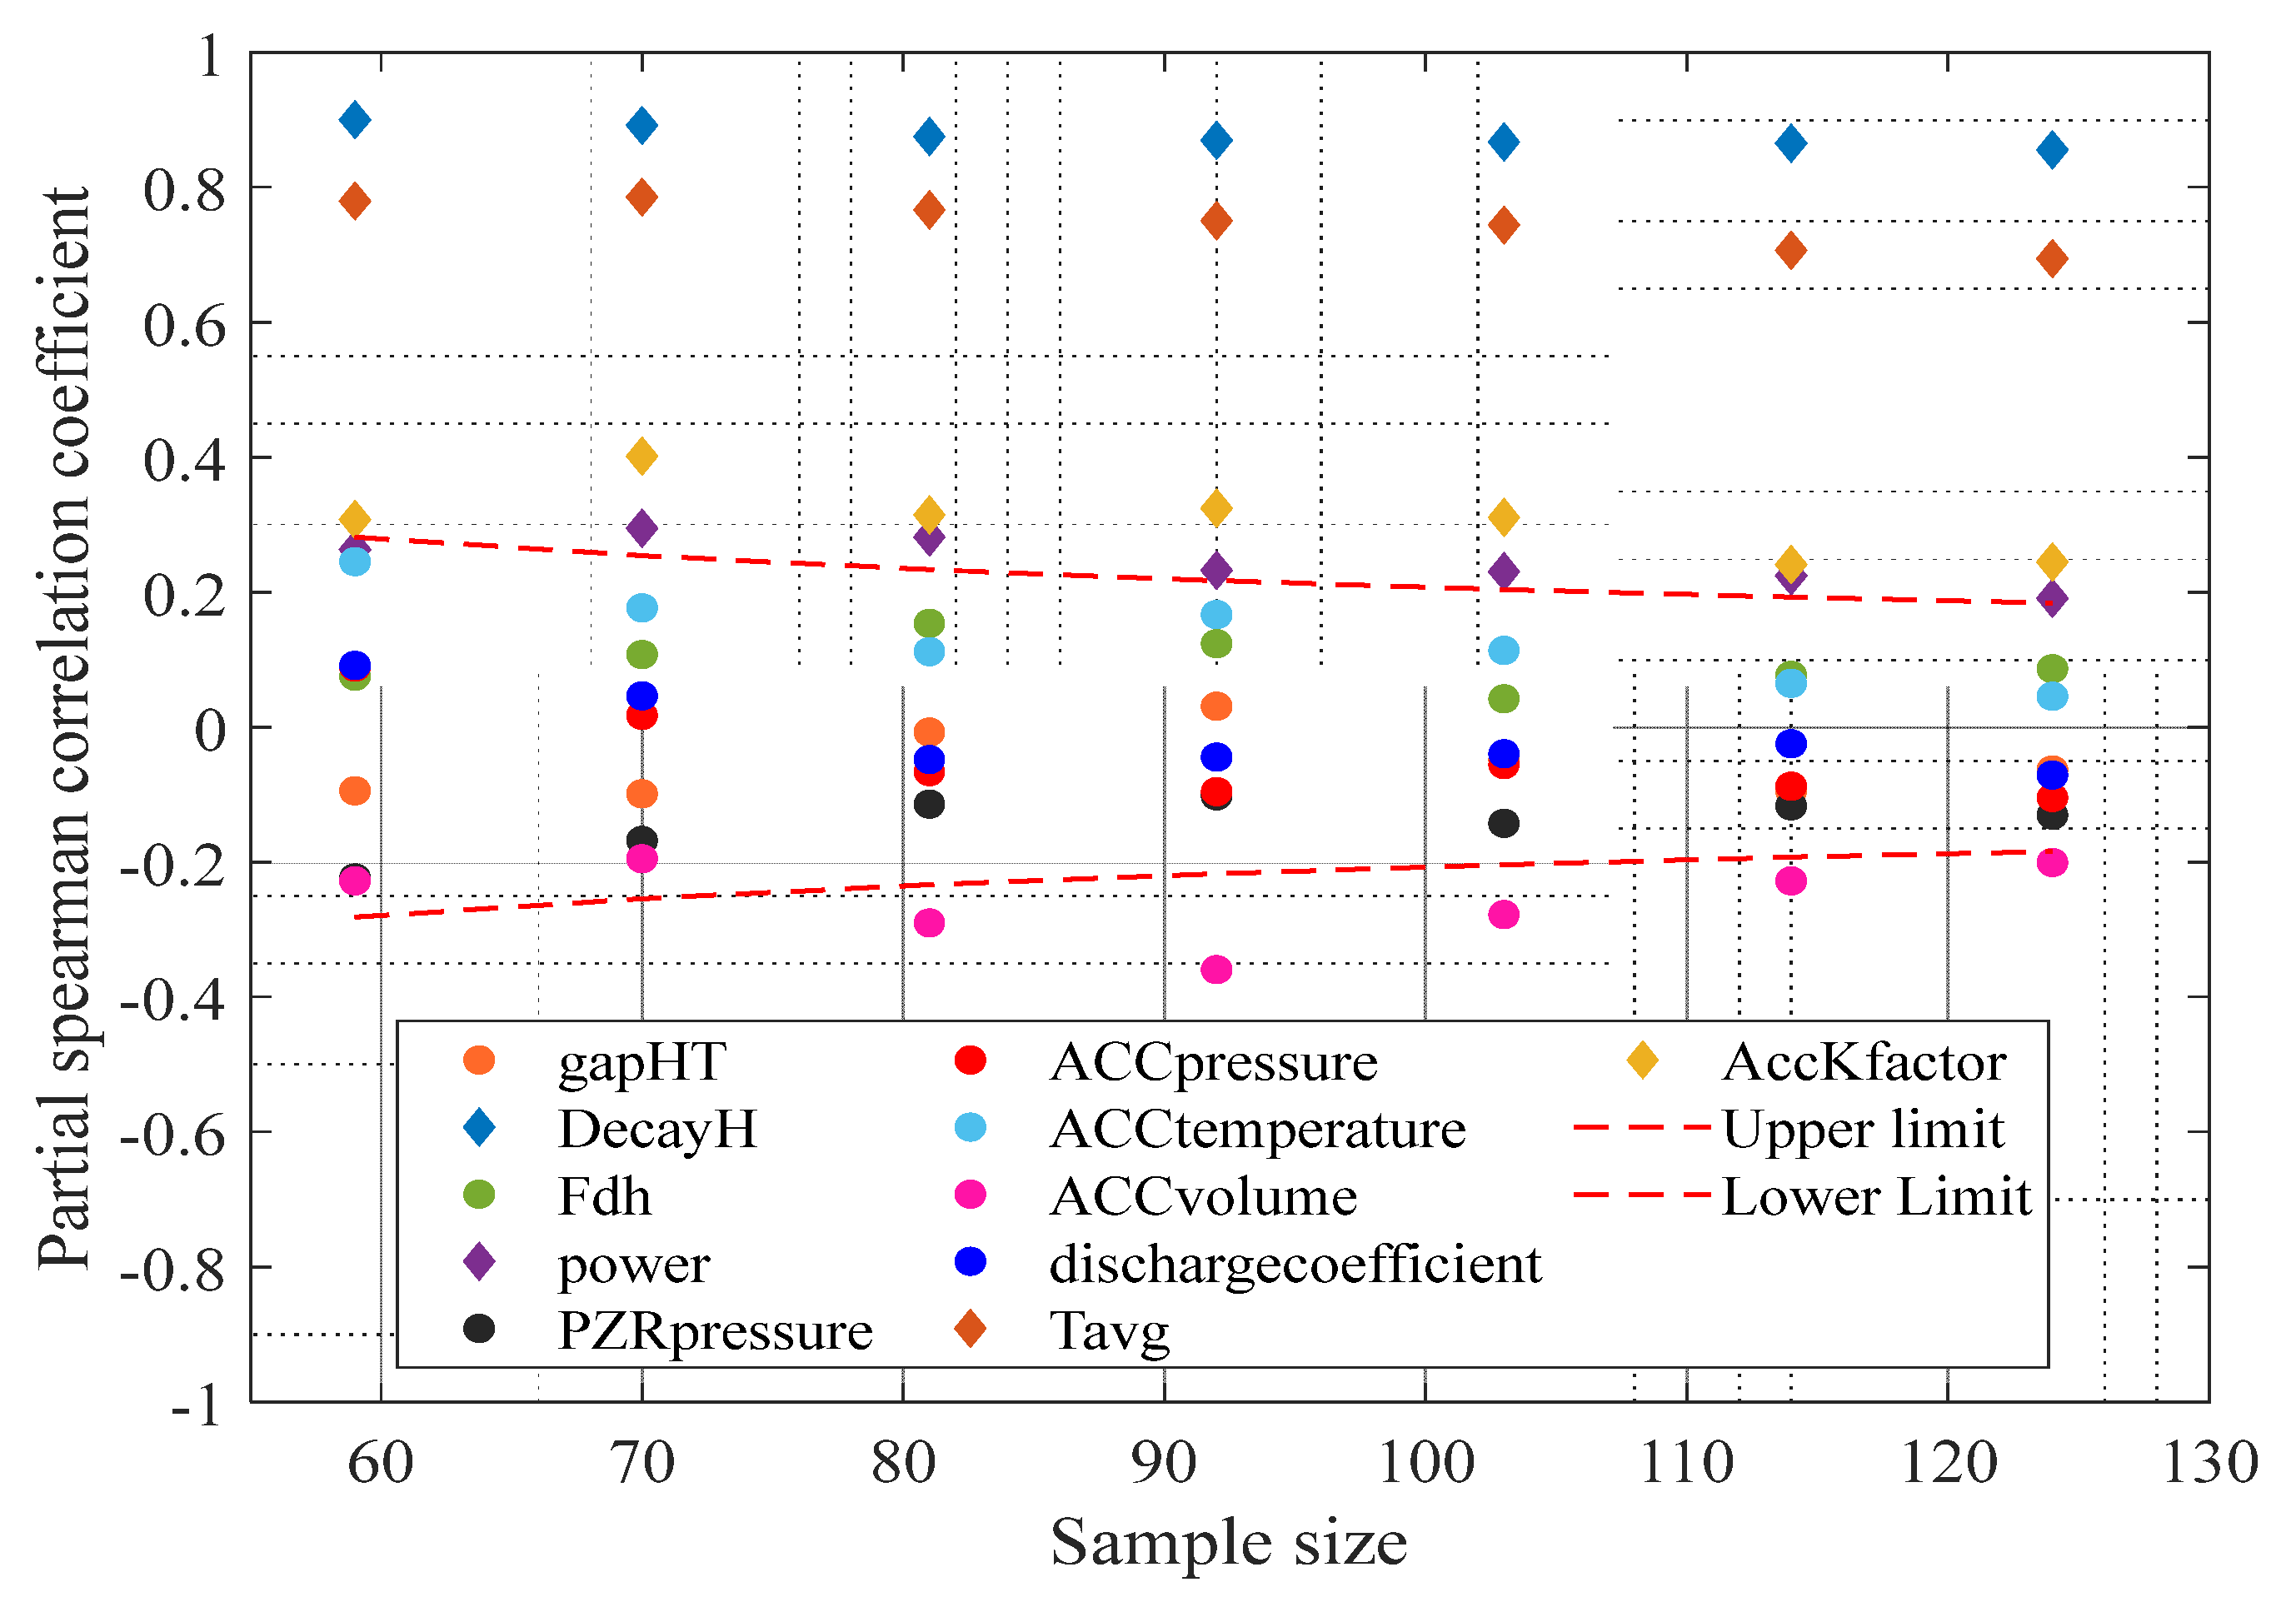
In this article, the influence of sample size on the correlation of parameters is researched, and the difference between the overall parameters and the PCT is calculated under n = 59, 70, 81, 92, 103, 114 and 124 sample sizes. Some partial type-related factors are as shown in Figure 8. The “upper limit” and “lower limit” are used as the acceptance limit of hypothesis test which is used to examine whether the Spearman partial correlation coefficient (shorten as SPCC) is significant according to Equation (2) [12].
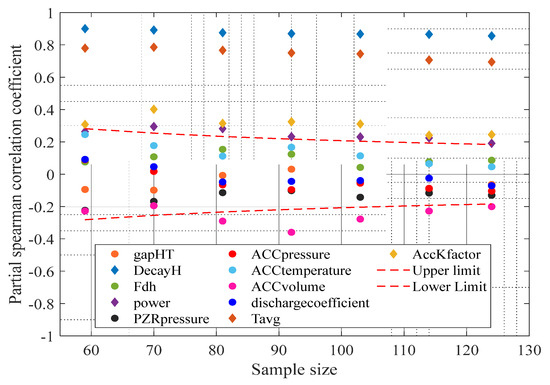
Figure 8.
PCT empirical CDF in 124 cases.
Here, n is the sample size and k the number of parameters that are conditioned during the calculation of SPCC.
With the help of this hypothesis test, we could reject the null hypothesis, which is that . or that . is not significant when the following condition is satisfied.
The upper and lower limit is calculated (denoted as and ) following Equations (2) and (3).
According to the analysis results, the sample size increased from 59 groups, which did not cause the order of the uncertainty coefficient correlation to change, but the correlation value changed slightly. As the sample size increases, the correlation coefficient tends to stabilize. For parameters with large correlation coefficients, such as decay heat, etc., the sample size has less influence on the correlation coefficient, but for parameters with small correlation coefficients such as the ACC temperature, when the sample space is 114 and 124, the correlation value of the coefficient is basically the same; when the sample size is 59, the deviation increases to 150%. This phenomenon is not entirely caused by the sample size but should be paid attention to. For the uncertainty analysis of parameters, the sample size should be analyzed and evaluated.
5. Conclusions
The safety review following the BEPU methodology attempts to evaluate the safety margin of the reactor. In this article, a LBLOCA BEPU review calculation and uncertainty analysis are carried out for an advanced high-power PWR based on TRACE code. According to Wilks’ theory, the simple random sampling size is 124, and the third sample maximum of PCT (1050K) is a (95, 95) upper tolerance limit for PCT. It is clear that the PCT of LBLOCA meets the acceptance criteria and has a large safety margin. The probability distribution of PCT has the characters of normal distribution through statistical test. Based on the result, correlation coefficients of input parameters for PCT are assessed. The decay heat coefficient and coolant average temperature are the two most influential factors on PCT in this case. For the discharge coefficient in the break, a negative correlation with PCT is obtained. The influence of sample size on the correlation of parameters still needs to be considered when executing the correlation coefficients analysis. The conclusions can provide technical support for the subsequent safety review or the design changes review of the power plant in further regulatory issues.
Author Contributions
Conceptualization, W.S. and C.X.; methodology, W.S. and C.X.; formal analysis, Y.-S.L. and Y.-Z.W.; investigation, H.F.; resources, W.S.; data curation, Y.-Z.W. and H.F.; writing—original draft preparation, H.F.; writing—review and editing, W.S.; project administration, S.-Z.Q. All authors have read and agreed to the published version of the manuscript.
Funding
This research was funded by Self-reliant fuel assembly development-Phase II: Development of pilot fuel assembly and related assembly, grant number (2017ZX06002004), China.
Institutional Review Board Statement
Not applicable.
Informed Consent Statement
Not applicable.
Data Availability Statement
Not applicable.
Acknowledgments
The authors extend their appreciation to Nuclear and Radiation Safety Center, MEE and Xi’an Jiao Tong University for technical support to this work.
Conflicts of Interest
The authors declare no conflict of interest.
References
- Roh, S.; Choi, J.Y. Exploring Signals for a Nuclear Future Using Social Big Data. Sustainability 2020, 12, 5563. [Google Scholar] [CrossRef]
- Cui, M.; Yi-Bao, L.; Liguo, Z. Application of Anticoincidence Technology to Burn-Up Measurement Systems in High-Temperature Gas-Cooled Reactors. Sustainability 2018, 10, 2883. [Google Scholar]
- Chajduk, E.; Kalbarczyk, P.; Dudek, J.; Pyszynska, M.; Bojanowska-Czajka, A.; Samczyński, Z. Development of Analytical Procedures for Chemical Characterization of Substrates for the Production of TRISO Coated Particles as Nuclear Fuel in High Temperature Gas-Cooled Reactors. Sustainability 2020, 12, 7221. [Google Scholar] [CrossRef]
- Di Ronco, A.; Giacobbo, F.; Lomonaco, G.; Lorenzi, S.; Wang, X.; Cammi, A. Preliminary Analysis and Design of the Energy Conversion System for the Molten Salt Fast Reactor. Sustainability 2020, 12, 10497. [Google Scholar] [CrossRef]
- International Atomic Energy Agency. Deterministic Safety Analysis for Nuclear Power Plants; IAEA Safety Standards Series No. SSG-2 (Rev.1); International Atomic Energy Agency: Vienna, Austria, 2019. [Google Scholar]
- Queral, C.; Montero-Mayorga, J.; Gonzalez-Cadelo, J.; Jimenez, G. AP1000 Large-Break LOCA BEPU analysis with TRACE code. Ann. Nucl. Energy 2015, 85, 576–589. [Google Scholar] [CrossRef]
- Frepoli, C. An Overview of Westinghouse Realistic Large Break LOCA Evaluation Model. Sci. Technol. Nucl. Install. 2008, 2008, 1–15. [Google Scholar] [CrossRef]
- D’Auria, F.; Camargo, C.; Mazzantini, O. The Best Estimate Plus Uncertainty (BEPU) approach in licensing of current nuclear reactors. Nucl. Eng. Des. 2012, 248, 317–328. [Google Scholar] [CrossRef]
- U.S. Nuclear Regulatory Commission. Quantifying Reactor Safety Margins: Application of Code Scaling, Applicability, and Uncertainty Evaluation Methodology to a Large-Break, Loss-of-Coolant Accidentl; NUREG/CR-5249; U.S. Nuclear Regulatory Commission: Washington, DC, USA, 1989. [Google Scholar]
- Sanchez-Saez, F.; Carlos, S.; Villanueva, J.F.; Sanchez, A.I.; Martorell, S. Uncertainty analysis of PKL SBLOCA G7.1 test simulation using TRACE with Wilks and GAM surrogate methods. Nucl. Eng. Des. 2017, 319, 61–72. [Google Scholar] [CrossRef] [Green Version]
- International Atomic Energy Agency. Best Estimate Safety Analysis for Nuclear Power Plants: Uncertainty Evaluation; Safety Reports Series No. 52; International Atomic Energy Agency: Vienna, Austria, 2008. [Google Scholar]
- Wilks, S.S. Order statistics. Bull. Am. Math. Soc. 1948, 54, 6–50. [Google Scholar] [CrossRef] [Green Version]
- Wang, Z.-L.; Wang, Z.; Wang, G.-D. Comparative Study on Statistical Methods for Application to Best-estimate plus Uncertainty Accident Analysis. At. Energy Sci. Technol. 2016, 1, 98–104. [Google Scholar]
- Somerville, P.N. Tables for Obtaining Non-parametric Tolerance Limits. Ann. Math. Statist. 1958, 29, 599–601. [Google Scholar] [CrossRef]
- Zheng, M.; Yan, J.; Jun, S.; Tian, L.; Wang, X.; Qiu, Z. The General Design and Technology Innovations of CAP1400. Engineering 2016, 2, 97–102. [Google Scholar] [CrossRef] [Green Version]
- Lin, S.-X.; Zhang, M.; Fang, Y.; Ding, Z.-H.; Yang, P.; Wang, S.; Zhang, W.; Liang, Y.-J. Overview of the CAP1400 Reactor Hydraulic Simulation Tests. In Proceedings of the 2017 25th International Conference on Nuclear Engineering. Volume 2: Plant Systems, Structures, Components and Materials, V002T03A085, Shanghai, China, 2–6 July 2017. [Google Scholar]
- Li, Y.-Q.; Chang, H.-J.; Ye, Z.-S.; Fang, F.-F.; Shi, Y.; Yang, K.; Cui, M.-T. Analyses of ACME Integral Test Results on CAP1400 Small-Break Loss-Of-Coolant-Accident Transient. Prog. Nucl. Energy 2016, 88, 375–397. [Google Scholar] [CrossRef]
- Shi, G.; Xu, C.; Yan, J.; Fan, P.; Yang, Z.; Cai, X.; Zhu, S. CAP1400 passive core cooling integral testing and application in code validation. Ann. Nucl. Energy 2021, 154, 107997. [Google Scholar] [CrossRef]
- Wang, W.-W.; Lu, L. Effect of Fuel Thermal Conductivity Degradation (TCD) on Large Break Loss of Coolant Accident for CAP 1000. At. Energy Sci. Technol. 2017, 1, 79–83. [Google Scholar]
- Hu, B.-X.; Wang, Z.; Wang, W.-W.; Wang, G.-D.; Wang, Z.-L.; Tang, G.-F.; Zhang, J.-Z.; Yang, P.; Liu, X. Application of Sampling Based Sensitivity Analysis in Evaluation of LBLOCA Mass and Energy Release PIRT. At. Energy Sci. Technol. 2016, 2, 290–294. [Google Scholar]
- Kang, D.-G. Analysis of LBLOCA using best estimate plus uncertainties for three-loop nuclear power plant power uprate. Ann. Nucl. Energy 2016, 90, 318–330. [Google Scholar] [CrossRef]
- Fernandez-Cosials, K.; Queral, C.; Robledo, F.; Sánchez-Perea, M. Analysis of a LBLOCA with FLEX actuations in a PWR-W. Nucl. Eng. Des. 2020, 370, 110908. [Google Scholar] [CrossRef]
- Yang, J.-H.; Lin, H.-T.; Wang, J.-R.; Shih, C. Evaluations of the CCFL and critical flow models in TRACE for PWR LBLOCA analysis. Kerntechnik 2012, 77, 442–448. [Google Scholar] [CrossRef]
- Deng, C.; Chen, L.; Yang, J.; Wu, Q. Best-estimate calculation plus uncertainty analysis of SBLOCA transient for the scale-down passive test facility. Prog. Nucl. Energy 2019, 112, 191–201. [Google Scholar] [CrossRef]
- Martínez-Quiroga, V.; Freixa, J.; Pérez-Ferragut, M.; Reventós, F. Significance of the Input Parameters Selection and the Nodalization Qualification in the Final Results of an IBLOCA BEPU Calculation. In Proceedings of the 11th International Topical Meeting on Nuclear Reactor Thermal Hydraulics, Operation and Safety, Gyeongju, Korea, 9–13 October 2016. [Google Scholar]
- Baccou, J.; Zhang, J.-Z.; Fillion, P.; Damblin, G.; Petruzzi, A.; Mendizábal, R.; Reventós, F.; Skorek, T.; Couplet, M.; Iooss, B.; et al. Development of good practice guidance for quantification of thermal-hydraulic code model input uncertainty. Nucl. Eng. Des. 2019, 354, 110173. [Google Scholar] [CrossRef]
- Nuclear Energy Agency/Organisation for economic co-operation and development. Uncertainty and Sensitivity Analysis of a LBLOCA in Zion Nuclear Power Plant; NEA/CSNI/R(2009)13; OECD/NEA: Paris, France, 2009. [Google Scholar]
- Young, M.-Y.; Bajorek, S.M.; Nissley, M.E.; Hochreiter, L.E. Application of code scaling applicability and uncertainty methodology to the large break loss of coolant. Nucl. Eng. Des. 1998, 186, 39–52. [Google Scholar] [CrossRef]
- Zhang, Z.-Z.; Wang, H.-L.; Meng, H.-Y.; Liu, M.-L. Uncertainty Evaluation and Correlation Analysis of ingle-particle energies in phenomenological nuclear mean field: An investigation into propagating uncertainties for independent model parameters. Nucl. Sci. Tech. 2021, 32, 45–57. [Google Scholar] [CrossRef]
- D’auria, F.; Galassi, G.M. Code validation and uncertainties in system thermalhydraulics. Prog. Nucl. Energy 1998, 33, 175–216. [Google Scholar] [CrossRef]
Publisher’s Note: MDPI stays neutral with regard to jurisdictional claims in published maps and institutional affiliations. |
© 2021 by the authors. Licensee MDPI, Basel, Switzerland. This article is an open access article distributed under the terms and conditions of the Creative Commons Attribution (CC BY) license (https://creativecommons.org/licenses/by/4.0/).