Article

Interaction Boundary Determination of Renewable Energy Sources to Estimate System Strength Using the Power Flow Tracing Strategy

1
Department of Electric and Electrical Engineering, Korea University, Seoul 02841, Korea
2
Department of Electrical Engineering, Yeonsung University, Gyeonggi-do 14010, Korea
3
Power Transmission Laboratory, Korea Electric Power Research Institute (KEPRI), Daejeon 34056, Korea
*
Author to whom correspondence should be addressed.
Sustainability 2021, 13(3), 1569; https://doi.org/10.3390/su13031569
Submission received: 21 December 2020 / Revised: 29 January 2021 / Accepted: 30 January 2021 / Published: 2 February 2021

Abstract

:
System strength is an important concept in the integration of renewable energy sources (RESs). However, evaluating system strength is becoming more ambiguous due to the interaction of RESs. This paper proposes a novel scheme to define the actual interaction boundaries of RESs using the power flow tracing strategy. Based on the proposed method, the interaction boundaries of RESs were identified at the southwest side of Korea Electric Power Corporation (KEPCO) systems. The test results show that the proposed approach always provides the identical interaction boundaries of RESs in KEPCO systems, compared to the Electric Reliability Council of Texas (ERCOT) method. The consistent boundaries could be a guideline for power-system planners to assess more accurate system strength, considering the actual interactions of the RESs.

1. Introduction

System strength is a common concern in the expansion of renewable energy sources (RESs) [1,2,3]. Recent studies have been focused on the assessment of system strength in the power system with a high penetration of RESs [4,5,6]. The sensitivity of system variables to diverse disturbances depends on the system strength. One of the indexes to evaluate system strength is the short-circuit ratio (SCR) from IEEE [7]. The SCR represents the strength of a bus in a power system with respect to the rated power of a facility [4,5,6]. The SCR is defined as the ratio of the short-circuit capacity at where the bus is located to the MW rating of the device. A weak AC system has an SCR below three, and a strong system has an SCR greater than five. The system with a lower SCR has large changes in voltages and other variables caused by disturbance. This contributes to negative impacts such as high over-voltages, control instability, and low-frequency resonances [8,9,10,11,12].
High penetration of RESs (e.g., solar photovoltaics and wind plants) is often installed in the optimal locations where resources such as wind or solar power are available for RESs to maximize their output. These places could be weak AC systems in which the RESs are remote from synchronous generators and loads. The RESs, which are electrically close together, can interact with each other and oscillate together. In such a case, the SCR method is not valid, since this method assumes that an RES cannot interact with other RESs. As a result, a system strength evaluated by the SCR method cannot reflect the interaction of RESs. This causes the system strength to be overly optimistic. The excessively optimistic result of the SCR can make system planners misunderstand the system stability and fail to reinforce it.
There is currently no exact guideline to evaluate the system strength of a weak AC system with a high penetration of RESs. Meanwhile, the paper [13] suggested that the interaction factors were used to assess the system strength for inverter-based systems. Other researchers adopted the impedance metrics for system-strength evaluation in the weak system [14,15]. The Electric Reliability Council of Texas (ERCOT) suggested the weighted short-circuit ratio (WSCR) to consider the full influence of interaction between wind plants, and to provide an accurate estimate of the system strength [16,17,18]. This index is a proper method to evaluate the system strength for the Texas Panhandle region, where a high penetration of wind farms exists, and they are closer to each other. The proposed WSCR method assumes that all wind plants connected to a point of interconnection (POI) fully interact with each other, as shown in Figure 1.
To consider the effect of interaction between RESs, from [19], the WSCR index can be defined by:
WSCR = i N SCMVA i × P RES , i i N P RES , i 2
where SCMVA i is the short circuit capacity at bus i before the connection of a RES, P RES , i is the MW rating of RES i to be connected, N is the number of RESs fully interacting with each other, and i is the RES index. Equation (1) indicates that the electrical distances do not exist between each wind plant at the POI, since this is equivalent to assuming all RESs are connected to a single virtual POI. With this method, the WSCR represents a conservative estimation of system strength [20]. The overly conservative results of the WSCR can result in inadequate investments in system reinforcement. However, for real power systems, some electrical distance between each wind plant at the POI does exist. Additionally, the wind plants will not have fully interacted with each other. These imply that the WSCR calculation method can neglect electrical distance.
The WSCR method does not provide proper guidelines to determine the interaction boundaries of RESs. This implies that the interaction boundaries for calculating the WSCR are not defined clearly. The WSCR calculation method may not be applicable if a high penetration of RESs is dispersed in power systems. The dispersed RESs can fully interact with the other RESs outside the boundary. The WSCR value for system strength can be misrepresented if there are outliers. The ERCOT raised a concern that the boundaries of the Texas Panhandle are getting blurred due to the expansion of RESs [20]. The WSCR method may not be accurate in the future. On the other hand, the Australian Energy Market Operator (AEMO) in Australia prefers to limit the consideration to generators connected within three buses of the proposed generators under the study [21,22]. However, the AEMO does not provide the guidelines to determine the interaction boundaries of RESs as well as the ERCOT. The WSCR values in the system with a high penetration of RESs critically depends on where the study area boundaries are drawn. For accurate estimation of system strength, it is most vital to establish the boundaries of the RESs that actually interact with each other.
In this paper, we propose a novel scheme to identify the actual interaction area of RESs by using the power flow tracing method. In the Materials and Methods section, the concept of power-flow tracing of RESs is introduced and the power-tracing matrix is built. Also, two algorithms are proposed to determine the actual interaction boundaries of RESs to calculate WSCR values. Based on the proposed method, the actual interaction boundaries of RESs are identified at the southwest side of Korea Electric Power Corporation (KEPCO) systems. In the Results section, the WSCR values with the proposed interaction boundaries are analyzed in comparison to the ERCOT method. Finally, the actual interaction boundaries of the renewable energy sources were distinguished at the southwest side of KEPCO systems.

2. Materials and Methods

2.1. Power-Flow Tracing of Renewable Energy Sources

The power flow tracing method deals with the problem of how power flows are distributed in a meshed AC system [23] The method can facilitate the assessment of how much real power output from a specific generator flows to a particular load. Assessing the contributions of generators to individual line flows is also possible. From [23], the key principle in the method is the proportional-sharing principle, as illustrated in Figure 2a, where five lines are connected to node i , with three lines as inflows and two as outflows. The total power inflow through node i is P i n f l o w s = 50 + 110 + 40 = 200   MW , of which 25% is supplied by l i n e j i , 55% by l i n e k i , and 20% by l i n e l i . An assumption may be made that each outflow leaving the node i has the same proportion of inflows as the total inflow. Hence, the 150   MW outflow in l i n e i m consists of 25 % × 150 = 37.5   MW supplied by l i n e j i , 55 % × 150 = 82.5   MW supplied by l i n e k i , and 20 % × 150 = 30.0   MW supplied by l i n e l i .
Based on the power flow tracing method, the contribution of each RES to other RESs can be traced. This is illustrated in Figure 2b, where each wind plant is connected to a bus. Inflows at bus 3 consist of the active power from a wind plant at bus 3 and from the other two RESs near bus 3.
From [23], the interaction at bus 3 may be mathematically expressed as:
P 3 = P 33 + P 13 + P 43
The general expression is:
P i = P i i + i S , i j P i j
where P i is the interaction at bus i , P i i is the active power from the RES at bus i , P i j is the active power delivered from the bus i to bus j , and S is the set of buses connected to the RESs. Based on (3), the power flow tracing matrix describing the mutual interference of the RESs can be written as:
P o w e r   t r a c i n g   m a t r i x   P M = P i j P i s P s i P s s ,   i j S
where row i of the P M is the active power delivered from bus i to other buses with RESs, and column j is the active power given from other buses with RESs. Each row and column in (4) are ordered by placing the bus of interest first to establish the interaction boundary, and the rest of the buses in the order of closeness to the bus of interest. The mutual influence of the boundary can be established by analyzing the elements of the matrix.

2.2. Identifying the Acutal Interaction Boundaries of Renewable Energy Sources

The power-tracing matrix needs to be reduced to filter the independent bus and radial bus from the matrix. Independent buses can be determined by whether the sum of the active power received on the bus of interest and transmitted on the bus is zero. This means that the bus does not interact with other RESs. After filtering the independent bus, the radial bus can be determined by whether the sum of the active power received at the bus of interest is zero but transferred from the bus is not zero. The radial bus may radially connect to the bus that received the largest amount of active power transferred from the radial bus. Those buses may interact with each other. Thus, they may be within the same interaction boundaries. Algorithm 1 details this filtering process to distinguish the independent and radial buses.
Algorithm 1: Filtering the independent and radial buses
Input: Power flow tracing matrix ( P M )
Output: Reduced power flow tracing matrix ( P M ), S , O
1: O ,   P i j P M ,   s S
2: for each s in S do
3:     if i S , i s P i s + j S , j s P s j =0 then
4:            O O s ,     S S s
5:            Eliminate row s and column s of P M
6:     end if
7:     if i S , i s P i s =0 then
8:            Find j in S such that j s and P s j is the largest for all j in S
9:             i = j
10:        for each j in S do
11:         P i j = P i j + P s j
12:        end for
13:         S S i _ s ,     S S i ,   s
14:        Eliminate row s and column s of P M
15:     end if
16: end for
The reduced power flow tracing matrix and the filtered list of buses connected to RESs in Algorithm 1 become inputs in Algorithm 2. The bus of interest is initially included in the interaction boundary of RESs. The next bus of interest may be included in the boundary if the power received on the bus of interest from the RESs within the boundary is greater than the RESs outside the boundary. Algorithm 2 details the decision process for interaction boundaries. This process is repeated until there are no bounded buses.
Algorithm 2: Determinng the interaction boundary of RESs
Input: P M , S
Output: B k   f o r   a l l   k
Set k 0, P i n 0 , P o u t 0 ,   B k ,     U
1: Reorder P M and S with s* is the first row and column of P M and first element in S .
2: Bus of interest s * S , B k B k   s * ,   U U S   s * ,
3: for each s in S do
4:   Initialize P i n and   P o u t
5:   if s s * then
6:     For each b in B do
7:         P i n = P i n + P b s
8:     end for
9:     For each u in U do
10:        if u s then
11:          P o u t P o u t + P u s
12:   end for
13:   if P i n P o u t then
14:      B k B k s ,   U U s
15:   end if
16:  end if
17: end for
18: for   b in   B k do
19:   Eliminate row b and column b of P M
20: end for
21: B k B k , B k
22: k   k + 1
23: if U then
24:   S   U
25:  Send S to line 1
26: end if

2.3. Implementation in PSS/E

In the software Power System Simulation for Engineers (PSS/E), the data of power systems can be modified in a *.raw file that consists of 23 steady parameters to model power systems. The WECC Type 4 (Fully rated Converter) generator model was used as a wind plant. According to the grid code, the power factor of RESs was set to ±0.95 in the machine data of the *.raw file. The full Newton–Raphson method was used to calculate power flow for tracing the active power. All of the tap and switched shunt adjustments were locked as a solution option to calculate power flow. To compare the WSCR of the boundary set by the proposed scheme and the WSCR of the boundary set by ERCOT, the short-circuit capacity (SCC) calculation was done using the automatic sequencing short-circuit calculation (ASCC) in PSS/E. Generator reactance was used as sub-transient impedance. The fault applied was a three-phase fault at the bus connected to the RESs. The system strength was evaluated through the actual power output of the installed wind-power capacity.

2.4. Description of Case Study in Korean Electric Power Corporation System

The simulation was conducted for the 2022 future scenario of KEPCO systems. To achieve the “New Renewable 3020 Plan” announced by the Ministry of Trade, Industry and Energy (MOTIE), a large number of RESs will be installed in the southwest region of KEPCO systems. In this case study, 6.5 GW of renewable energy sources was installed at the southwest side of KEPCO systems. The area of interest has 15 RESs buses and five other buses; three buses are 345 kV, and the rest are 154 kV. The southwest side of the KEPCO system has a large penetration of RESs. This is illustrated in Figure 3, where the system is remote from the synchronous generators and the load center. RESs connected to the southwest system are effectively connected to a POI such that the RESs may interact with each other. The interaction boundaries of the RESs become more difficult to determine as the high penetration of RESs continues to expand on the southwest side of KEPCO system.

3. Results

The scheme to identify the interaction boundaries of RESs was demonstrated for a KEPCO system. The SCCs at buses are summarized in Table 1, and the power-tracing matrix used in the case study is shown in Table A1 in Appendix A. The result of the proposed method is shown in Table 2. Each row of Table 2 shows the result of one complete scheme. The first column of Table 2 is the bus of interest that is connected to RESs, and chosen at first for determining the interaction boundary. The second column of the table is the result of Algorithm 1 to filter the independent buses. The order of elements in the second column is the filtering order. The radial bus is filtered in Algorithm 1 and then included in the boundary column where the radial bus is connected. The remaining columns are the result of Algorithm 2, where the interaction boundary is determined. The order of elements in the first boundary column is the order of determining the interaction boundary. The first element of the second and third boundary columns is the next bus of interest in the group whose bus is not included in the previous boundary. The important observation in this result is that the same boundary is defined even if any bus is initially selected as the bus of interest. The order of determining the interaction boundary may vary depending on the bus of interest. This is because the power flow tracing matrix in Algorithm 2 is rearranged to place the bus of interest in the first row and column.
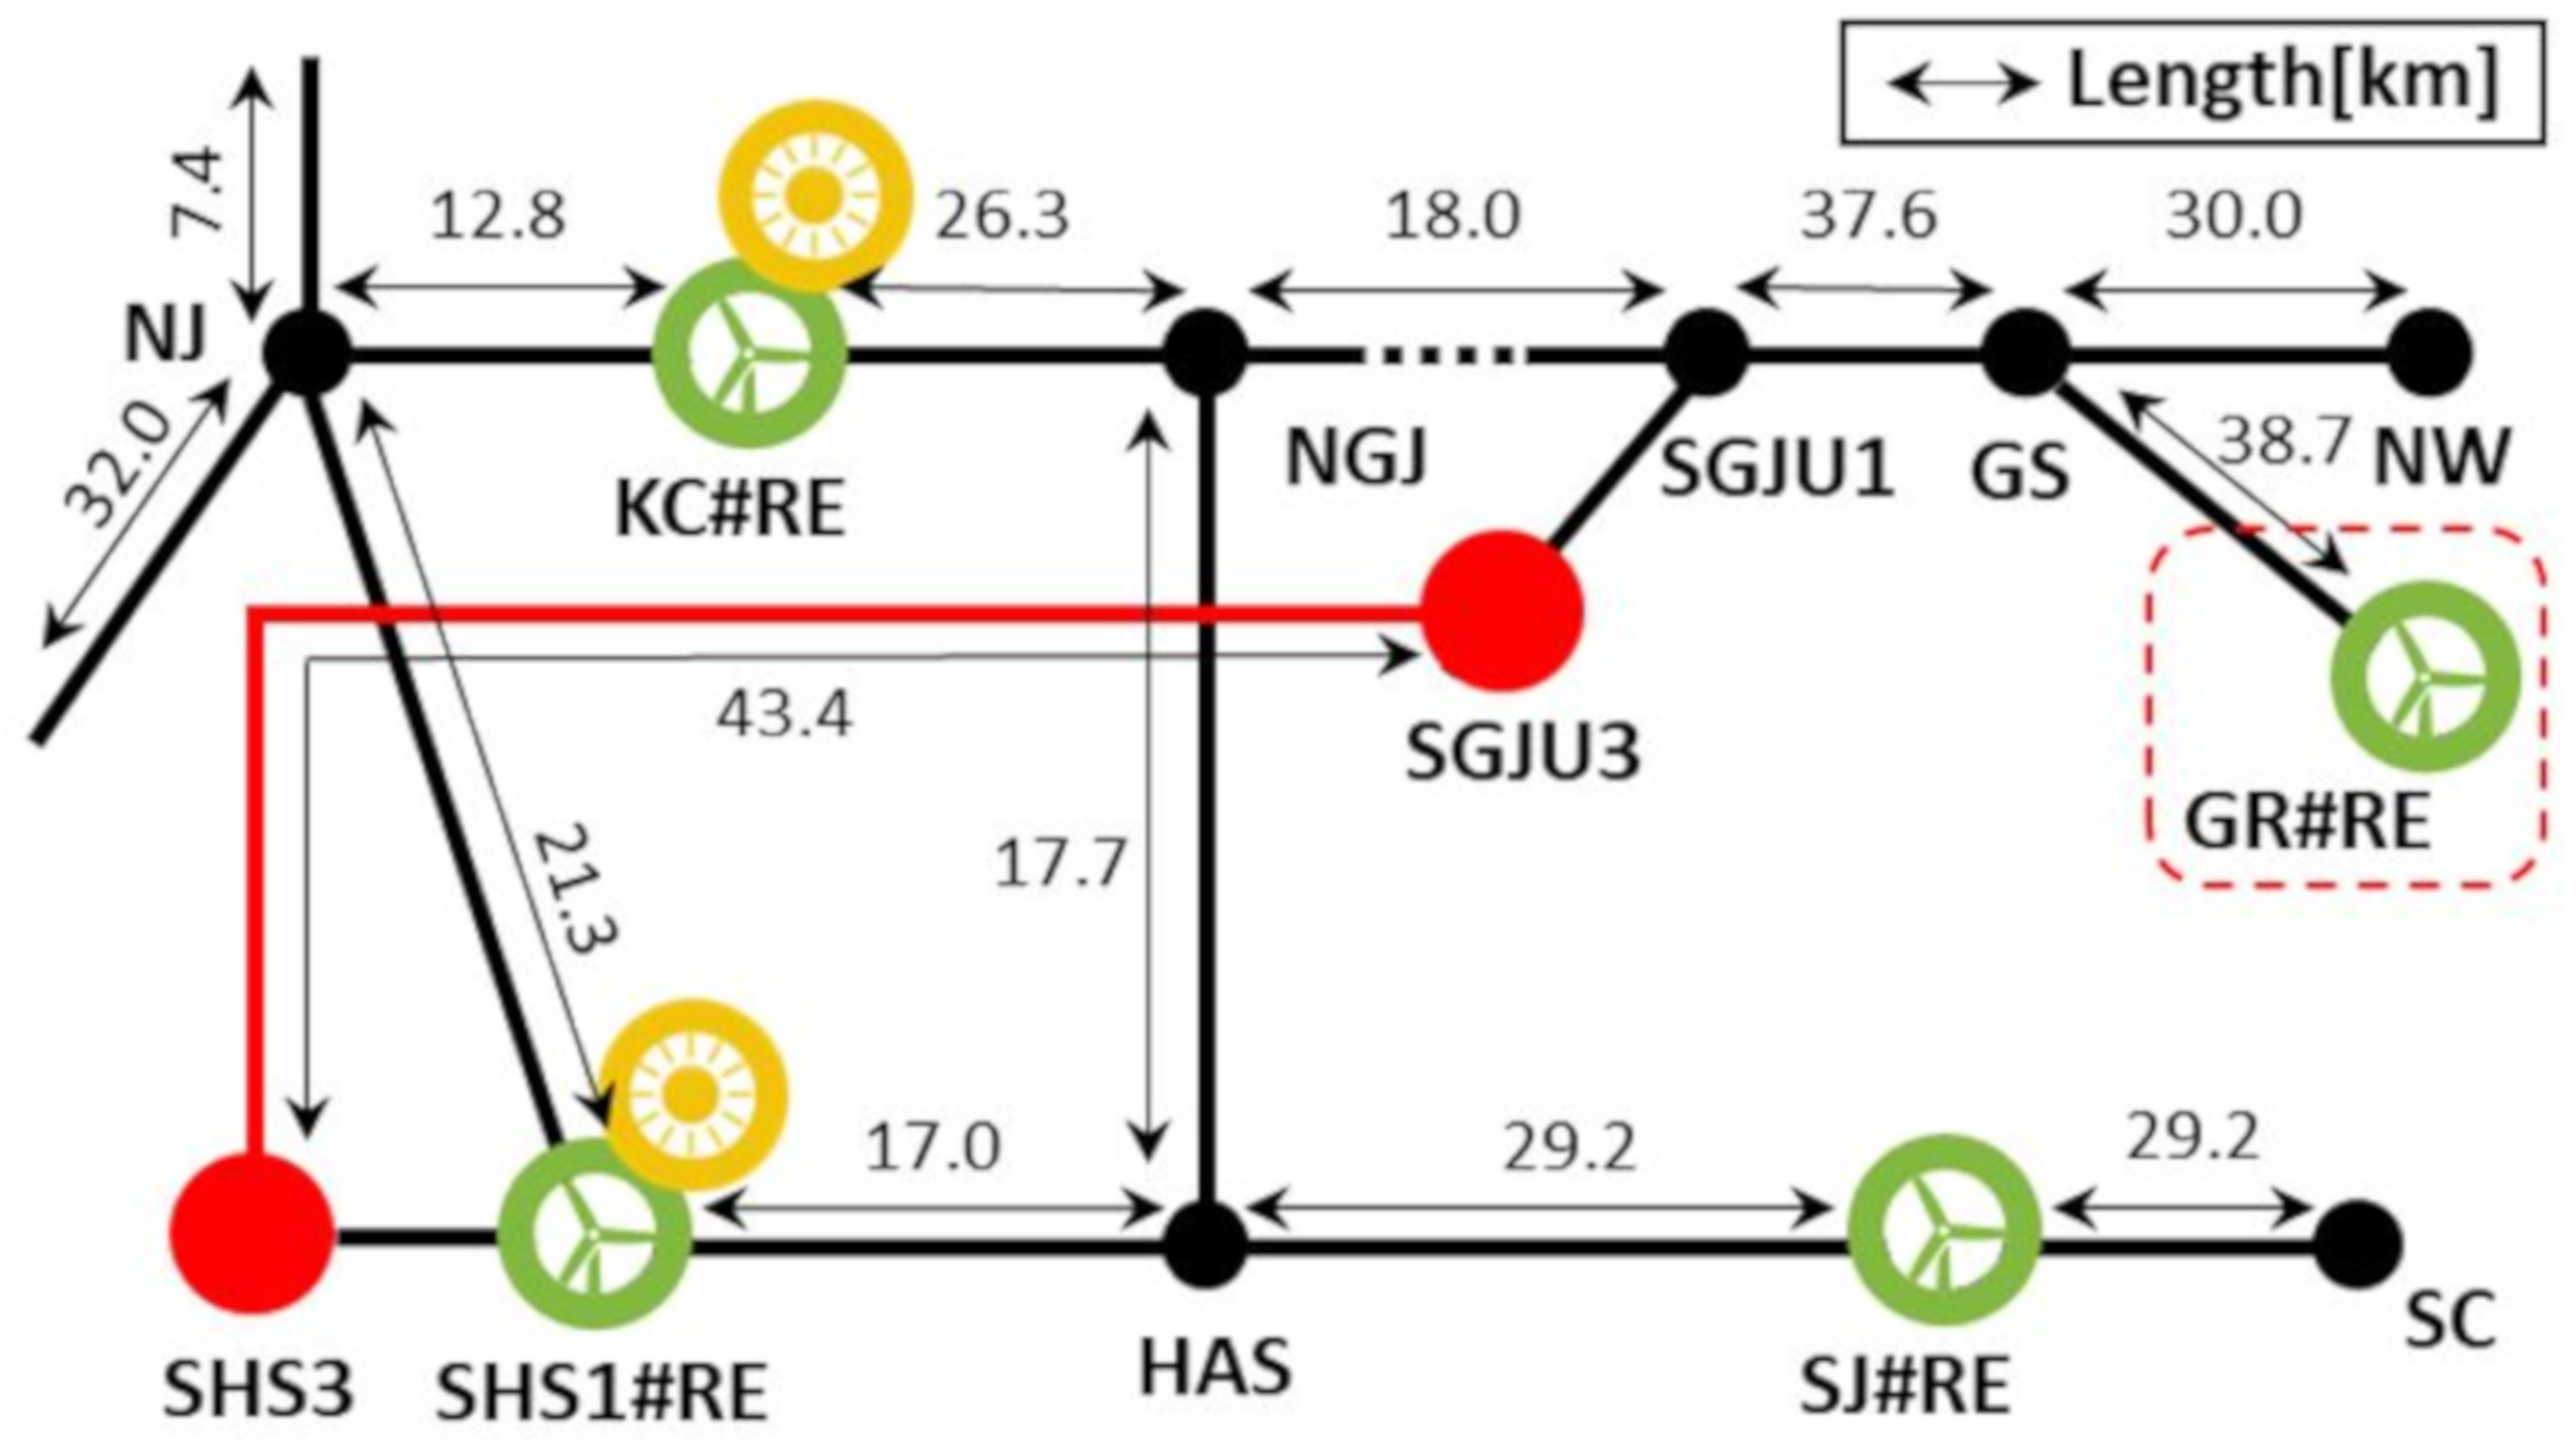
Some examples of results are necessary to verify whether the mutual interaction boundaries are clearly defined. The examples are the results of the second-row case in Table 2, where AJ#RE is the initial bus of interest. The first example illustrated in Figure 4 is to show and analyze why GR#RE is the independent bus. The closest distance between GR#RE and another wind plant (SHS1#RE) is 129 km. GR#RE is not interacting with other RESs because the bus is remote from the other RESs. In addition, the power generation of GR#RE is relatively small (20 MW), which does not affect the other wind power plants. This small, generated power will be consumed by line loss and small loads near GR#RE.
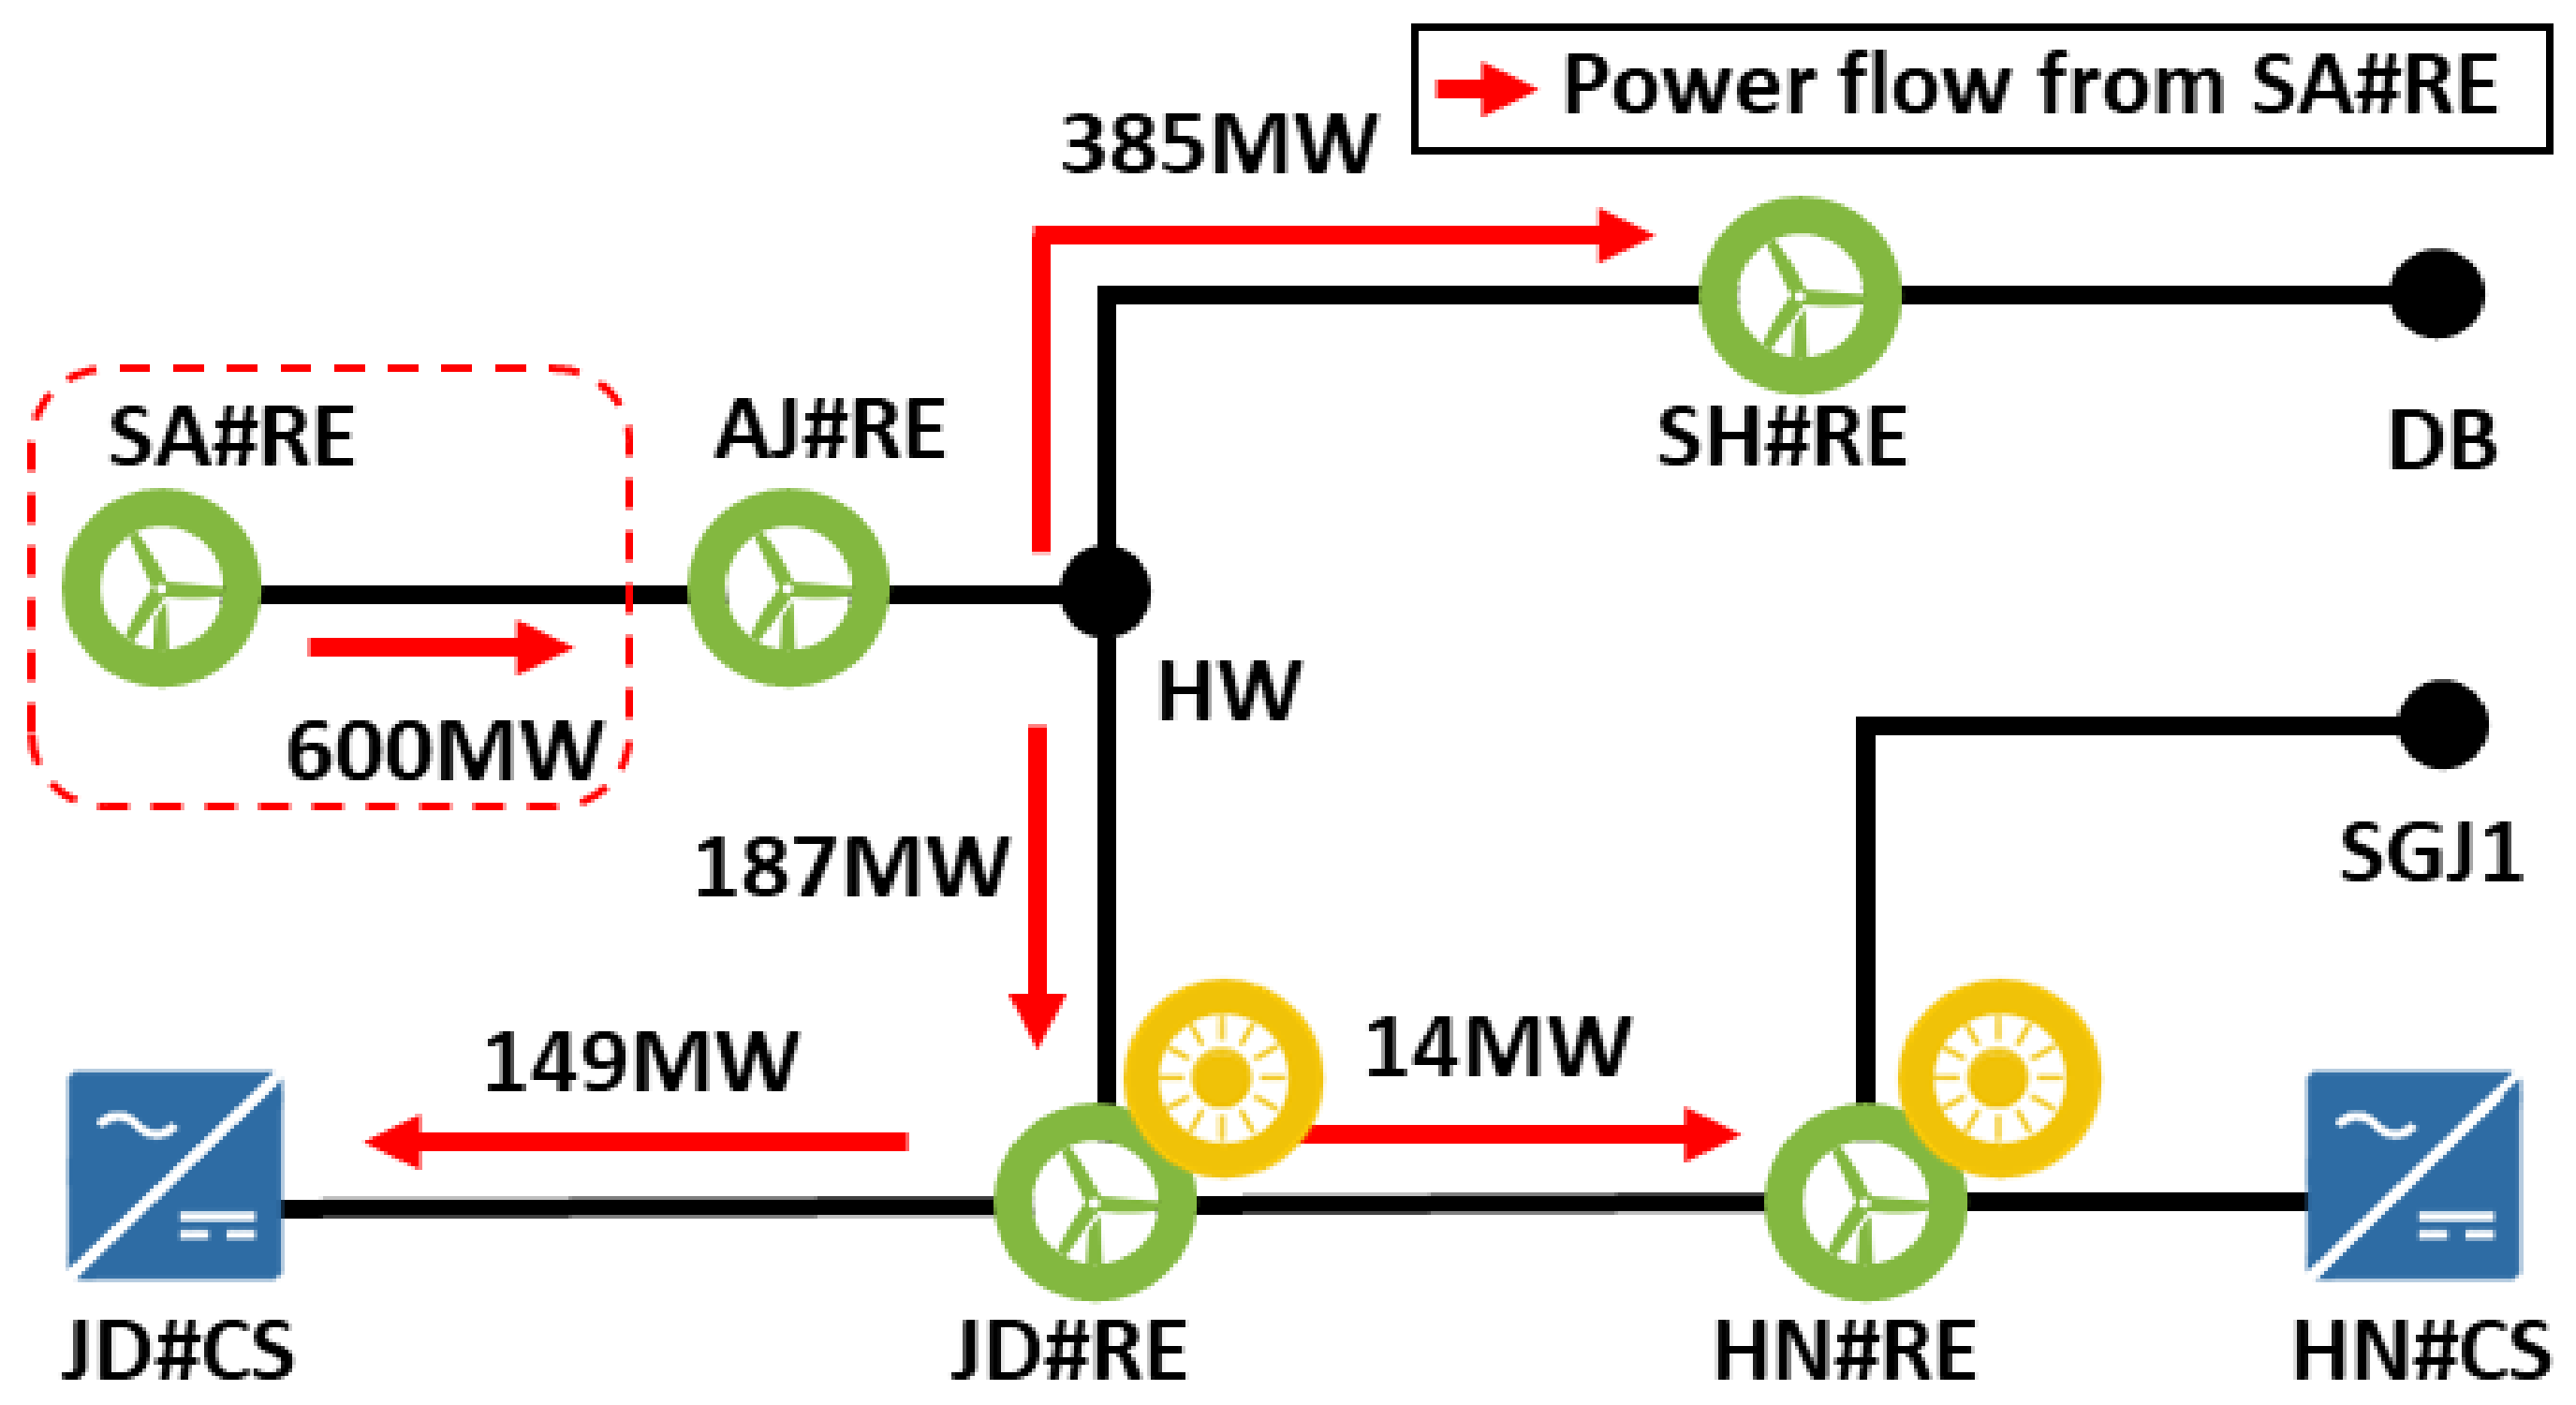
A radial bus distinguished by using the power flow tracing method is illustrated in Figure 5. As mentioned for Algorithm 1, SA#RE transfers power generation only to other wind power plants and does not receive power from other wind power plants. The wind power plant closest to SA#RE receives its largest transmitted power. In this case, AJ#RE receives 600 MW from SA#RE. This means that AJ#RE may be largely interacted with by SA#RE. The radial bus SA#RE can be bounded together with AJ#RE.
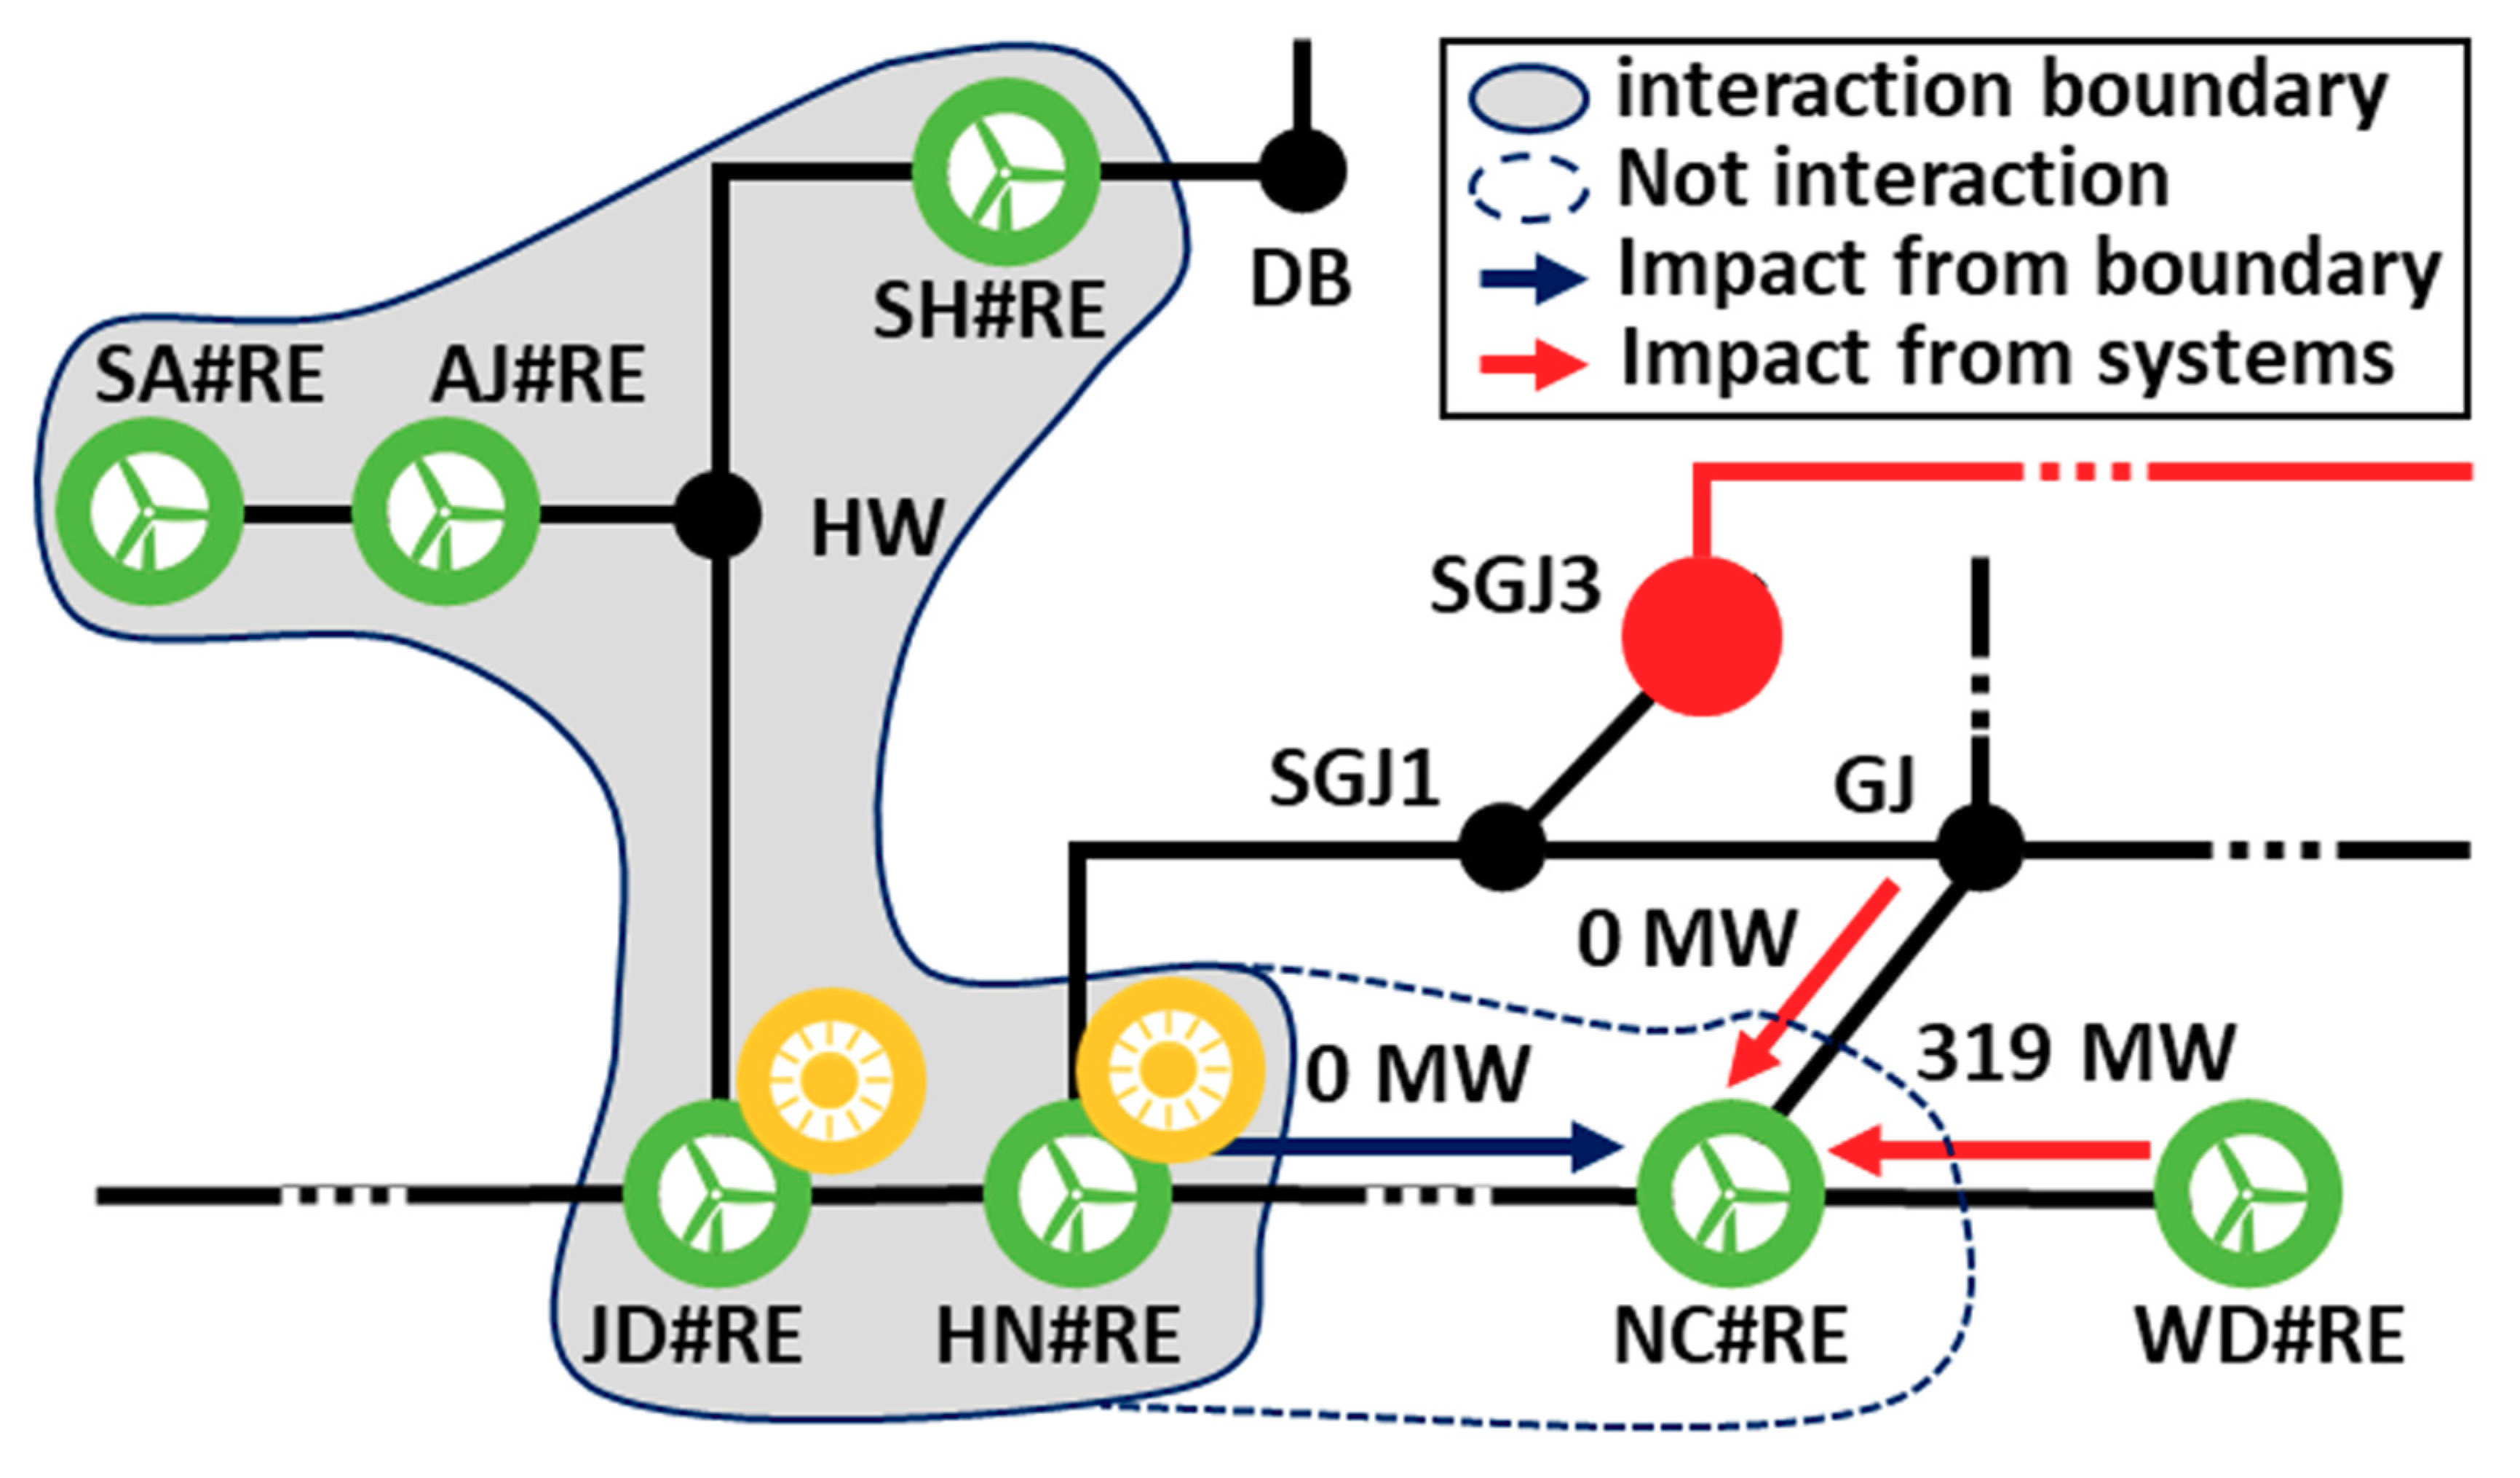
Determining the interaction boundary of RESs is done by comparing the amount of power generated by RESs inside the boundary to those outside the boundary. This is illustrated in Figure 6, where the NC#RE bus receives 0 MW from RESs inside the boundary and 319 + 0 = 319 MW from RESs outside the boundary. As a result, NC#RE may not interact with RESs inside the boundary, but rather with RESs outside the boundary. The NC#RE will not be bounded by the first boundary.
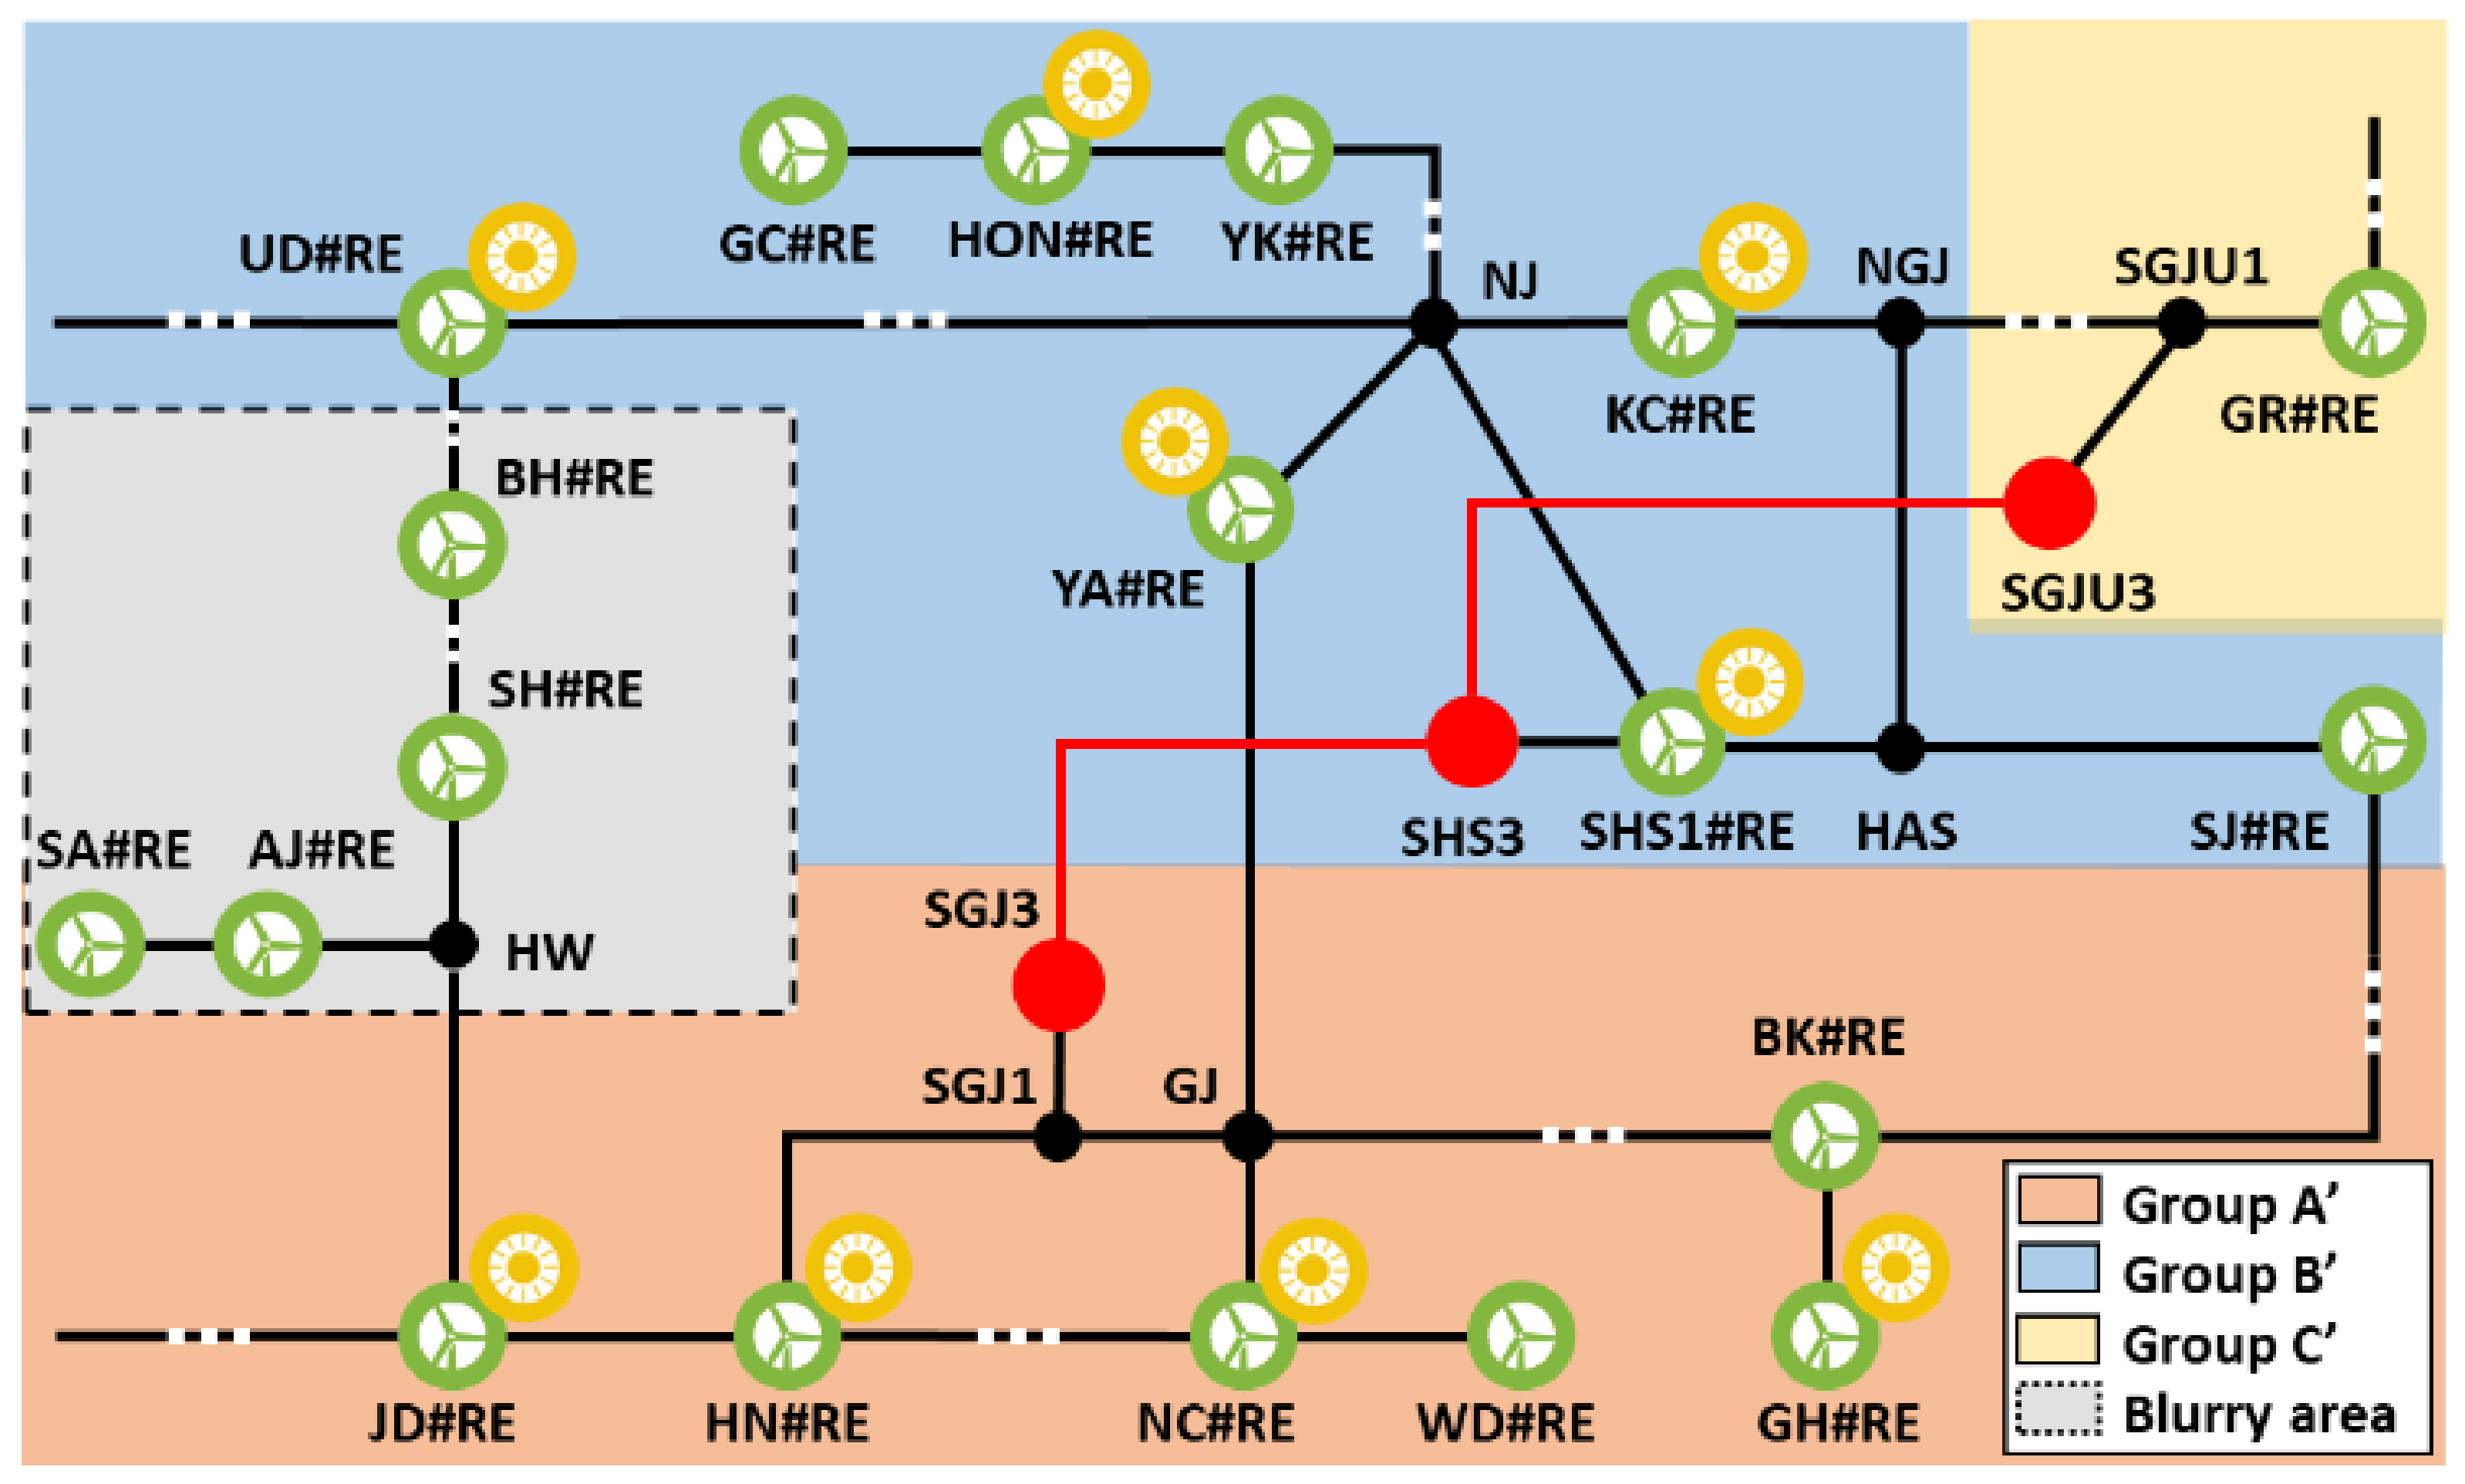
According to the ERCOT method, two sets of boundaries are made due to the blurry area, as illustrated in Figure 7. One set of boundaries is group A′, group B′, and group C’, where the blurry area is included in group A′. The other set of boundaries is group A″, group B″, and group C″, where the blurry area is included in group B”. Table 3 shows that the WSCR was calculated with different interaction boundaries determined by the ERCOT method. The WSCR increases from 1.40 of group A′ to 2.49 of group A″ because the blurry area is excluded in group A′. Instead, the WSCR decreases from 4.18 of group B′ to 1.54 of group B″ since the blurry area is included in group B″. The WSCR of group C’ and group C″ is the same, since the blurry area is far away from GR#RE. The minimum WSCR value for this system can change from 1.40 on boundary A′ to 1.54 on boundary B″ due to the blurry area. Given the Texas Panhandle’s critical WSCR value, the first set of boundaries shows that this system may be weak because 1.40 of boundary A′ is lower than 1.5. On the other hand, the second set of boundaries shows that this system may not be weak because 1.54 of boundary B″ is higher than 1.5. The ERCOT method can change the WSCR value depending on how the boundary is set, which makes it difficult to consistently assess system strength.
The proposed method provides only one set of the mutual interference boundaries, which are illustrated in Figure 8. The proposed boundaries are five different groups. Buses in the blurry area are clearly separated by tracing the actual interaction of wind power plants. SHS1#RE and SJ#RE are far from the rest of the wind farm in the same group A. However, they interact with each other as a result of the tracing. Active power from SA#RE and AJ#RE flows through the 345 kV line, which is connected from SGJ3 to SHS3. This causes SA#RE and AJ#RE to interact with SHS1#RE and SJ#RE. RESs in group B can significantly interact with each other within the same group more than RESs in other groups. RESs in group C interact only with each other within the group, since they are remote from the other RESs. Groups D and E do not interact with any other RESs. The GR#RE in group D is remote from other RESs, as shown in Figure 4. The active power generated by RESs at GR#RE is only 20 MW, which can be consumed by load and line losses. GH#RE has an independent boundary even if the bus is connected to BK#RE within the (n-1) level. This is because there is a load of 56 MW connected to GH#RE. Hence, GH#RE does not interact with other RESs, since the 55 MW of active power generated by GH#RE is all consumed at the load. Interaction boundaries are always identical even if the bus of interest changes.
The WSCR of the proposed boundaries is shown in Table 4. The minimum WSCR value for this system is 1.86 in group A, taking into account the actual interaction of wind power plants using the power-tracking method. This system-strength assessment is always consistent, as the proposed boundaries are the same, even if the bus of interest changes.

4. Conclusions

This paper proposes a novel scheme to identify the mutual-interference boundaries of RESs for estimation of system strength. The proposed approach uses the power flow tracing method to analyze the actual interaction of RESs. Two algorithms used in this scheme distinguish the independent buses, radial buses, and separate interaction boundaries.
The case study based on KEPCO systems has a blurry area to determine the system strength due to the expansion of RESs. The results showed that the ERCOT method derives the different WSCR values depending on where the blurry area is included. The ERCOT method presents a difficulty for power-system planners in assessing the system strength, as the blurry area exists. On the other hand, the proposed method always provides identical boundaries even if the bus of interest changes, compared to the ERCOT method. These boundaries reflect the actual interaction between RESs using power-flow tracing, whereas the ERCOT method assumes the full interaction. Thus, the result of the scheme demonstrates that the WSCR values of the proposed boundary are consistent in the system even if the blurry area exists. The proposed method can be a better assessment for the future system integrated with a high penetration of RESs. Future work will focus on the development of the system-strength index using the proposed scheme.

Author Contributions

N.C. conceived and designed the research methodology, performed the system simulations, and wrote the paper; B.L. supervised the research, improved the system simulation, and made suggestions regarding the research; and D.K. and S.N. contributed to the writing of the paper. All authors have read and agreed to the published version of the manuscript.

Funding

This research received no external funding.

Institutional Review Board Statement

Not applicable.

Informed Consent Statement

Not applicable.

Acknowledgments

This work was supported by an NRF (National Research Foundation of Korea) Grant funded by the Korean Government (NRF-2019H1A2A1075987—Global Ph.D. Fellowship Program), and by the Korea Electric Power Corporation (Grant number: R17XA05-04).

Conflicts of Interest

The authors declare no conflict of interest.

Nomenclature

Sets
S Buses with RESs, indexed by s .
S Buses with RESs after filtering independent buses and radial buses, indexed by s .
O Buses not interacting with other RESs, indexed by o .
B k Buses inside the interaction boundaries of RESs for each k , indexed by b.
U Buses outside the interaction boundaries of RESs, indexed by u.
Variables
p i j Active power flow from bus i to bus j .
s * Bus of interest to determine interaction boundaries.

Appendix A

Table A1. Power flow tracing matrix of RESs.
BusAJSAJDSHHNNCBHWDYABKUDSHS1GHKCSJYKGRHONGC
AJ268084172604500217590540000
SA6006001883851401010043713301090000
JD00380300000020000000
SH0006000160006200210000
HN0000170000030970070000
NC00001400004000000000
BH000000500001810500000
WD000093190375433050100000
YA000000003210027010820000
BK00000000030000000000
UD00000000001971305200000
SHS100000000000400030000
GH00000000000055000000
KC00000000000002000000
SJ00000000000000300000
YK00000000000000023000
GR00000000000000002000
HON00000000000000016013844
GC00000000000000000044

References

  1. Zhou, F.; Joos, G.; Abbey, C. Voltage stability in weak connection wind plants. In Proceedings of the 2005 IEEE PES General Meeting, San Francisco, CA, USA, 12–16 June 2005. [Google Scholar]
  2. Piwko, R.; Miller, N.; Sanchez-Gasca, J.; Yuan, X.; Dai, R.; Lyons, J. Integrating Large Wind plants into Weak Power Grids with Long Transmission Lines. In Proceedings of the 2006 Power Electronics and Motion Control Conference, Shanghai, China, 14–16 August 2006. [Google Scholar]
  3. Palsson, M.P.; Toftevaag, T.; Uhlen, K.; Tande, J.O.G. Large-scale wind power integration and voltage stability limits in regional networks. In Proceedings of the 2005 IEEE PES General Meeting, Chicago, IL, USA, 21–25 July 2002; Volume 2, pp. 762–769. [Google Scholar]
  4. NERC. Integrating Inverter-Based Resources into Low Short Circuit Strength Systems; North American Electric Reliability Corporation (NERC): Atlanta, GA, USA, 2017. [Google Scholar]
  5. Nalin, P.; Sebastian, A. Connection of Wind Farms to Weak AC Networks; CIGRE: Paris, France, 2016; ISBN 978-2-85873-374-3. [Google Scholar]
  6. NERC. BPS-Connected Inverter-Based Resource Performance; North American Electric Reliability Corporation(NERC): Atlanta, GA, USA, 2018. [Google Scholar]
  7. IEEE. Guide for Planning dc Links Terminating at ac Locations Having Low Short-Circuit Capacities; IEEE: New York, NY, USA, 1997. [Google Scholar]
  8. Fischer, M.; Schellschmidt, M. Fault ride through performance of wind energy converters with FACTS capabilities in response to up-to-date German grid connection requirements. In Proceedings of the 2011 IEEE/PES Power Systems Conference and Exposition, Phoenix, AZ, USA, 20–23 March 2011; pp. 1–6. [Google Scholar]
  9. Diedrichs, V.; Beekmann AAdloff, S. Loss of (angle) stability of wind power plants- the underestimated phenomenon in case of very low short circuit ratio. In Proceedings of the 10th Int. Workshop on Large-Scale IntegrAtion of Wind Power into Power Systems as well as on Transmission Networks for Offshore Wind Power Plants, Aarhus, Denmark, 25–26 October 2011; pp. 25–26. [Google Scholar]
  10. Hong, M.; Xin, H.; Liu, W.; Xu, Q.; Zheng, T.; Gan, D. Critical Short Circuit Ratio Analysis on DFIG Wind Farm with Vector Power Control and Synchronized Control. J. Electr. Eng. Technol. 2016, 11, 320–328. [Google Scholar] [CrossRef]
  11. Zhang, L.; Harnefors, L.; Nee, H.-P. Interconnection of Two Very Weak AC Systems by VSC-HVDC Links Using Power-Synchronization Control. IEEE Trans. Power Syst. 2010, 26, 344–355. [Google Scholar] [CrossRef]
  12. Huang, Y.; Yuan, X.; Hu, J.; Zhou, P. Modeling of VSC Connected to Weak Grid for Stability Analysis of DC-Link Voltage Control. IEEE J. Emerg. Sel. Top. Power Electron. 2015, 3, 1. [Google Scholar] [CrossRef]
  13. Saad, H.; Dennetière, S.; Clerc, B. Interactions investigations between power electronics devices embedded in HVAC network. In Proceedings of the 13th IET International Conference on AC and DC Power Transmission (ACDC 2017), Manchester, UK, 14–16 February 2017; pp. 1–7. [Google Scholar] [CrossRef]
  14. Wu, D.W.; Li, G.; Javadi, M.; Malyscheff, A.M.; Hong, M.; Jiang, J.N. Evaluating impact of renewable energy integration on system strength using site-dependent short circuit ratio. IEEE Trans. Sustain. Energy 2018, 9, 1072–1080. [Google Scholar] [CrossRef]
  15. Wu, D.; Aldaoudeyeh, A.M.; Javadi, M.; Ma, F.; Tan, J.; Jiang, J.N. A method to identify weak points of interconnection of renewable energy resources. Int. J. Electr. Power Energy Syst. 2019, 110, 72–82. [Google Scholar] [CrossRef]
  16. Huang, S.H.; Schmall, J.; Conto, J.; Adams, J.; Zhang, Y.; Carter, C. Voltage Control Challenges on Weak Grids with hing Penetration of wind Generation: ERCOT Experience. In Proceedings of the 2012 IEEE Power and Energy Society General Meeting, San Diego, CA, USA, 22–26 July 2012; pp. 1–7. [Google Scholar]
  17. Zhang, Y.; Huang, S.-H.F.; Schmall, J.; Conto, J.; Billo, J.; Rehman, E. Evaluating system strength for largescale wind plant integration. In Proceedings of the 2014 IEEE PES General Meeting Conference & Exposition, National Harbor, MD, USA, 27–31 July 2014; pp. 1–5. [Google Scholar]
  18. Huang, F. Experience with WTG weak system interactions on the ERCOT system. In Proceedings of the 2015 IEEE Power & Energy Society General Meeting, Denver, CO, USA, 16–30 July 2015. [Google Scholar]
  19. Electric Reliability Council of Texas. Panhandle Renewable Energy Zone (PREZ) Study Report; ERCOT: Taylor, TX, USA, 2014. [Google Scholar]
  20. Dissanayaka, A.; Wiebe, J.; Isaacs, A. Panhandle and South Texas Stability and System Strength Assessment; Technical Report; Electranix: Winnipeg, MB, Canada, 2018. [Google Scholar]
  21. Australian Energy Market Operator. Fact Sheet System Strength Final; Technical Report; AEMO: Melbourne, Australia, 2016; p. 1. [Google Scholar]
  22. Australian Energy Market Operator. System Strength Impact Assessment Guidelines; Technical Report; AEMO: Melbourne, Australia, 2018. [Google Scholar]
  23. Bialek, J. Tracing the flow of electricity. In IEE Proceedings-Generation, Transmission and Distribution; IET Digital Library, 1996; Volume 143, pp. 313–320. [Google Scholar]
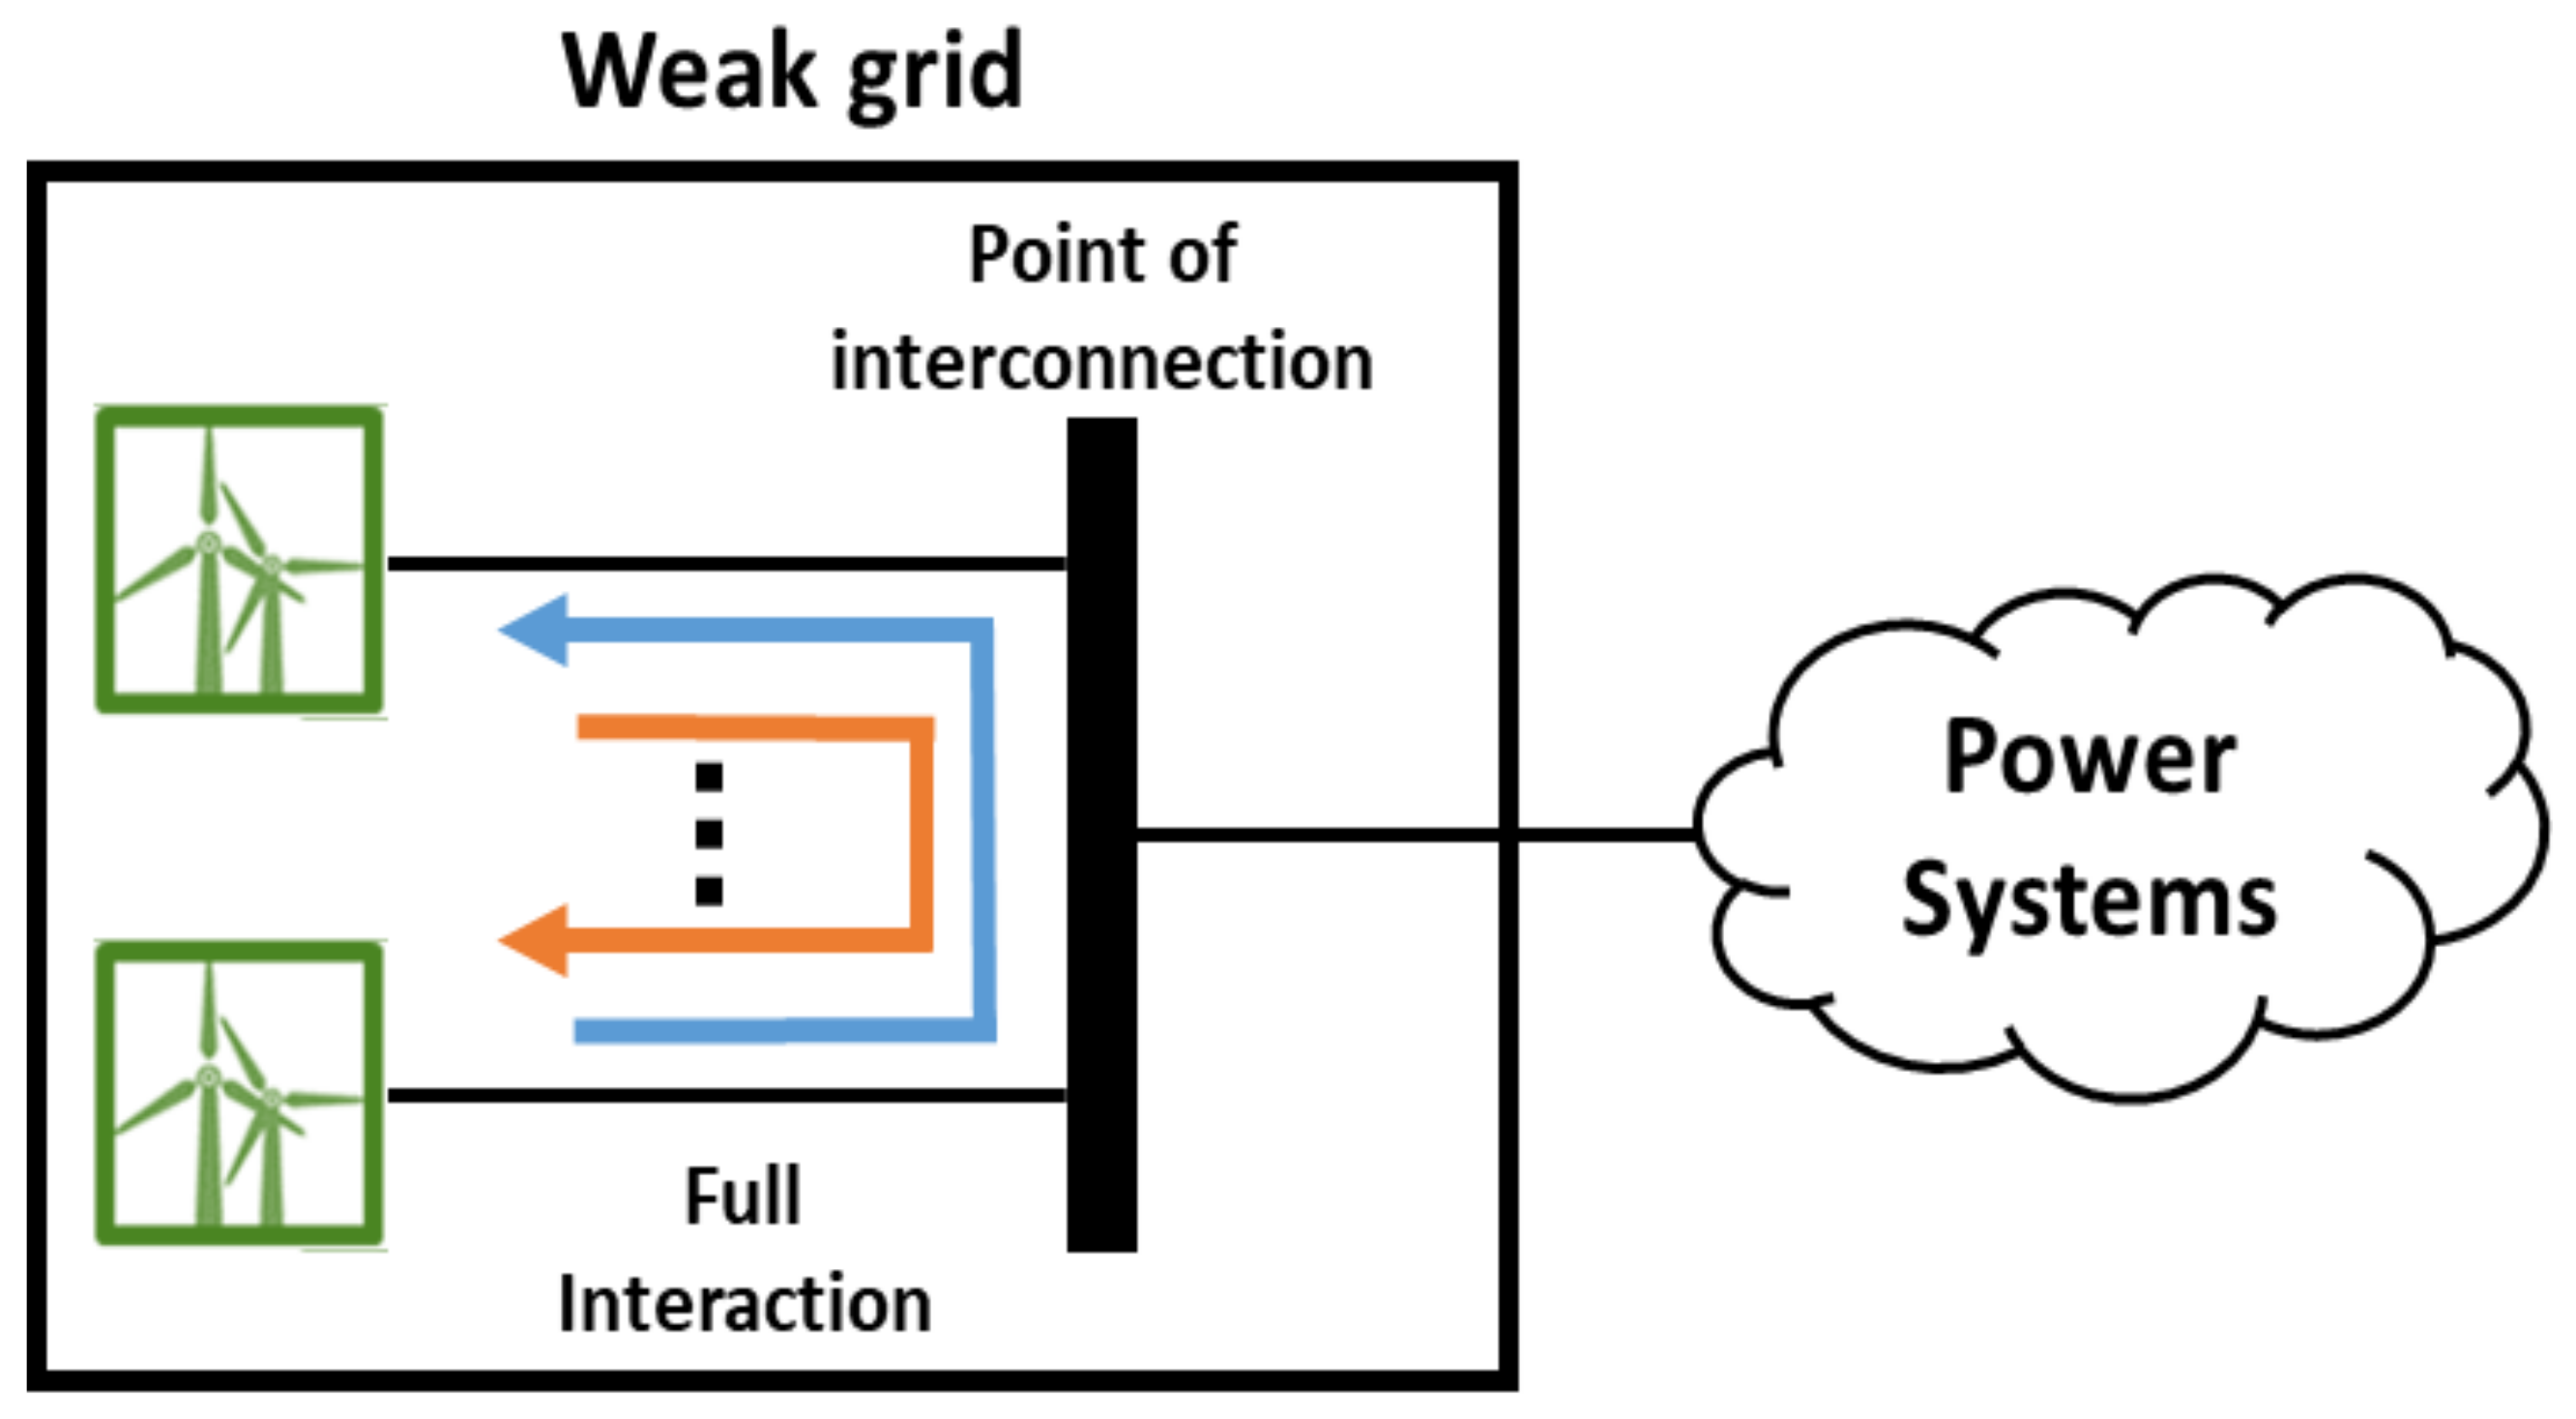
Figure 1. A sample system with a high penetration of wind plants for calculating weighted short-circuit ratio.
Sustainability 13 01569 g001
Figure 2. The conceptualization of power tracing. (a) The proportional-sharing principle of the power flows [23]. (b) Power-flow tracing of renewable energy sources in a four-bus network.
Sustainability 13 01569 g002
Figure 3. The system configuration of the KEPCO system where the RESs are connected.
Sustainability 13 01569 g003
Figure 4. Geometrical distance between GR#RE and other RESs.
Sustainability 13 01569 g004
Figure 5. Power-flow tracing of radial bus SA#RE to other RESs.
Sustainability 13 01569 g005
Figure 6. Interaction boundary determined in NC#RE by comparing the power flow of the RESs inside the boundary with that of the system.
Sustainability 13 01569 g006
Figure 7. Interaction boundaries on a system using the ERCOT method.
Sustainability 13 01569 g007
Figure 8. Interaction boundaries determined by the proposed scheme.
Sustainability 13 01569 g008
Table 1. Short-circuit capacity at the buses and active power generation from RESs.
BusShort-Circuit Capacity (MVA)RES Generation (MW)
AJ#RE2103268
SA#RE2090600
JD#RE291138
SH#RE356660
HN#RE3758170
SJ#RE292130
BH#RE296150
UD#RE3044197
SHS1#RE796840
KC#RE449920
NC#RE291340
WD#RE1978375
YA#RE3763321
BK#RE370730
YK#RE234223
HON#RE2182138
GC#RE477200
GH#RE159355
GR#RE161320
Table 2. Interaction boundaries with different buses of interest using the proposed method.
Bus of InterestIndependent
Buses
First
Boundary
Secondary
Boundary
Third
Boundary
AJGH, GRAJ, SA, JD, SH, HN, BH, UD, SHS1, SJNC, WD, YA, BK, KCYK, HON, GC
SAGH, GRSA, AJ, JD, SH, HN, BH, UD, SHS1, SJNC, WD, YA, BK, KCYK, HON, GC
JDGH, GRJD, HN, AJ, SH, SA, BH, SHS1, UD, SJNC, WD, YA, BK, KCYK, HON, GC
SHGH, GRSH, JD, AJ, HN, SA, BH, SHS1, UD, SJNC, YA, WD, BK, KCYK, HON, GC
HNGH, GRHN, JD, SH, AJ, SA, BH, SHS1, UD, SJNC, YA, WD, BK, KCYK, HON, GC
NCGH, GRNC, WD, YA, BK, KCHN, JD, SH, SHS1, UD, AJ, BH, SA, SJYK, HON, GC
BHGH, GRBH, UD, SH, HN, SHS1, JD, AJ, SA, SJYA, KC, NC, WD, BKYK, HON, GC
WDGH, GRWD, NC, YA, BK, KCHN, JD, UD, SH, SHS1, BH, AJ, SA, SJYK, HON, GC
YAGH, GRYA, NC, KC, WD, BKUD, SHS1, HN, JD, SH, BH, SJ, AJ, SAYK, HON, GC
BKGH, GRBK, YA, NC, WD, KCHN, UD, SHS1, JD, SH, BH, SJ, AJ, SAYK, HON, GC
UDGH, GRUD, SHS1, BH, SJ, HN, SH, JD, AJ, SAYA, KC, NC, BK, WDYK, HON, GC
SHS1GR, GHSHS1, UD, SJ, BH, HN, SH, JD, AJ, SAYA, KC, NC, BK, WDYK, HON, GC
GHGH, GRBK, YA, NC, WD, KCHN, SHS1, UD, SH, JD, BH, SJ, AJ, SAYK, HON, GC
KCGH, GRKC, YA, NC, BK, WDSHS1, UD, SJ, BH, HN, SH, JD, AJ, SAYK, HON, GC
SJGR, GHSJ, SHS1, UD, BH, HN, SH, JD, AJ, SAKC, YA, NC, BK, WDYK, HON, GC
YKGR, GHYK, HON, GCSHS1, UD, SJ, HN, SH, JD, BH, AJ, SAKC, YA, NC, BK, WD
GRGR, GHYK, HON, GCSHS1, SJ, UD, HN, SH, JD, BH, AJ, SAKC, YA, NC, BK, WD
HONGR, GHHON, GC, YKSHS1, UD, SJ, HN, SH, JD, BH, AJ, SAKC, YA, NC, BK, WD
GCGR, GHGC, HON, YKSHS1, UD, SJ, HN, SH, JD, BH, AJ, SAKC, YA, NC, BK, WD
Table 3. Comparison of WSCR at different interaction boundaries determined by ERCOT method.
GroupBus(#RE)WSCRGroupBus(#RE)WSCR
A′AJ, HN, SA, NC, SH, WD, BH, BK, JD, GH1.40A″JD, HN, WD
BK, GH, NC
2.49
B′UD, SHS1, YK, HON, KC, GC, YA, SJ4.18B″AJ, KC, SA, YA, SH, YK, BH, HON, UD, GC, SHS1, SJ1.54
C′GR80.67C″GR80.67
Table 4. The WSCR of interaction boundaries determined by the proposed method.
GroupProposed Boundaries(#RE)WSCR
AAJ, BH, UD, SA, JD, SHS1, SH, HN, SJ1.86
BKC, NC, BK, YA, WD3.67
CYK, HON, GC10.79
DGH28.96
EGR80.67
Publisher’s Note: MDPI stays neutral with regard to jurisdictional claims in published maps and institutional affiliations.