Article

The Impact of Using Novel Equations to Predict Nitrogen Excretion and Associated Emissions from Pasture-Based Beef Production Systems

by
Angelos E. Angelidis
1,
Graham A. McAuliffe
2,
Taro Takahashi
2,3,
Les Crompton
1,
Tianhai Yan
4,
Christopher K. Reynolds
1,
Sokratis Stergiadis
1,* and
Tom Misselbrook
2,*
1
Department of Animal Sciences, School of Agriculture, Policy and Development, University of Reading, P.O. Box 237, Earley Gate, Reading, Berkshire RG6 6EU, UK
2
Sustainable Agriculture Sciences, Rothamsted Research, North Wyke, Okehampton, Devon EX20 2SB, UK
3
Bristol Veterinary School, University of Bristol, Langford, Somerset BS40 5DU, UK
4
Sustainable Agri-Food Sciences Division, Agriculture Branch, Agri-Food and Biosciences Institute, Large Park, Hillsborough, County Down BT26 6DR, UK
*
Authors to whom correspondence should be addressed.
Sustainability 2022, 14(12), 7260; https://doi.org/10.3390/su14127260
Submission received: 26 April 2022 / Revised: 2 June 2022 / Accepted: 6 June 2022 / Published: 14 June 2022
(This article belongs to the Collection Sustainable Livestock Production and Management)

Abstract

:
The excretion of nitrogen (N) in faeces and urine from beef cattle contributes to atmospheric pollution through greenhouse gas and ammonia emissions and eutrophication of land and aquatic habitats through excessive N deposition and nitrate leaching to groundwater. As N excretion by beef cattle is rarely measured directly, it is important to accurately predict losses by utilising a combined knowledge of diet and production parameters so that the effect of dietary changes on the potential environmental impact of beef production systems can be estimated. This study aimed to identify differences between IPCC and more detailed country-specific models in the prediction of N excretion and N losses at a system level and determine how the choice of model influences the interpretation of differences in diet at the system scale. The data used in this study were derived from a farm-scale experimental system consisting of three individual grazing farms, each with a different sward type: a permanent pasture, a high sugar ryegrass monoculture, and a high sugar ryegrass with white clover (~30% groundcover). Data were analysed using a mixed linear model (residual maximum likelihood analysis). The IPCC methods demonstrated significantly lower estimates of N excretion than country-specific models for the first housing period and significantly greater losses for the grazing and second housing periods. The country-specific models enabled prediction of N partitioning to urine and faeces, which is important for estimation of subsequent N losses through the production system, although the models differed in their estimates. Overall, predicted N losses were greater using the IPCC approaches compared to using more detailed country-specific approaches. The outcomes of the present study have highlighted that different models can have a substantial impact on the predicted N outputs and subsequent losses to the environment for pasture-based beef finishing systems, and the importance, therefore, of using appropriate models and parameters.

1. Introduction

In the context of a constantly growing global population [1], the livestock production sector must increase their meat and dairy outputs by at least 53 and 48%, respectively [2], to meet increasing demands for animal-based products. Ruminant production systems can produce dairy and meat products of high nutritional value (particularly highly digestible amino acids) [3], preferably by utilising land unsuitable for arable farming in its pastoral form [4], or by feeding rations mostly consisting of sources not suitable for human consumption [5], thereby reducing food-feed competition [6]. However, beef cattle typically retain only 5–20% of their dietary nitrogen (N) intake [7,8] which makes them the least efficient users of human-edible protein sources in the livestock industry [9]. Furthermore, much of the non-retained N is excreted in urine, which increases as protein supply exceeds requirements with increasing crude protein concentration in the diet [7,10,11,12,13]. This has both environmental and financial implications, as the economic sustainability of the farm may be compromised due to the inefficient use of expensive dietary protein [14].
Excretion of N in faeces and urine of beef cattle contributes to atmospheric pollution through emissions of the greenhouse gas (GHG) nitrous oxide (N2O) and acidifying ammonia (NH3) [15], as well as eutrophication of land and aquatic habitats through excessive N deposition and nitrate (NO3) leaching to groundwater [16]. Furthermore, N excreted in urine is more labile and can have a more immediate effect on the environment [17] compared to the slower mineralisation rates exhibited by N found in faeces [18]. By retaining a higher proportion of dietary N in the animal, less N is excreted, resulting in lower potential for N2O and NH3 emissions and other N losses to the environment.
As N excretion by beef cattle is rarely measured directly (and would be challenging to do so on farms), it is important to be able to accurately predict excreta from knowledge of diet and production parameters, so that influences pertaining to any dietary changes on potential environmental impacts of beef production systems can be estimated. Currently, N losses to the environment resulting from N excretion by beef cattle, either during housing or grazing, are estimated by using default Tier 2 approaches given by the Intergovernmental Panel on Climate Change (IPCC) [19,20] or using more detailed country-specific approaches (e.g., the current UK greenhouse gas and ammonia emission inventory model; [21]).However, the accuracy of IPCC recommended methodologies (Tier 1 or 2) to report total N excretion from livestock relies on default values that are scalar multipliers of the total animal bodyweight (BW) as a function of N intake [22]. Previous studies have shown poor prediction accuracy of models utilising BW as the sole predictor [12,13,23]. Therefore, the use of more detailed and verified N excretion and N loss models and parameters, specific to climate, soils, and management systems, should allow a more accurate reflection of the potential environmental impact of different production systems (e.g., various diets) and management periods (e.g., housing and grazing). Therefore, the aims of the present study were to (i) identify differences between IPCC and other more detailed country-specific models in the prediction of N excretion and N losses at a system level, and (ii) assess how the choice of model influences the interpretation of management differences at the system scale.

2. Materials and Methods

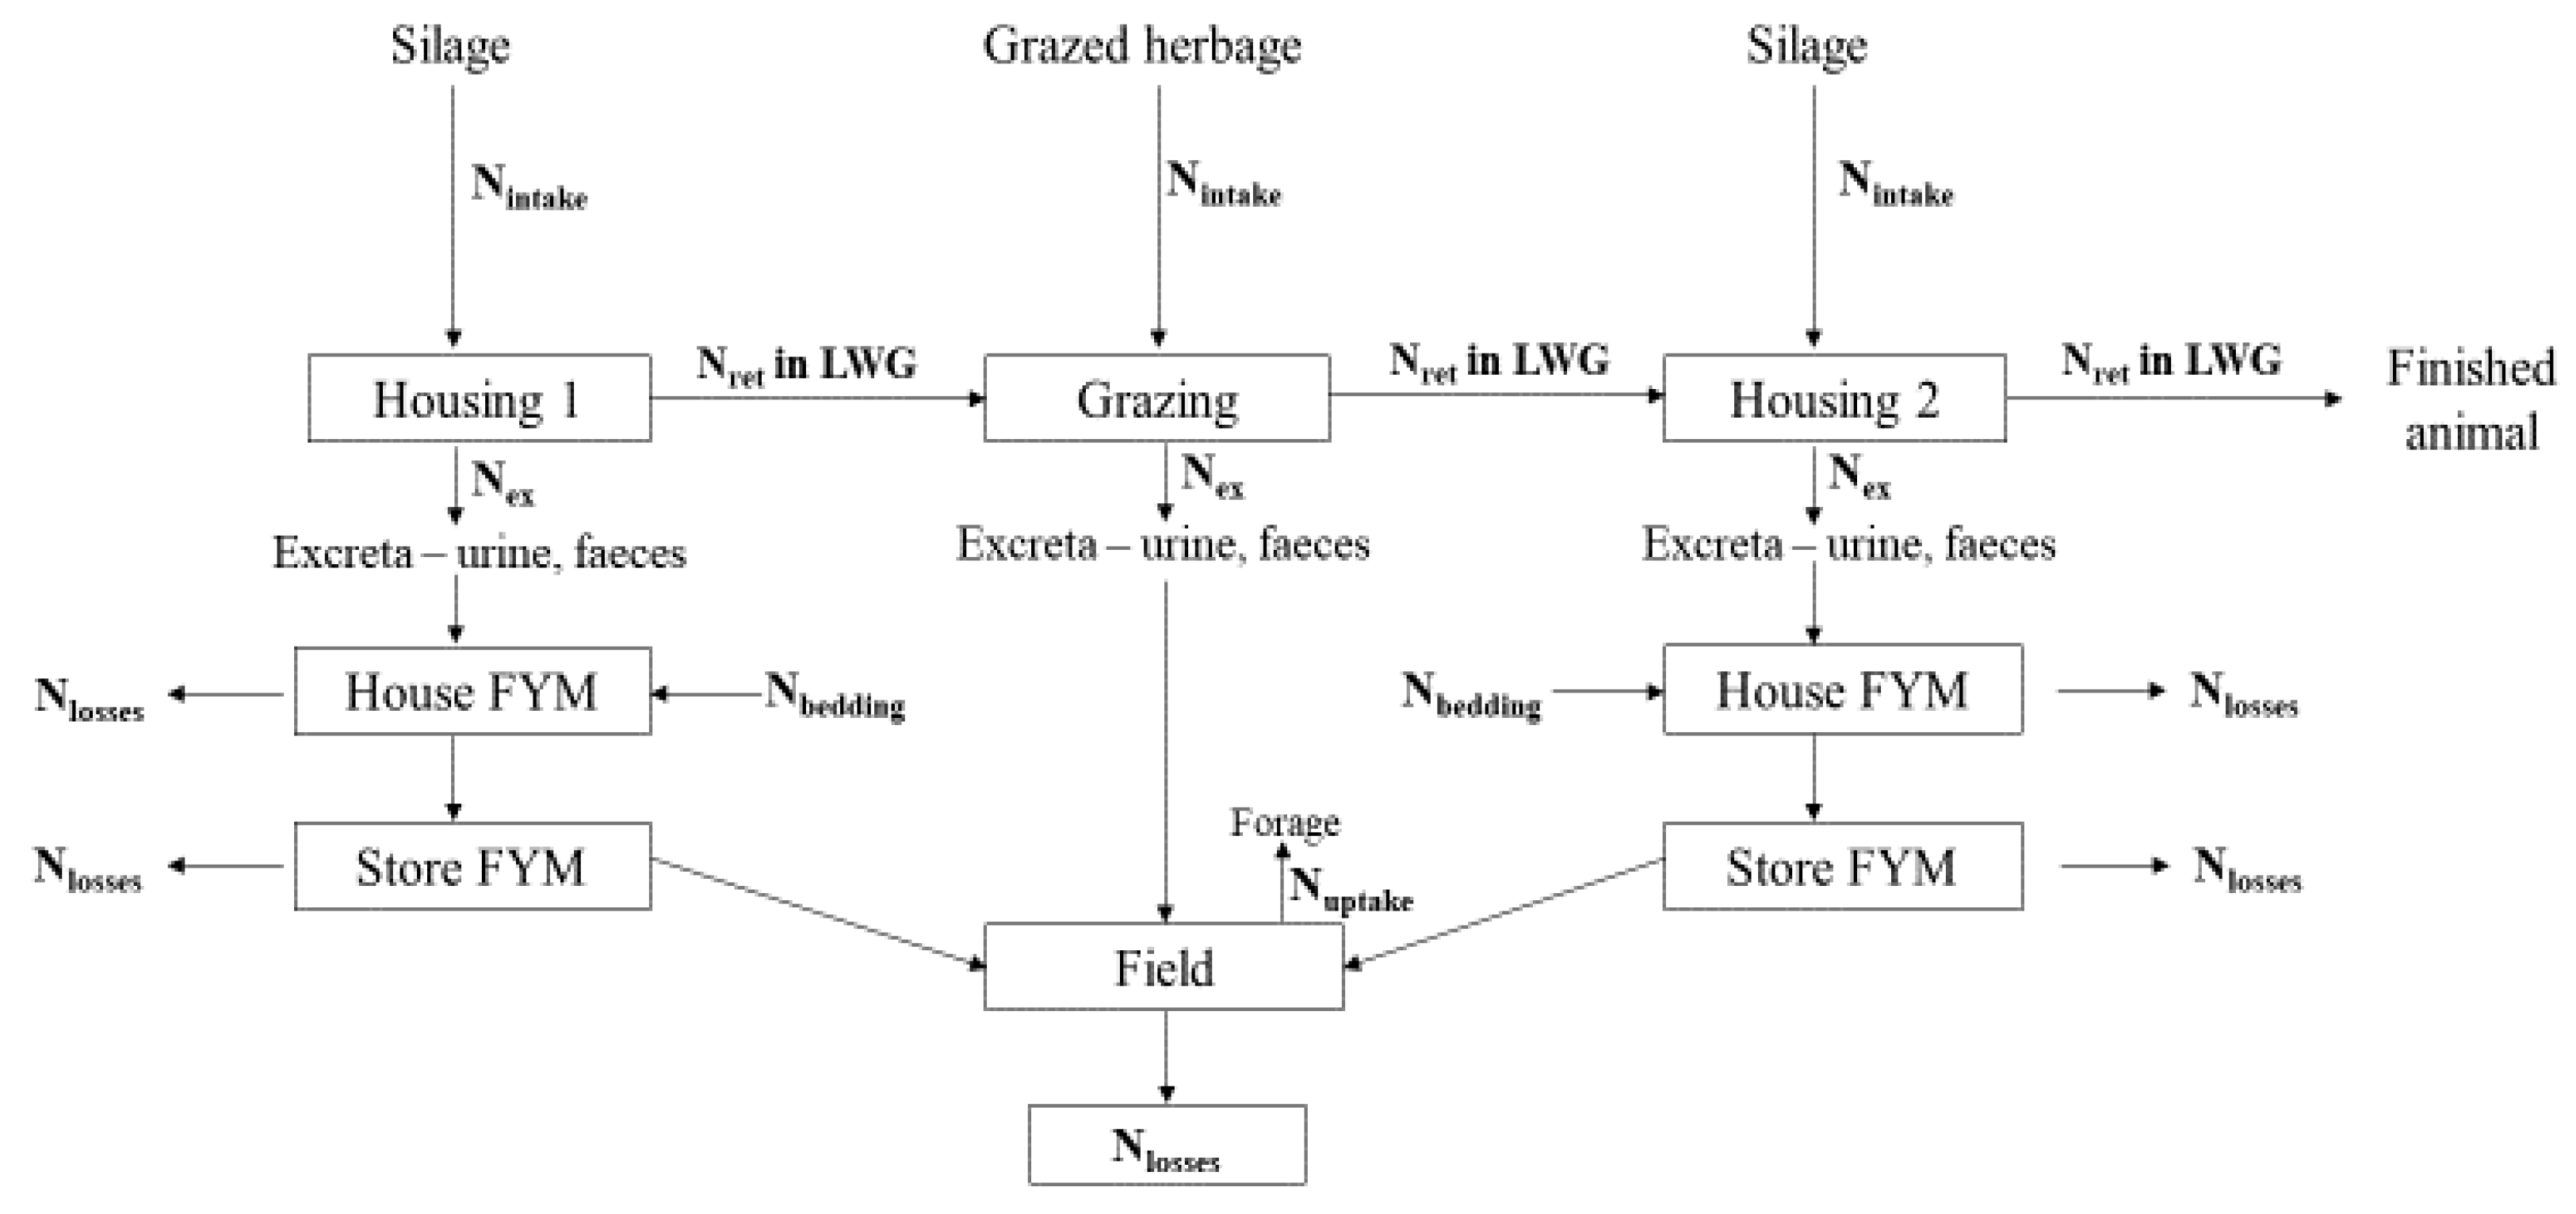
2.1. The North Wyke Farm Platform

Primary data used in this study were derived from a farm-scale experimental system, established in 2010 on the North Wyke Farm Platform (NWFP), located in the South West of England (NWFP; 50°45′ N, 3°50′ W). The NWFP consists of three individual grazing farms (“farmlets”; ~21 ha total per farmlet), each comprising five hydrologically isolated fields of between 1 and 8 ha. The farmlets were designed to assess the impact of different common temperate grazing systems on productivity and environmental sustainability of suckler beef and lamb production (lambs not covered in this study) [24,25]. Each of the farmlets occupies approximately 21 ha of land and supports 30 beef cattle and 75 ewes with their lambs (which primarily consist of twins). Over approximately a two-year period prior to the beginning of the experiment, all three farmlets operated under the same pasture management strategy, permanent pasture (PP), predominately composed of perennial ryegrass (Lolium perenne) with some unsown grass, legume, and forb species, receiving N fertiliser at the standard recommended rate. Since 1 April 2013, two new treatments were progressively introduced:
i.
Legumes; white clover (Trifolium repens)/high sugar grass (perennial ryegrass; Lolium perenne L. cv. AberMagic) (WC), with the aim of maintaining clover ground cover of 30%. No N fertiliser was applied to this treatment due to clover’s atmospheric N fixation capacity.
ii.
Perennial ryegrass monoculture (HS), utilising a high sugar variety (Lolium perenne L. cv. AberMagic). This system received N fertiliser at the standard recommended rate as in the control farmlet.
Cattle were born and reared on an adjacent suckler system until weaning, when they were assigned to the three systems of the NWFP. For the present study, data from cohorts entering the NWFP in the years 2015, 2016 and 2017 were used. A covariate-based constrained randomisation process is applied to allocate 30 cattle to each farmlet, to balance experimental groups for breed, gender, and sire combinations. The allocation technique also imposed constraints on intergroup variations in mean, as well as standard deviation, of age, weaning weight, and average daily growth rate to weaning. Weaned calves entered the NWFP in October at six months of age and were housed until the following April; during this period, they were fed silage produced from their respective farmlets. Following winter housing, cattle were turned out to pasture and rotated around the fields that constitute each farmlet, with certain fields being reserved for silage production for the following winter. The animals were maintained until they reached target weights of ∼555 kg for heifers and ∼620 kg for steers (typically around October/November), to achieve sufficient muscle coverage (conformation) and fat cover (fat class) for the UK market [26]. A small proportion of animals spent part of the second winter in housing until they satisfied these criteria.

2.2. Sample and Data Collection, Chemical Analysis and Feed Intake

Individual cattle were weighed approximately fortnightly by the technical farm team, thus providing a temporal insight (from weaning to slaughter) into the growth rates of finishing beef animals throughout the growing season. Pasture snip samples were collected when animals were occupying the respective field(s) at that time (e.g., animals may occasionally have been occupying multiple fields simultaneously). Herbage samples were cut at a 5 cm height from ground level to simulate grazing by cattle, following a W-transect. During sampling, dead material, seed heads, and weeds that animals tend to find unpalatable were avoided. Grab samples of silage were collected and bulked during winter at a similar frequency from five points along the width of each feeding area per housed group of animals during feeding time, so that they represented forage being consumed rather than silage during ensiling and/or storage. Samples were subsequently stored at −20 °C until chemical analysis was carried out. They were weighed to 2 ± 0.1 mg using a Mettler Toledo MX5 electronic microbalance and inserted into 5 × 3.5 mm tin capsules, and were then analysed in a Carlo Erba NA2000 elemental analyser (Okehampton, UK) connected to a Sercon 20–22 isotope ratio mass spectrometer (Okehampton, UK). Dry matter intake was estimated by using the IPCC 2006 [19] 10.17 equation, which takes account of the animal body weight and the estimated dietary net energy concentration of the diet.

2.3. Approaches Used for the Prediction of N Excretion

Total N excretion from animals was predicted using previously published equations by IPCC 2006 [19], IPCC 2019 [20], Reed et al. [27] and Angelidis et al. [12]. These equations were applied to appropriate NWFP individual animal data for cohorts entering the NWFP in the years 2015, 2016 and 2017. More specifically, equation 10.31 (using N intake and N retention as predictors) was used from both IPCC reports, from the original 2006 [19] and the refined 2019 [20] versions, respectively. Furthermore, equations “9” and “13” were used from Reed et al. [27] and equations “2e” and “1d” from Angelidis et al. [12], for the prediction of N excretion in urine (UNO) and manure (MNO), respectively, representing single linear models with N intake used as the sole predictor (Table 1). The data used for model development by Reed et al. [27] was collected from indirect calorimetry studies conducted in the USA (Beltsville, MD, USA), while the study from Angelidis et al. [12] used a combination of data originating from England (Centre for Dairy Research, University of Reading, Reading, UK), Northern Ireland (Agri-Food and Biosciences Institute, Hillsborough, UK) and the USA (Beltsville Agricultural Research Centre, USDA ARS). The Reed et al. [27] equations are currently used in the UK agriculture greenhouse gas and ammonia emission inventory model [21], while the Angelidis et al. [12] model represents a potential UK-specific improvement to the inventory model.

2.4. Approaches Used for Estimation of N Losses at System Level

Nitrogen losses to the environment at the system level, subsequent to N excretion by the beef cattle either during housing or grazing were also estimated, using IPCC 2006 [19] and IPCC 2019 [20] Tier 2 default approaches or a more detailed country-specific approach based on the current UK greenhouse gas and ammonia emission inventory model [21], but employing either the Reed et al. [27] or Angelidis et al. [12] equations for prediction of N excretion. The approaches are subsequently labelled in this study as IPCC 2006, IPCC 2019, Reed, and Angelidis. Emission variables that were calculated based on these four approaches, included NH3 (grams per day (g/d); NH3-N), N2O (g/d; N2O-N), total N losses (through NH3 volatilisation, denitrification, and leaching; g/d; Nlos), total NH3 from housing or pasture (g/d; NH3-Nhg), total direct N2O from housing or pasture (g/d; N2O-Nhg), nitric oxide (g/d; NO-Nhg), indirect N2O from volatilisation (g/d; N2O-Nhgv), N leached (grazing period only) (g/d; Nglea), indirect N2O from leaching (grazing period only) (g/d; N2O-Nglea), dinitrogen (g/d; N2-Nhg), total N in farmyard manure (FYM; storage) (g/d; Nstfym), total ammoniacal N (TAN) in FYM (storage; g/d; TANstfym), total NH3 from storage (g/d; NH3-Nst), total direct N2O during storage (g/d; N2O-Nst), dinitrogen during storage (g/d; N2-Nst), nitric oxide during storage (g/d; NO-Nst), indirect N2O from volatilisation during storage (g/d; N2O-Nstv), total N in FYM (spreading; g/d: Nspfym), TAN in FYM (spreading; g/d: TANspfym), total NH3 from spreading (g/d; NH3-Nsp), total direct N2O from spreading (g/d; N2O-Nsp), dinitrogen from spreading (g/d; N2-Nsp), nitric oxide from spreading (g/d; NO-Nsp), indirect N2O from volatilisation from spreading (g/d; N2O-Nspv), N leached from spreading (g/d; Nsplea), and indirect N2O via leaching from spreading (g/d; N2O-Nsplea). A graphic representation of a system’s N inputs and losses is shown in Figure 1.
For IPCC 2006 and IPCC 2019, the default emission factors and parameters (using the given FracGASM values as estimates of ammonia emission factors) were used to estimate the N losses during the housing period, from manure management and from grazing. For the Reed and Angelidis predictions, UK-specific emission factors and parameters [21,28] were used to estimate these N losses, using the N excretion (and partitioning between urine and faeces) predictions as given by either the Reed et al. [27] or Angelidis et al. [12] specific equations.

2.5. Statistical Analysis

Data were analysed using a mixed linear model (residual maximum likelihood analysis; REML) [29] in GenStat 17th edition [30]. In mixed linear models, the fixed effects included N excretion prediction approaches [12,19,20,27], pasture type (WC, HS, PP), experimental period (first housing indoor, grazing outdoor, second housing indoor), gender (male, female), and their interactions; the random factors used were the animal and the year of study. The main effects were considered to have a significant effect when p < 0.05 and a tendency towards significant effect when 0.05 ≤ p < 0.10. Normality plots were used to perform the residual diagnostics of the final model, and the data showed no deviation from normality. When a fixed effect was significant, pairwise comparisons of means were performed between the experimental groups using Fisher’s least significant difference test.

3. Results

3.1. Effect of Prediction Model

For the prediction of N excretion, both IPCC methods produced the highest values; Angelidis showed the lowest value, and intermediate values were produced by Reed (p < 0.001) (Table 2). Angelidis showed slightly higher N partitioning towards urine than Reed (p < 0.001), while the opposite was true for N partitioning towards faeces by a larger margin (p < 0.001). Predicted total NH3 emissions were highest for IPCC 2006, followed by IPCC 2019, while Angelidis was significantly lower, and Reed showed the lowest value (p < 0.001). The same relationship was observed when NH3 emissions were expressed as a percentage of N excretion (p < 0.001), however when NH3 was expressed as kg per kg of liveweight gain (LWG), IPCC predictions were still the highest, with Angelidis and Reed predictions being the lowest, with no difference between them (p < 0.001). The highest prediction for N2O emission was given by IPCC 2006, the lowest by Angelidis and Reed, while IPCC 2019 was intermediate (p < 0.001). When N2O was expressed as a percentage of N excretion (p < 0.001), IPCC 2006 was the highest, followed by IPCC 2019, and then Angelidis, while Reed showed the lowest value. N2O expressed as kg per kg of LWG showed no significant difference between the four prediction approaches (p = 0.800). Total Nlos prediction was highest for IPCC 2006, lowest for Angelidis and Reed, and showed an intermediate value for IPCC 2019 (p < 0.001). When Nlos was expressed as a percentage of N excretion, the prediction by Reed became the lowest and the prediction of Angelidis appeared slightly higher (p < 0.001). Finally, Nlos predictions as a function of kg per kg of LWG were highest for IPCC 2006 and IPCC 2019 and lowest for Angelidis and Reed (p < 0.001). The highest predicted value for NH3-Nhg was from IPCC 2006, followed by IPCC 2019, and then Angelidis, with Reed showing the lowest value (p < 0.001). Furthermore, N2O-Nhg highest prediction was in IPCC 2006, lowest in IPCC 2019, while Angelidis and Reed showed intermediate values (p < 0.001). The predicted values for NO-Nhg were identical between Angelidis and Reed (p < 0.001), with the highest predicted value from IPCC 2006 and lowest from IPCC 2019 and took intermediate values in cases of Angelidis and Reed (p < 0.001). Similarly, for N2-Nhg, the highest prediction was from IPCC 2006, the lowest from IPCC 2019, while Angelidis and Reed showed intermediate values (p < 0.001). The Nglea was highest for IPCC 2006, lowest for Angelidis, while Reed and IPCC 2019 were intermediate (p < 0.001); for N2O-Nglea, Angelidis and Reed had the lowest values, IPCC 2019 showed the highest prediction, and IPCC 2006 had an intermediate value (p < 0.001). In general, the IPCC methods showed the highest values throughout, with smaller, and not always significant, differences between Reed and Angelidis.

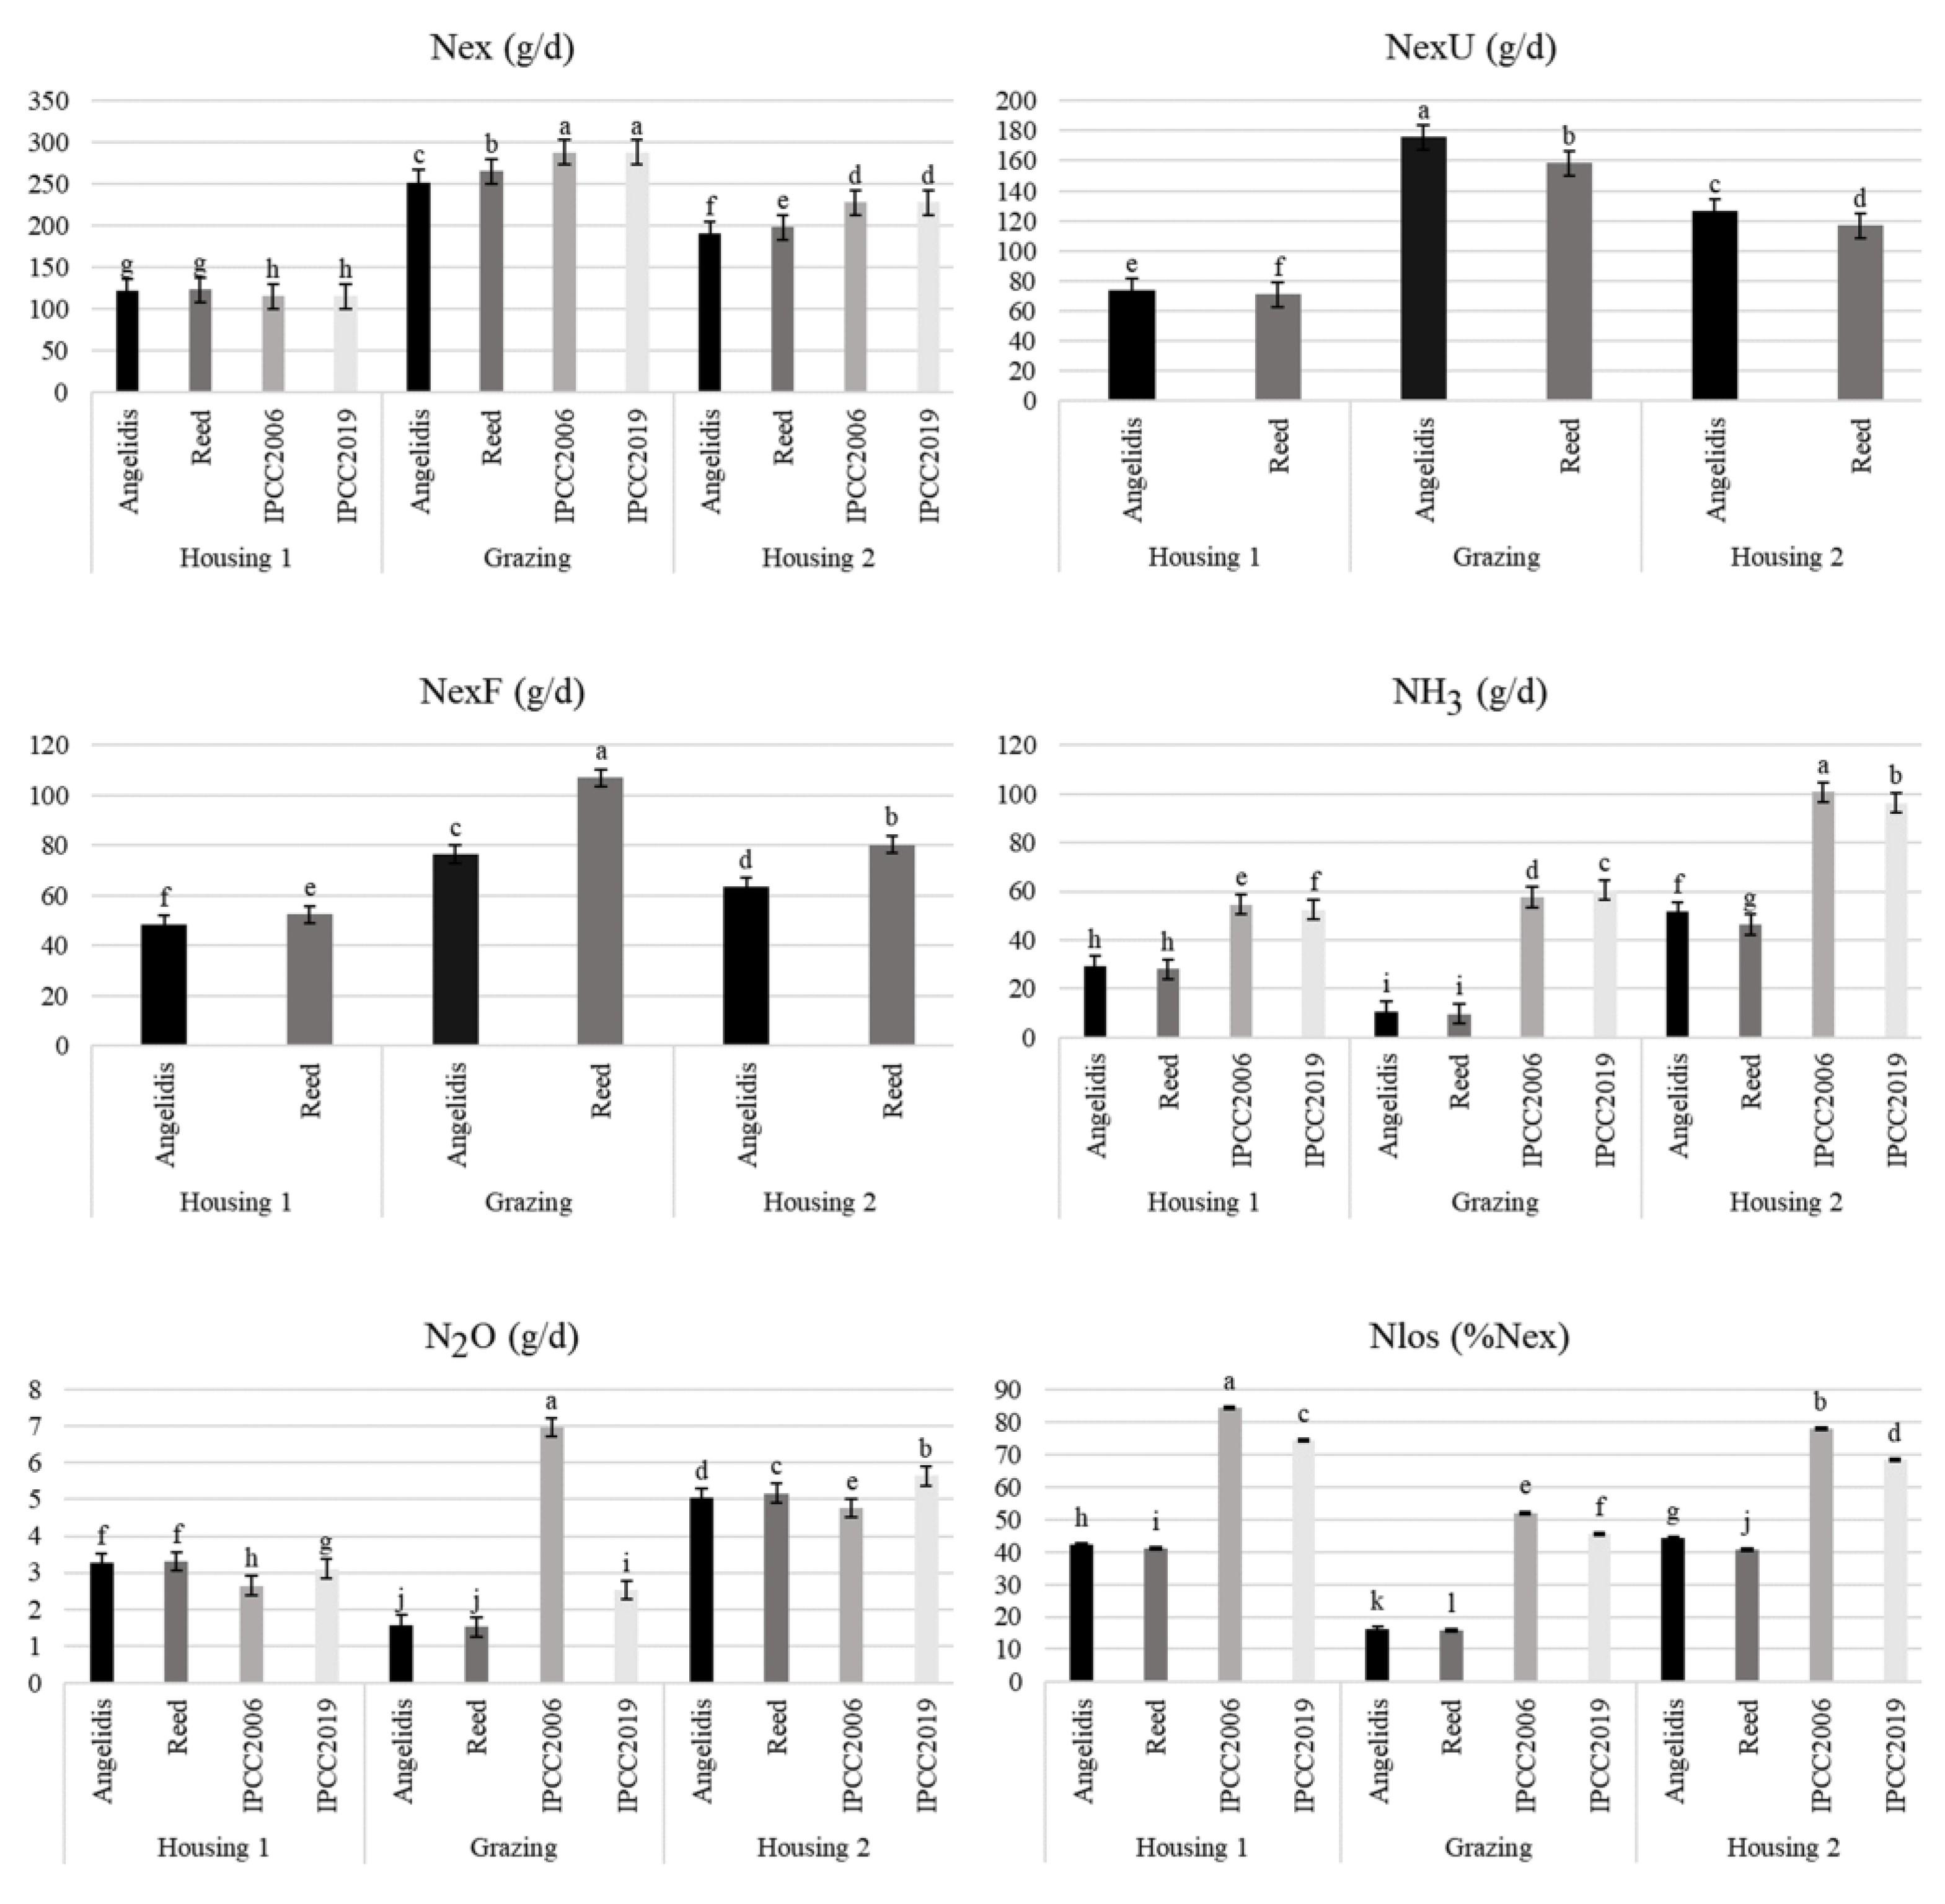
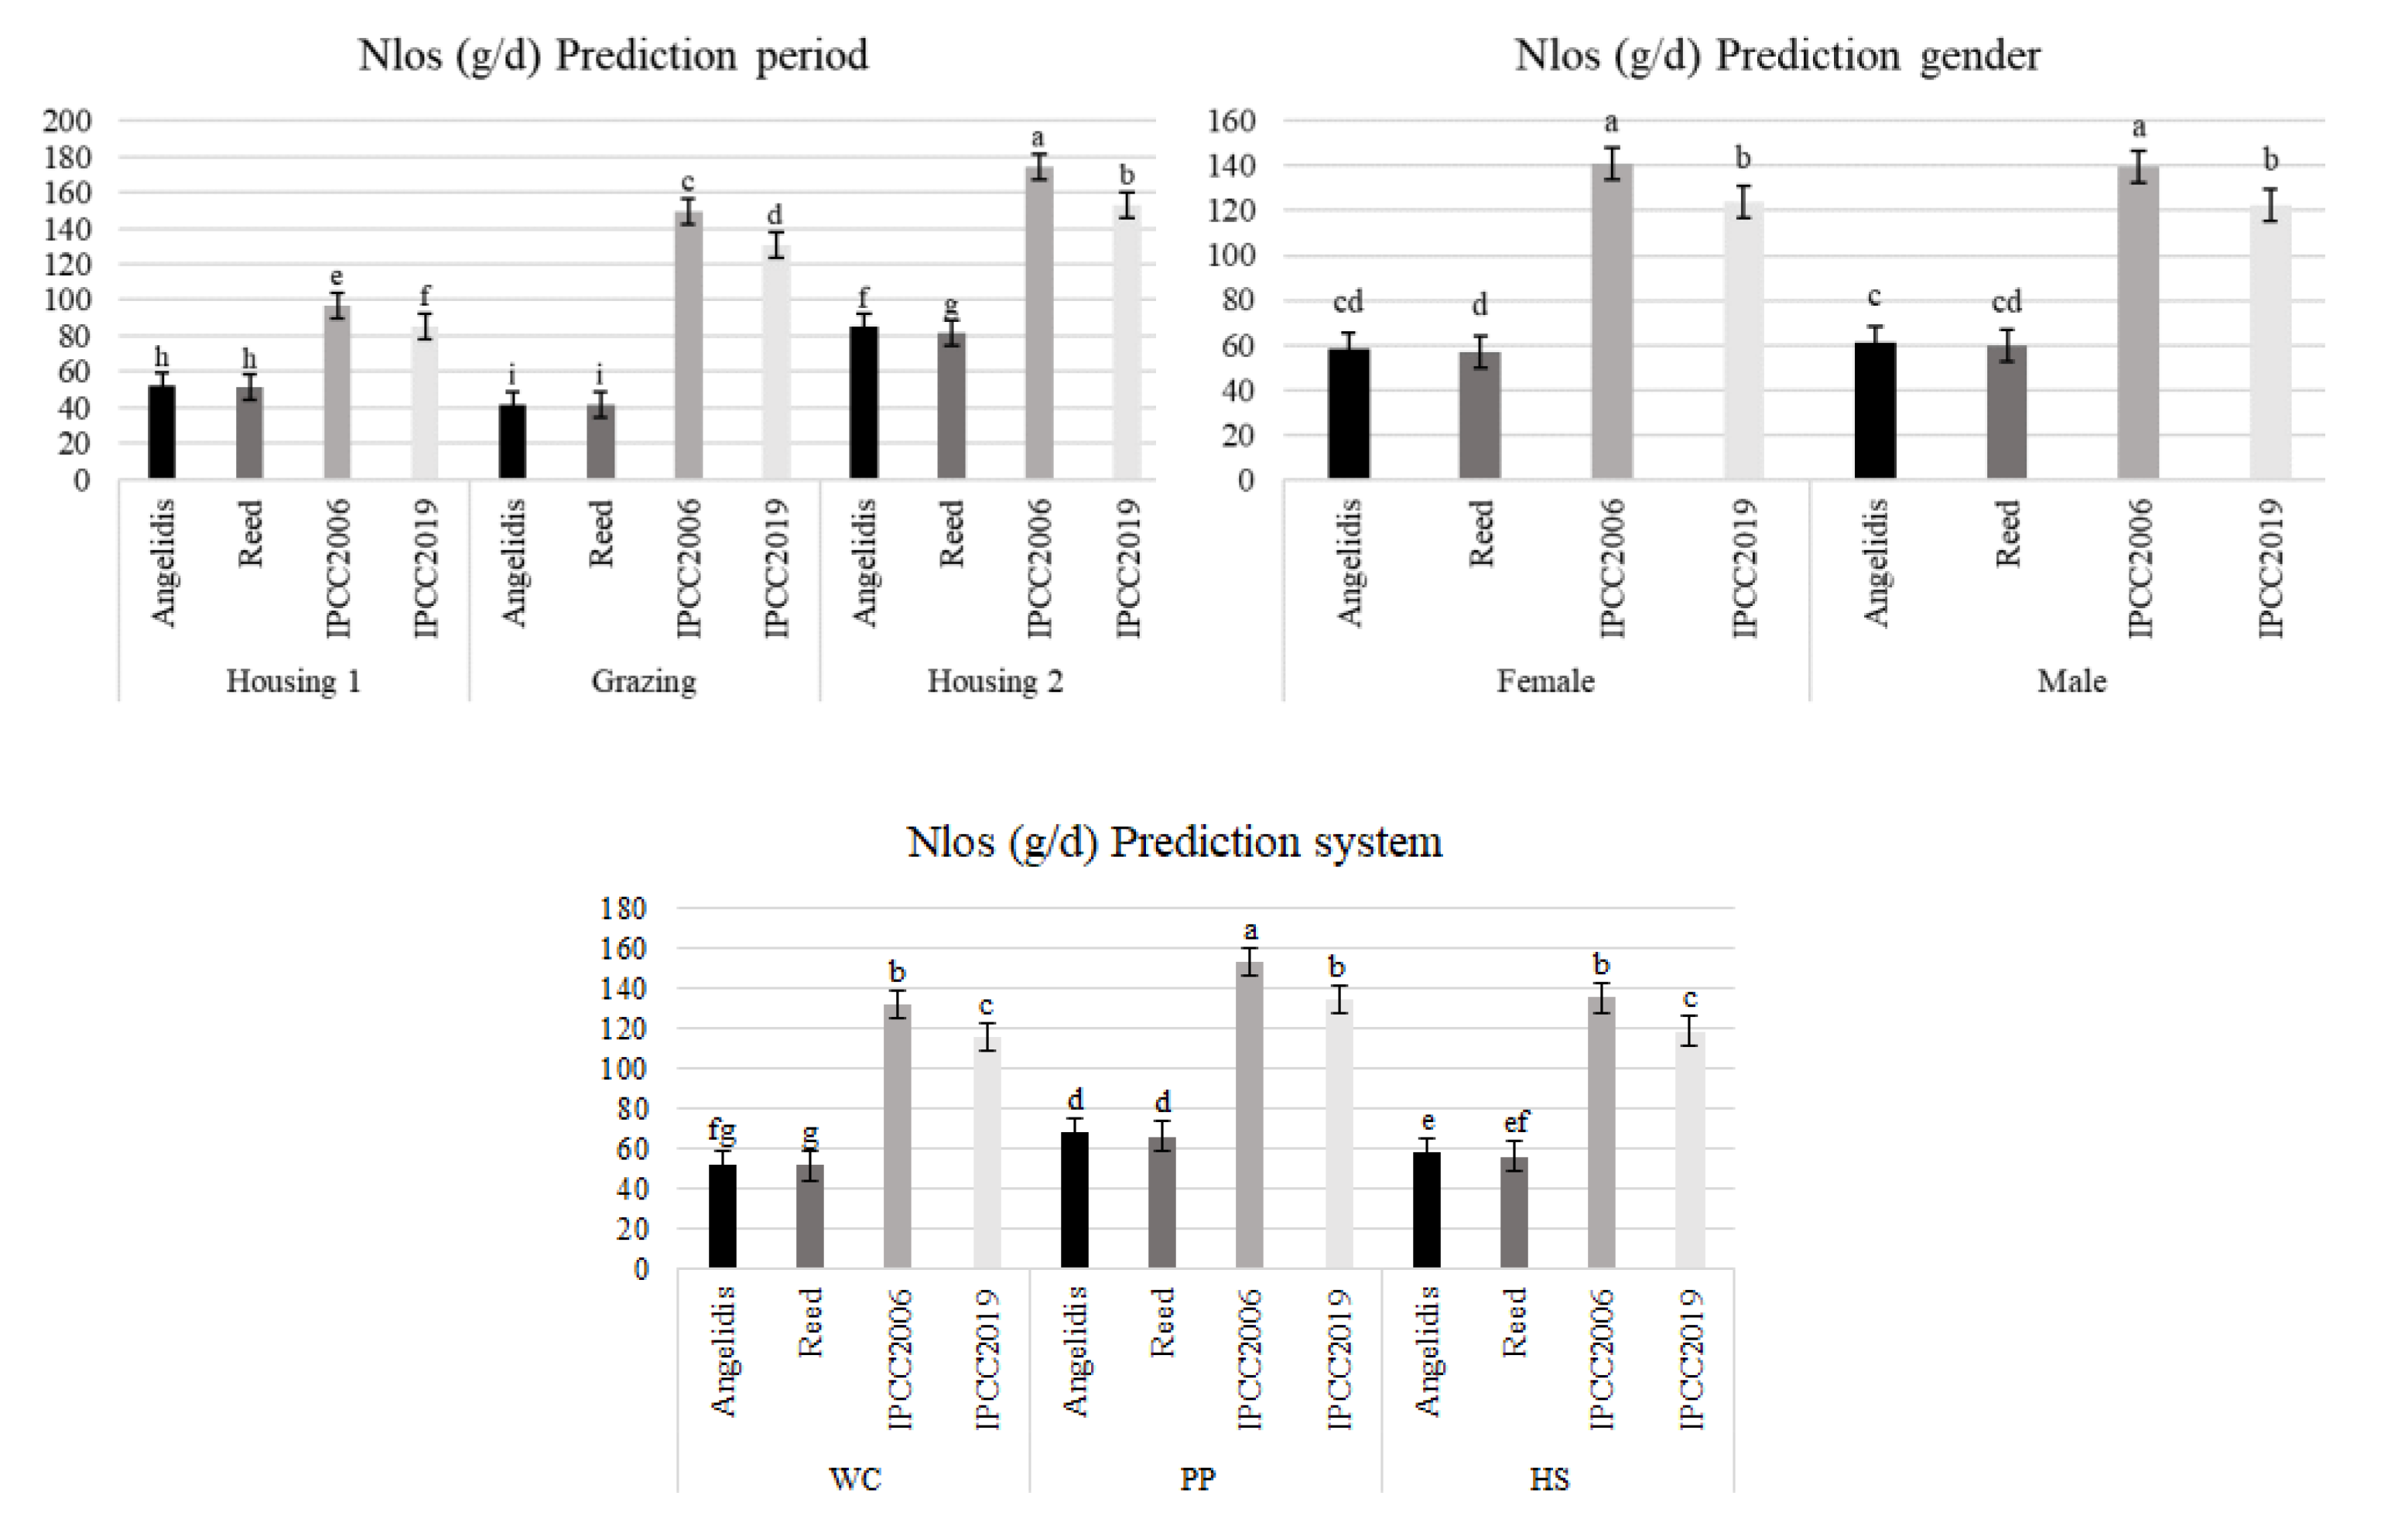
3.2. Interactions between Prediction Approach and Production Period

Significant prediction approach × production period interactions were observed for Nex, NexU, NexF, NH3-N, N2O-N, Nlos (Figure 2), and for NH3-Nhg, N2O-Nhg, NO-Nhg, N2O-Nhgv, Nglea, N2O-Nglea, and N2-Nhg. The IPCC methods gave similar predictions for N excretion, being significantly lower than for Angelidis or Reed for the first housing period, and significantly greater for the grazing and second housing periods. Predictions from Angelidis and Reed were similar for the first housing period, however, for the grazing and second housing periods, predictions from Angelidis were significantly lower (p < 0.001) (Figure 2). The partitioning of N to urine was consistently higher for Angelidis and lower for Reed across all three periods, with the relative difference being greater during grazing (p < 0.001). During livestock housing, predicted NH3 emissions were highest for IPCC 2006, followed by IPCC 2019, with Angelidis and Reed generating the lowest values for the first housing period, but Reed produced significantly lower values whilst IPCC 2019 and Angelidis were similar for the second housing period (p < 0.001). Finally, for the grazing period, IPCC 2019 predicted the greatest NH3 emission, Angelidis and Reed the lowest, and IPCC 2006 was intermediate (p < 0.001). IPCC 2006 predicted for the greatest N2O emission during the grazing period, with Angelidis and Reed both giving the lowest predictions, and IPCC 2019 was intermediate (p < 0.001). Moreover, in both housing periods the IPCC 2019 method generated the highest values, IPCC 2016 the lowest, while Angelidis and Reed were intermediate (p < 0.001). Total Nlos prediction was highest for IPCC 2006 for all three periods, followed by IPCC 2019, while Angelidis and Reed gave the lowest values for the first housing and grazing periods (p < 0.001); however, Reed alone showed the lowest value for the second housing period (p < 0.001).

3.3. Interactions between Prediction Approach and Forage Type

Significant prediction approach × production period interactions were observed for NexU, NexF, NH3-N, N2O-N, Nlos, NH3-Nhg, N2O-Nhg, NO-Nhg, N2O-Nhgv, Nglea, N2O-Nglea and N2-Nhg. The predicted partitioning of N excretion to urine was consistently higher for Angelidis and lower for Reed across the three farmlets, with the relative difference being slightly greater for PP (p = 0.03). The opposite was observed for the partitioning of excreted N to faeces, as may be expected, where Reed gave the highest predicted values in all cases (p < 0.001). Predicted NH3 emissions were highest for IPCC 2006 and IPCC 2019 across all three treatments, with Angelidis being intermediate and Reed demonstrating the lowest emissions for PP and HS, while for WC, both Angelidis and Reed gave the lowest predicted values (p = 0.04). Expressed as a percentage of N excretion, predicted NH3 emissions were greatest for all systems with IPCC 2006, followed by IPCC 2019, and Angelidis, while Reed consistently gave the lowest prediction. The IPCC 2006 method showed the highest predicted N2O emissions across all systems, followed by IPCC 2019, with Angelidis and Reed giving the lowest. The predicted total Nlos was highest for IPCC 2006 for all three systems, followed by IPCC 2019, with Angelidis and Reed producing the lowest (p = 0.01).

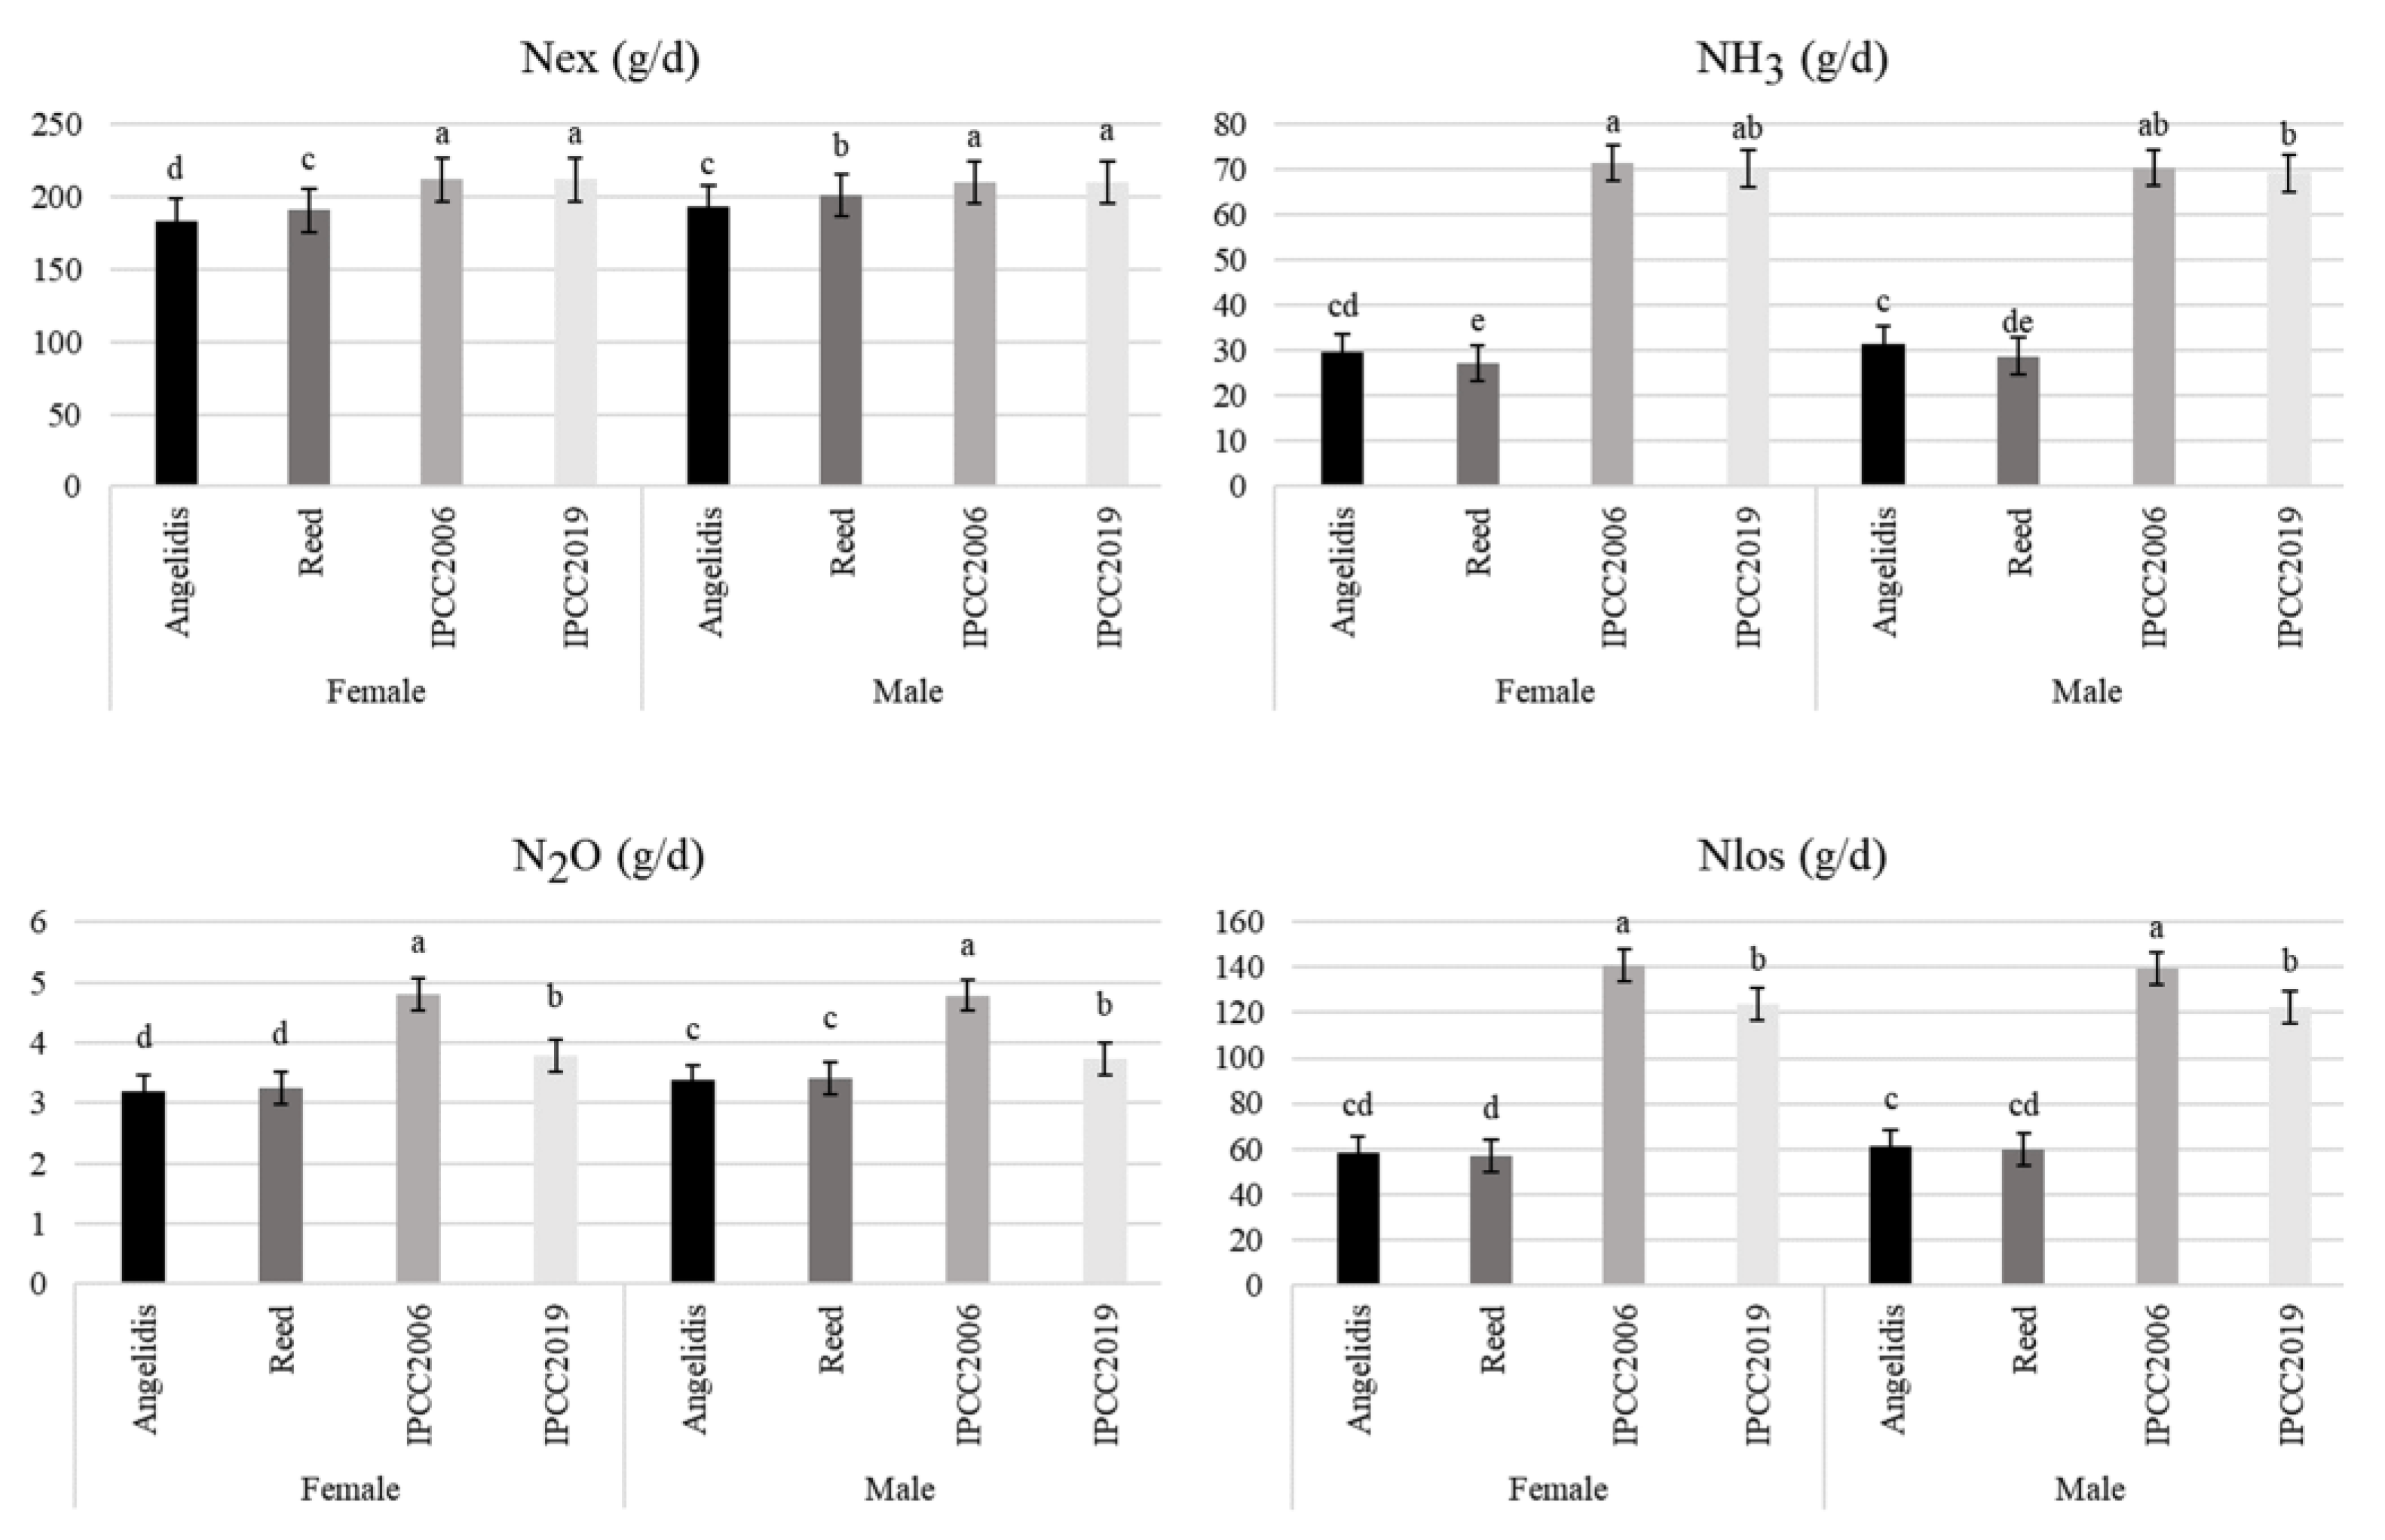
3.4. Interactions between Prediction Approach and Gender

Significant prediction approach × production period interactions were observed for Nex, NH3-N, N2O-N, Nlos (Figure 3), and NexF, N2O-Nhg, NO-Nhg, and N2-Nhg. There were no significant effects pertaining to gender on the prediction of N excretion for the IPCC methods, but for both Angelidis and Reed, greater N excretion was predicted for male compared with female animals (p < 0.001) (Figure 3). Similarly, for N2O emissions, greater losses were predicted for males than females by the Angelidis and Reed methods, while there were no gender differences for the IPCC methods. There were no interactions between prediction method and animal gender on other N losses or on total N loss (Figure 4).

4. Discussion

4.1. Calculation of N Excretion Using IPCC or Literature Equations

Higher N losses were observed for both IPCC-predicted N excretions for all variables presented in Table 2. This may be explained by the fact that IPCC Tier 2 methods use animal body weight as the main predictor, whereas the Angelidis and Reed equations used in this study relate N excretion to individual animal N intake, which has been shown to be a more accurate predictor of N excretion in cattle than body weight alone [12,13,23,31]. The higher estimates for N2O and NH3 emission from the IPCC methods compared with Reed and Angelidis are partly because of the higher N excretion estimates, the partitioning of dietary N to urine and faeces, but also because of differences in the assumed N2O and NH3 IPCC emission factors, with the system- and country-specific factors as used in the Reed and Angelidis approaches generally being lower than the default factors used in the IPCC approaches.
The use of more detailed and verified N excretion and N loss models and parameters specific to the climate, soils, and management system enables a more accurate reflection of the potential environmental impact of different production systems (e.g., in this example, diets) and management periods (housing and grazing). For example, the IPCC 2019 model estimated NH3 emissions and Nlos at 36.6% and 62.7% of N excretion, respectively, while estimates using the Angelidis approach were approximately half of these values, at 18.2% and 34.3% of N excretion, respectively. These differences in the estimated N excretion were similar across the grazing and housing periods, farmlets and genders considered, showing that these considerations are likely to be relevant across the range of different beef management practices and reflect differences in predicted N excretion in faeces and urine. Application of these equations in this study relies on previously published validations, as no measured data for N excretion were available for the NWFP cattle.

4.2. Accounting for N Partitioning between Urine and Faeces in the Calculation of N Emissions

The IPCC equations for N excretion do not account for the partitioning of N in urine and faeces, although these have a strong influence on the subsequent fate as a source of N pollution [15]. The N excreted in urine is more labile and thus more susceptible to losses to the environment [17,32], compared to the slower mineralisation rates exhibited by N found in faeces [18]. Thus, using models predicting UNO and FNO separately (rather than total in manure), such as proposed by Angelidis et al. [12] and Reed et al. [27], can improve any estimation of the subsequent N cycling through manure management and soils, accounting for different N forms and pathways, including losses to the environment. The present study highlighted that when using the more detailed equations, the NWFP beef production system does not appear to be as “leaky” as the IPCC default methods would suggest, with this finding being consistent across the different production periods, systems, and genders. Further work to validate these equations and predictions specifically for the NWFP, and by extension for UK beef production systems, would be a useful next step. This finding has significant implications for system-wide agri-environmental studies, such as life cycle assessments, with further studies being required to determine the true effect (e.g., by conducting sensitivity analyses of different N-excretion losses).

4.3. Effect of Using IPCC or Individual Animal Equations on the Calculated Forms of N Loss

Steps taken by the beef sector to improve N use efficiency and reduce losses can be more fully reflected in the more detailed approach of national emission accounting. Differences in the form of N loss were evident for the different approaches. The IPCC 2019 model estimated N losses of 56.7, 4.5, and 19% as NH3, denitrification (N2O, NO, and N2), and leaching, respectively. Using the Angelidis approach, respective values were 51.4, 13.4, and 14.6%. Denitrification and leaching losses from soil can be influenced by soil properties, rainfall, and pasture management [23,33,34]. However, losses as N2 are highly uncertain as this is very difficult to quantify under field conditions and the ratio between N2O and N2 emission can vary greatly [35]. Models by IPCC and Angelidis predicted NH3 as the major N loss pathway, and Angelidis suggests denitrification and leaching losses to be of a similar magnitude.

4.4. Potential Effect of Management Periods and Forage Type on N Loss Calculations

Across the different management periods (housing and grazing), total denitrification losses estimated by Angelidis were consistently lower compared to IPCC 2019, although N2O emissions were slightly higher during the housing periods. During grazing, urine deposits to the pasture account for nearly 90% of total NH3 emissions since most of the ammoniacal N comes from urea [36]. Predicting urinary N excretion (as compared to just total N excretion) will have an important influence on the NH3 emissions estimates, potentially offering a more accurate prediction (although this is yet to be validated on the NWFP). While the IPCC methods estimate greater total N loss across all periods, they also give a difference in the relative N loss for each period compared to total loss across all periods. For the IPCC methods, total N loss increases from housing period 1, through the grazing period and then is highest from housing period 2. However, the Angelidis and Reed methods show a proportionally lower loss during the grazing period (being lower than either of the housing periods).
Considering the impact of the forage diet on the NWFP, IPCC 2019 showed similar estimates of NH3 losses among the treatments, whereas Angelidis predicted lower NH3 losses for the WC and the highest for the PP system. The IPCC methods suggest greater N losses from PP but no significant difference between WC and HS. However, with the more detailed approaches using country-specific parameters, WC does have marginally (but significantly) lower total N losses than HS. This is likely because the lowest dietary N concentration was found on the WC system, something that resulted in lower UNO and FNO compared to the PP system. Furthermore, legume-based forages have the potential to increase N use efficiency when fed to ruminants [37], although, in the present study, the effect is a result of the CP content of the diets rather than the effect of legumes per se. Differences observed between estimates of N losses when prediction method and gender were considered together were minimal.

4.5. Implications of N Loss Prediction Methods

The outcomes of the present study have highlighted the importance of accurate country-specific emission estimation methods when modelling the sustainability of pasture-based beef finishing systems. Under- or over-estimating N excretion and emissions may pose a threat in terms of the predicted environmental sustainability of the production system, impacting on policy decisions, methods, and costs of production with potential wider consequences. The use of more accurate (and verified) N excretion models, including the partitioning of N to urine and faeces, which is difficult to conduct on pasture-based systems, emission factors, and parameters for subsequent N losses reflecting system- and country-specific conditions will ensure a more robust understanding from which strategies or policies aimed at reducing environmental impact can be developed. Using less detailed estimation methods, with default or generic parameters, may lead to unrealistic assumptions regarding potential emission reductions (e.g., the much greater total N loss estimates from using the IPCC methods) or suggestions of specific N-loss pathways or parts of the system to target (e.g., the apparently high NH3 emissions at grazing from the IPCC methods). However, as there was no direct validation of any approach in this study, that would be recommended prior to the adoption of a given approach.

5. Conclusions

This study used four different approaches to estimate N excretion and subsequent N losses through NH3 and N2O emissions, denitrification, and leaching in three pasture-based beef-cattle production systems. Predicted N losses were greater using the IPCC 2006 or 2019 guideline approaches compared to using two more detailed country-specific approaches. Differences may be because IPCC equations do not account for the partitioning of N in faeces and urine and/or because they rely on default values that are scalar multipliers of the total animal bodyweight to predict N excretion, and they were mostly consistent across the different production periods, forage types, and gender. Strategies and policies to develop more sustainable pasture-based beef production systems by minimising losses of reactive N to the environment require accurate and robust estimates of the total N losses, and of the different forms of N loss across different parts of the production system to ensure appropriate targeting of interventions and more realistic estimates of environmental impacts (e.g., climate impacts and acidification). Given the substantial differences that published equations may have in predicting N losses at system level, future studies should externally validate the available models and, where necessary, further develop algorithms for accurate N loss estimation. In addition, methods for the collection and collation of necessary data (or proxies) to feed such models and embed them as appropriate into farm-scale calculators and national-scale inventories require further development.

Author Contributions

Conceptualization, A.E.A., S.S. and T.M.; Data curation, A.E.A., G.A.M., T.T., S.S. and T.M.; Formal analysis, A.E.A., G.A.M. and T.T.; Funding acquisition, S.S. and T.M.; Investigation, A.E.A., G.A.M. and T.T.; Methodology, A.E.A., G.A.M., T.T., S.S. and T.M.; Project administration, S.S. and T.M.; Resources, S.S. and T.M.; Supervision, L.C., T.Y., S.S. and T.M.; Visualization, A.E.A.; Writing—original draft, A.E.A. and S.S.; Writing—review & editing, A.E.A., G.A.M., T.T., L.C., T.Y., C.K.R., S.S. and T.M. All authors have read and agreed to the published version of the manuscript.

Funding

The authors would like to acknowledge funding support from the University of Reading, Rothamsted Research, and UK Biotechnology and Biological Sciences Research Council (BBS/E/C/000I0320). The NWFP is a UK National Capability, also supported by the Biotechnology and Biological Sciences Research Council (BBS/E/C/000J0100).

Institutional Review Board Statement

Not applicable.

Informed Consent Statement

Not applicable.

Data Availability Statement

Data used in this study were sourced from the Open Access North Wyke Farm Platform Data Portal: https://nwfp.rothamsted.ac.uk/ (accessed on 7 March 2022).

Conflicts of Interest

The authors declare no conflict of interest.

References

  1. FAO. How to Feed the World in 2050, High-Level Expert Forum; Food and Agriculture Organization of the United Nations (FAO): Rome, Italy, 2009; p. 35. [Google Scholar]
  2. Thornton, P.K. Livestock production: Recent trends, future prospects. Philos. Trans. R. Soc. Lond. B Biol. Sci. 2010, 365, 2853–2867. [Google Scholar] [CrossRef] [PubMed] [Green Version]
  3. Leroy, F.; Beal, T.; Gregorini, P.; McAuliffe, G.A.; van Vliet, S. Nutritionism in a food policy context: The case of “animal protein”. Anim. Prod. Sci. 2022, 62, 712–720. [Google Scholar] [CrossRef]
  4. Eisler, M.C.; Lee, M.R.F.; Tarlton, J.F.; Martin, G.B.; Beddington, J.; Dungait, J.A.J.; Greathead, H.; Liu, J.; Mathew, S.; Miller, H.; et al. Agriculture: Steps to sustainable livestock. Nature 2014, 507, 32–34. [Google Scholar] [CrossRef] [PubMed] [Green Version]
  5. Baber, J.R.; Sawyer, J.; Wickersham, T.A. Estimation of human-edible protein conversion efficiency, net protein contribution, and enteric methane production from beef production in the United States. Transl. Anim. Sci. 2018, 2, 439–450. [Google Scholar] [CrossRef] [Green Version]
  6. Wilkinson, J.M. Re-defining efficiency of feed use by livestock. Animal 2011, 5, 1014–1022. [Google Scholar] [CrossRef] [Green Version]
  7. Koenig, K.M.; Beauchemin, K.A. Nitrogen metabolism and route of excretion in beef feedlot cattle fed barley-based finishing diets varying in protein concentration and rumen degradability. J. Anim. Sci. 2013, 91, 2310–2320. [Google Scholar] [CrossRef]
  8. Satter, L.D.; Klopfenstein, T.J.; Erickson, G.E. The role of nutrition in reducing nutrient output from ruminants. J. Anim. Sci. 2002, 80 (Suppl. S2), E143–E156. [Google Scholar] [CrossRef] [Green Version]
  9. Steinfeld, H.; Gerber, P.; Wassenaar, T.; Castel, V.; Rosales, M.; de Haan, C. Livestock’s Long Shadow: Environmental Issues and Options; Food and Agriculture Organization of the United Nations (FAO): Rome, Italy, 2006; 390p. [Google Scholar]
  10. Cole, N.A.; Clark, R.N.; Todd, R.W.; Richardson, C.R.; Gueye, A.; Greene, L.W.; McBride, K. Influence of dietary crude protein concentration and source on potential ammonia emissions from beef cattle manure. J. Anim. Sci. 2005, 83, 722–731. [Google Scholar] [CrossRef] [Green Version]
  11. Koenig, K.M.; Beauchemin, K.A. Nitrogen metabolism and route of excretion in beef feedlot cattle fed barley-based backgrounding diets varying in protein concentration and rumen degradability. J. Anim. Sci. 2013, 91, 2295–2309. [Google Scholar] [CrossRef]
  12. Angelidis, A.; Crompton, L.; Misselbrook, T.; Yan, T.; Reynolds, C.; Stergiadis, S. Evaluation and prediction of nitrogen use efficiency and outputs in faeces and urine in beef cattle. Agric. Ecosyst. Environ. 2019, 280, 1–15. [Google Scholar] [CrossRef]
  13. Angelidis, A.E.; Crompton, L.; Misselbrook, T.; Yan, T.; Reynolds, C.K.; Stergiadis, S. Equations to predict nitrogen outputs in manure, urine and faeces from beef cattle fed diets with contrasting crude protein concentration. J. Environ. Manag. 2021, 295, 113074. [Google Scholar] [CrossRef] [PubMed]
  14. Hristov, A.N.; Hanigan, M.; Cole, A.; Todd, R.; McAllister, T.A.; Ndegwa, P.M.; Rotz, A. Review: Ammonia emissions from dairy farms and beef feedlots. Can. J. Anim. Sci. 2011, 91, 1–35. [Google Scholar] [CrossRef] [Green Version]
  15. Tamminga, S. Environmental impacts of beef cattle. In Proceedings of the John M. Airy Symposium: Visions for Animal Agriculture and the Environment, Kansas, MO, USA, 5–6 January 2006. [Google Scholar]
  16. NASEM. Anatomy, digestion and nutrient utilization. In Nutrient Requirements of Beef Cattle: Eighth Revised Edition; The National Academies Press: Washington, DC, USA, 2016. [Google Scholar]
  17. Galloway, J.N.; Aber, J.D.; Erisman, J.W.; Seitzinger, S.P.; Howarth, R.W.; Cowling, E.B.; Cosby, B.J. The nitrogen cascade. BioScience 2003, 53, 341–356. [Google Scholar] [CrossRef]
  18. Muck, R.; Steenhuis, T. Nitrogen losses from manure storages. Agric. Wastes 1982, 4, 41–54. [Google Scholar] [CrossRef]
  19. IPCC. Emissions from livestock and manure management. In IPCC Guidelines for National Greenhouse Gas Inventories, Volume 4: Agriculture, Forestry and Other Land Use; Intergovernmental Panel on Climate Change: Geneva, Switzerland, 2006. [Google Scholar]
  20. IPCC. Emissions from livestock and manure management. In Refinement to the 2006 IPCC Guidelines for National Greenhouse Gas Inventories; Intergovernmental Panel on Climate Change: Geneva, Switzerland, 2019. [Google Scholar]
  21. Brown, P.; Cardenas, L.; Choudrie, S.; Del Vento, S.; Karagianni, E.; MacCarthy, J.; Mullen, P.; Passant, N.; Richmond, B.; Smith, H.; et al. UK Greenhouse Gas Inventory, 1990 to 2019. 2021. Available online: https://uk-air.defra.gov.uk/assets/documents/reports/cat09/2105061125_ukghgi-90-19_Main_Issue_1.pdf (accessed on 7 March 2022).
  22. Reed, K.F.; Casper, D.P.; France, J.; Kebreab, E. Prediction of nitrogen efficiency in dairy cattle: A review. CAB Rev. 2015, 10, 1–12. [Google Scholar] [CrossRef]
  23. Dijkstra, J.; Oenema, O.; Van Groenigen, J.; Spek, J.; van Vuuren, A.; Bannink, A. Diet effects on urine composition of cattle and N2O emissions. Animal 2013, 7 (Suppl. S2), 292–302. [Google Scholar] [CrossRef] [Green Version]
  24. Orr, R.J.; Murray, P.J.; Eyles, C.J.; Blackwell, M.; Cardenas, L.M.; Collins, A.; Dungait, J.; Goulding, K.; Griffith, B.A.; Gurr, S.J.; et al. The North Wyke Farm Platform: Effect of temperate grassland farming systems on soil moisture contents, runoff and associated water quality dynamics. Eur. J. Soil Sci. 2016, 67, 374–385. [Google Scholar] [CrossRef] [Green Version]
  25. McAuliffe, G.; Takahashi, T.; Orr, R.; Harris, P.; Lee, M. Distributions of emissions intensity for individual beef cattle reared on pasture-based production systems. J. Clean. Prod. 2018, 171, 1672–1680. [Google Scholar] [CrossRef]
  26. McAuliffe, G.; López-Aizpún, M.; Blackwell, M.; Castellano-Hinojosa, A.; Darch, T.; Evans, J.; Horrocks, C.; Le Cocq, K.; Takahashi, T.; Harris, P.; et al. Elucidating three-way interactions between soil, pasture and animals that regulate nitrous oxide emissions from temperate grazing systems. Agric. Ecosyst. Environ. 2020, 300, 106978. [Google Scholar] [CrossRef]
  27. Reed, K.; de Moraes, L.E.F.D.; Casper, D.; Kebreab, E. Predicting nitrogen excretion from cattle. J. Dairy Sci. 2015, 98, 3025–3035. [Google Scholar] [CrossRef]
  28. Churchill, S.; Misra, A.; Brown, P.; Del Vento, S.; Karagianni, E.; Murrells, T.; Passant, N.; Richardson, J.; Richmond, B.; Smith, H.; et al. UK Informative Inventory Report (1990 to 2019). 2021. Available online: https://uk-air.defra.gov.uk/library/reports?report_id=1016 (accessed on 7 March 2022).
  29. Gilmour, A.R.; Thompson, R.; Cullis, B.R. Average Information REML: An Efficient Algorithm for Variance Parameter Estimation in Linear Mixed Models. Biometrics 1995, 51, 1440–1450. [Google Scholar] [CrossRef]
  30. VSN International. Genstat for Windows, 17th ed.; VSN International: Hemel Hempstead, UK, 2015. [Google Scholar]
  31. Kebreab, E.; Strathe, A.B.; Dijkstra, J.; Mills, J.A.N.; Reynolds, C.K.; Crompton, L.A.; Yan, T.; France, J. Energy and protein interactions and their effect on nitrogen excretion in dairy cows. In Proceedings of the 3rd EAAP International Symposium on Energy and Protein Metabolism and Nutrition, Parma, Italy, 6–10 September 2010; pp. 417–426. [Google Scholar]
  32. Selbie, D.R.; Buckthought, L.E.; Shepherd, M.A. The Challenge of the Urine Patch for Managing Nitrogen in Grazed Pasture Systems. In Advances in Agronomy; Sparks, D.L., Ed.; Academic Press: Cambridge, MA, USA, 2015; Chapter 4; pp. 229–292. [Google Scholar]
  33. Loick, N.; Dixon, E.; Abalos, D.; Vallejo, A.; Matthews, P.; McGeough, K.; Watson, C.; Baggs, E.M.; Cardenas, L.M. “Hot spots” of N and C impact nitric oxide, nitrous oxide and nitrogen gas emissions from a UK grassland soil. Geoderma 2017, 305, 336–345. [Google Scholar] [CrossRef] [PubMed]
  34. Rotz, C.A.; Soder, K.J.; Skinner, R.H.; Dell, C.J.; Kleinman, P.J.; Schmidt, J.P.; Bryant, R.B. Grazing can reduce the environmental impact of dairy production systems. Forage Grazinglands 2009, 7, 1–9. [Google Scholar] [CrossRef]
  35. Chen, T.; Oenema, O.; Li, J.; Misselbrook, T.; Dong, W.; Qin, S.; Yuan, H.; Li, X.; Hu, C. Seasonal variations in N2 and N2O emissions from a wheat–maize cropping system. Biol. Fertil. Soils 2019, 55, 539–551. [Google Scholar] [CrossRef]
  36. Rotz, C.A. Management to reduce nitrogen losses in animal production. J. Anim. Sci. 2004, 82 (Suppl. S13), E119–E137. [Google Scholar]
  37. Marley, C.L.; Fychan, R.; Fraser, M.D.; Sanderson, R.; Jones, R. REffects of feeding different ensiled forages on the productivity and nutrient-use efficiency of finishing lambs. Grass Forage Sci. 2007, 62, 1–12. [Google Scholar] [CrossRef]
Figure 1. Graphic representation of the North Wyke Farm Platform system inputs and nitrogen (N) losses. Nex; N excretion, Nret; N retention, LWG; Liveweight gain, FYM; Farmyard manure.
Sustainability 14 07260 g001
Figure 2. Bar charts showing the differences between predicted N excretion (Nex; p < 0.001), N excretions in urine (NexU; p < 0.001) and faeces (NexF; p < 0.001), ammonia (NH3; p < 0.001), nitrous oxide (N2O; p < 0.001) and N losses (Nlos; p < 0.001), for the approaches of Angelidis, Reed, IPCC 2006, IPCC 2019, and the experimental period. Error bars represent standard error of means. p represents the p-value for the interaction. Means with different letters are significantly different according to Fisher’s Least Significant Difference test (p < 0.05). g/d = grams per day.
Sustainability 14 07260 g002
Figure 3. Bar charts showing differences between predicted N excretion (Nex; p < 0.001), ammonia (NH3; p = 0.033), nitrous oxide (N2O; p < 0.001), and N losses (Nlos; p = 0.037), for the approaches of Angelidis, Reed, IPCC 2006, IPCC 2019 and the animal gender. Error bars represent standard error of means. p represents the p-value for the interaction. Means with different letters are significantly different according to Fisher’s least significant difference test (p < 0.05). g/d = grams per day.
Sustainability 14 07260 g003
Figure 4. Comparison of the differences between predicted N losses (Nlos), for the approaches of Angelidis, Reed, IPCC 2006, IPCC 2019 and (i) the experimental period (p < 0.001), (ii) animal gender (p = 0.037) and (iii) pasture type (p = 0.01). Error bars represent standard error of means. p represents the p-value for the interaction. Means with different letters are significantly different according to Fisher’s Least Significant Difference test (p < 0.05). g/d = grams per day.
Sustainability 14 07260 g004
Table 1. Literature equations used for the prediction of N excretion in urine and manure.
EquationSource
a.UNO = 14.3(3.18) + 0.510(0.0121) NIEquation (9); Reed et al., 2015 [27]
b.MNO = 15.1(2.50) + 0.828(0.0106) NIEquation (13); Reed et al., 2015 [27]
c.UNO = –26.49(3.117) + 0.597(0.0158) NIEquation (2e); Angelidis et al., 2019 [12]
d.MNO = –5.681(3.1652) + 0.761(0.0157) NIEquation (1d); Angelidis et al., 2019 [12]
UNO = urine nitrogen output, NI = nitrogen intake, MN = total manure nitrogen output.
Table 2. Total, urine and faecal N excretion, and subsequent losses of N through volatilisation (NH3), denitrification (N2O, NO, N2) and leaching, using four different prediction approaches.
ParameterMean 1
Angelidis et al.Reed et al.IPCC 2006IPCC 2019SEp-Value
Nex (g/d)188.6 c196.1 b210.9 a210.9 a14.70<0.001
NexU (g/d)125.3115.6--8.100<0.001
NexF (g/d)62.7479.91--3.530<0.001
NH3-N (g/d)30.55 c28.05 d71.01 a69.77 b4.020<0.001
NH3-N (%Nex)18.24 c16.48 d37.49 a36.55 b0.110<0.001
NH3-N (kg/kg lwg)0.076 b0.070 b0.154 a0.149 a0.021<0.001
N2O-N (g/d)3.290 c3.330 c4.790 a3.760 b0.260<0.001
N2O-N (%Nex)1.989 c1.960 d2.279 a2.028 b0.014<0.001
N2O-N (kg/kg lwg)0.0110.0110.0120.0110.0020.800
Nlos (g/d)59.49 c58.02 c140.3 a123.1 b7.080<0.001
Nlos (%Nex)34.27 c32.51 d71.42 a62.66 b0.400<0.001
Nlos (kg/kg lwg)0.116 b0.113 b0.240 a0.210 a0.030<0.001
NH3-Nhg (g/d)14.81 c13.80 d36.35 a34.49 b1.820<0.001
N2O-Nhg (g/d)1.460 b1.470 b2.360 a0.960 c0.100<0.001
NO-Nhg (g/d)0.310 a0.310 a0.000 b0.000 b0.010<0.001
N2O-Nhgv (g/d)0.150 c0.140 d0.360 a0.340 b0.020<0.001
Nglea (g/d)8.600 c9.040 c28.92 a23.18 b1.240<0.001
N2O-Nglea (g/d)0.060 c0.070 c0.220 b0.250 a0.010<0.001
N2-Nhg (kg/d)4.360 b4.400 b5.110 a1.730 c0.330<0.001
1 The means of the presented parameters are the predicted means obtained from the fitted mixed linear model. Means, within rows, with different letters are significantly different according to Fisher’s least significant difference test (p < 0.05). g/d = grams per day.
Publisher’s Note: MDPI stays neutral with regard to jurisdictional claims in published maps and institutional affiliations.

