Article

Metrology Process to Produce High-Value Components and Reduce Waste for the Fourth Industrial Revolution

1
Department of Computer Science, CECOS University of IT and Emerging Science, Peshawar 25000, Pakistan
2
Mechanical, Biomedical and Design Engineering, Aston University, Birmingham B4 7ET, UK
3
Department of Computer Science, Peshawar University, Peshawar 25000, Pakistan
4
Mechanical Engineering Department, College of Engineering, University of Bahrain, Sakhir 32038, Bahrain
5
Department of Electrical Engineering, College of Engineering, TAIF University, P.O. Box 11099, Taif 21944, Saudi Arabia
6
Department of Nanotechnology & Advanced Materials Engineering, Sejong University, Seoul 05006, Korea
7
Department of Industrial Engineering, University of Engineering & Technology, Peshawar 25000, Pakistan
*
Author to whom correspondence should be addressed.
Sustainability 2022, 14(12), 7472; https://doi.org/10.3390/su14127472
Submission received: 29 March 2022 / Revised: 23 May 2022 / Accepted: 9 June 2022 / Published: 19 June 2022

Abstract

:
Conventionally, a manufactured product undergoes a quality control process. The quality control department mostly ensures that the dimensions of the manufactured products are within the desired range, i.e., the product either satisfies the defined conformity range or is rejected. Failing to satisfy the conformity range increases the manufacturing cost and harms the production rate and the environment. Conventional quality control departments take samples from the given batch after the manufacturing process. This, in turn, has two consequences, i.e., low-quality components being delivered to the customer and input energy being wasted in the rejected components. The aim of this paper is to create a high-precision measuring (metrology)-based system that measures the dimension of an object in real time during the machining process. This is accomplished by integrating a vision-based system with image processing techniques in the manufacturing process. Experiments were planned using an experimental design which included different lightning conditions, camera locations, and revolutions per minute (rpm) values. Using the proposed technique, submillimeter dimensional accuracy was achieved at all the measured points of the component in real time. Manual validation and statistical analysis were performed to check the validity of the system.

1. Introduction

The Fourth Industrial Revolution (Industry 4.0) brought about changes in the manufacturing techniques and processes to achieve the highest quality of products. To meet this challenging situation, innovation and implementation of new technologies for quality control are essential for industrial sectors [1]. Manufacturing methods and processes are changing rapidly due to the ever-demanding situation of industries producing quality products. Product quality is a major concern, especially in the manufacturing of high-value components. Manufacturing errors are not affordable in many industrial sectors, such as automotive, aerospace, medical science, and large research and development facilities [2]. An error in the dimensions during manufacturing can translate into much larger problems. Cost requirements and design quality are two major factors in the manufacturing of high-value components [3]. The quality control phase in the manufacturing process is the next-most important phase, which defines the cost of the overall manufacturing process [4]. Different standards were considered for assuring the quality of production, which helps filter out flaws in the manufacturing process. In addition, the geometry of the designed component is precisely measured once it is manufactured [5]. Control over quality in manufacturing is an extremely important feature, as it can reduce the cost of manufacturing significantly [6]. Different types of sensors are used to ensure real-time monitoring of the products and detect possible defects during the manufacturing phase [7]. Metrology is the measurement of any defects or deformities in a designed product that are incurred during the manufacturing process [8]. Different instruments and metrology process such as in situ metrology, in-line metrology, and in-process metrology are used to achieve more efficiency as compared to a traditional setup [9]. Various contact and non-contact measuring techniques that can be employed to inspect the geometry and dimensions of a workpiece during manufacturing are discussed in [10].
Vision-based inspection is gaining popularity and is also widely used in many industrial applications, including inspection, identification of parts, control, and guidance [11]. The placement of the workpiece, selection of sensors, and lighting conditions play a vital role in increasing flexibility, reliability, and productivity and can be incorporated with an image-processing algorithm to observe the minor details of manufacturing and detect flaws [12]. Machine-vision-based algorithms are used for improving the quality of the manufacturing process [13]. Moreover, a machine-vision-based algorithm can be used to determine the quality of metal containers [14]—controlling the quality by filtering out defective pieces [15]—by detecting scratches and burns, and by inspecting various equipment [16,17].
Automated visual inspection provides a good solution for filtering out the best-designed products from the ones which do not meet the design criteria [18]. One of the most basic steps in automated visual inspection is the image acquisition used in the semiconductor industry [19]: inspection of thermal fuses and detection of cracks in bridges [20].
To assess the workpiece’s properties from the machined surface to the bulk material and guide the following processes, an automatic and accurate microhardness profile measurement method using image-processing technologies was proposed [21]. On the basis of machine vision, a method of measuring thread dimensions to implement non-contact, rapid, accurate measurements was proposed. The measurement samples were metric threads, and the images of thread profiles were obtained with a backlight during the measurement process [22]. A vision-based and high-precision method was used to measure shaft diameter for components produced on a lathe. The difference achieved in the results was up to ±0.03 mm. The study measures shaft diameter under static conditions and not during the process [23].
Although modern equipment such as CNC machines has provided the facility of manufacturing in less time and with great accuracy [24], when mass production is involved, quality becomes an issue when employing a conventional quality control operation [25]. A small change in dimensions during the manufacturing phase can contribute to huge losses. Therefore, in-process measurement of the dimensional parameters can save a lot of effort and time for the manufacturers [26,27].This process can be made more efficient by carrying out the metrology-based inspection as close to the production line as possible.
Surface metrology can prove to be very important in cases where cutting operation is performed for surfaces and can provide much-needed directions for the manufacturing machinery to make the workpiece as accurate as possible [28]. In [29], Jianming et al. presented vision-based detection of a cylindrical object that measures the diameter of a small cylindrical object using only one camera with high precision. Although the precision achieved was up to 0.08%, it was not achieved during the machining process. Using a non-contact, high-precision method for measuring the diameter of a shaft based on digital image processing to optimize the camera model, the camera was calibrated using feature points in the image’s measurement area. The authors proposed a shaft diameter measurement method based on the model’s parameters. Despite the fact that the average measurement error was only 0.005 mm, the measurement was performed on a pre-machined shaft under static conditions rather than on a lathe [30]. The diameter of a turned workpiece with curvatures was measured using a modified triangular laser displacement sensor. To ensure high accuracy, the parallelism between the workpiece axis and the travel of the laser sensor was required to be within 1.5 m, adding complexity to the experimental setup [31]. A machine-vision-based in-line inspection method was developed for roundness error that includes a camera, work holding tools, lighting, and image processing software. The measurement was performed without any machining operation [32]. Liu et al. [33] proposed a technique which uses a line-structured laser and a camera to measure shaft diameters. The image of the shaft’s line stripe was projected onto the virtual plane. The camera parameters should be precisely calibrated for this method.
A number of researchers used full and fractional factorial DOE methods in their studies, so it is critical to choose the appropriate design from which experimental runs will be determined in order to obtain the required results. The design of experiments (DOE) method is a systematic method for determining the relationship between factors influencing a process and its output [34]. The DOE method can be divided in full factorial design (FFD) and fractional factorial design, known also as Taguchi experimental design (TED) [35,36]. In FFD design, all combinations of the parameter levels are tested in order to analyze the results. Sheth and George recognized that spindle speed, feed rate, and their interactions have a significant impact on cylindricity. They concluded that cylindricity is minimal at lower spindle speeds [37]. The Taguchi optimization method is used to optimize the fused filament fabrication process’s parameters to improve shape deviations such as the cylindricity and circularity of 3D printed parts. As variable parameters for experiments on cylindricity and circularity, the effects of thickness, infill pattern, number of walls, and layer height were investigated [38]. The effects of various operational parameters on surface roughness have been investigated, including abrasive mass flow rate, traverse speed, and nozzle standoff distance [39]. The design of experiment is used to investigate the performance of the proposed process [40].
The aim of this paper is to develop a high-precision measuring (metrology)-based system during the machining process which measures the dimensions of the object in real time for different input parameters (DOE). This is achieved by combining a vision-based system with image processing techniques during the manufacturing process. This study develops the technology for implementing real-time in-process measurement for quality control during the manufacturing process. The proposed system measures the difference at submillimeter ranges for all designs of the experiment (DOE). This research paper illustrates two important facts: first, the accuracy of the proposed system; secondly, the results demonstrate submillimeter accuracy for a cluster of data points of the workpiece for the respective DOE in real time. This technology bridges the gap between the manufacturing process and real-time quality control (metrology) inspection, as shown in Figure 1.

2. Methodology

In this paper, the diameter of the cylindrical shape is measured under different environmental conditions. The experimental setup includes the CNC machine, a machine vision system, a light source, a workpiece, and the calibrated object. Different parameters are considered to analyze the proposed process measurement system (distance between the workpiece and the camera, distance between the workpiece and the light source, and revolutions per minute of the CNC machine). All these parameters and their dimensional results are acquired as per the design of experiment (DOE) and validated through manual measurements (Vernier caliper) and statistical data analysis.

2.1. Design of Experiment

The design of experiment is applied to the finalized parameters from the research gap [41]. The three-level full factorial design is used in this study for experiment design. In a 3k factorial design, k factors are considered at three levels each. The three-level designs were proposed to handle the case of nominal factors at three levels. The first parameter chosen was distance between the work piece and the camera because image pixel resolution is critical when measuring objects with vision-based technology. As a result, various distance values were set, such as 29.9 cm, 35 cm, and 45 cm, in order to test their impact on the final result of the proposed system depicted in Table 1. The readings were taken and measured in real time while the workpiece was being machined. Therefore, in order to protect the equipment—specifically the camera lens—from machining particles, the minimum distance between the camera lens and the workpiece was set to 29.9 cm for the given experiment, as shown in Table 1.
The distance between the work piece and the light source was chosen as the experiment’s second parameter to increase the pixel intensity level of the target and calibrated object in the image. Therefore, different light intensities were deployed at different angles with respect to the workpiece, which increases the brightness, visibility of the workpiece and calibrated object. In CNC, lathe-turning is a machining operation in which the workpiece rotates at high speeds while a fixed cutting tool removes material [42]; therefore, revolutions per minute (rpm) of the machine was selected as the third parameter for design of experiment. The speed range was set between 40 and 110 rpm to examine the effect of lower and higher rpm rates on the accuracy of the result shown in Table 1. The three-level full factorial design is given as:
Runs of Experiment = Ln
where
L is the number of levels = 3
n is the number of factors (parameters) = 3, listed below. The factors used in the current study are as follows.
Revolutions per minute (RPM) of the machine.
Distance between the work piece and the camera.
Distance between the work piece and the light source.
Twenty-seven different experiments are performed, as per DOE, and are shown in Table 1.

2.2. Experimental Setup

For executing in-process measurement through the proposed method, an experimental setup was installed which included equipment such as a workpiece used as the target object, a calibrated object, a digital Vernier caliper, a CNC machine, a high-definition camera with a tripod, and light sources, shown in Figure 2.
In Figure 2, an experimental setup in which “A” is the camera, “B” is light source 1, “C” is the light source 2, “D” is the workpiece, “E” is the calibrated object, “F” is light source 3, and “G” is the CNC machine is shown. The complete details of the equipment used are shown in Table 2.

2.3. Machining Operation

The work piece is fixed in the CNC machine chuck and the machine vision system for in-process metrology is set up. For machining operation (turning process), the GM codes are generated through power mill, and the depth of cut is set to 2 mm. Once the calibration process for the camera is completed, the CNC machine is turned on and the machining operation is performed on the workpiece.

2.4. Camera Calibration

Before performing the measurement process (metrology), the camera is calibrated to eliminate lens distortion. The intrinsic and extrinsic parameters of the camera are adjusted to remove lens distortion effects from an image. An asymmetric checkerboard is used as a calibration pattern. Around 40 pattern images from different angles are taken for accurate calibration.

2.5. Data Acquisition

Images are acquired from the camera in the first stage of data acquisition. As shown in Figure 3, A, B, C, D are set as the target object’s measuring points with respect to the calibrated object’s E, F points. For extracting the workpiece and the reference calibrated object from the image f(x,y), the ground truth data are used, and image segmentation is performed. The segmentation process splits the image into different segments, making it easier to analyze the objects using the details in the pixels. The image f(x,y) is binarized using Otsu’s auto-thresholding method. This method determines the best threshold for minimizing the intraclass variance of binarized black and white pixels that separate the objects and the background pixels. In this method, different intensity values are grouped into two dominant modes. Then, any pixel (x,y) in the image at which f(x,y) > T is set as the object pixel; otherwise, the pixel is related to the background. The segmented image, g(x,y), is given by the following equation [43]:
g ( x , y ) = { 1   i f   f ( x , y ) > T 0   i f   f ( x , y ) T
where T is a constant applicable over an entire image.
Both the workpiece and reference objects were identified separately using the labeling operation on the binarized image g(x,y) shown in Figure 4. The location of the centroids for both objects in the image were identified using blob analysis provided by the Computer Vision Toolbox in MATLAB. The block of blob analysis gives the centroid coordinates of a matrix. The center of mass for a binary image is the binary object’s average x and y positions.
The obtained parameters are then validated with a digital Vernier caliper. The flow chart of the proposed in-process measurement system is shown in Figure 5.

2.6. Manual Measurement

The validation of results is obtained with a digital Vernier caliper. The diameter of the workpiece and the calibrated object are measured as 37.48 mm and 36.6 mm, respectively shown in Figure 6. The readings are taken at different points on the workpiece, and the average values are obtained. These values are used as nominal values to verify the in-process measurement system. The values of the computed diameter at different points on the workpiece after machining operation are found in the range of 33.43 mm to 33.53 mm. The average value of 33.48 mm is selected as a reference value to evaluate the in-process measurement system.

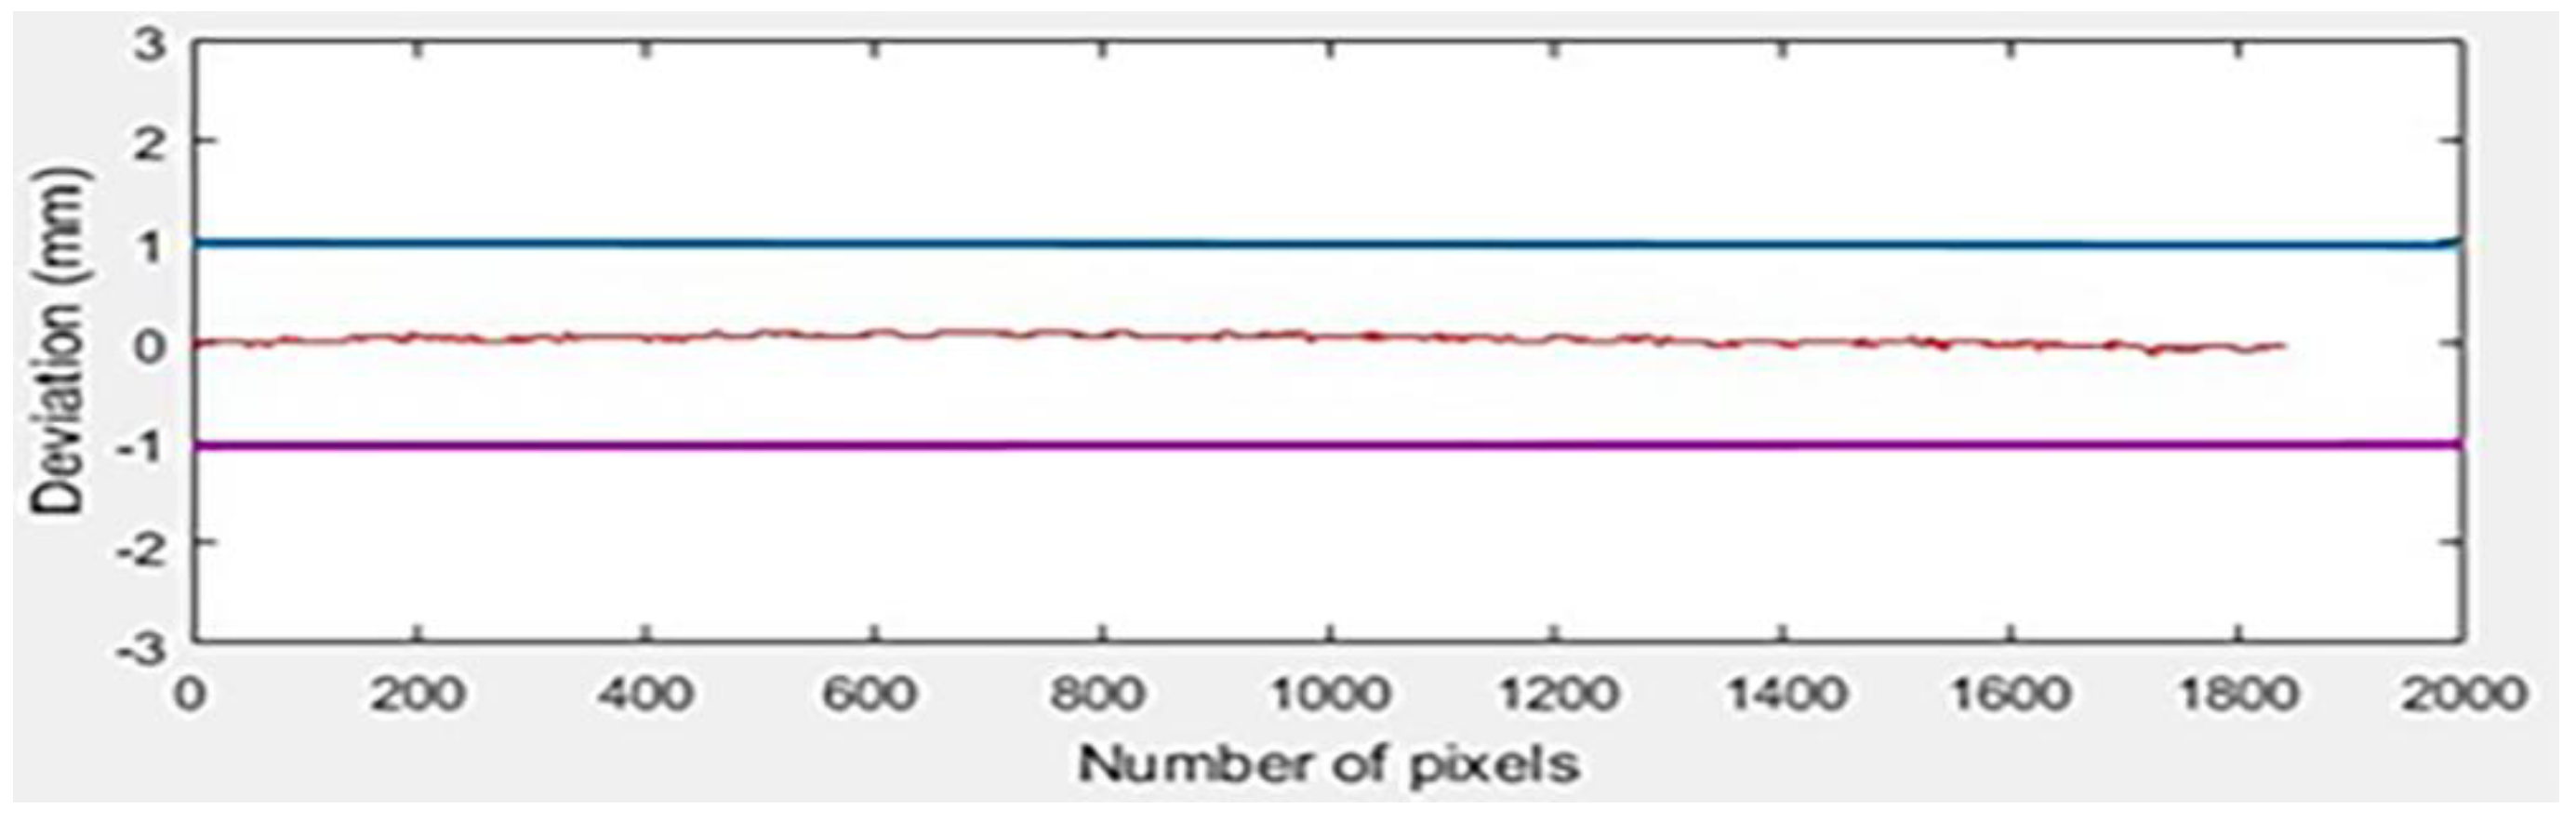
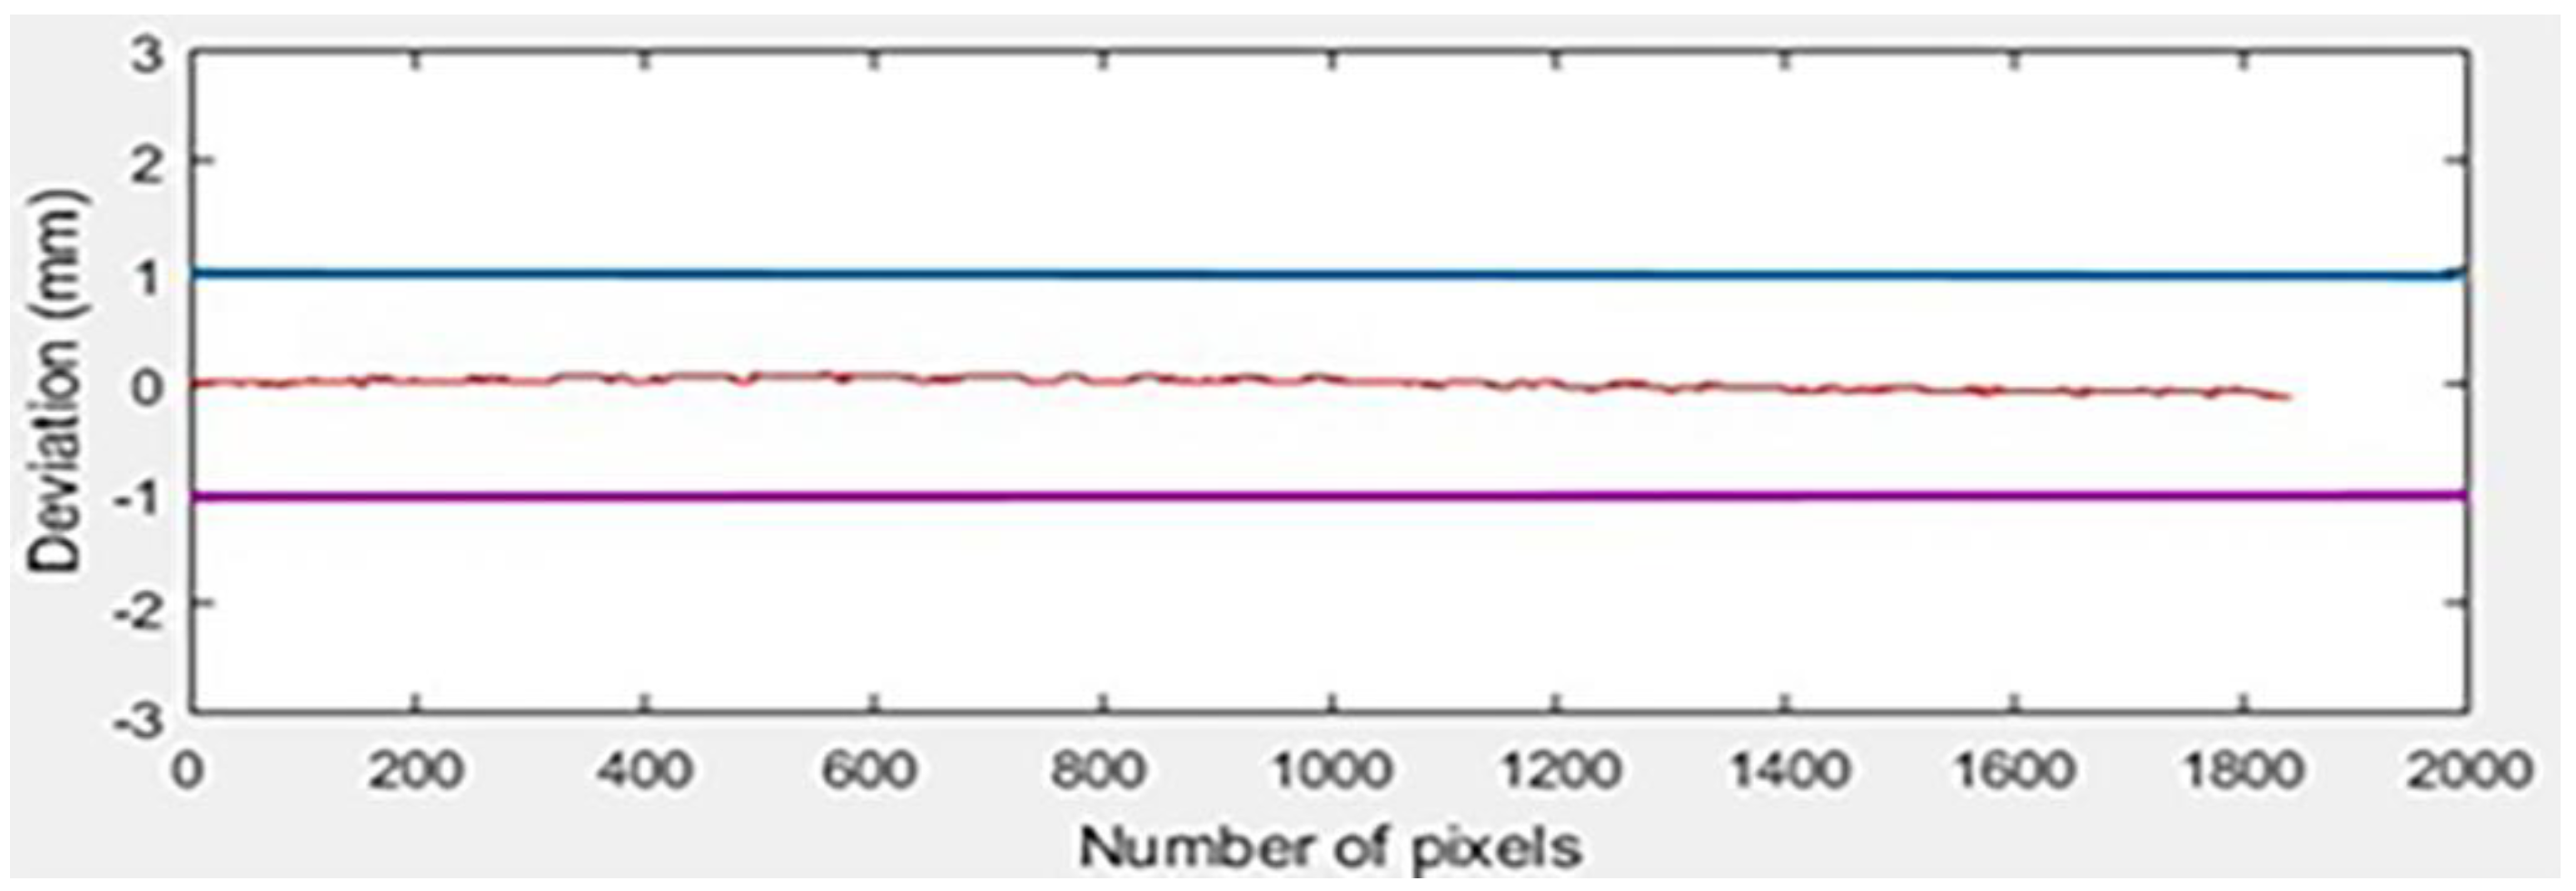
3. Metrology Results

In the experiment, a calibrated object is used as a reference object to ensure the accuracy of the measured values. The target and calibrated objects were both placed the same distance from the camera, ensuring that their pixel measurements were identical. The dimension (diameter) of the workpiece is estimated in real time at multiple points using vision and image-processing technologies.
A cylindrical-shaped workpiece with a diameter of 37.48 mm is selected for the experimental trials. The turning operation reduced the thickness of the workpiece by up to 4 mm. Based on the given data, after one complete machining operation, the measured diameter at different points of the workpiece is found in the range of 33.43 mm to 33.53 mm. The average value of 33.48 mm is taken and set as actual value for real-time metrology operation. The system measures the diameter of the workpiece from points A, B to C, D using reference values from points E and F of the calibrated object in the binary image, as shown in Figure 6. The calibrated object’s reading is taken very precisely because the output is based on the reference object. As the values are measured with the reference calibrate object, so the system achieves accuracy at the submillimeter level at thousands of points of the workpiece. The deviation is calculated using the following equation:
Deviation Value = Original Value − Computed Value

Graph Results Discussion

Twenty-seven experiments were performed as stated in the DOE using the defined parameters. Figure 7, Figure 8 and Figure 9 show three results, out of twenty-seven experiments, in which the distance between the camera and the workpiece was set to its maximum value, i.e., 45 cm, against the different lightning and rpm values. The graph is established between the deviation values against the number of pixels for each experiment respectively. Total of 1800 observations are studied. It is observed that each measured value lies close to the reference value of 33.48 mm at all points against the specific pixel. The variation in the graph shows that the error generated either falls closer to zero or produces (positive and negative) deviation around the reference value zero. It can be observed that in experiment 21, 48%, 42%, and 9% of readings show zero, greater than zero, and less than zero error, respectively, illustrated in Figure 7. In experiment 24, 10%, 35%, and 53% of readings show zero, greater than zero, and less than zero error, respectively. Figure 8 shows an example of this. Similarly, in experiment 25, the values are distributed as follows: 10% of the measured values show zero error, 24% show negative error, and 64% show positive error. Figure 9 depicts this.
The lowest percentage errors were observed in experiment 21. It was found that by decreasing rpm values at the given capturing distance, the proposed system shows error in the submillimeter range. The graphs in Figure 7, Figure 8 and Figure 9 show that values produced at all the points from A, B to C, D against the specific pixel of the workpiece image constitute thousands of values for each DOE case.
The experimental data produced by the in-process metrology experiment are subjected to statistical analysis to empirically observe patterns and trends, if any, in the data. Descriptive statistics are used to find the central point around which the data is clustered. Inferential statistics are primarily used to test hypotheses regarding the error of measurement observed.

4. Statistical Analysis

For analyzing the result from the proposed technique, 27 trials with different and controlled DOE parameters are performed. In measurement and statistical analysis, these trials are identified by index i, which varies from 01 to 27. Each trial resulted in a massive real-time, repeated automatic measurement of the workpiece’s diameter, which is denoted by D i j . For trial i, the subscript j is used to identify individual measurements taken on the same workpiece. The subscript j varies from 1 to the sample size in a particular trial, varying from trial to trial. Further, E i j defining the error of measurement given as
E i j = D i j 33.48

4.1. Descriptive Statistical Analysis

This paper summarized the results of three sample trials numbered 21, 24, and 25 from the given set by performing different statistical analysis methods to prove how close and frequent the measured value is.

4.2. Measure of Central Tendency

The mean, median, and mode are measures of central tendency; Table 3 shows these values. The mean absolute error, a measure of uncertainty, was 0.035 mm for D 21 j , 0.050 mm for D 24 j , and 0.083 mm for D 25 j . This clearly shows that even the worst case ( D 24 j ) is accurate to one tenth of a millimeter. The mean relative error, a measure of uncertainty when put in perspective, was 0.104% for D 21 j , 0.150% for D 24 j , and 0.249% for D 25 j . Therefore, in all cases, error was much less than 1%. The maximum absolute error was 0.151 mm for D 21 j , 0.135 mm for D 24 j , and 0.180 mm for D 25 j , which defines the maximum absolute error of the measurement process as less than 0.2 mm. This shows that the results obtained are valid.
The center of the data is calculated as in [44],
x ¯ = x i n
where x = sum of all observations, n = no. of observation.
The average variation in the data around a central position is calculated as in [44],
s = variance = ( x i x ¯ ) 2 n 1

4.3. Measure of Location

Percentiles are important measures of location. Table 4 shows the values of the selected percentiles from P05 to P95. Together, these percentiles give an idea about the distribution of the data around a central location (i.e., 33.48 for diameter and 0.00 for error). The median (P50) value of E 21 j is 0.00 mm; the same value for E 24 j is 0.05 mm, whereas the same value for E 25 j is 0.09 mm. This shows that compared to E 21 j , both E 24 j and E 25 j are slightly upward-biased. However, the amount of bias (about 0.27%) is negligible. This shows the validity of the findings obtained.

4.4. Measure of Dispersion

Coefficient of variation (CV) is a unitless relative measure of dispersion, whereas standard deviation is an absolute measure and is therefore measured in the unit of data provided. These measures are very important for quality control purposes. Table 3 provides details about these measures of dispersion. CV less than 10% is considered excellent. The coefficient of variation, a relative measure of uncertainty when put in perspective, was 0.14% for D 21 j , 0.13% for D 24 j , and 0.15% for D 25 j . Therefore, in all three cases, CV was less than 0.2%. This shows that statistically, the results are highly consistent and reliable.
The variations observed in the mean of the data set are calculated as in [44],
CV = Standatrd   Deviation Arithmetic   Mean × 100

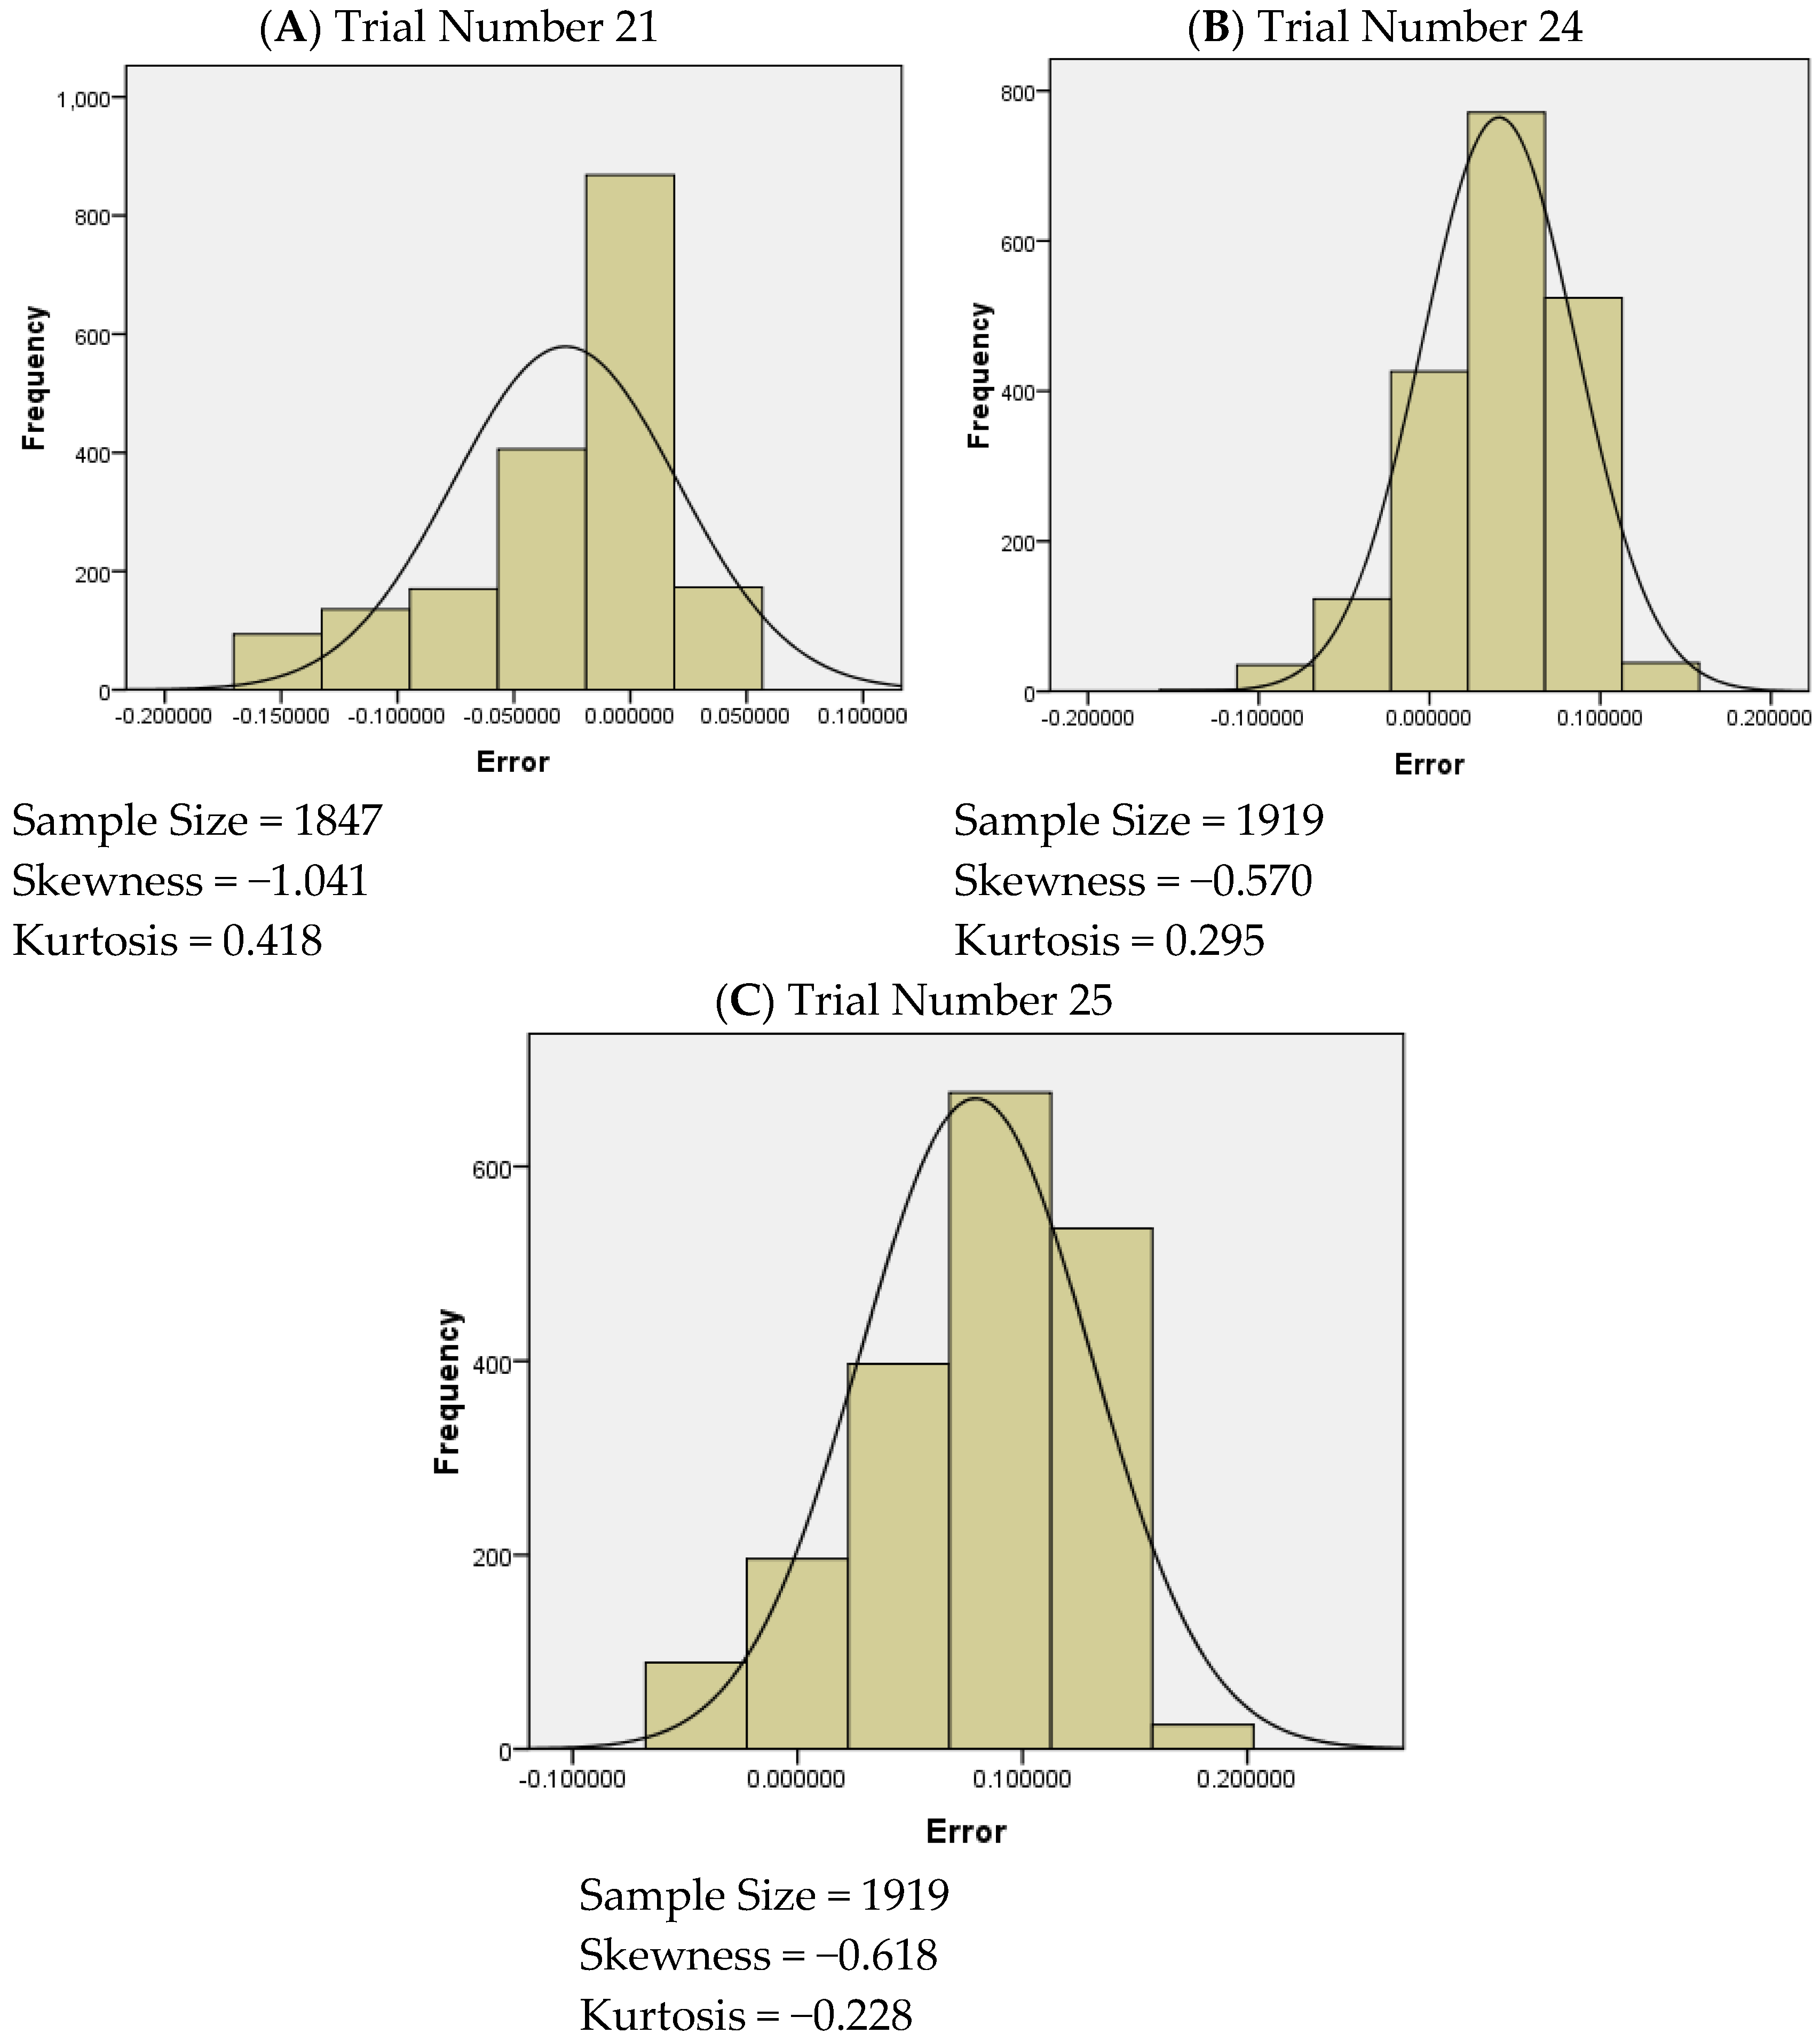
4.5. Shape of Distribution

Skewness and kurtosis, along with histogram, are important measures used to describe the shape of a distribution as shown in Figure 10. It is evident from these statistics that although the data show negative skewness, the distribution for statistical testing purposes may be considered symmetrical. Therefore, errors in observations are approximately symmetrically distributed around a central value of 0.

4.6. Statistical Inference

Statistical inference deals in the estimation and testing of research hypothesis to test whether the data produced by a given trial is unbiased or not. The null hypothesis for the discussion test, for a specified trial k, is given below.
Hk0. 
The population mean of a kth trial is equal to 33.48.
Mathematically,
H k 0 : μ k = 33.48   against   H k 1 : μ k 33.48
Hk1 is the alternate hypothesis, and μ k denotes the unknown population mean of all possible observations that, theoretically, can be obtained under trial k. Alternatively, the given hypothesis can be a frame in terms of error of measurement. Let ε k denote the unknown population mean of all possible error values that, theoretically, can be obtained under trial k. Then, Hk0 can be given as:
H k 0 : ε k = 0   against   H k 1 : ε k 0
If the null hypothesis (Hk0) is accepted, this concludes that the measurements generated in trial k are unbiased. Otherwise, if an alternate hypothesis (Hk1) is accepted, then this implies that the measurement process under trial k is biased and may require adjustment or zero correction. The one-sample t-test is used to test the hypothesis in the discussion. The t-test is calculated as [44],
t = ( x ¯ μ ) / ( s / n )
where
μ denotes the population mean
x bar is the sample mean
s is the standard deviation
n is the sample size
With an error of measurement analysis, μ is hypothesized to be equal to 0. The alternate hypothesis states that it is different from 0. Preliminary information regarding the test is given below in Table 5.
Necessary results of the test are summarized in Table 6 below. The p-value column in Table 6 shows the probability that the mean of sample is the same as the test value. Here, p-value = 0.0000, which shows that there is a 0.0000 probability that the sample mean is the same as the test value. Thus, the sample mean is actually different from the test value. Therefore, this particular sample is biased.
The p-value column of the test clearly shows that all of the listed sample trials are biased. Trial 21 is downward-biased and, on average, creates values less than the actual value, while cases 24 and 25 are upward-biased. It was observed that this might be an error of the instrument (Vernier caliper), which is used for calculating the average nominal value of the workpiece and the difference in the pixel intensity value concerning the threshold value at the border of the objects. These errors can be removed by making a positive correction of 0.0278 mm and negative corrections of 0.0408 mm and 0.0791 mm, respectively. The statistical analysis shows that the in-process metrology provides a real-time, sufficiently accurate, and reliable measurement method.

5. Discussion

In this paper, the proposed system was developed to measure the diameter of the workpiece in real time during the CNC lathe operation. Before the experiments, all the possible DOE factors were defined for the given input parameters. In order to check the system’s performance, the results were analyzed against different rpm rates and lightning conditions with the camera location set at the highest position with respect to the workpiece. The workpiece diameters, measured at multiple points for experiments 21, 24, and 25, were in the ranges of (−0.05 mm, 0.03 mm), (−0.049 mm, 0.013 mm), and (−0.05 mm to 0.09 mm), respectively. A similar study conducted by Jianming et al. [29] achieved precision between 0.082 percent and 0.318 percent against five data points, compared to 1500 datapoints in the current study, with an accuracy range of 0.083 percent to 0.236 percent. Sun et Al. measured the error up to 0.005 mm against four different measuring points. The maximum and the minimum error were both found within the range of −0.004 mm to 0.006 mm [30] compared to the current research, which has a range of −0.049 mm to 0.013 mm for a cluster of 1500 datapoints. According to Ayub et al. [32], the roundness error difference between the maximum and minimum values was 0.11 mm. In the proposed technique, a difference of 0.0356 mm is reported.

6. Conclusions

The designed product undergoes a quality control process in manufacturing industries to ensure the components’ dimensional accuracy after the manufacturing process (3rd Industrial Revolution). A novel real-time metrology system which can be implemented for quality control during the manufacturing process is proposed, developed, implemented, analyzed, and statistically validated. It is concluded that better light conditions with a higher resolution camera produce better results for the CNC lathe machine. The system has submillimeter accuracy and can be extremely useful to save costs and time for a conventional quality control department. The framework will be extremely helpful in implementing the concepts of a smart factory (Industry 4.0) and reducing both waste and the rejection of high-value components. The system can also be altered to provide factory-level engineering management data, such as the number of components manufactured, production rate, cutting time and other product performance parameters. At an application level, in the future, the dimensions of many complicated objects can be collected in real time using a mix of machine learning, deep learning techniques, and computer vision technologies. Moreover, this technology can be deployed in different manufacturing processes, including forging, etc., in which the dimensions of the object can be measured in real time at high temperature.

Author Contributions

Conceptualization, M.U.R.S. and S.T.; Data curation, A.J. and M.U.R.S.; Formal analysis, R.M., N.U. and A.A.A.A.; Funding acquisition, M.U.R.S.; Investigation, R.M., U.P. and N.U.; Methodology, A.J., M.U.R.S. and S.T.; Software, A.J. and S.T.; Supervision, M.U.R.S.; Validation, U.P., A.A.A.A. and M.S.; Visualization, T.H.; Writing—original draft, M.U.R.S. and M.S.; Writing—review & editing, T.H. All authors have read and agreed to the published version of the manuscript.

Funding

This research was funded by Taif University, Taif, Saudi Arabia, under Taif University Researchers Supporting Project (TURSP-2020/121).

Conflicts of Interest

The authors declare no conflict of interest.

References

  1. Rüßmann, M.; Markus, L.; Philipp, G.; Manuela, W.; Jan, J.; Pascal, E.; Michael, H. Industry 4.0: The future of productivity and growth in manufacturing industries. Boston Consult. Group 2015, 9, 54–89. [Google Scholar]
  2. Kang, C.W.; Ramzan, M.B.; Sarkar, B.; Imran, M. Effect of inspection performance in smart manufacturing system based on human quality control system. Int. J. Adv. Manuf. Technol. 2017, 94, 4351–4364. [Google Scholar] [CrossRef]
  3. Zhao, Y. An Integrated Process Planning System for Machining and Inspection. Ph.D. Thesis, University of Auckland, Auckland, New Zealand, 2009. [Google Scholar]
  4. Rezaei-Malek, M.; Tavakkoli-Moghaddam, R.; Siadat, A.; Dantan, J.-Y. A novel model for the integrated planning of part quality inspection and preventive maintenance in a linear-deteriorating serial multi-stage manufacturing system. Int. J. Adv. Manuf. Technol. 2018, 96, 3633–3650. [Google Scholar] [CrossRef] [Green Version]
  5. Wagner, R.; Haefner, B.; Lanza, G. Function-Oriented Quality Control Strategies for High Precision Products. Procedia CIRP 2018, 75, 57–62. [Google Scholar] [CrossRef]
  6. Syam, W.P.; Leach, R.; Rybalcenko, K.; Gaio, A.; Crabtree, J. In-process measurement of the surface quality for a novel finishing process for polymer additive manufacturing. Procedia CIRP 2018, 75, 108–113. [Google Scholar] [CrossRef]
  7. Everton, S.K.; Hirsch, M.; Stravroulakis, P.; Leach, R.K.; Clare, A.T. Review of in-situ process monitoring and in-situ metrology for metal additive manufacturing. Mater. Des. 2016, 95, 431–445. [Google Scholar] [CrossRef]
  8. Siddiqi, M.U.R.; Ijomah, W.L.; Dobie, G.I.; Hafeez, M.; Pierce, S.G.; Ion, W.; Mineo, C.; MacLeod, C.N. Low cost three-dimensional virtual model construction for remanufacturing industry. J. Remanuf. 2018, 9, 129–139. [Google Scholar] [CrossRef] [Green Version]
  9. Khan, W.A.; Abbas, G.; Rahman, K.; Hussain, G.; Edwin, C.A. Functional Reverse Engineering of Machine Tools; CRC Press: Boca Raton, FL, USA, 2019. [Google Scholar]
  10. Boeckmans, B.; Tan, Y.; Welkenhuyzen, F.; Guo, Y.; Dewulf, W.; Kruth, J.-P. Roughness offset differences between contact and non-contact measurements. In Proceedings of the 15th International Conference of the European Society for Precision Engineering and Nanotechnology, Leuven, Belgium, 1–5 June 2015. [Google Scholar]
  11. Hill, S., Jr. Machine vision boosts assembly line quality. Qual. Manuf. Processes 2001, 40, 50–55. [Google Scholar]
  12. Lins, R.G.; Araujo, P.; Corazzim, M. In-process machine vision monitoring of tool wear for Cyber-Physical Production Systems. Robot. Comput. Manuf. 2019, 61, 101859. [Google Scholar] [CrossRef]
  13. Yang, Y.; Zha, Z.-J.; Gao, M.; He, Z. A robust vision inspection system for detecting surface defects of film capacitors. Signal Process. 2016, 124, 54–62. [Google Scholar] [CrossRef]
  14. Chauhan, V.; Surgenor, B. A comparative study of machine vision based methods for fault detection in an automated assembly machine. Procedia Manuf. 2015, 1, 416–428. [Google Scholar] [CrossRef] [Green Version]
  15. Chen, T.; Wang, Y.; Xiao, C.; Wu, Q.M.J. A machine vision apparatus and method for can-end inspection. IEEE Trans. Instrum. Meas. 2016, 65, 2055–2066. [Google Scholar] [CrossRef]
  16. Liu, L.; Zhou, F.; He, Y. Automated status inspection of fastening bolts on freight trains using a machine vision approach. Proc. Inst. Mech. Eng. Part F J. Rail Rapid Transit 2016, 230, 1629–1641. [Google Scholar] [CrossRef]
  17. Nguyen, H.-C.; Nguyen, P.-L.; Lee, B.-R. A vision-based wheel disc inspection system. In Advances in Engineering Research and Application—Proceedings of the International Conference on Engineering Research and Applications, Thai Nguyen, Vietnam, 1–2 December 2018; Springer: Cham, Switzerland, 2018; pp. 109–115. [Google Scholar]
  18. Liu, L.; Zhou, F.; He, Y. Automated Visual Inspection System for Bogie Block Key Under Complex Freight Train Environment. IEEE Trans. Instrum. Meas. 2015, 65, 2–14. [Google Scholar] [CrossRef]
  19. Huang, S.-H.; Pan, Y.-C. Automated visual inspection in the semiconductor industry: A survey. Comput. Ind. 2015, 66, 1–10. [Google Scholar] [CrossRef]
  20. Spencer, B.F., Jr.; Hoskere, V.; Narazaki, Y. Advances in computer vision-based civil infrastructure inspection and monitoring. Engineering 2019, 5, 199–222. [Google Scholar] [CrossRef]
  21. Zhao, Y.J.; Xu, W.H.; Xi, C.Z.; Liang, D.T.; Li, H.N. Automatic and Accurate Measurement of Microhardness Profile Based on Image Processing. IEEE Trans. Instrum. Meas. 2021, 70, 6006009. [Google Scholar] [CrossRef]
  22. Lee, Y.-C.; Wu, Y.-C.; Yeh, S.-S. Development of an On-Machine External Thread Measurement System for CNC Lathes Using Eye-in-Hand Machine Vision with Morphology Technology. Eng. Lett. 2021, 29, 1–12. [Google Scholar]
  23. Dayam, S.; Desai, K.A.; Kuttolamadom, M. In-Process Dimension Monitoring System for Integration of Legacy Machine Tools into the Industry 4.0 Framework. Smart Sustain. Manuf. Syst. 2021, 5, 20210021. [Google Scholar] [CrossRef]
  24. Siddiqi, M.U.R.; Corney, J.R.; Sivaswamy, G.; Amir, M.; Bhattacharya, R. Design and validation of a fixture for positive incremental sheet forming. Proc. Inst. Mech. Eng. Part B J. Eng. Manuf. 2017, 232, 629–643. [Google Scholar] [CrossRef] [Green Version]
  25. Kamble, S.; Kasbe, A.; Bhanage, Y. A Case Study Approach of Quality Tools in Manufacturing Industry. Int. Res. J. Eng. Technol. 2019, 6, 1–10. [Google Scholar]
  26. Wuest, T.; Irgens, C.; Thoben, K.-D. An approach to monitoring quality in manufacturing using supervised machine learning on product state data. J. Intell. Manuf. 2013, 25, 1167–1180. [Google Scholar] [CrossRef]
  27. Hartman, D.A.; Dave, V.R.; Cola, M.J.; Carpenter, R.W. Method and Apparatus for In-Process Sensing of Manufacturing Quality. U.S. Patent 6,857,553, 22 February 2005. [Google Scholar]
  28. Zhang, F.; Wu, D.; Yang, J.; I Butt, S.; Yan, Y. High-definition metrology-based machining error identification for non-continuous surfaces. Proc. Inst. Mech. Eng. Part B J. Eng. Manuf. 2017, 232, 2566–2576. [Google Scholar] [CrossRef]
  29. Jianming, W.; Gao, B.; Zhang, X.; Duan, X.; Li, X. Error correction for high-precision measurement of cylindrical objects diameter based on machine vision. In Proceedings of the 2015 12th IEEE International Conference on Electronic Measurement & Instruments (ICEMI), Qingdao, China, 16–18 July 2015; 3, pp. 1113–1117. [Google Scholar]
  30. Sun, Q.; Hou, Y.; Tan, Q.; Li, C. Shaft diameter measurement using a digital image. Opt. Lasers Eng. 2014, 55, 183–188. [Google Scholar] [CrossRef]
  31. Shiraishi, M.; Sumiya, H.; Aoshima, S. In-Process Diameter Measurement of Turned Workpiece with Curvatures by Using Sensor Positioning. J. Manuf. Sci. Eng. 2005, 128, 188–193. [Google Scholar] [CrossRef]
  32. Ayub, M.A.; Mohamed, A.B.; Esa, A.H. In-line Inspection of Roundness Using Machine Vision. Procedia Technol. 2014, 15, 807–816. [Google Scholar] [CrossRef] [Green Version]
  33. Liu, S.; Tan, Q.; Zhang, Y. Shaft Diameter Measurement Using Structured Light Vision. Sensors 2015, 15, 19750–19767. [Google Scholar] [CrossRef] [Green Version]
  34. Pramanik, A. Problems and solutions in machining of titanium alloys. Int. J. Adv. Manuf. Technol. 2014, 70, 919–928. [Google Scholar] [CrossRef]
  35. You, S.H.; Lee, J.H.; Oh, S.H. A Study on Cutting Characteristics in Turning Operations of Titanium Alloy used in Automobile. Int. J. Precis. Eng. Manuf. 2019, 20, 209–216. [Google Scholar] [CrossRef] [Green Version]
  36. GreyRigge Associates Ltd. The Biotech Consultancy. Available online: http://www.greyrigge.com/services/biotech-consulting/design-experiments-doe/ (accessed on 17 May 2022).
  37. Sheth, S.; George, P.M. Experimental investigation, prediction and optimization of cylindricity and perpendicularity during drilling of WCB material using grey relational analysis. Precis. Eng. 2016, 45, 33–43. [Google Scholar] [CrossRef]
  38. Shakeri, Z.; Benfriha, K.; Shirinbayan, M.; Ghodsian, N.; Tcharkhtchi, A. Modeling and Optimization of Fused Deposition Modeling process parameters for cylindricity control by using Taguchi method. In Proceedings of the 2021 International Conference on Electrical, Computer, Communications and Mechatronics Engineering (ICECCME), Port Louis, Mauritius, 7–8 October 2021; pp. 1–5. [Google Scholar]
  39. Reddy, M.S.; Selvan, C.P.; Sampath, S.; Pillai, S.R. Impact of process parameters on surface roughness of hastelloy using abrasive waterjet machining technology. Int. J. Recent Technol. Eng. 2019, 7, 419–425. [Google Scholar]
  40. Pham, H. (Ed.) Springer Handbook of Engineering Statistics; Springer: London, UK, 2006; Volume 49. [Google Scholar]
  41. Besterfield, D.H. Quality Control; Pearson Education India: Noida, India, 2004. [Google Scholar]
  42. Harun, A.; Harun, Y. Experimental and statistical investigation of the effect of cutting parameters on surface roughness, vibration and energy consumption in machining of titanium 6Al-4V ELI (grade 5) alloy. Measurement 2021, 167, 108465. [Google Scholar]
  43. Shi, M.; Xiong, J.; Zhang, G.; Zheng, S. Monitoring process stability in GTA additive manufacturing based on vision sensing of arc length. Measurement 2021, 185, 110001. [Google Scholar] [CrossRef]
  44. Walpole, R.E.; Myers, R.H.; Myers, S.L.; Ye, K. Probability and Statistics for Engineers and Scientists; Macmillan: New York, NY, USA, 1993; Volume 5. [Google Scholar]
Figure 1. Proposed in-process measurement solution.
Sustainability 14 07472 g001
Figure 2. Experimental setup.
Sustainability 14 07472 g002
Figure 3. Real-time-captured RGB image of target object and the calibrated object.
Sustainability 14 07472 g003
Figure 4. Binary processed image of target object and the calibrated object.
Sustainability 14 07472 g004
Figure 5. Flow chart of the in-process measurement system.
Sustainability 14 07472 g005
Figure 6. Diameter of workpiece.
Sustainability 14 07472 g006
Figure 7. Deviation measured for experiment 21.
Sustainability 14 07472 g007
Figure 8. Deviation measured for experiment 24.
Sustainability 14 07472 g008
Figure 9. Deviation measured for experiment 25.
Sustainability 14 07472 g009
Figure 10. Skewness, kurtosis, and shape of distribution.
Sustainability 14 07472 g010
Table 1. Design of experiment (DOE) factors.
S. NoDistance between Workpiece and Camera (cm)Distance between Workpiece and Light Source (cm)RPM
Workpiece and Light 1 (Upper) Distance (cm)Workpiece and Light 2 (Lower) Distance (cm)Workpiece
and Light 3 (Camera Front Light) Distance (cm)
126.91272540
226.91672540
326.92072540
426.91272565
526.91672565
626.92072565
726.9121125110
826.9161125110
926.9201125110
1035121132.540
1135161132.540
1235201132.540
1335121132.565
1435161132.565
1535201132.565
1635121132.5110
1735161132.5110
1835201132.5110
1945121142.540
2045161142.540
2145201142.540
2245121132.565
2345161132.565
2445201132.565
2545121132.5110
2645161132.5110
2745201132.5110
Table 2. Equipment detail.
S. NoEquipmentModelDetail
1Turning CenterFTC 30Feeler/250 diameter/650 length
2CameraCanon EOS 70Df-18 mm -153 mm
3WorkpieceAluminum AlloyA3035
4Calibrated ObjectAluminum AlloyA3035
5Light SourcePC-1212 W White Light
Table 3. Measures of central tendency and dispersion.
D21E21D24E24D25E25
Sample Size184718471919191919191919
Mean (mm)33.45−0.0333.520.0433.560.08
Median (mm)33.480.0033.530.0533.570.09
Mode (mm)33.480.0033.530.0533.570.09
Standard Deviation (mm)0.050.050.050.050.050.05
Coefficient of Variation (mm)0.14173.220.13110.820.1565.09
Table 4. Measures of location.
D21 (mm)E21 (mm)D24 (mm)E24 (mm)D25 (mm)E25 (mm)
P00 = Minimum33.33−0.1533.34−0.1433.43−0.05
P0533.33−0.1533.43−0.0533.480.00
P1033.37−0.1133.480.0033.480.00
P1533.40−0.0833.480.0033.530.05
P2033.40−0.0833.480.0033.530.05
P25 = Q1 = Lower Quartile33.44−0.0433.480.0033.530.05
P3033.44−0.0433.480.0033.530.05
P3533.44−0.0433.530.0533.530.05
P4033.44−0.0433.530.0533.570.09
P4533.480.0033.530.0533.570.09
P50 = Q2 = Median33.480.0033.530.0533.570.09
P5533.480.0033.530.0533.570.09
P6033.480.0033.530.0533.570.09
P6533.480.0033.530.0533.570.09
P7033.480.0033.530.0533.570.09
P75 = Q3 = Upper Quartile33.480.0033.570.0933.620.14
P8033.480.0033.570.0933.620.14
P8533.480.0033.570.0933.620.14
P9033.480.0033.570.0933.620.14
P9533.520.0433.570.0933.620.14
P100 = Maximum33.520.0433.620.1433.660.18
Table 5. Preliminary information of t-test [Hk0: εk = 0].
Trial (k)Sample SizeMean (mm)Standard Deviation (mm)Standard Error of Mean (mm)
211847−0.02780.04820.0011
2419190.04080.04520.0010
2519190.07910.05150.0012
Table 6. Detailed information of t-test [Hk0: εk = 0].
Trial (k)Value of t-StatisticDegrees of Freedomp-ValuePercentage %Mean Difference (mm)99% Lower Confidence Limit (mm)99% Upper Confidence Limit (mm)
21−24.81018460.00000.083%−0.0278−0.0307−0.0249
2439.53019180.00000.121%0.04080.03810.0434
2567.30419180.00000.236%0.07910.07610.0821
Publisher’s Note: MDPI stays neutral with regard to jurisdictional claims in published maps and institutional affiliations.

