Abstract
In order to study the development height of the water-conducting fracture zone in a fully mechanized top coal caving face. The E2311 working face of Gaohe Coal Mine was chosen as the research object, and the combined-strata structure and the rock layer synergistic movement mechanism were determined by combining engineering geological investigation and theoretical analysis. The height of the water-conducting fracture zone at the working face was calculated based on the combined-strata structure, and then the theoretical results were verified by numerical simulation and field measurement. The results show that after the coal seam is extracted from the working face, the movement of the overlying rock layers is in the form of bending and sinking movement of the rock layer group as a unit. Each rock layer group is controlled by a supportive lower layer with greater thickness and strength, driving the upper layers of weaker rock layers to synchronize and coordinate the movement; the sinking curvature is the same, after the lowermost support layer is bent and broken, its overlying weaker rock layers will move and break at the same time. The height of the water-conducting fracture zone of the working face were obtained by theoretical calculation, numerical simulation, and field measurements, which are 83.82 m, 84.3 m, and 86.6 m, respectively. The results are nearly consistent, thus the prediction of the height of the water-conducting fracture zone under the combined-strata structure is more accurate.
1. Introduction
After coal seam mining, there is inevitable rock movement and changes in the internal stress and fracture fields of the strata [1], and the overlying rock layer breaks to form a water-conducting fracture zone. The key to the safe mining of coal seams under bodies of water is to accurately measure the height of the water-conducting fracture zone after coal seam mining. At present, the empirical formula given in the “Specification for coal pillar retention and coal compression mining of buildings, water bodies, railroads, and major shafts” [2], which is commonly used in China, is only applicable to thin coal seams and medium-thick coal seams mined in layers. However, the primary mining height of comprehensive mechanized roof release coal mining is large, and the development pattern of the water-conducting fracture zone height is non-linearly distributed, and the results obtained after application of the empirical formula have errors [3].
Scholars have studied the development laws of water-conducting fracture zones through various means [4,5,6,7,8,9,10,11,12], and have proposed various methods to predict the development height of water-conducting fracture zones. Skrzypkowski et al. [13] conducted laboratory tests examining the effects of the strength and structural parameters of rocks, and the results showed that water contributes to the weakening of the strength parameters of rocks. Shi et al. [14] deduced the prediction formula for the height of water-conducting fracture zones considering mining height, mining depth, and overburden combination characteristics based on the theory of the “upper four zones” of the roof of the quarry. Ti et al. [5] used the plate and shell theory to construct a mechanical model for calculating the deformation damage height of mining overburden and then calculated the height of water-conducting fracture zones in different areas of each coal seam. Wang et al. [15,16] studied separation and fracturing in overlying strata disturbed by longwall mining in a mineral deposit seam. By constructing a rock-seam overhanging integrity mechanical model, Guo et al. [17,18] proposed a theoretical prediction method for the height of water-conducting fracture zones applicable to comprehensive mining conditions A rock-seam overhanging extension breakage model and a broken rock block mechanical model were utilized, and by analyzing the initial collapse mechanism of the overlying coal seam roof, the rock-seam overhanging extension breakage and the rock block structure destabilization mechanisms were identified. Huang et al. [19] proposed a “four-band” division method for the overlying rock layers in the mining area according to the different movement and collapse characteristics of the overlying rock layers. Xu et al. [8,20] studied the location of the key layer of the roof and its influence on the height of the water-conducting fracture zone, and proposed a method to predict the height of the water-conducting fracture zone based on the location of the key layer of the roof.
Previous studies focused on the controlling role of the overburden key layer on the development height of the water-conducting fracture zone, but did not analyze the overburden layer after combining the rock layers with similar properties such as mechanical properties and strength characteristics. Therefore, this paper takes the E2311 fully mechanized top coal caving face of Gaohe Coal Mine as the research background, uses engineering geological investigation, theoretical analysis, numerical simulation, field measurement, and other means to determine the combined-strata structure and synergistic movement mechanism, calculates the development height of the water-conducting fracture zone, and conducts field measurement to verify. The results will provide a theoretical basis for the working face water-conducting fracture zone height prediction of similar working conditions.
2. Engineering Geology Overview
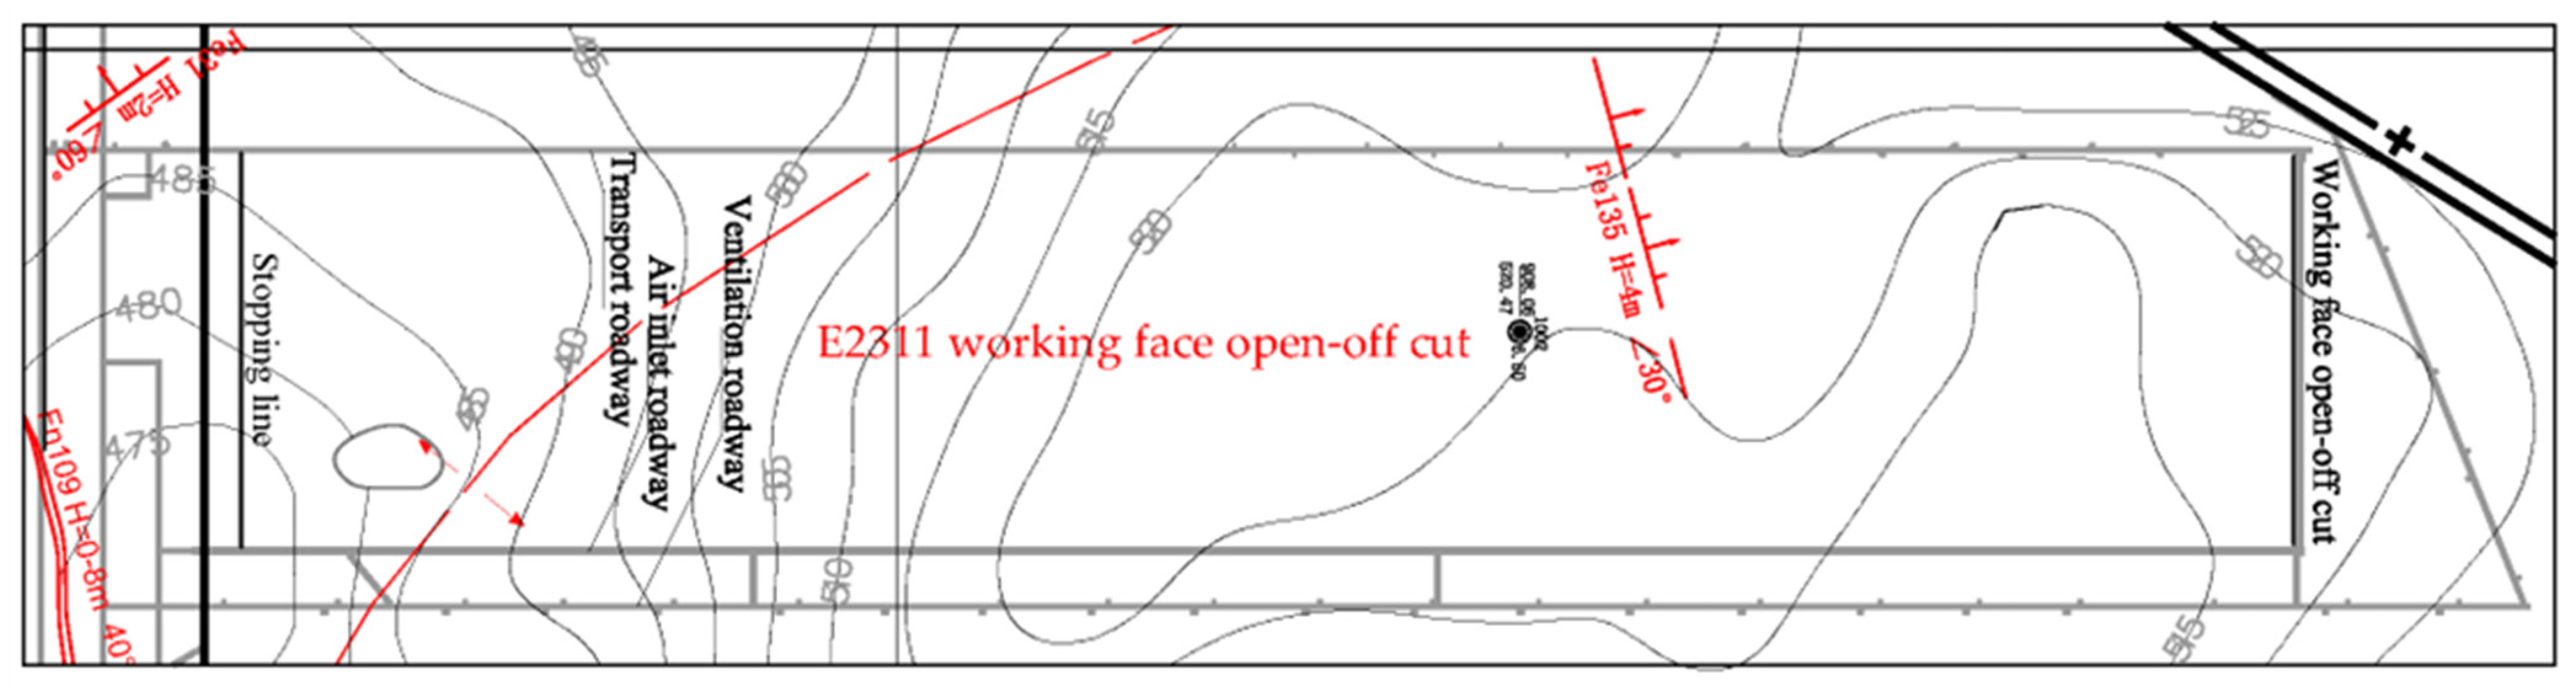
The E2311 coalface of Gaohe Coal Mine is located in the No. 3 coal seam, with an average coal thickness of 6.5 m, an average inclination of 3°, and an average burial depth of 372.0 m–425.2 m. The elevation of the coal floor is +484.0 m–+535.0 m. The length of the working face is 320 m, the length of the auxiliary transport roadway is 1902 m, the length of the main transport roadway is 1828 m, the length of the inlet airway is 1733 m, and the length of the return airway is 1967 m. The working face adopts the full-height coal mining method by releasing the top coal one at a time. The mining height is 3.5 ± 0.2 m, the coal release height is 3.0 m, the mining release ratio is 1:0.8, the coal cutting recovery rate is 98%, the top coal recovery rate is 88%, and the cycle progress is 0.8 m. One cycle consists of one mine and one release; there are two production shifts and one maintenance shift per day with one cycle occurring per shift. Figure 1 shows the mining diagram of E2311 working face.

Figure 1.
Mining diagram of E2311 working face.
The lithology and thickness of the overlying rocks above the No. 3 coal seam in the working face were analyzed according to the column diagram of the borehole in the working face and the mechanical test report of the coal rock body, which are listed in Table 1.

Table 1.
Overburden lithology and thickness of No. 3 coal seam.
According to the analysis in Table 1, the overlying rock layers within the working area of E2311 are mainly sandy mudstone, siltstone, mudstone, medium-grained sandstone, coarse-grained sandstone, fine-grained sandstone, aluminous mudstone, etc. The composition structure of the overlying rocks is more complex, each rock layer is different, with different thicknesses, soft, and hard layers, and it is a composite roof. In the drill core, sandstone is the dominant rock, accounting for about 58.5% of the core thickness, among which siltstone is the dominant rock, accounting for about 65.1% of the cumulative thickness of sandstone, with a rock hardness coefficient of 6.6–8, which is a hard rock layer. Overall, in the drill core, aluminum mudstone, sandy mudstone, and mudstone account for 41.5% of the core thickness, among which mudstone is the dominant rock, accounting for about 62.6% of the cumulative thickness of the three mudstones. The thickness of each layer is uneven, the thickest layer is the mudstone layer (3) with a thickness of 21.12 m, and the thinnest is the sandy mudstone layer (10) and the aluminum mudstone layer (12) with a thickness of 1 m.
3. Analysis of Combined-Strata Structure in Working Face
In the combined movement of rock layers, there must be one or several layers that play a key weight-bearing role. Finding this portion of the key rock layer(s) and analyzing their movement steps and breaking patterns is critical in the study of the overall movement breaking law of the overlying rock layers and their correlation with the fracture development of the surrounding rock.
A large number of studies have shown that after the coal seam is extracted, the movement of the overlying rock layers is in the form of a bending and sinking movement in the form of a rock layer group. Each rock layer group consists of a layer of hard rock at the bottom, driving the upper layers of weaker rock layers to move in a synchronized and coordinated manner. The movement combination of the rock formation is determined by the strength factors of each rock formation (including lithology, thickness, and elastic modulus). The upper layers with low strength factors will move simultaneously with the lower layers with high strength factors and have the same sinking curvature, while the upper layers with high strength factors will gradually delaminate from the lower layers with low strength factors [21,22].
According to the practical mine pressure theory and structural mechanics analysis [23], for two adjacent rock layers, whether they move simultaneously to form a formation group or separately can be judged by the maximum curvature ρmax in the rock settlement.
When ρmax up > ρmax down, the two formations combine to form a formation group movement.
When ρmax up < ρmax down, the two rock layers move separately to form two rock formations.
According to the analysis, the maximum curvature of the rock beam can be expressed by the following equation.
where, γ is bulk density; α is the coefficient determined by the rock beam support condition; L is ultimate span of the rock beam; E is elastic modulus of rock beam; m is thickness of rock layer.
According to the analysis of the rock sinking curvature theory combined with the rock situation of the top slab at the site, the rock layers that may become the main support layer (key layer) within the overlying bedrock rock layer on the working surface include:
- (1)
- No. 2 siltstone layer, thickness of 10.31 m and compressive strength of 65.66 MPa.
- (2)
- No. 5 siltstone layer, thickness of 19.21 m and compressive strength of 65.66 MPa.
- (3)
- No. 7 coarse-grained sandstone layer, thickness of 3.9 m compressive strength of 75.62 MPa.
- (4)
- No. 9 fine-grained sandstone layer, thickness of 5.14 m compressive strength of 80.16 MPa.
- (5)
- No. 11 medium-grained sandstone layer, thickness of 1.4 m and compressive strength of 70.08 MPa.
- (6)
- No. 13 medium-grained sandstone layer, thickness of 5.2 m and compressive strength of 70.08 MPa.
Therefore, the rock combination structure of the overburden above the E2311 working face of coal seam No. 3 can be determined as shown in Table 2.
Table 2.
Structural division of the overburden combination at E2311 workings.
According to the analysis of rock movement characteristics, the overlying strata combination structure of the E2311 working face in Gaohe coal mine has been determined. It can be seen from Table 2 that the overlying bedrock range of the E2311 working face can be divided into 7 rock strata groups with alternating soft and hard combinations.
Rock stratum group I is composed of a single sandy mudstone. The thickness of the rock stratum group is 4.75 m, and the compressive strength is 40.43 MPa, which belongs to the medium solid rock stratum. The strata group belongs to the direct roof category of coal seam No. 3. After the coal seam is mined at the working face, the strata group will gradually collapse with the gradual increase in mining space and accumulate in the goaf.
Rock stratum group II consists of a 10.31 m thick siltstone layer and its overlying mudstone with a thickness of 21.12 m. The overall thickness of the formation group is 31.43 m, belonging to the old roof category of coal seam No. 3. The compressive strength of the siltstone layer is 65.66 MPa, which is a solid rock layer; the compressive strength of the mudstone layer is 27.46 MPa, which is a relatively soft rock layer. The 10.31 m thick siltstone layer at the bottom periodically breaks with the mining of coal seam No. 3, and because of its overall thickness and high strength, its bending fracture will drive the mudstone layer within the rock formation to move at the same time, forming a composite old roof strata structure.
Rock stratum group III consists of three layers, which are 2.98 m thick medium-grained sandstone layer, 19.21 m thick siltstone layer, and 3.97 m thick sandy mudstone layer, and the overall thickness of the formation group is 26.16 m. The compressive strength of the medium-grained sandstone layer is 70.08 MPa and the compressive strength of the siltstone layer is 65.66 MPa, both of which are solid rock layers; the compressive strength of the sandy mudstone layer is 40.43 MPa, which is a medium-solid rock layer. Because of the small thickness of medium-grained sandstone despite being harder than the siltstone layer, the siltstone layer, with a thickness of 19.21 m, is still used as the supporting key layer. This rock group is controlled by the supporting key layer (siltstone layer), and when the movement of the supporting key layer (siltstone layer) breaks, it will cause all of the weak rock groups above it to sink with its simultaneous movement. After the breakage of the old roof strata structure (rock stratum group II), this rock formation starts to move gradually, and because its movement characteristics are incompatible with the old roof strata structure, it will form a certain off-layer space with the lower old roof strata structure.
Rock stratum group IV consists of two layers, coarse-grained sandstone of 3.9 m and siltstone of 1.44 m. The overall thickness of the formation group is 5.34 m. The compressive strength of the coarse-grained sandstone layer is 75.62 MPa and the compressive strength of the siltstone layer is 65.66 MPa, both of which are solid rock layers. This rock group is controlled by the lower support key layer (coarse-grained sandstone layer), and when the movement of the lower support key layer (coarse-grained sandstone layer) breaks, it will lead to the simultaneous sinking movement of all the weak rock groups above it. This rock layer is not coordinated with the lower rock group and will form a certain off-layer space with the lower rock group.
Rock stratum group V consists of two layers, 5.14 m thick fine-grained sandstone and 1 m thick sandy mudstone, with an overall thickness of 6.14 m. The compressive strength of the fine-grained sandstone layer is 80.16 MPa, which is a strong rock formation, and the compressive strength of the sandy mudstone layer is 40.43 MPa, which is a medium-strong rock formation. This rock group is controlled by the lower supporting key layer (fine-grained sandstone layer), and when the movement of the lower supporting key layer (fine-grained sandstone layer) breaks, it will lead to the simultaneous sinking movement of all the weak rock groups above it. This rock layer is not coordinated with the lower rock group and will form a certain off-layer space with the lower rock group.
Rock stratum group VI consists of two layers, 1.4 m thick fine-grained sandstone and 1 m thick aluminum mudstone, with an overall thickness of 2.4 m. The compressive strength of the fine-grained sandstone layer is 80.16 MPa, which is a strong rock formation, and the compressive strength of the aluminum mudstone layer is 24.21 MPa, which is a medium-strong rock formation. This rock group is controlled by the lower supporting key layer (fine-grained sandstone layer), and when the movement of the lower supporting key layer (fine-grained sandstone layer) breaks, it will lead to the simultaneous sinking movement of all the weak rock groups above it. This rock layer is not coordinated with the lower rock group and will form a certain off-layer space with the lower rock group.
Rock stratum group VII consists of two layers, 5.2 m thick medium-grained sandstone and 2.4 m thick sandy mudstone, with an overall thickness of 7.6 m. Its medium-grained sandstone layer has a compressive strength of 80.16 MPa, which is a strong rock layer, and the sandy mudstone layer has a compressive strength of 40.43 MPa, which is a medium-strong rock layer. This rock group is controlled by the lower supporting key layer (medium-grained sandstone layer), and when the movement of the lower supporting key layer (medium-grained sandstone layer) breaks, it will lead to the simultaneous sinking movement of all the weak rock groups above it. This rock layer is not coordinated with the lower rock group and will form a certain off-layer space with the lower rock group.
According to the analysis of the overlying rock structure characteristics of Gaohe Coal Mine, the dynamic movement of its rock seams is obviously uncoordinated because the overlying rock seams on No. 3 coal seam E2311 workings are mostly composite rock seam structures. After the coal seam is extracted, the movement of the overlying rock layers should be in the form of a bending and sinking movement of the rock layer group. Each rock layer group is controlled by the lower support layer with higher thickness and strength, which drives the upper several layers of weaker rock layers to synchronize and coordinate the movement, and the sinking curvature is the same. When the lower support layer is broken, the upper weak rock layer will be broken at the same time. Through the above analysis of rock combination structure, it can lay the foundation for the study of the development of the height of the water-conducting fracture zone of overlying rocks.
4. Calculation of the Height of the Water-Conducting Fracture Zone in Working Face
According to research, the formation and development of fractures in rock formations is caused by the bending and sinking of rock formations. When there is enough movement space below the rock formation, the rock formation will bend and settle under the action of self-weight and overburden pressure until it exceeds the tensile strength of the rock formation, resulting in cracks perpendicular to the rock formation. When the fracture penetrates into the entire rock formation, a water-flowing fracture is formed. As the rock formation continues to sink and the water-flowing fracture on the rock formation is sufficiently developed, the rock formation is classified into the category of water-conducting fracture zone [21]. The geometric model of rock bending and sinking is shown in Figure 2.
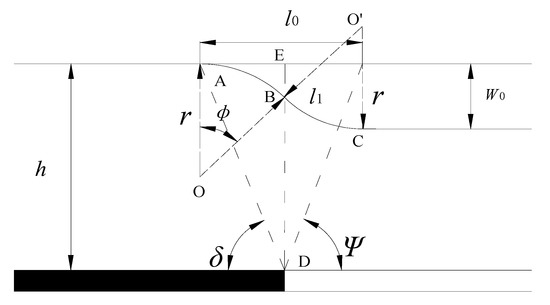
Figure 2.
Geometric model of rock bending and sinking.
The amount of tensile deformation in a rock formation characterizes the size and distribution of fractures in the formation. The degree of deformation of a rock formation can be expressed by the stratum’s tensile ratio ε. The stratum’s tensile ratio ε can be defined as the ratio of the incremental length of a rock formation after layer stretching to the original length.
The rock stratum’s tensile ratio ε is calculated as follows [21].
- ①
- Find: w0, l0:
- ②
- Find: , l1:
- ③
- Find the stratum’s tensile ratio ε:
where, w0 is the subsidence of the rock stratum; l0 is the length of the straight line section before bending deformation of the rock seam; l1 is the length of the curve section after bending deformation of the rock seam; h is the drop distance from the neutral layer of the rock seam to the coal seam; δ0 is the boundary angle; Ψ-sufficient mining angle; m is the coal seam thickness; hp is the thickness of the direct roof of lower p layer; kp is the crushing and swelling coefficient after collapse of the direct roof of the lower p layer; hi is the thickness of the old roof of the lower i layer; kj is the crushing and swelling coefficient after breaking of the old roof of the lower j layer.
According to the study in the previous section, the movement of the overlying rock layer on the E2311 working face is in the form of a bending and sinking movement of the rock formation as a unit. When a hard rock formation is sunken to a large extent, this leads to the formation of a fracture sufficient enough to allow for the flow of water. The upper weak rock formation under its control has the same amount of sinking as the formation, and its resistance to deformation is lower than the lower hard rock formation. Thus, its development fracture also reaches the full extent of the rock, so the formation group is classified as the water-conducting fracture zone at the same time. Therefore, it can be seen that the development of a water-conducting fracture zone in the overlying rock of the working face gradually develops upward in a step-like manner with the rock formation group as a unit. Additionally, the fracture development of each rock formation group is controlled by the movement of the lower hard rock formation. Based on the above understanding, after determining the grouping of overburden rock of the working face, judging the development height of the water-conducting fracture zone can be transformed into analyzing the deformation and fracture development of several layers of hard rock, which simplifies the theoretical estimation workload of the fracture zone height.
Combined with the structural analysis of the E2311 working face, the calculated parameters of the layer tensile ratio of each main support layer above the working face are shown in Table 3.
Table 3.
Calculated parameters of the tensile ratio of each rock layer.
Combined with the parameters in Table 3, the tensile ratios of each rock layer were calculated according to the formula for tensile ratio calculation as follows:
No. 13 medium-grained sandstone layer, ε13 = 0.0068.
No. 11 medium-grained sandstone layer, ε11 = 0.0336.
No. 9 fine-grained sandstone layer, ε9 = 0.9468.
No. 7 coarse-grained sandstone layer, ε7 = 1.6381.
No. 5 siltstone layer, ε5 = 3.6986.
No. 2 siltstone layer, ε2 = 49.26.
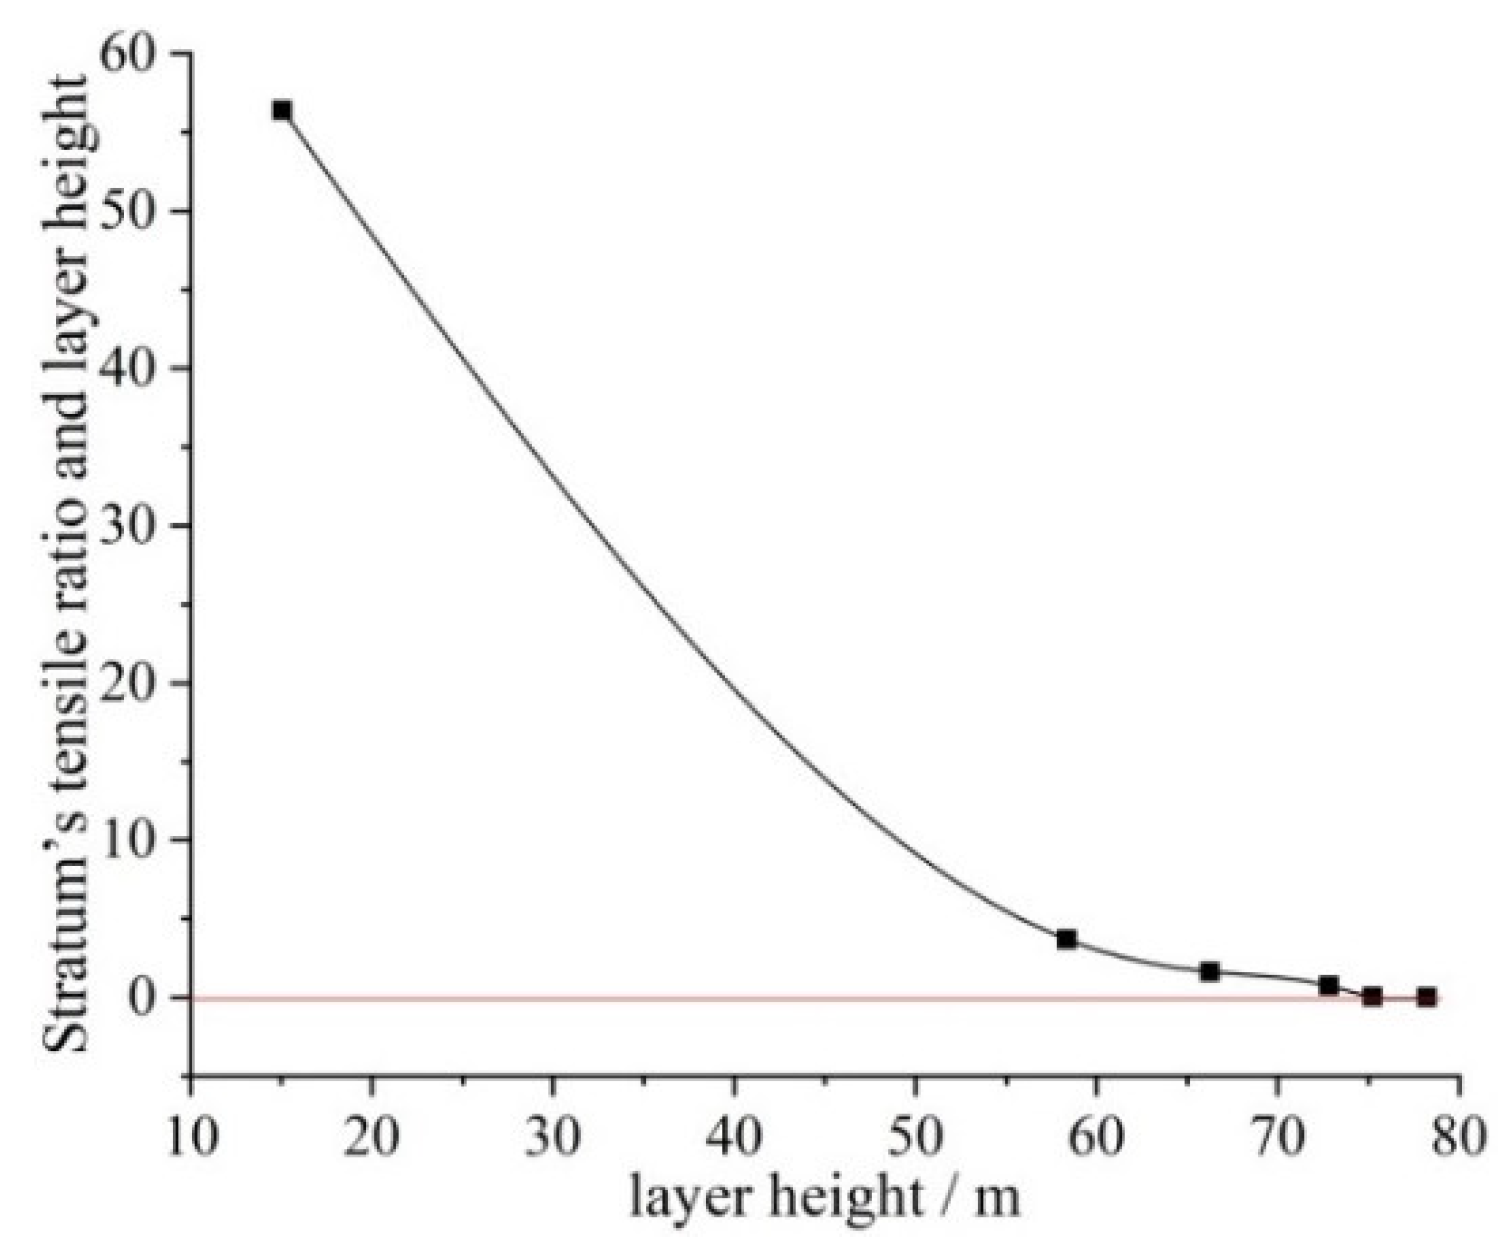
In order to fully compare the illustrations, the stratum’s tensile ratio of each layer of the rock formation was calculated, and the fitted curve of the stratum’s tensile ratio of the rock formation versus the height of the rock formation was plotted, as shown in Figure 3.

Figure 3.
Relationship curve between the stratum’s tensile ratio and layer height.
According to Figure 3, the stratum’s tensile ratio is a negative exponential function of the rock layer height. The closer the rock layer is to the working face, the greater its tensile ratio, indicating that the rock layer bends and sinks more; as the height of the rock layer gradually increases, the tensile ratio decreases as a negative exponential function. According to the aforementioned analysis, the overburden water-conducting fracture zone is developed from the bottom up by the formation group. Thus, the tensile ratio decreases from 0.0336 to 0.0068 between No. 11 medium-grained sandstone formation group and No. 13 medium-grained sandstone formation group, respectively. This is a change in the inflection point of the stratum’s tensile ratio, after which the stratum’s tensile ratio tends to level off and gradually decreases to zero, indicating that the tensile ratio between No. 11 medium-grained sandstone formation group and No. 13 middle-grained sandstone layer group is the dividing line between the water-conducting fracture zone and the bending sinkage zone. This means that the middle-grained sandstone layer group No. 11 belongs to the water-conducting fracture zone, while the middle-grained sandstone layer group No. 13 should be classified as the bending sinkage zone. In order to account for safety, the middle-grained sandstone layer group No. 13 is also classified as the water-conducting fracture zone. From Table 2, we can see that the final development height of the water-conducting fracture zone is 83.82 m.
5. Numerical Simulation
5.1. Numerical Simulation Modeling
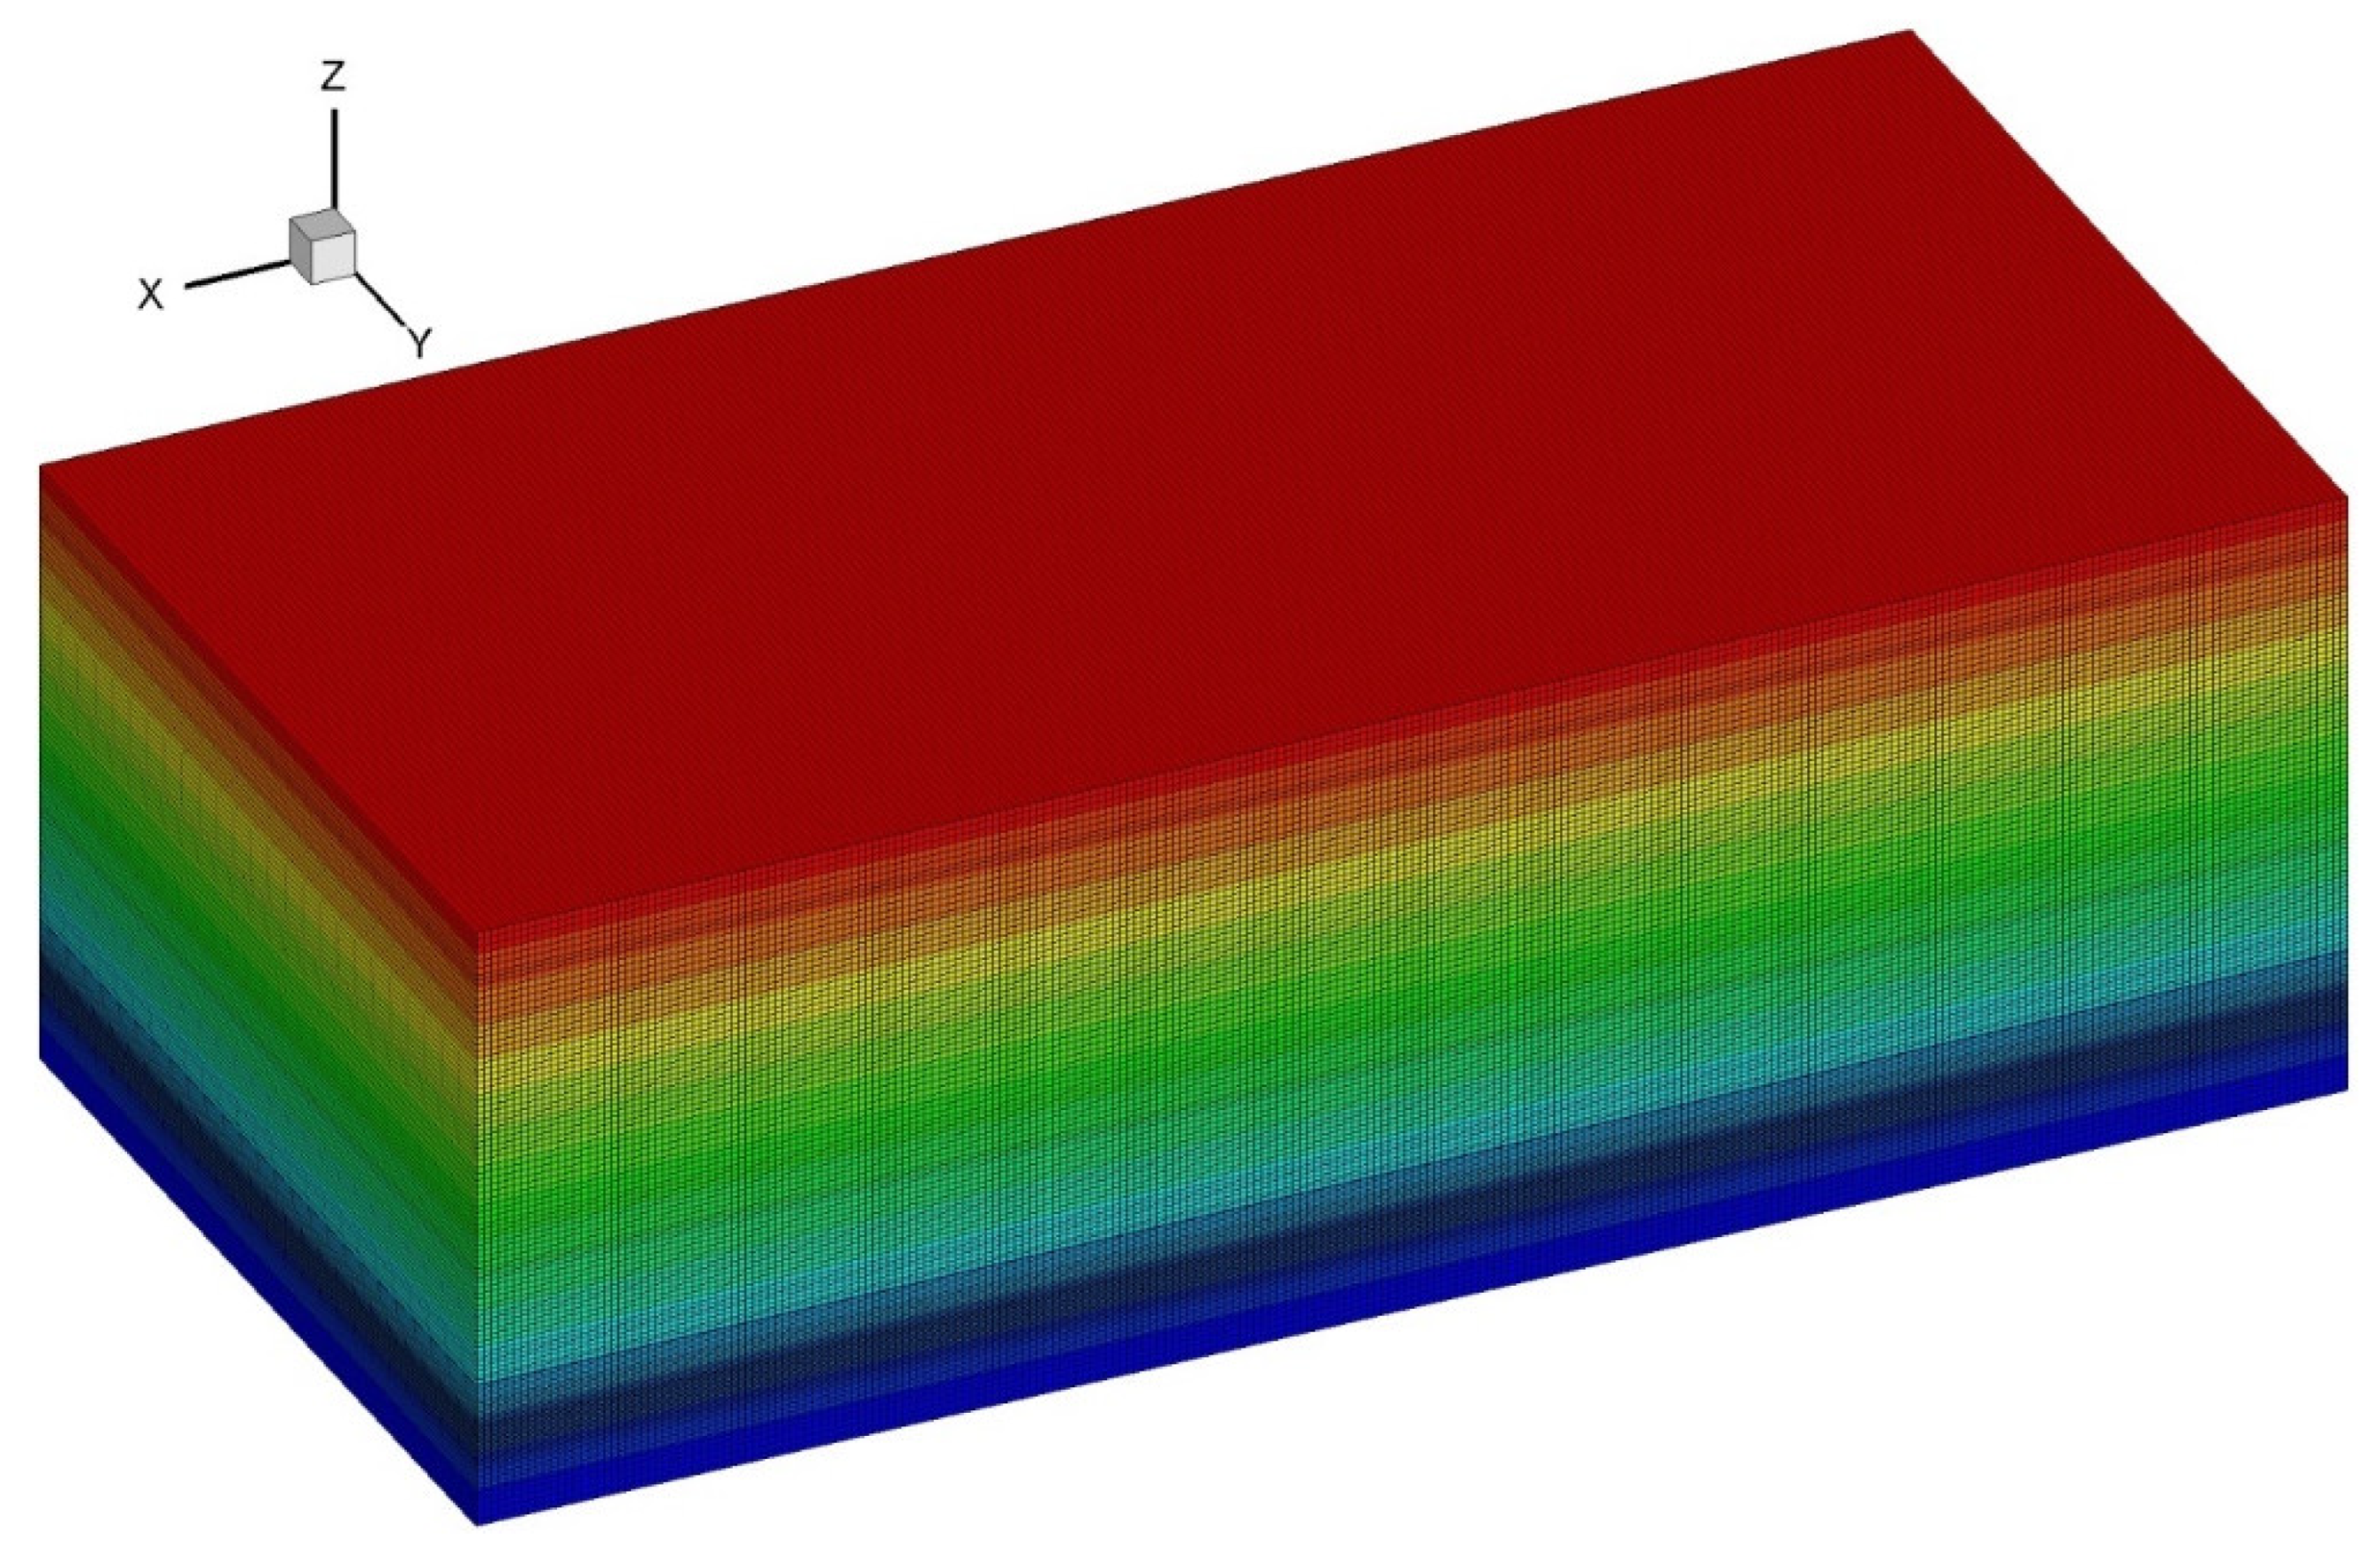
The numerical simulation calculation model was established according to the geological profile of the E2311 working face of Gaohe Coal Mine and the characteristics of the coal seam and roof and floor plates using the finite difference software FLAC3D. The X-direction indicates the advancing direction of the working face, the Y direction being the length direction of the working face, and the Z direction indicating the burial depth. The size of the established numerical model is L × W × H = 500 × 300 × 166 m, and the model includes a total of 223,902 units, containing 236,712 network nodes. A total rock thickness of 139.96 m is established above the coal seam (z-direction), and the self-weight of the remaining rock seam (280.14 m) is applied to the upper boundary of the model in the form of load and an aquifer located in the remaining rock seam. The established numerical simulation calculation model is shown in Figure 4.
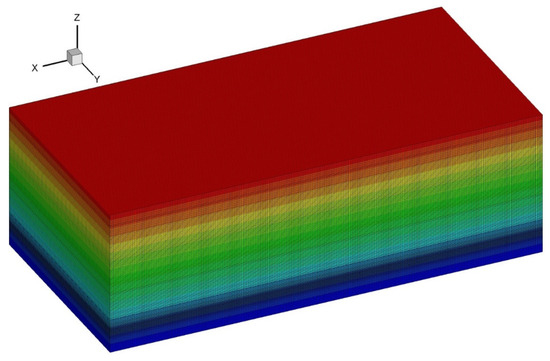
Figure 4.
Numerical simulation model.
The X-direction and Y-direction boundaries of the model limit the displacement and velocity in the horizontal direction; the bottom boundary of the model limits the displacement and velocity in the horizontal and vertical directions; and the top boundary of the model applies a uniform vertical load. The Mohr-Coulomb criterion was chosen as the model damage criterion, and the rock mechanics parameters selected for the model according to the geological data of the mine are shown in Table 4.
Table 4.
Coal rock mechanics parameters table.
5.2. Analysis of the Numerical Simulation Results
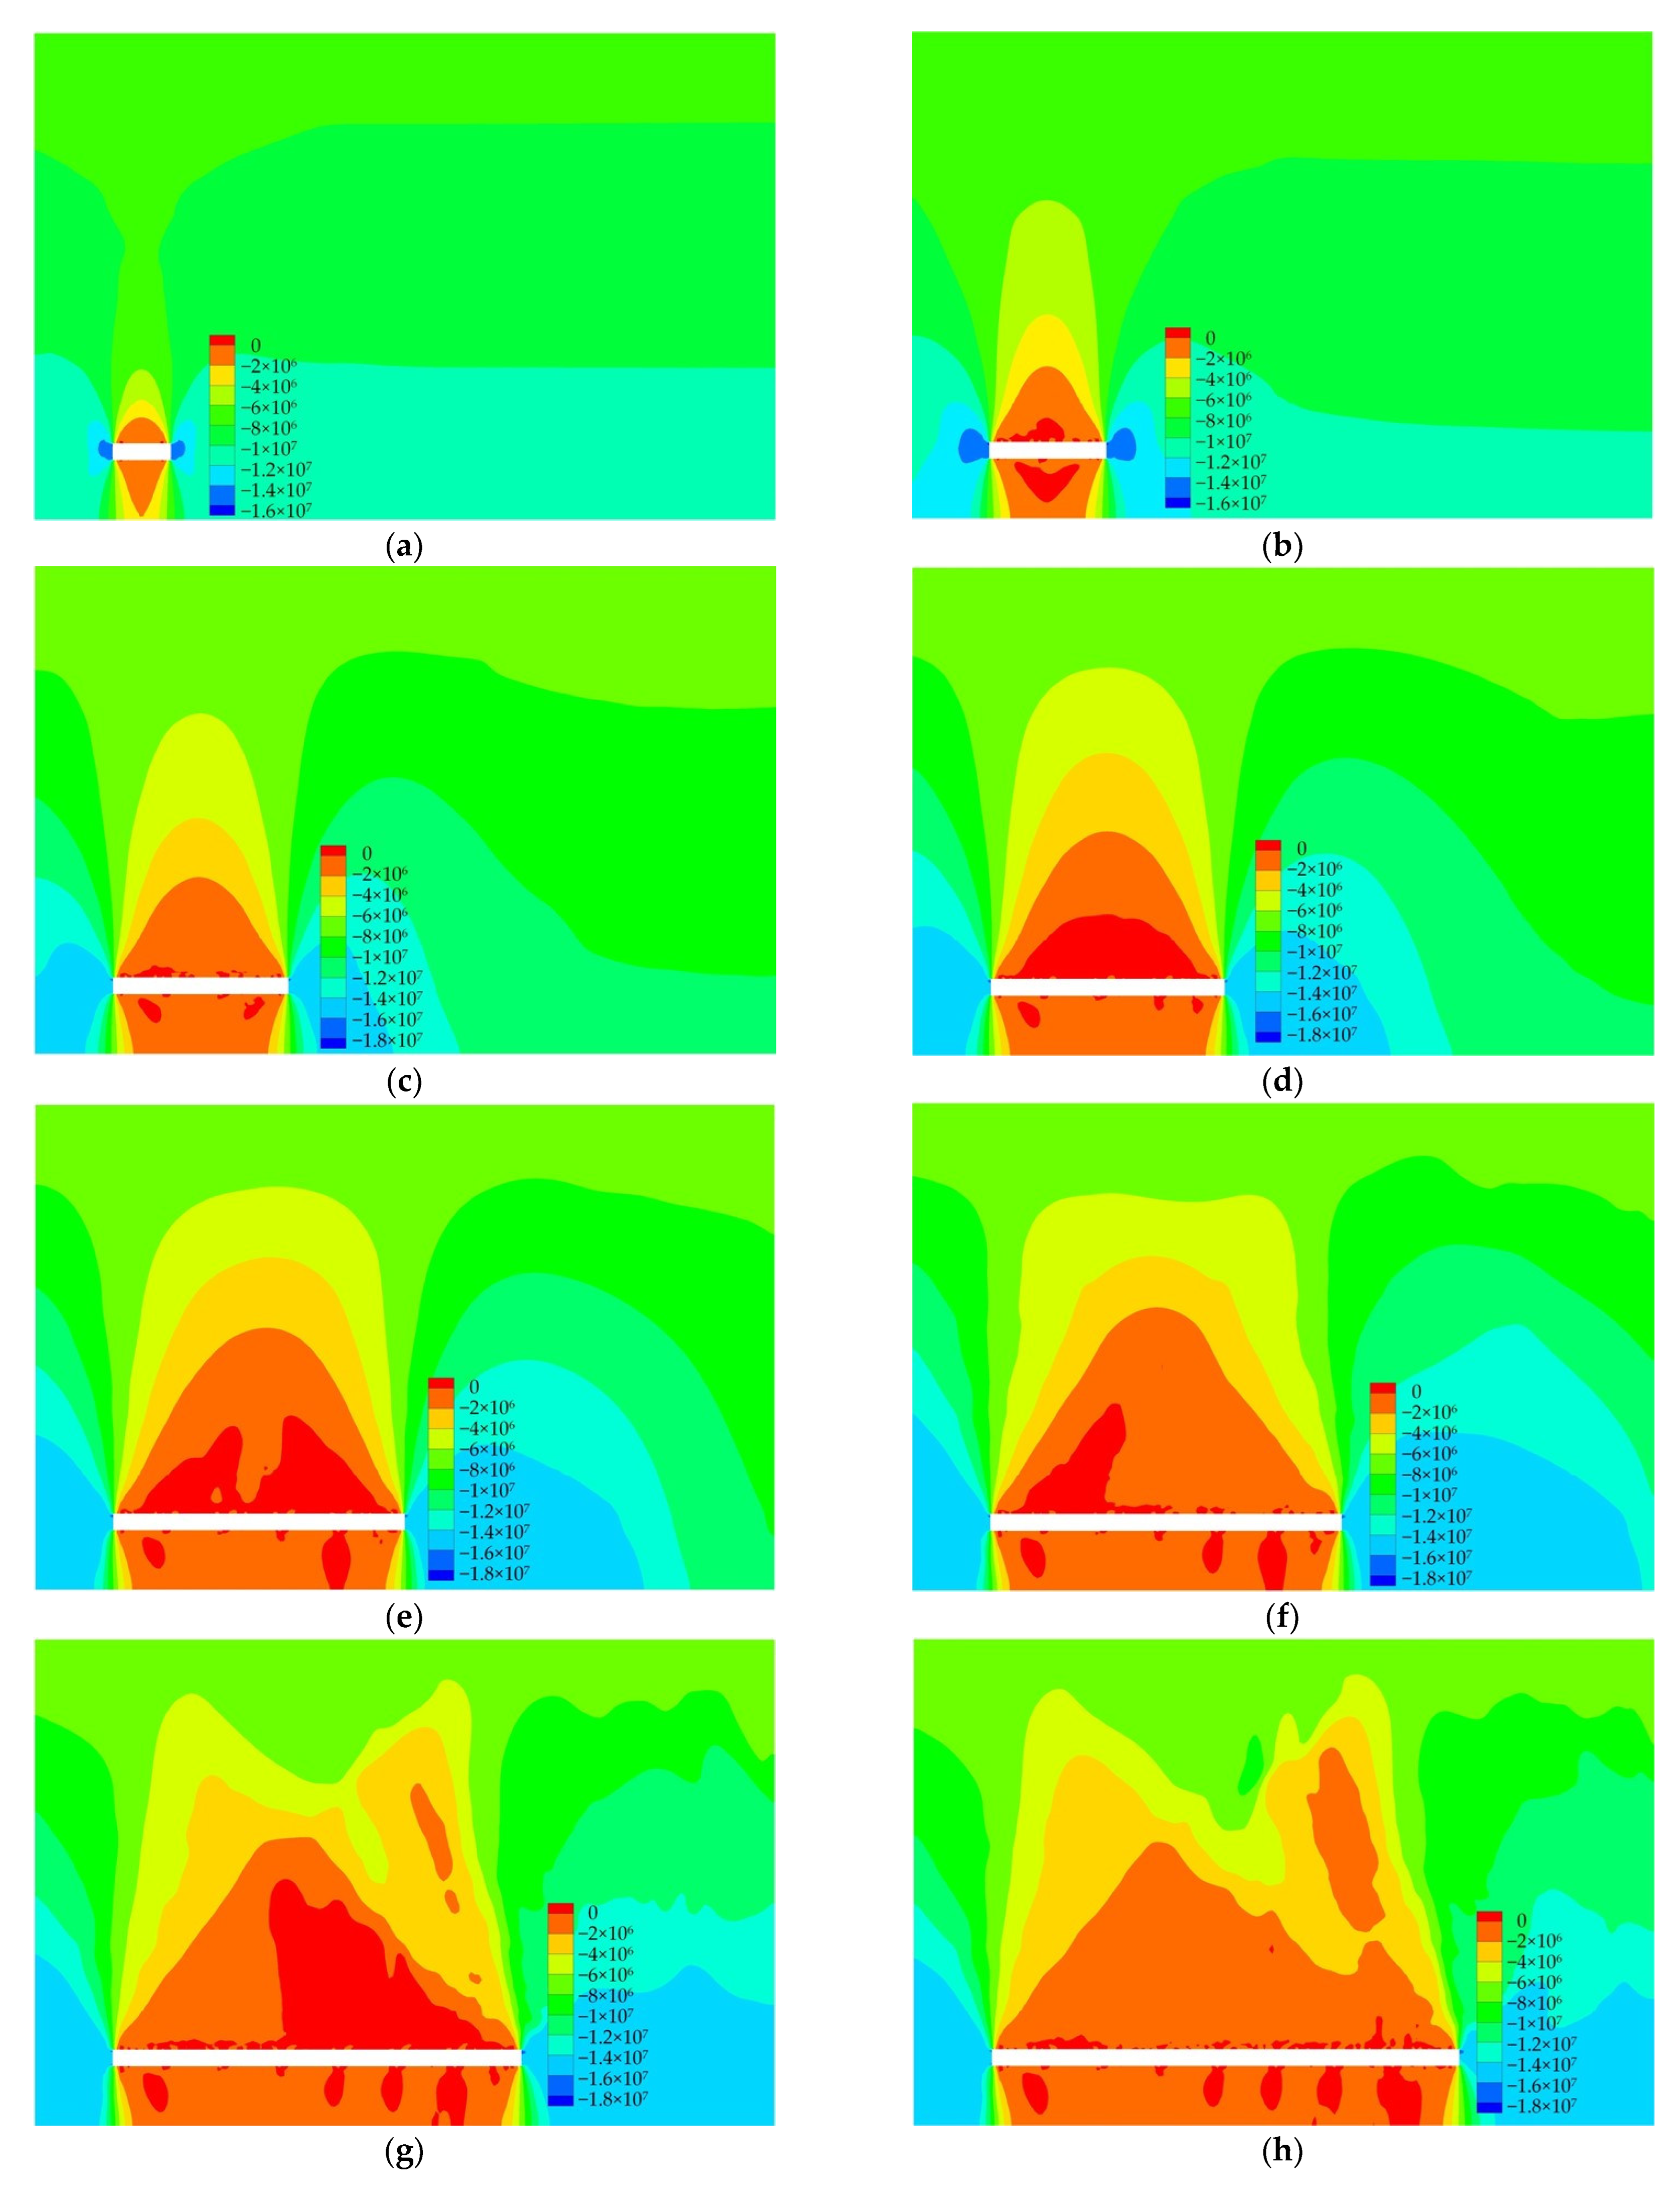
After the model parameters are assigned, the model equilibrium calculation is carried out first. Subsequently, the displacement and velocity of each direction of the model are initialized to obtain the initial equilibrium model. The final analysis is carried out after the simulation calculation is completed. Figure 5 shows the vertical stress distribution at different advancing distances.
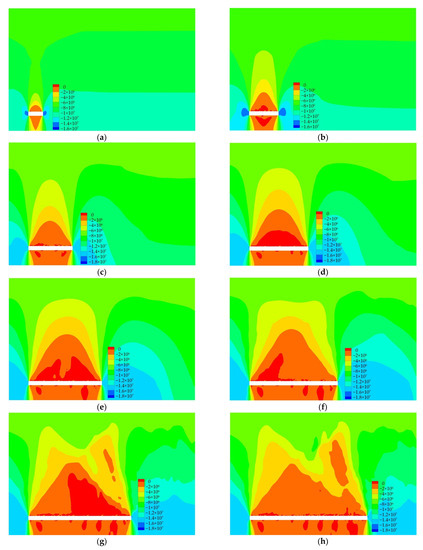
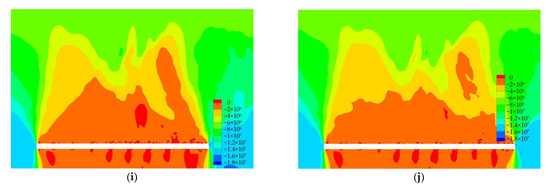
Figure 5.
(a) The working face advanced to 30 m; (b) The working face advanced to 60 m; (c) The working face advanced to 90 m; (d) The working face advanced to 120 m; (e) The working face advanced to 150 m; (f) The working face advanced to 180 m; (g) The working face advanced to 210 m; (h) The working face advanced to 240 m; (i) The working face advanced to 270 m; (j) The working face advanced to 300 m.
As demonstrated in Figure 5, the vertical stress distribution differs when the working face advances to different distances. As the working face gradually advances, the vertical pressure of the overburdened rock in the quarry shows the characteristics of being low in the middle and high at both ends of the coal wall. This is because during the advancing process of the working face, the roof in the middle of the working face is under pressure, then the roof and floor ends of the working face come under pressure. During the stabilization of the overburden rock layer on the working face, the roof in the middle of the quarry gradually collapses and sinks due to the stress. In the process of stress redistribution and stabilization, the overburden rock forms a stable three-hinged arch-bearing structure, and the coal wall is used as a support point to support the overburden rock layer. Therefore, the pressure at the coal wall of the No. 3 coal seam is higher and the stress concentration phenomenon arises. As the working face advance distance increases, the pressure of the roof in the middle of the working face decreases, and the support pressure at the coal wall increases.
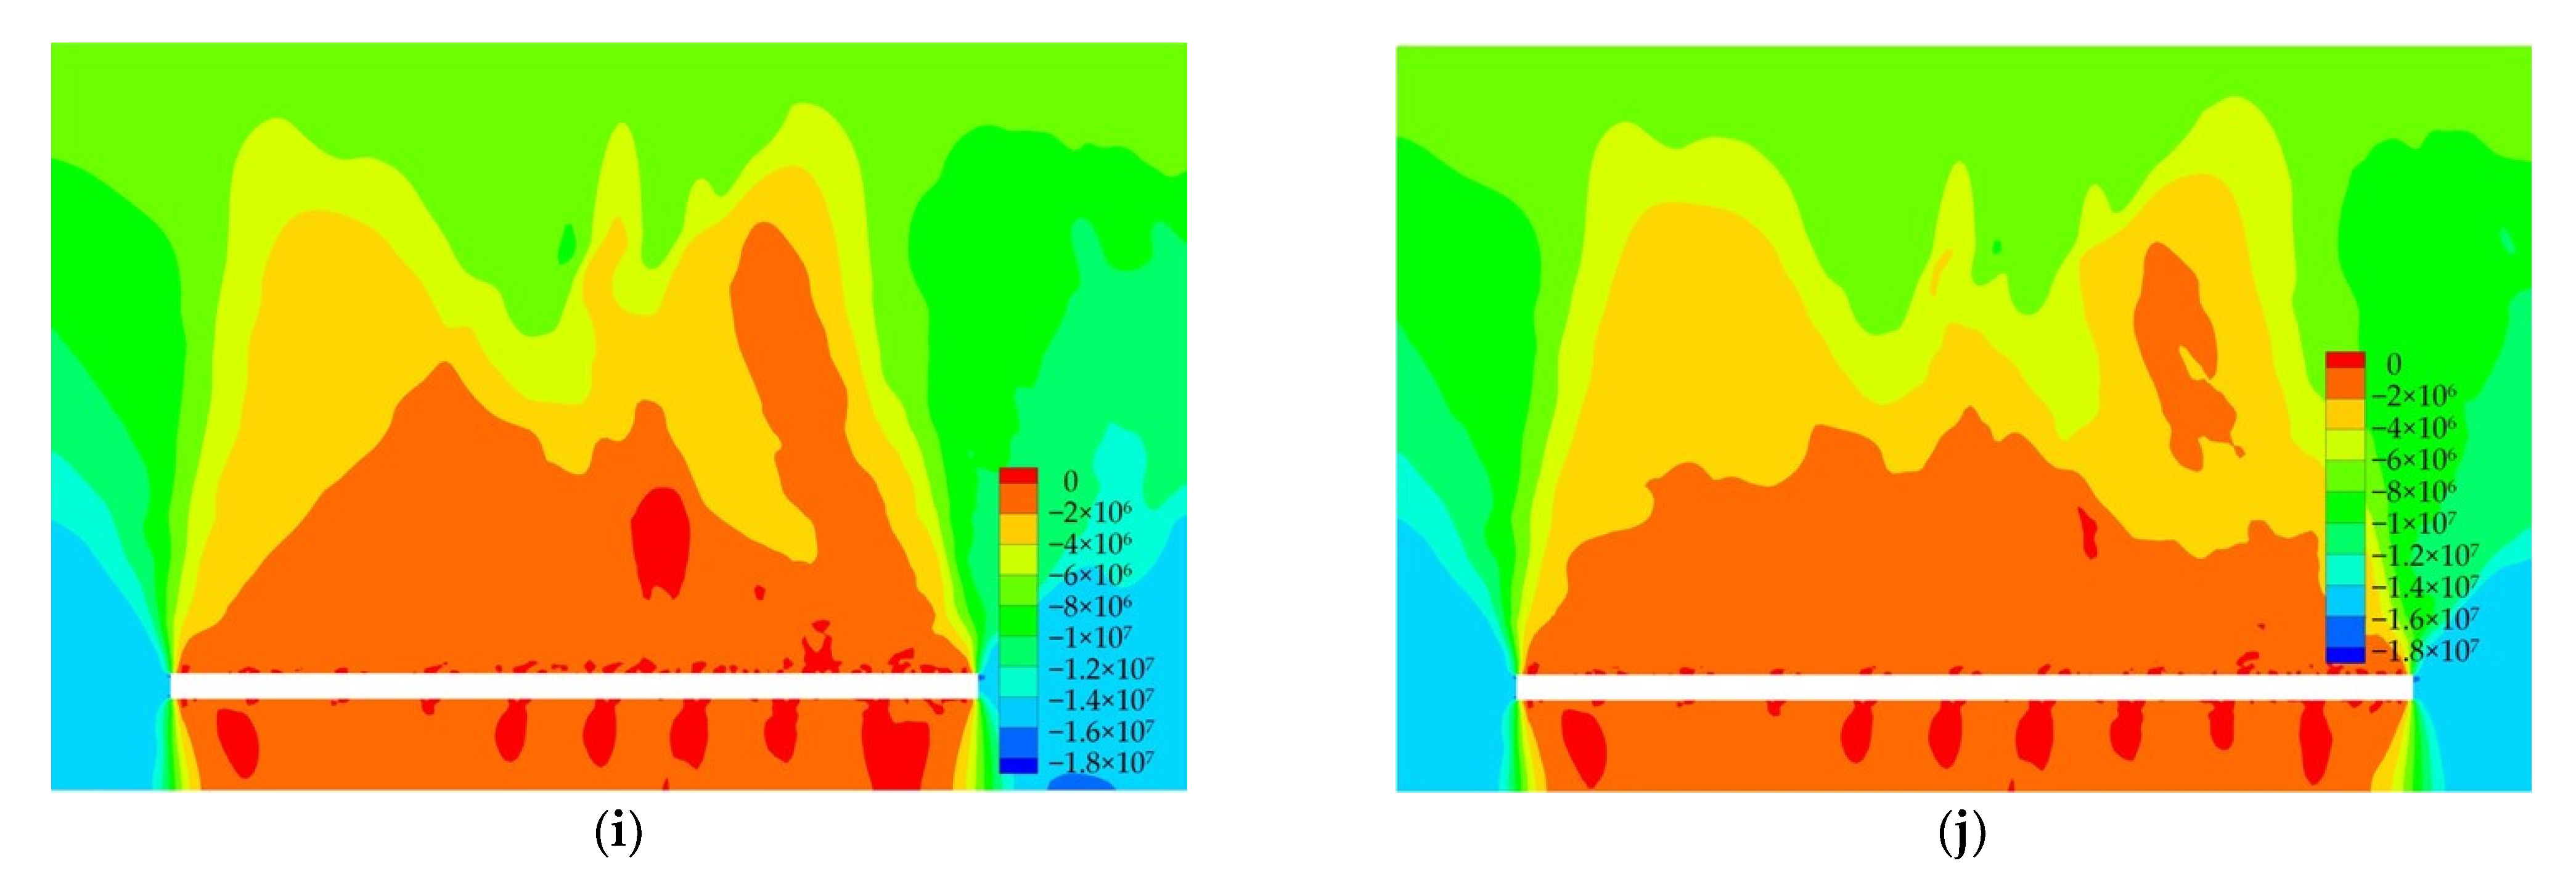
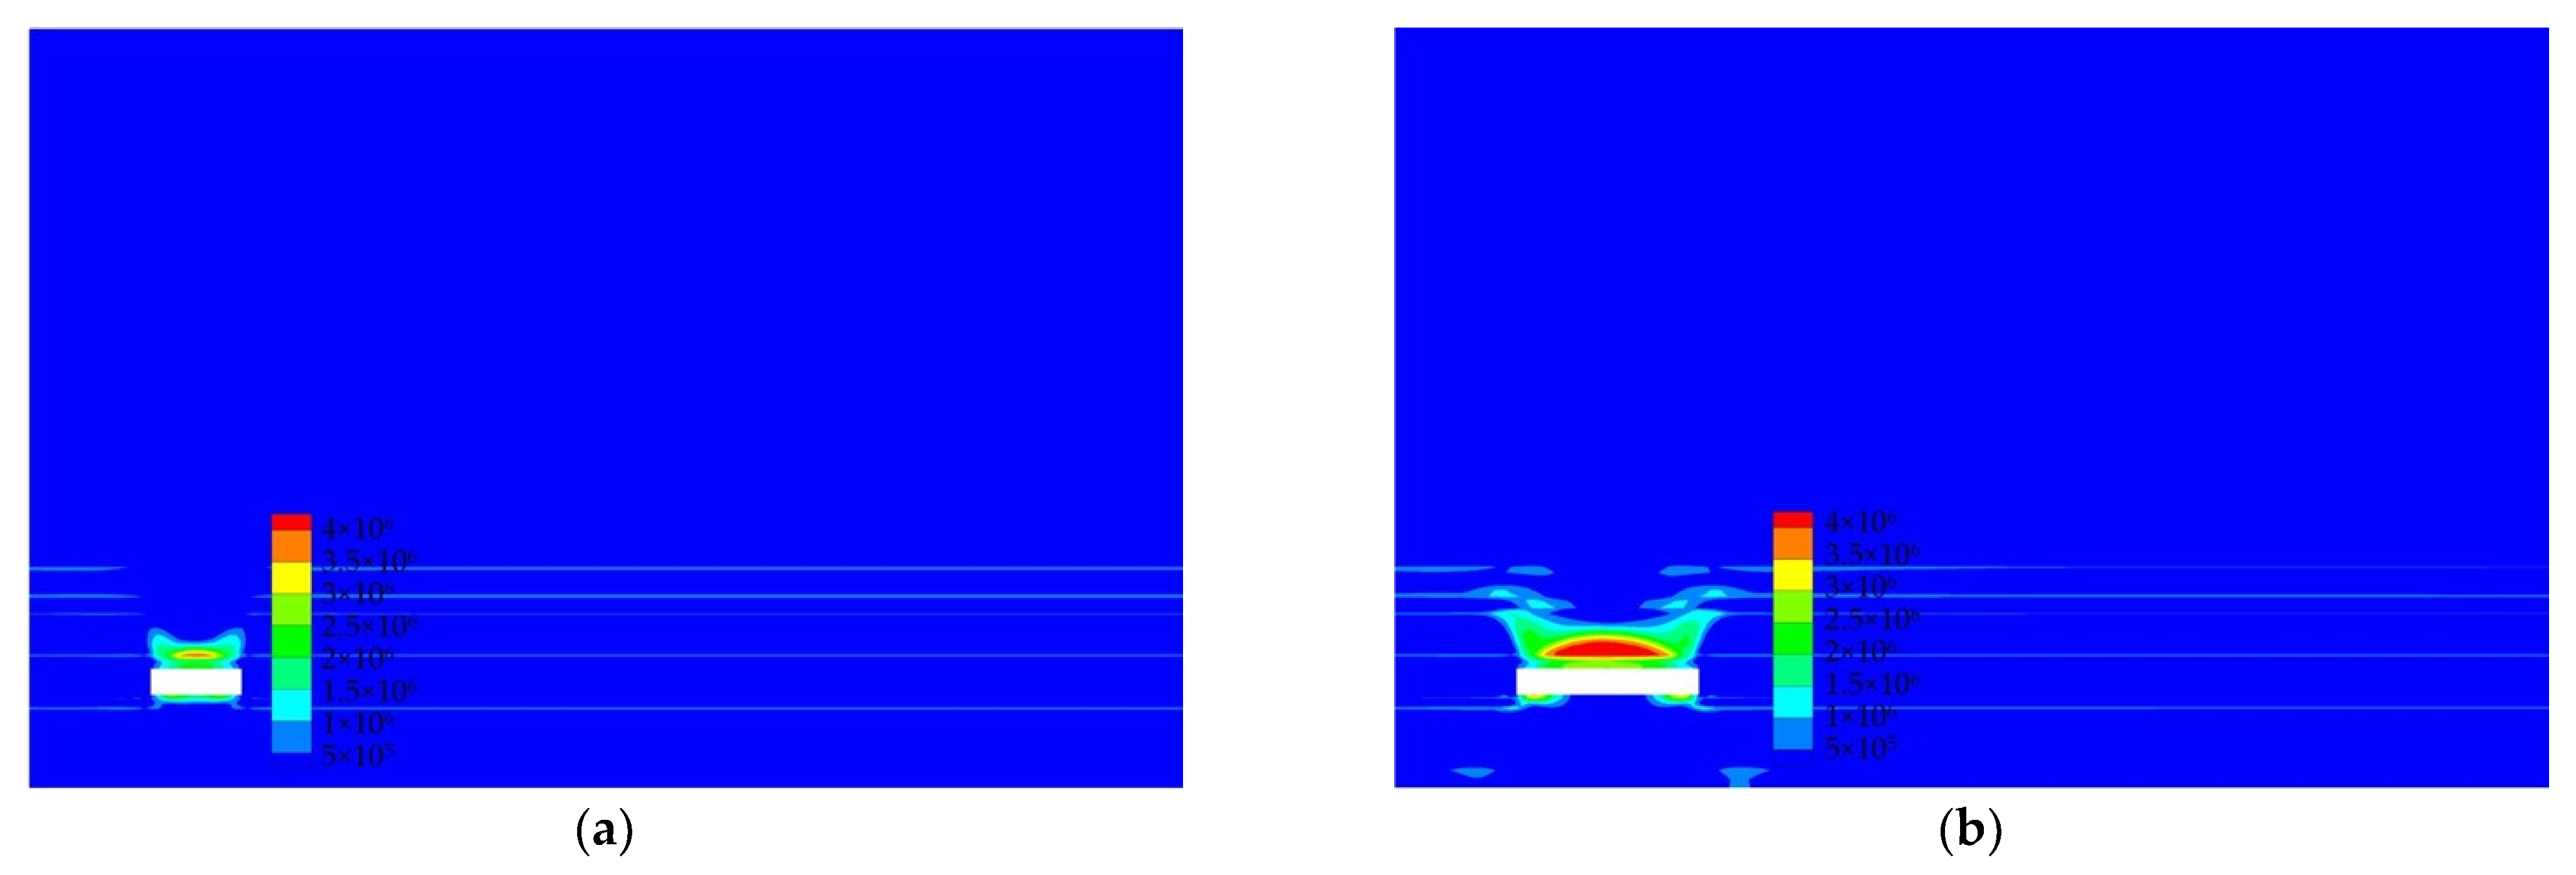
After the completion of workface retrieval, the formation and development of fractures within the rock layer in the water-conducting fracture zone is caused by the bending and sinking of the rock layer [24]. Thus, the development height of the water-conducting fracture zone can be better studied by analyzing the tensile stress distribution characteristics of the overlying rock layer on the workface. Figure 6 shows the distribution of the tensile stress field at different advancing distances.
Figure 6.
Tensile stress field distribution at different propulsion distances. (a) The working face advanced 30 m; (b) The working face advanced 60 m; (c) The working face advanced 90 m; (d) The working face advanced 120 m; (e) The working face advanced 150 m; (f) The working face advanced 180 m; (g) The working face advanced 210 m; (h) The working face advanced 240 m; (i) The working face advanced 270 m; (j) The working face advanced 300 m.
It can be seen from Figure 6 that as the working face advances, the area of tensile stress in the overlying rock layer of the working face gradually increases, which means that the development height of the water-conducting fracture zone of the working face is gradually increasing. When the working face was advanced to 150 m, the height of the tensile stress area was 66.2 m, that is, the height of the water-conducting fracture zone was 66.2 m. When the working face is advanced to 180 m, the height of the water-conducting fracture zone (tensile stress area) was 78.8 m, an increase of 19.04%. When the working face advanced to 210 m, the height of the water-conducting fracture zone (tensile stress area) was 84.3 m, a similar increase of 19.04%. The height of the water-conducting fracture zone increased by 7.06%, and the rate of height development of the water-conducting fracture zone slowed down as the working face advanced. When the working face advanced to 240 m, the height of the water-conducting fracture zone (tensile stress area) was still 84.3 m, indicating that the height of the water-conducting fracture zone no longer increased. As the working face continued to advance (advancing 270 m, 300 m), the height of the water-conducting fracture zone (tensile stress area) remained at 84.3 m. This means that the height of the water-conducting fracture zone formed after the mining of the E2311 working face is 84.3 m.
6. Measurement of the Height of the Water-Conducting Fracture Zone in Working Face
6.1. Observation Scheme Design
The drilling site is arranged at a location around the downhole recovery face, and from this drilling site, elevation holes are drilled into the overburdened rock above the workings. The height of the water-conducting fracture zone is observed by a downhole visualizer, which is a small, low-cost, high precision, and simple method compared with the traditional surface drilling flushing fluid consumption observation method [25,26,27]. The visualizer for the height of the water-conducting fracture zone is composed of a double-ended water shutoff device, pipeline and console, as shown in Figure 7 and Figure 8. A double-ended water shutoff device consists of two capsules and a water injection steel pipe. There are two pipelines, a swelling pipeline and a water pipeline, with corresponding consoles each.

Figure 7.
Visualizer for the height of the water-conducting fracture zone.
Figure 8.
Double-ended water shutoff device.
The average mining height of the E2311 working face is M = 6.5 m, and in general, the height of the cross-fall zone of the rock roof is 3–5 times the mining height, and the height of the water-conducting fracture zone is 10–16 times the mining height. Therefore, it is expected as follows:
Lower limit of the caving zone: Hcl = 3M = 19.5 m
Upper limit of the caving zone: Hcu = 5M = 32.5 m
The lower limit of the water-conducting fracture zone: Hwl = 10M = 65.0 m
Upper limit of the water-conducting fracture zone: Hwu = 16M = 104.0 m
According to the geological conditions, drift conditions and time requirements of the E2311 working face, the position of the drilling field for height observation is located near the JF18 wire point of the air intake crossheading of the E2311 working face. A total of 3 height observation boreholes are designed, and the holes are drilled by the ZYW-3200 coal mine full hydraulic drilling rig with a 94 mm hole diameter. The elements of each borehole are shown in Table 5, and the profile of height observation boreholes is shown in Figure 9.
Table 5.
Working face height observation drilling elements table.
Figure 9.
Height observation borehole layout profile.
6.2. Analysis of the Observation Results
The depth of the borehole is 130 m and the vertical height is 112.6 m. Sectional observation is carried out from top to bottom; that is, from the bottom of the borehole to the orifice, the water injection leakage flow on each section is recorded. The observation results are shown in Table 6.
Table 6.
Leakage of water injection in boreholes. Borehole length is 130 m and inclination α = 60°. The swelling pressure of the capsule is 0.3 MPa, the segmented water injection pressure in the hole is 0.1 MPa, and the water injection pressure = elevation static pressure + 0.1 MPa.
With the hole depth as the horizontal coordinate and the water injection leakage amount as the vertical coordinate, a segmental water injection observation profile is made according to the water injection leakage flow rate from each hole section. Figure 10 shows the observation results of different boreholes.
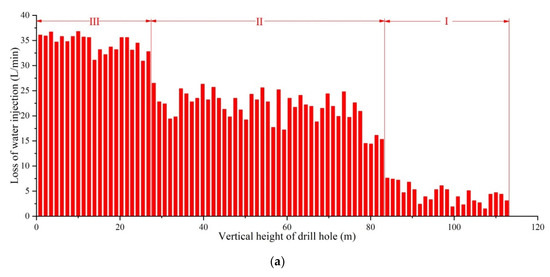
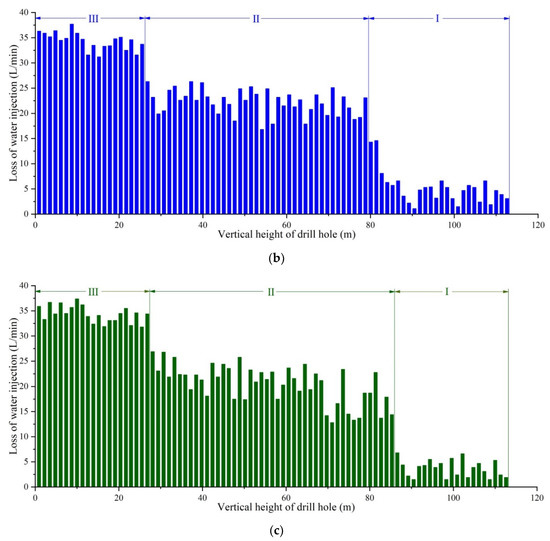
Figure 10.
Borehole observation results. (a) Graph of observation results of borehole 1. (b) Graph of observation results of borehole 2. (c) Graph of observation results of borehole 3.
Comparing Table 6 and Figure 10, it can be concluded that: in the area of section I in drilling, the water injection leakage of the whole section of the rock formation is <10 L/min and the permeability of the rock formation is small. This means that the secondary fractures are not developed in the range of this section of the rock formation, and the primary fractures are mainly in the rock formation. Due to the small permeability of the rock layer, it shows that the drilling in this area is outside the development range of the water-conducting fracture zone, and the drilling has not yet entered the fracture zone area, which can be classified as the bending and sinking zone. As the observation continues downward, the water injection leakage of the rock formation increases sharply in the frilled area of section II, where the water injection leakage is 10–30 L/min, indicating that the drilling has penetrated the fracture zone. In this area, the rock layer is greatly affected by mining, and the secondary fracture produced by the sinking and bending of the rock formation is more developed. Here, the penetration between the fractures is also better, so the water injection leakage of the drilling is larger, and the overall hydraulic conductivity of the rock formation is stronger, all of which belong to the range of the water-conducting fracture zone. As the observation continues downward, in the area of section III drilling, the water injection leakage of the rock layer is larger than that of the fracture zone at a rate of 30–40 L/min, indicating that the drilling has entered the caving zone. Judging from the inflection point of water injection leakage in the three boreholes, the measured height of the water-conducting fracture zone is 84.0 m (1 borehole), 82.7 m (2 borehole), and 86.6 m (3 borehole), respectively.
The observation results of the three boreholes are closer to one another, which shows the accuracy of the observation results of the three boreholes. In the engineering field, the maximum value is often taken as the final result in order to ensure a high safety factor. Therefore, according to the field actual measurement data, the final result of the field actual measurement of the height of the water-conducting fracture zone of the E2311 working face of Gaohe Coal Mine is 86.6 m with a mining thickness of 6.5 m. Thus, the ratio of the water-conducting fracture zone height and the mining thickness after mining of the E2311 working face of Gaohe Coal Mine is 13.32.
7. Discussion
In this paper, we analyzed the overburden layer on the working face according to the practical mine pressure theory and the structural mechanics theory. The overburden was divided into seven rock groups with soft and hard combinations, and the synergistic movement mechanism of the rock groups was analyzed to lay the foundation to study the development of the height of the water-conducting fracture zone of the overburden. Secondly, the analysis showed that the development of the water-conducting fracture zone of overburdened rock gradually developed upward in a step-like manner by the rock formation group, and that the fracture development of each rock formation group is controlled by the movement of the lower hard rock layer. After determining the grouping of the overlying strata of the working face, judging the development height of the water-conducting fracture zone can be transformed into analyzing the deformation and fracture development of several layers of hard rock formations. The size and distribution of fractures were characterized by the tensile deformation of rock formations, and the layer of several hard rock layers was calculated to obtain the inflection point of the change of the stratum’s tensile ratio. We then determined the development height of the water-conducting fracture zone according to the grouping of rock layers. Thirdly, the numerical simulation analysis was carried out by FLAC3D to analyze the distribution characteristics of tensile stress in the overlying strata of the working face, and the development height of the water-conducting fracture zone was determined. Finally, the elevation borehole was constructed at the working face and the height of the water-conducting fracture zone was observed by the downhole visualizer instrument. The research conducted in this paper is based on engineering practices, mechanisms, and theoretical research. Through numerical simulation and field measurement verification, the research objectives of the paper were achieved.
Research on the height of the water-conducting fracture zone in the fully mechanized top coal caving face under the overlying rock combination structure involved grouping of the overburden of the working face. We judged the height of the water-conducting fracture zone by the stratum’s tensile ratio, based on the grouping, and by combining numerical simulations and field measurements. This resulted in a more accurate measurement of the height of the water-conducting fracture zone.
8. Conclusions and Future Works
Firstly, the overlying strata of the E2311 working face are mostly composite rock structures, which can be divided into seven rock groups with soft and hard combinations. The lowermost hard rock layer of each group is the supporting key layer, which drives the upper layers of weaker rock layers to move in a synchronized and coordinated fashion. When the lowermost supporting key layer is bent and broken, the overlying weaker rock layers will move and break at the same time. At this time, the movement of each rock group will be uncoordinated, and the rock group will form a separate layer between them.
Secondly, based on the combination structures of the overburden of the working face, the tensile deformation of the rock strata was used to characterize the size and distribution of the fracture in rock strata. The stratum’s tensile ratio was calculated to obtain the change in inflection point of the tensile ratio value, and the height of the water-conducting fracture zone was determined to be 83.82 m.
Thirdly, the numerical simulation shows that with the advancement of the working face, the development height of the water-conducting fracture zone gradually increases, and as the working face continues to advance, the development speed of the water-conducting fracture zone height slows down and finally maintains steady at 84.3 m.
Fourthly, the height of the water-conducting fracture zone is observed by the downhole height observation instrument. The heights of the water-conducting fracture zone are 84 m, 82.7 m, and 86.6 m, respectively. In order to ensure a higher safety factor, the height of the water-conducting fracture zone observed on the working face was finally determined to be 86.6 m.
Finally, the height of the water-conducting fracture zone in the working face obtained by theoretical calculation, numerical simulation, and field measurement is consistent. In order to ensure a high safety factor, the highest height of the water-conducting fracture zone in the working face after mining was selected at 86.6 m, and the ratio of the water-conducting fracture zone to the mining height thickness was 13.32.
The article analyzes the combination structure and synergistic movement mechanisms of the overlying rock layers on the working surface and characterizes the size and distribution of fractures in the rock formations using tensile deformation based on the overlying rock combination structure. The paper also determines the height of the water-conducting fracture zone based on this. However, only the tensile deformation of the lowermost hard rock layer in the same group has been studied in the paper, and the tensile deformation of the soft rock layer under its control has not been studied. This will be investigated in the next step to make the calculation of the water-conducting fracture zone height more accurate.
Author Contributions
Conceptualization, D.J.; methodology, D.J., Y.T. and W.H.; validation, W.H. and Y.L.; formal analysis, D.J. and Y.T.; data curation, D.J., Y.T. and K.H.; writing—original draft preparation, D.J.; writing—review & editing, Y.T., W.H. and J.L.; supervision, W.H. and J.L.; project administration, D.J. and Y.L.; funding acquisition, D.J. and Y.T. All authors have read and agreed to the published version of the manuscript.
Funding
This research was funded by the Natural Science Foundation of Shandong Province for Young Scholars, No. ZR2021QE176.
Data Availability Statement
Not applicable.
Acknowledgments
We thank the Natural Science Foundation of Shandong Province for its support of this study. We thank the academic editors and anonymous reviewers for their kind suggestions and valuable comments. We thank Shanxi Gaohe Energy Co., Ltd. for providing on-site observation engineering support.
Conflicts of Interest
The authors declare no conflict of interest.
References
- Qian, M.G.; Xu, J.L. Behaviors of strata movement in coal mining. J. China Coal Soc. 2019, 44, 973–984. [Google Scholar]
- National Bureau of Coal Industry. Specification for coal pillar retention and coal compression mining for buildings, water bodies, railroads and major shafts. Beijing Coal Ind. Press 2017. [Google Scholar]
- Li, X.L.; Huang, Q.X. High development characteristics of water flowing fractured zone in fully-mechanized top-caving mining of extremely thick coal seam under water. J. Min. Saf. Eng. 2022, 39, 54–61. [Google Scholar]
- Chen, T.; Liu, W.G. Full-mechanized caving mining height analysis and safety mining technology of supper thinck coal seam with water-rich roof in deep. China Min. Mag. 2017, 26, 107–111. [Google Scholar]
- Ti, Z.Y.; Zhang, F.; Qin, H.Y.; Zhu, Z.J.; Liaoning Technical University. Risk judgment technology of water accumulation in overlying goaf based on plate shell and fracture mechanics theory. Coal Geol. Explor. 2019, 47, 138–143. [Google Scholar]
- Wang, X.Z.; Xu, J.L.; Han, H.K.; Ju, J.F.; Xing, Y.T. Stepped development characteristic of water flowing fracture height with variation of mining thickness. J. China Coal Soc. 2019, 44, 3740–3749. [Google Scholar]
- Guo, W.B.; Lou, G.Z. Definition and distinguishing method of critical mining degree of overburden failure. J. China Coal Soc. 2019, 44, 755–766. [Google Scholar]
- Xu, J.L.; Zhu, W.B.; Wang, X.Z. New method to predict the height of fractured water-conducting zone by location of key strata. J. China Coal Soc. 2012, 37, 762–769. [Google Scholar]
- Huang, Q.X. Research on roof control of water conservation mining in shallow seam. J. China Coal Soc. 2017, 42, 50–55. [Google Scholar]
- Liu, S.; Li, W.; Wang, Q. Height of the Water-Flowing Fractured Zone of the Jurassic Coal Seam in Northwestern China. Mine Water Environ. 2017, 37, 312–321. [Google Scholar] [CrossRef]
- Wu, Q.; Shen, J.; Liu, W.; Wang, Y. A RBFNN-based method for the prediction of the developed height of a water-conductive fractured zone for fully mechanized mining with sublevel caving. Arab. J. Geoscience 2017, 10, 172. [Google Scholar] [CrossRef]
- Gao, Y.-F.; Huang, W.-P.; Qu, G.-L.; Wang, B.; Cui, X.-H.; Fan, Q.-Z. Perturbation effect of rock rheology under uniaxial compression. J. Cent. South Univ. 2017, 24, 1684–1695. [Google Scholar] [CrossRef]
- Skrzypkowski, K.; Zagórski, A.; Zagórska, A. Determination of the Extent of the Rock Destruction Zones around a Gasification Channel on the Basis of Strength Tests of Sandstone and Claystone Samples Heated at High Temperatures up to 1200 °C and Exposed to Water. Energies 2021, 14, 6464. [Google Scholar] [CrossRef]
- Shi, L.-Q.; Xin, H.-Q.; Zhai, P.H.; Li, S.-C. Calculating the height of water-conducting fracture zone in deep mining. J. China Univ. Min. Technol. 2012, 41, 37–41. [Google Scholar]
- Wang, S.F.; Li, X.B.; Wang, S.Y. Separation and fracturing in overlying strata disturbed by longwall mining in a mineral deposit seam. Eng. Geology 2017, 226, 257–266. [Google Scholar] [CrossRef]
- Wang, S.F.; Liu, K.H.; Wang, S.Y.; Liang, Y.T.; Tian, F.C. Three-dimensional stochastic distribution characteristics of void fraction in longwall mining-disturbed overburden. Bull. Eng. Geol. Environ. 2022, 81, 414. [Google Scholar] [CrossRef]
- Guo, W.; Zhao, G.; Lou, G.; Wang, S. A New Method of Predicting the Height of the Fractured Water-Conducting Zone Due to High-Intensity Longwall Coal Mining in China. Rock Mech. Rock Eng. 2019, 52, 2789–2802. [Google Scholar] [CrossRef]
- Zhao, G.B.; Guo, W.B.; Yang, D.M.; Lou, G.; Zheng, D. Study on overburden failure models and height of water flowing fractured zone in fully mechanized caving mining. China Saf. Sci. J. 2017, 27, 144–149. [Google Scholar]
- Huang, Q.X.; Xia, X.G. Division of “four zones” in mining strata and surface movement. J. Min. Saf. Eng. 2013, 33, 393–397. [Google Scholar]
- Xu, J.L.; Wang, X.Z.; Liu, W.T. Effects of primary key stratum location on height of water-conducting fracture zone. Chin. J. Rock Mech. Eng. 2009, 28, 380–385. [Google Scholar]
- Huang, W.P.; Gao, Y.F.; Wang, B.; Liu, J.R. Evolution rule and development height of permeable fractured zone under combined-strata structure. J. Min. Saf. Eng. 2017, 34, 330–335. [Google Scholar]
- Chen, M.; Zang, C.-W.; Ding, Z.-W.; Zhou, G.-L.; Jiang, B.-Y.; Zhang, G.-C.; Zhang, C.-P. Effects of confining pressure on deformation failure behavior of jointed rock. J. Cent. South Univ. 2022, 29, 1305–1319. [Google Scholar] [CrossRef]
- Zuo, J.P.; Zhou, Y.B.; Liu, G.W.; Shao, G.Y.; Shi, Y. Continuous deformation law and curvature model of rock strata in coal backfill mining. Rock Soil Mech. 2019, 40, 1097–1104. [Google Scholar]
- Li, Z.J.; Huang, R.; Wang, Y.Y.; Liang, K. Measurement of “three-belt” growth height of overburden strata in deep work face with large mining height. China Coal 2018, 44, 41–45. [Google Scholar]
- Yan, F. Analysis and field measurement on “three zones” height of overlying strata in gob. Coal Technol. 2021, 40, 54–56. [Google Scholar]
- Zhang, F. Application Analysis of Height Measurement Technology of Roof Water-conducting fracture zone in Fully Mechanized Mining Face. Shandong Coal Sci. Technol. 2020, 38, 161–163. [Google Scholar]
- Huang, W.P.; Li, C.; Zhang, L.W.; Yuan, Q.; Zheng, Y.S.; Liu, Y. In situ identification of water-permeable fractured zone in overlying composite strata. Int. J. Rock Mech. Min. Sci. 2018, 105, 85–97. [Google Scholar] [CrossRef]


Publisher’s Note: MDPI stays neutral with regard to jurisdictional claims in published maps and institutional affiliations. |
© 2022 by the authors. Licensee MDPI, Basel, Switzerland. This article is an open access article distributed under the terms and conditions of the Creative Commons Attribution (CC BY) license (https://creativecommons.org/licenses/by/4.0/).