Article

Research on the Safety of the Left Hard Shoulder in a Multi-Lane Highway Based on Safety Performance Function

College of Automobile and Traffic Engineering, Nanjing Forestry University, Nanjing 210037, China
*
Author to whom correspondence should be addressed.
Sustainability 2022, 14(22), 15114; https://doi.org/10.3390/su142215114
Submission received: 18 October 2022 / Revised: 4 November 2022 / Accepted: 8 November 2022 / Published: 15 November 2022
(This article belongs to the Special Issue Sustainable Transportation Planning and Roadway Safety)

Abstract

:
The left hard shoulder plays an important role in the event of an emergency on the inside of a multi-lane highway, but past studies have not been able to clarify the criteria for its installation or quantify the safety impact of its installation on the left side. In order to study the influence of the left hard shoulder on the safety of vehicles traveling on multi-lane highways, based on past studies that only studied the situation of four-lane highways, this paper firstly constructs a multi-lane highway simulation model under different numbers of lanes based on the VISSIM traffic simulation and uses Surrogate Safety Assessment Model (SSAM) to study the conflict characteristics of multi-lane highway vehicles under different numbers of lanes. Based on the above findings, this paper introduces the Safety Performance Function (SPF) to construct a multi-lane freeway accident prediction model, calibrates the model by adding the indexes affected by the left side hard shoulder to the basic prediction mode, and uses the historical accident data of the Badou-Shihu section of the Guangdong Northern Second Ring Highway as the basis to study the differences in accident rates of the investigated section before and after setting the left hard shoulder. The study showed that the average Time to Collision (TTC) increased by 57.2%, Maximum Deceleration (MaxD) increased by 19.2%, and Delta Speed (DeltaS) increased by 15.3% after setting hard shoulders on the left side of multi-lane freeways, and traffic conflicts on multi-lane freeways were significantly reduced, and safety was improved considerably. In addition, the rear-end conflict rate decreased by 0.17%, 0.75%, and 4.6% after setting hard shoulders on the left side of one-way three, four, and five lanes, respectively, indicating that hard shoulders on the left side are the most effective in improving the safety of one-way five-lane freeways. The accident prediction results show that within the reasonable setting range of the left hard shoulder width (0~4 m), the accident rate decreases by about 1.5% for every 0.5 m increase if only the influence of the left hard shoulder width is considered. Without considering other factors, increasing the width of the hard shoulder on the left side can reduce the number of accidents. This indicates a significant safety improvement for a one-way five-lane highway after setting the hard shoulder on the left side, and the conclusion is consistent with the simulation results. In this paper, based on past research, the research object is extended to one-way three-, four-, and five-lane highways. The findings of this paper can help the road authorities develop specifications for installing hard shoulders on the left side of multi-lane freeways and adopt strategies to improve the traffic safety level of multi-lane freeways. In addition, the models and methods used in this paper can also help build a framework for future intelligent networked vehicle avoidance systems and promote the development of intelligent networked technologies.

1. Introduction

Compared with an ordinary road, with high speed, high capacity, low transportation cost, and good economic efficiency, highways have an essential position in today’s road transportation system [1]. The early construction of highways in China is four lanes in both directions, but with the increasing inter-regional connections and improved traffic conditions, many existing highways can no longer meet the transportation needs. Under the premise of meeting reasonable service level, the one-way configuration of more than three highway lanes is referred to as a “multi-lane highway.” With the growth of car ownership and road traffic demand, the number of new or expanded multi-lane highways will gradually increase [2]. Compared to ordinary highways, multi-lane highways have a higher traffic flow, more complex traffic conditions, and more factors affecting the occurrence of traffic accidents, so safety research in multi-lane highway situations is essential.
The hard shoulder is the part adjacent to the travel lane, also known as the “emergency lane,” “emergency stopping zone,” or “rescue lane” [3]. A hard shoulder of a certain width on a highway can ensure sufficient lateral clearance, and at the same time, the hard shoulder can provide space for a breakdown vehicle to stop safely. Due to the driving habit of driving on the right, the hard shoulder of Chinese highways is set on the right side. However, with the increase in highway lanes, the left shoulder has inevitably been set up. Inevitably, the left and right shoulders do not play the same role. The primary function of the left shoulder is to provide lateral clearance and fault tolerance space for the vehicles traveling at high speed in the inner lane and more comfortable space for the vehicles traveling in the inner lane, in case of an emergency, without crossing multiple lanes, to park on the right shoulder [4], which is beneficial to the overall traffic. This is beneficial to the overall efficiency of traffic operations and prevents the occurrence of severe traffic accidents. Although the highway in China with more than eight lanes has begun to consider the issue of setting the left shoulder, Ref. [5] also have the corresponding provisions: when the highway is set up for eight lanes, the highway should be set up 2.5 m to the left side of the hard shoulder, the left side of the hard shoulder width includes the width of the left curb. Unfortunately, the chinese construction of eight lanes or more of the highway is not set on the left side of the hard shoulder.
In this study, based on the field survey data of the Guangzhou North Second Ring Freeway, firstly, VISSIM simulation software was used to simulate the situation of setting the left hard shoulder for a one-way three-, four-, and five-lane highway section and multivariate conflict analysis were conducted using traffic conflict techniques as a basis for setting the left hard shoulder of the freeway. Based on the above research results, this paper establishes a multi-lane highway accident prediction model based on SPF based on actual accident data to further quantify and analyze the difference in highway safety before and after setting the left hard shoulder.
The remainder of this paper is organized as follows: Section 2 reviews the previous literature. Section 3 presents the methodology and the model, Section 4 presents the modeling results, Section 5 discusses the results, and Section 6 closes with our conclusion.

2. Literature Review

2.1. Study of Left Hard Shoulder on Highway

The shoulder is an essential part of the road. The road design standards and codes worldwide clearly describe the conditions for the placement of shoulders. Compared to the United States and Japan, China’s correct shoulder width is between the United States and Japan. The general value of shoulder width for the same grade road in Japan is 2.5 m, and the minimum value is 1.75 m [6]. The U.S. standard stipulates that both sides of the highway must be provided with the right shoulder at least 3.048 m (10 ft) and preferably 3.66 m (12 ft) when truck traffic exceeds 250 vehicles per hour. On four-lane highways in both directions, the left hard shoulder width is typically 1.22 m (4 feet) to 2.44 m (8 feet). For highways with six or more lanes in both directions, the left-side hard shoulder width is also designed to be at least 3.048 m (10 ft), and when the truck hour traffic volume exceeds 250 vehicles, the shoulder width should preferably be 3.66 m [4,7]. China’s highway code provisions for converting and expanding into eight or more lanes are not mandatory [5]. The fundamental reason for this is that there are no relevant research results as theoretical support, and the driver does not know enough about the functional role of the left shoulder and the current stage of highway design to consider the cost of land and other issues. This will undoubtedly lay a tremendous hidden danger to the future operation safety of highways.
The left shoulder provides lateral clearance for vehicles traveling at a high speed in the inner lane. The space is an emergency lane for rescue vehicles, and at the same time, the left shoulder provides lateral clearance and stage-tolerant space for vehicles traveling at a high speed in the inner lane [3,8]. The lane is also used as an emergency lane for rescue vehicles and as a temporary stopping place for maintenance and repair vehicles in the inner lane to avoid traffic accidents caused by vehicles breaking down or running out of fuel in the inner lane crossing multiple lanes on the right shoulder. Zhong et al. applied the acceptable clearance theory [6] and traffic simulation methods [9] to analyze the necessity of setting the hard shoulder on the left side in terms of both operational efficiency and traffic safety. Angela E. Kitali et al. [10] studied the effect of left shoulder width on the safety of the innermost lane and found that broader shoulders significantly reduced the accident rate of the innermost lane. Kay Fitzpatrick et al. [11] found that broader shoulders increased the speed of the inner lane. Jiaqi Ma et al. [12] showed that the dynamic use of temporary hard shoulders could increase the speed of the inner lane. The dynamic use of hard shoulders can increase highway capacity during congestion. Liu et al. [13] tested the effects of edge shoulder width on driving behavior for a three-lane underground urban highway. Three shoulder widths (0.50, 0.75, and 1.00 m) were studied. Driving speed, lane deviation, and subjective perception of driving behavior were collected as performance measures. The results show that shoulder width has significant effects on driving speed. Ben-Bassat et al. [14] analyzed the effects of shoulder width, guardrails, and roadway geometry on driver perception and behavior using a driving simulator.
With the introduction of traffic engineering psychology, some scholars began to explore the roadside design of highways from the perspective of drivers’ raw psychology. Zhao et al. [15] used driving simulation to obtain the driver’s heart rate and angular velocity of eye movements at different left shoulder widths as indicators reflecting drivers’ biopsychological changes, analyzed the impact of the left shoulder on safety, and proposed recommended values for the left hard shoulder of multi-lane highways.

2.2. Highway Accident Prediction Methods

In order to draw lessons from past road traffic accidents, many scholars collect data from past accidents, model them based on characteristics and influencing factors, and predict possible future accidents to prevent and take rescue measures for traffic accidents more effectively.
In terms of traditional model applications, Dominique Lord et al. [16] analyzed the Poisson, negative binomial, and zeroed stacking models for the model selection problem of Poisson series models and proposed the applicability conditions of each of these models. The Poisson series model was used by Ciro Caliendo et al. [17] to analyze traffic accidents on Italian multi-lane roads and concluded that curve length, radius, and AADT (Annual Average Daily Traffic) significantly affect accident generation on curved sections, straight length, AADT, and structures significantly affect accident formation on straight sections, and the wet pavement has a higher hazard; Girma Berhanu [18] used Poisson and harmful binomial regression methods to predict the traffic accident rate by analyzing traffic accident data on arterial roads in Ethiopia and obtained the Poisson and harmful binomial regression methods. John N. Ivan et al. [19] used the Poisson regression model to predict the accident rate of single-vehicle and multi-vehicle accidents and found that they had significantly different variables; Qadeer Memon et al. [20] compared generalized linear, Poisson distribution, and negative binomial distribution to model accident prediction and found that increased traffic and road length lead to more accidents; Salvatore Cafiso et al. [21] investigated the data by using road geometry alignment as one of the critical considerations for different levels of detail data, using generalized linear regression methods to establish three different for accident prediction.
Some scholars believe that traditional models have more drawbacks in accident prediction, cannot meet the requirements for accuracy in accident prediction, and use new methods for accident prediction. Qi et al. [22] argue that traditional accident prediction models (Poisson and negative binomial distributions) do not have high prediction accuracy because of the discrete distribution of accident data due to random factors. They consider the weather and traffic volume, and Karim El-Basyouny et al. [23] argue that traffic volume is one of the critical variables in traditional traffic prediction models, and the traffic volume measurement is often inaccurate, limiting the prediction accuracy. The authors then propose a traffic accident prediction model for when there is a significant measurement error in traffic flow parameters to address this problem. Nataliya V. Malyshkin et al. [24] classified road states into “safe” and “hazardous” and assumed that these two states are interchangeable, and used a Markov chain, negative binomial model, to predict the number of accidents and compared it with the standard negative binomial model. Li et al. [25] used the support vector machine model (SVM) or accident prediction for data with different sample sizes, and compared the traditional negative binomial model and BP neural network model, and found that the SVM model outperformed the negative binomial model in terms of prediction accuracy and outperformed the Back Propagation Neural Network (BPNN) model in terms of computation speed with the same accuracy, and the SVM was especially suitable for accidents with observations less than SVM is particularly suitable for accident prediction when the number of observations is less than 2000 (sample size). Mohammad Kermanshah et al. [26] used a nested Logit probability model to predict rollover and casualty accidents. The elasticity analysis results showed that lighting conditions, number of lanes, road conditions, drunk driving, and fatigue driving were the prominent factors leading to such accidents; Chao Wang et al. [27] proposed a two-stage mixed multivariate model for the prediction analysis of accidents with different severity levels. This model is particularly suitable for low-frequency traffic accidents. Li et al. [28] developed a traffic accident time series and an ARMA (autoregressive moving average) prediction model by mining the monthly occurrence of road dangerous goods transportation accidents from 2013–2019, so as to predict the missing data of road dangerous goods transportation accidents in China in the first quarter of 2020 due to the epidemic. Lim [29] used a ZTNB (zero-truncated negative binomial) model and an ANN(artificial neural network) model to analyze the frequency of railroad accidents and their corresponding distribution of casualties for the Korean National Railway accident dataset from 1995–2021, and the results showed that the neural network model outperformed the ZTNB model in terms of fitting and prediction, proving that the neural network outperformed the statistical model in predicting accident frequency and the number of casualties. Gao et al. [30] compare the predictive performance of CNN (convolutional neural network) models with the most commonly used machine learning methods and propose a model with better predictive performance based on deep learning to enable more accurate prediction of accidents at highway-railway grade crossings.
Scholars have conducted a great deal of research in recent years on the methods of highway accident prediction. Kirolos Haleem et al. [31] used multiple adaptive regression splines to develop CMFs (crash modification factors) for median width, and inner and outer shoulder widths for “total” and “fatal and injury” (FI) crashes. In addition, CMFs were developed for the two most common types of collisions, rear-end collisions and side-impact collisions, for which the identified influencing variables included inner and outer shoulder widths, median width, lane width, traffic volume, and shoulder type. It was hypothesized that a 2-foot increase in the outer and inner shoulders (from 10 to 12 feet) resulted in a 10% and 33% reduction in FI crashes, respectively. Lord D et al. [32] selected eight road geometric line index variables of highways as input variables and screened out the influence of the highway accident prediction model improved by identifying accident black spots. Radhika Bamzai et al. introduce and apply an Empirical Bayesian (EB) analysis methodology for assessing highway shoulder paving impacts using Illinois data. [33]. Many reports collected data, including a wide range of freeway geometric design features, traffic control features, traffic characteristics, and crash records for freeway segments, ramp segments, and intersection ramps. These data are used to calibrate predictive models, including a safety performance function and several crash correction factors, to predict the number of highway crashes [34,35].

2.3. Summary

In summary, the quantitative study of the safety of the left side of the hard shoulder on highways has been carried out mainly from the psychological point of view of drivers or through theoretical deduction of the necessity of setting the left side of the hard shoulder. Currently, there is a lack of accident prediction models to predict and analyze the safety of highways under the influence of the left hard shoulder. In the general trend of highway expansion, it is necessary to use historical accident data to predict the safety change after setting the left hard shoulder. Since the conditions for setting the hard shoulder on the left side of the highway are not yet clear, there is still much room for research on the conditions under which the safety improvement can be maximized by setting the hard shoulder on the left side.

3. Materials and Methods

3.1. VISSIM Simulation Model

Theoretically, a simulation model for the safety assessment should reproduce driver behavior more accurately than a model used for traffic operation analysis [36]. This study used the widely used microsimulation package VISSIM to develop the simulation models. VISSIM is a microscopic, time-step, and a driving behavior-based simulation modeling tool for simulating intra-city traffic, extra-city traffic, and pedestrian flows, suitable for traffic development planning, road network capacity analysis, traffic management, and control, as well as public transportation, and pedestrian simulation, etc.

3.1.1. Traffic Simulation Model Calibration

The driving behaviors of vehicles on the highway include car following and lane changing, and the parameters affecting the car following status in VISSIM include maximum forward and maximum rear-view distance. In contrast, the parameters affecting the lane-changing status include maximum deceleration speed, minimum headway time distance, and safety distance discount factor. Considering the current state of vehicle travel on the highways, the maximum forward and maximum rear view distance, the minimum reaction time, maximum deceleration, and the minimum headway are considered five major sensitivity parameters in the simulation model. Therefore, for simplicity, these five parameters are selected to be calibrated based on the observations from the Badou to Shihu section located in the Guangzhou North Second Ring Highway. Note that these observation data consist of the vehicle driving speed, road traffic flow, and road capacity.
The calibration of the simulation model parameters in this paper is mainly based on the following framework [37]:
min α , β f ( M s i m )
Possibly subject to the following constraints:
l α , i α i φ α , i , i = 1 , 2 , , m α i α j , i j l β , i β i φ β , i ,   i = 1 , 2 , , m β i β j , i j
where α i , β i are the vectors of continuous and discrete decision variables potentially belonging to m different classes of simulation subjects (e.g., different vehicle classes in the traffic microsimulation). f ( · ) is the objective function (or fitness or loss function) to be maximized, which is a function of the vector of the simulated traffic measurements M s i m . l α , i , φ α , i , l β , i , and φ β , i are the lower and upper bounds of model parameters. For the simulated traffic measures M s i m = S ( D 1 , , D H , T S , α 1 , , α m , β 1 , β m ) . The microsimulation model represents the vectors of traffic flows departing in the interval h and T S is the vector of the transportation supply system characteristics.
In the case of model calibration, (1) becomes:
min α , β f ( M o b s , M s i m )
where the objective function to be minimized, i.e., f ( · ) , measures the distance between the simulated and the observed traffic measurements M o b s , and the decision variables of the model are the parameters to be calibrated.
The optimal values of these five parameters could be determined using the optimization framework by minimizing the errors between the simulated traffic flow characteristics and field data. With the observations from the field survey, the calibrated values for the maximum forward, the maximum rear-view distance, the minimum reaction time, the maximum deceleration, and the minimum headway are 250 m, 150 m, 1.0 s, −3 m/s2, and 0.5 s, respectively. The F-test result shows that the simulated road traffic flow distribution closely matches the field observations. In addition, the mean percentage error between the simulated road capacity and the observed capacity is 0.05. This implies that the calibrated VISSIM simulation model could replicate the real-world highway traffic in Guangzhou North Second Ring Highway.

3.1.2. Simulation Model Parameters Selection

Guangzhou North Second Ring Road is located in the northern part of the central city of Guangzhou, passing through Baiyun District and Huangpu District, and is the common section of the national highway network Shenyang–Haikou Highway (G15) and Beijing–Hong Kong–Macao Highway (G4). Guangzhou North Second Ring Highway starts from the Huocun interchange with Guangzhou–Shenzhen Highway, connects with East Second Ring Highway, turns west via Luogang and Changping, and passes through Taihe, Renhe, Jianggao, and other towns and streets, then intersects with Guangzhou–Qingdao Highway at Longshan interchange, and connects with West Second Ring Highway; the total length of the route is about 38.5 km. In this paper, the traffic organization of the Badou to Shihu sections, which is relatively simple, is chosen as the object of study to calibrate the simulation parameters. The Badou to Shihu sections featured three lanes in each direction, with a length of 11.6 km and a lane width of 3.5 m. The lane dividers on the road section were set as dashed lines, in which lane-changing was allowed. Figure 1 shows the location of three lanes for a specific travel direction. Among them, the direction of vehicle travel is from left to right.
As for traffic flow parameters, the design speed of the Badou to Shihu sections was set as 80 km/h. Furthermore, according to the observation data, the one-way road traffic flow during off-peak hour periods is between 3000 pcu/h and 4500 pcu/h, while the one-way road traffic flow during peak hour periods ranges from 4500 pcu/h to 14,000 pcu/h. Therefore, this paper set 4500 pcu/h as the one-way total input traffic volume of the road section.
The parameters in the simulation were calibrated and determined according to the data in the above section and the calibration method in Ref. [38]. Based on the calibration results, the driver’s reaction time is around 600 ms, and with the transfer delay of the vehicle braking system, the total reaction time for the driver takes a value of 1 s in general.
The following model in the vissim simulation software is usually adopted from the physiological–psychological driving behavior model established by Wiedemann in 1974. The model is based on the principle that during vehicle following, the driver of the rear vehicle perceives the safety distance and speed of his own vehicle from the front vehicle to form a cyclic iterative process of acceleration and deceleration of the rear vehicle. The model applies perceptual thresholds to vehicle driving behavior and defines four different vehicle-following states in the vehicle following model: free driving, approaching, following, and braking. Proposed by Wiedemann 99 in 1999, the core remains the physiological–psychological driving behavior model, but differs in the calculation of thresholds, which are usually used to represent highway vehicle driving characteristics [39]. Since the research object of this paper is a highway, the Wiedemann 99 following model is used and the vehicle is free to change lanes.
In addition, this paper intends to use the low-speed car to simulate the vehicle with failure, according to Ref. [40] for the division of the low-speed car, take that the low-speed car speed is 50 km/s. According to the actual investigation of the accident data statistics, this paper will be set to 0.01 of the proportion of the faulty car. At this time, the ratio of small cars, large trucks, buses, and faulty cars is 0.8:0.11:0.08:0.01.

3.2. SSAM Model

SSAM (Surrogate Safety Assessment Model) is based on a study conducted by Gettman and Head in 2003 to extract safety assessment metrics from existing microscopic traffic simulation models. This study creatively proposed a definition of conflict in simulation and investigated the selection of conflict analysis metrics and how to calculate conflict evaluation metrics based on the vehicle trajectory files output from the simulation model. The simulation conflict analysis is a complete process, including establishing the simulation model of the research object, running the simulation model, outputting the vehicle trajectory file, and performing conflict analysis on the trajectory file, whose workflow is shown in Figure 2. The simulation conflict analysis software SSAM identifies and classifies the simulation conflicts according to the vehicle trajectory file to achieve the purpose of indirect safety evaluation of the research object.
The SSAM simulation conflict analysis process is:
(a)
Establish a grid covering the simulation range and project the vehicle trajectory file onto the grid; this file contains information such as vehicle speed and acceleration.
(b)
Set the TTC threshold, and based on this simulation conflict discriminator, calculate the distance the vehicle can run when traveling at the speed before deceleration, and project it onto the vehicle trajectory in segments.
(c)
Compare the projected trajectories of different vehicles, and if there is an intersection point, there is a conflict.
When SSAM performs simulation conflict classification, the first step is to consider the location information of the vehicles: if the conflicting vehicles always drive in the same lane of the same roadway during the conflict, then the conflict is defined as lane change conflict; if the roadway changes during the conflict, then the conflict type classification is based on the conflict angle. As shown in Figure 3, the conflict angle is the angle between the front ends of the conflicting vehicles, and the conflict angle varies between 0° and 180°. The conflict angle of tailgating conflict is between 0° and 30°; the conflict angle of lane change conflict is between 30° and 80°; the conflict angle of crossover conflict is between 80° and 180°. In the multi-lane simulation model, there is mainly tailgating conflict and lane change conflict

3.3. Muti-Lane Highway Accident Prediction Model Based on SPF

3.3.1. Model Construction

Several commonly used accident prediction models include time series, regression prediction models, gray prediction models, and related machine learning models. The safety performance function (SPF) in the multi-lane highway accident prediction model is derived from the “Highway Safety Manual” (HSM). The model first introduces the accident correction factors (CMFs) for different traffic and road conditions and then determines the correction factors based on the differences between the prediction models in space and time to predict future accidents. The expression of the multi-lane highway accident prediction model is shown below:
N s p f , f s , n , a t , a s = N s p f , f s , n , m v , f i + N s p f , f s , n , s v , f i + N s p f , f s , n , m v , p d o + N s p f , f s , n , s v , p d o
N p = N S P F x × ( C M F 1 x × C M F 2 x × × C M F y x ) × C x
where
N s p f , f s , n , y , z = The predicted average accident frequency of n-lane highway sections under benchmark conditions. Among them, y represents the accident type ( s v means a single-vehicle accident; m v means a multi-vehicle accident; a t means all types of accidents on the roadway) and z indicates accident severity ( f i means the number of casualties; p d o means property losses; a s means the severity of all types);
N p = Predictive models estimate the number of incidents for a given year at a location type x ;
N S P F x = Predicted average number of accidents for the identified SPF base condition representing location type x ;
C M F y x = Accident correction factor for location type x ;
C x = Correction factors for regional conditions according to location type x .
The expression of the safety efficiency function SPF is shown below:
N s p f , f s , n , a t , z = L × exp ( a + b × ln [ c × A A D T f s ] )
where
N s p f , f s , n , a t , z = The multi-vehicle predicted the average accident frequency of the n-lane freeway section under the baseline conditions;
L = Effective length of the highway section;
a , b = Regression coefficients;
c = AADT scale factor.

3.3.2. Model Correction Factors

In the multi-lane highway accident prediction model, the influencing factors include flat curve length, lane width, inner hard shoulder width, median width, median length, large traffic volume share, outer hard shoulder width, shoulder vibration belt length, lateral residual width, and outer guardrail length. This paper introduces the basic accident rate correction coefficient based on the historical data of roads and facilities to establish the accident prediction model. The multi-lane highway accident correction factors are shown in the following Table 1.
By integrating the prediction Lane Change model estimates and the observed accident frequencies, it can be used to estimate the expected accident frequencies for a specific location. For a single road segment, the expected average accident frequency considering the combined prediction model estimates and observed accident frequencies is calculated as follows.
N exp e c t e d = w × N p r e d i c t e d + ( 1 w ) × N o b e r s e v e d
w = 1 1 + k N p r e d i c t e d
where
N exp e c t e d = Estimates of the expected average accident frequency over the study period;
N p r e d i c t e d = An estimate of the average accident frequency of the prediction model during the study time period for a given condition;
N o b e r s e v e d = Observed accident frequency at the location during the study time period;
w = Adjustment of the weights of the prediction model estimates;
k = Overdispersion parameter when using the associated SPF estimation.
In order to obtain a value for the desired average incident frequency for a future time period, further calibration is required. Differences in the time periods before and after the project, increases or decreases in AADT, and changes in alignment design or traffic control characteristics can affect the predicted results.
N f = N p ( N b f N b p ) ( C M F 1 f C M F 1 p ) ( C M F 2 f C M F 2 p ) ( C M F n f C M F n p )
where
N f = The expected average accident frequency of accidents predicted for the road section in the future time period;
N p = Desired average accident frequency of observed historical accident data available for past time periods;
N b f = The number of accidents predicted by the SPF using future data and nominal values;
N b p = The number of accidents predicted by the SPF using past data and nominal values;
C M F n f = Value of the n th CMF for the geometric conditions of the future planned road;
C M F n p = Value of the n th CMF under the geometric conditions of the past (current) planned road.

4. Results

4.1. Conflicts Analysis

The traditional road safety evaluation method defined by accident rate relies on existing data. However, since traffic accidents are accidental, accident data are challenging to obtain through conventional observation. For both expansion projects and new projects, accident data are not available. In this regard, Peterson [41] defines a traffic conflict as “a collision that occurs when multiple vehicles or other objects on the road approach each other in space and time during normal driving, if they continue in their current state of motion.”
There has been an increasing number of studies using traffic conflicts to some extent instead of traffic accidents to conduct safety analysis and evaluate roads. Guo et al. [42] compared simulated and field-measured conflicts for assessing the safety of two signalized intersections in Australia, and their results revealed a positive relationship between these two kinds of conflicts. Based on microscopic traffic simulation technology, Ma et al. [43] introduced the HCRI (Hourly Conflict Risk Index) to establish a traffic conflict prediction model for highway diversion zones and calculated the TTC (time-to-collision) for tailgating and lane-change conflicts to study the safety impact of vehicle trajectories on freeway diversion zones. Ge et al. [44] studied the traffic characteristics and traffic conflicts in the maintenance operation area of the outer closed lane of a four-lane highway in both directions. Based on the improved TTC model, the traffic conflict severity of the highway maintenance operation area is divided.
Drawing on the safety evaluation method in SSAM, this paper uses TTC to measure the conflict event, which is defined as the remaining time until a collision occurs between two vehicles in front and behind while maintaining the same travel speed as a measure of the potential collision risk of a vehicle.
T T C = d 1 2 l f 1 2 l s v s v f  
where the subscript s represent the target vehicle under study, f represents the vehicle in front of the target vehicle, d is the distance between the target vehicle and the vehicle in front, l is the length of the vehicle, and v is the instantaneous speed of the vehicle. The default 1.5 s in SSAM is used as the threshold value, and a TTC less than the threshold value is considered a conflict between the target vehicle and the vehicle in front. Accordingly, the number and accident rate of highway accidents for three, four, and five lanes are counted, and the results are shown in the following Table 2.
According to the change of conflict book and conflict rate, it can be found that the safety improvement of the three-lane highway with or without the left hard shoulder setting is small, which is also consistent with the recommended setting conditions of the left hard shoulder proposed by the specification.
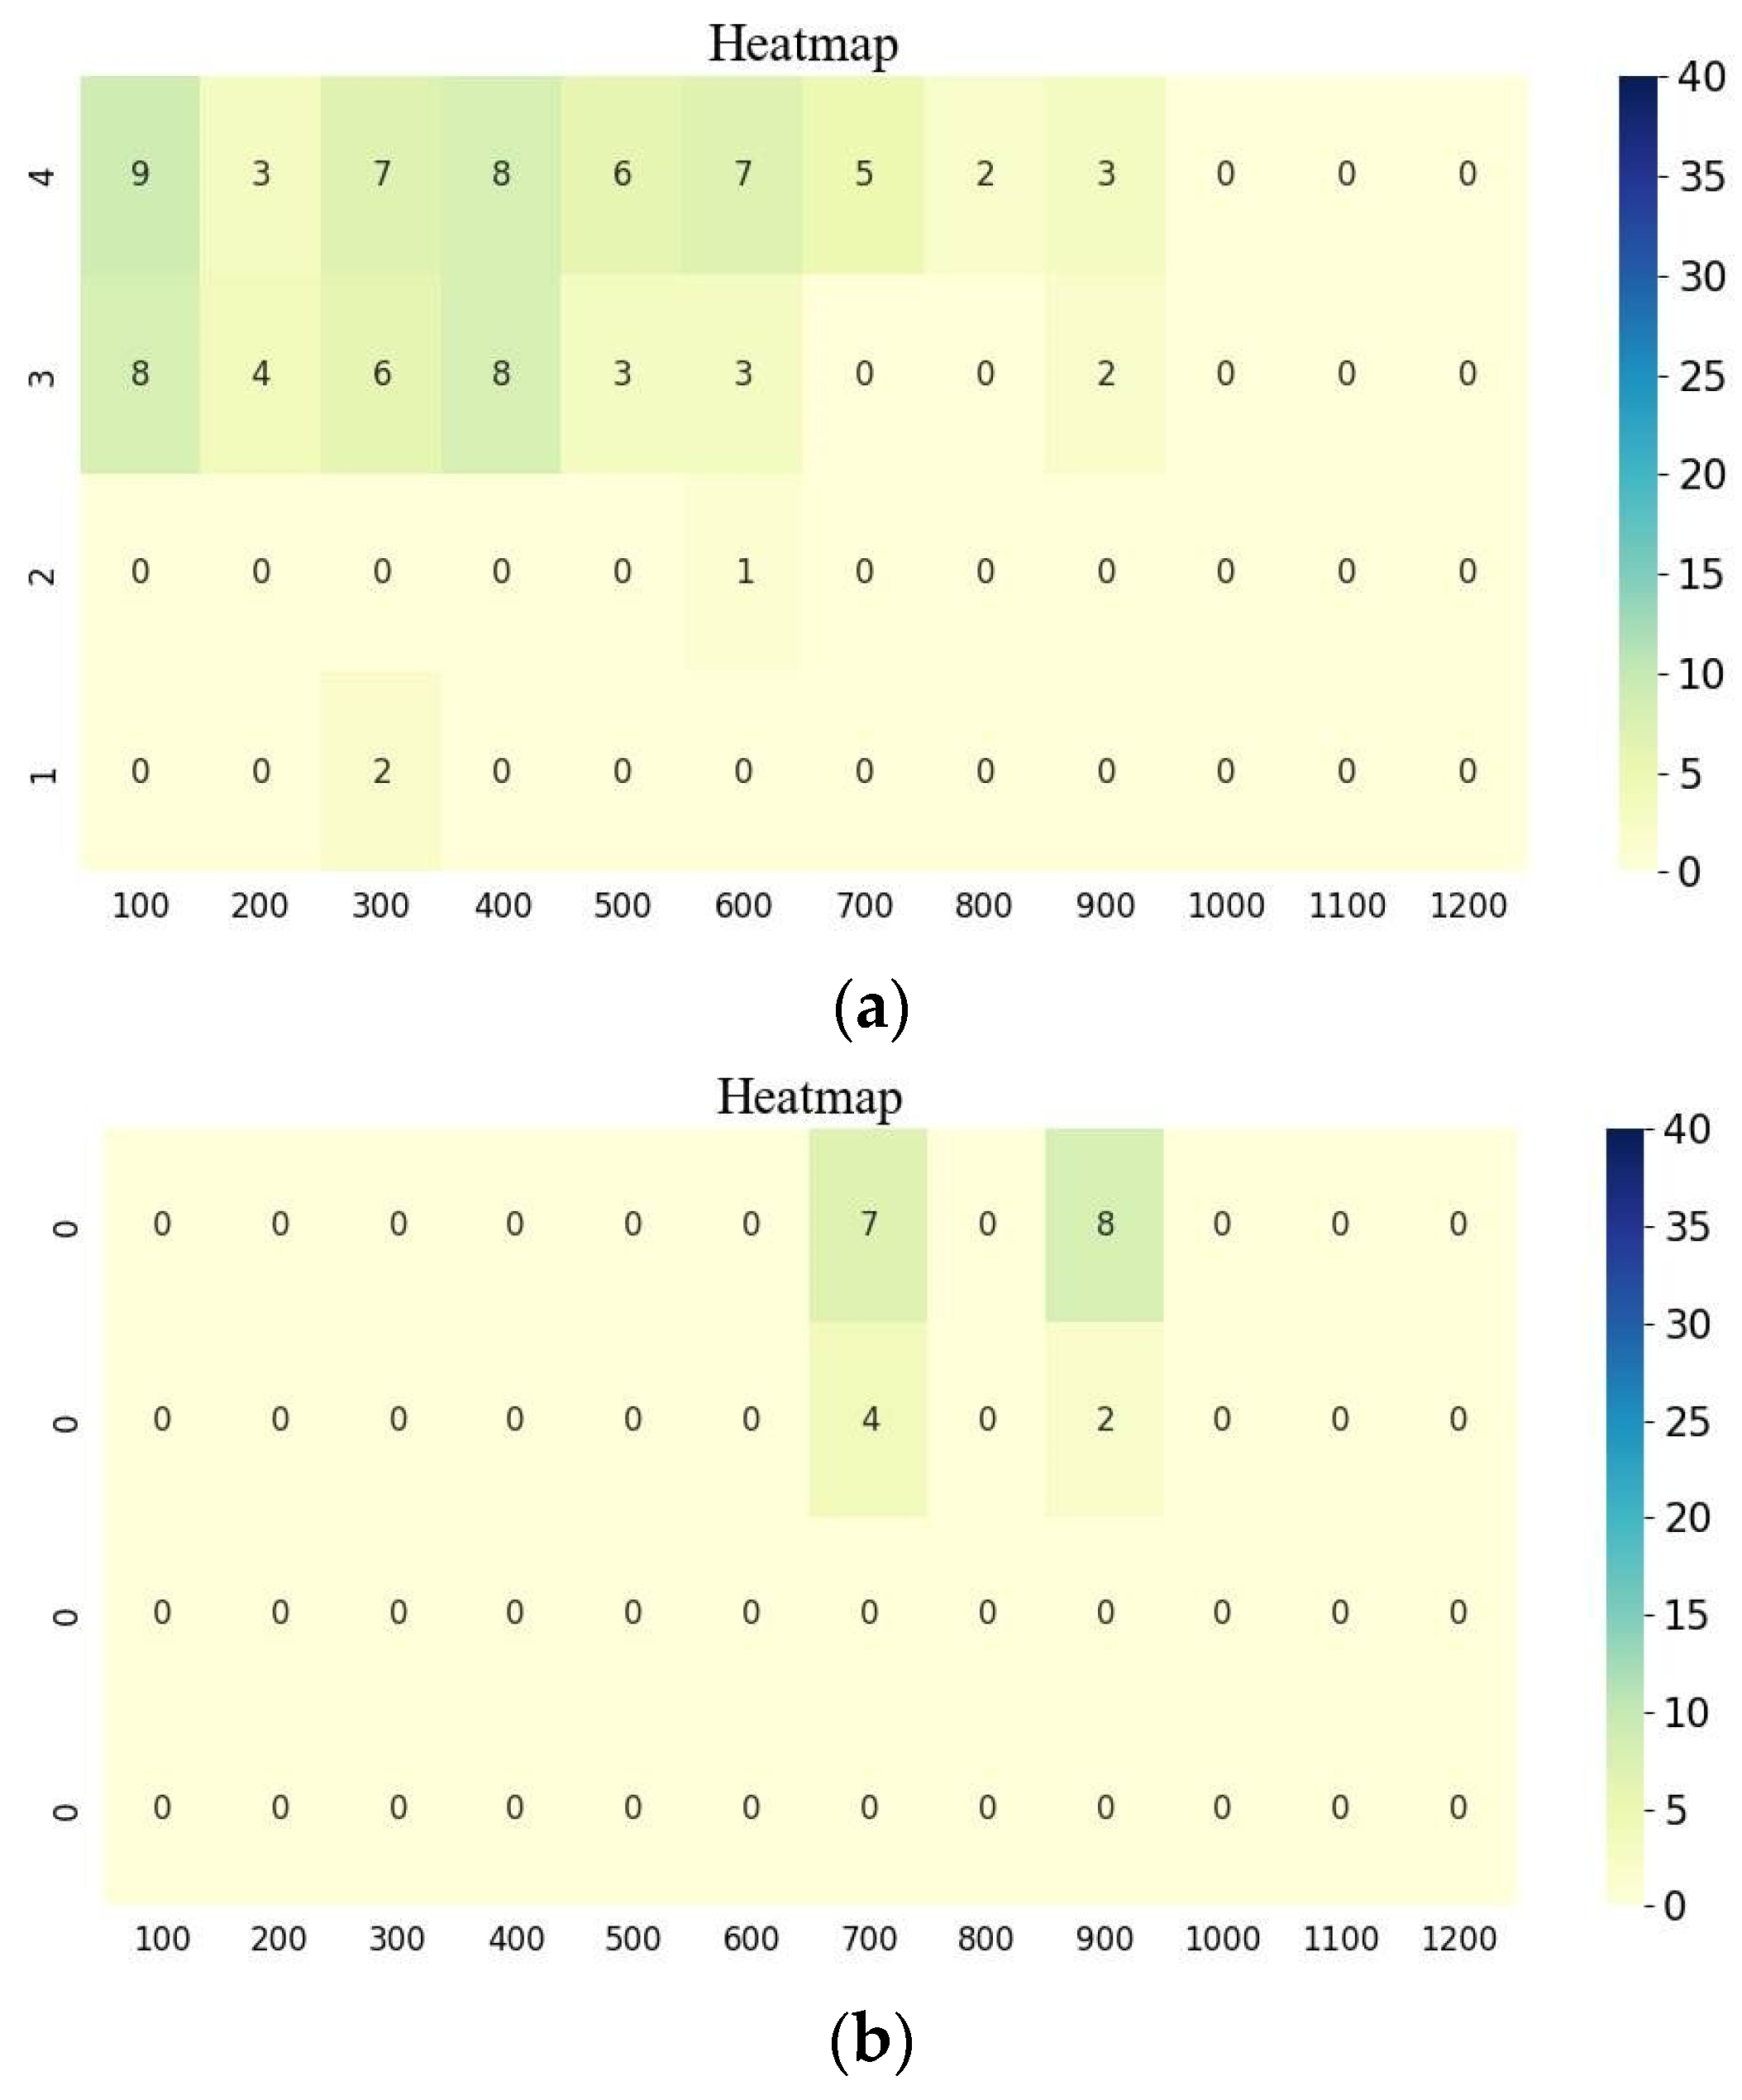
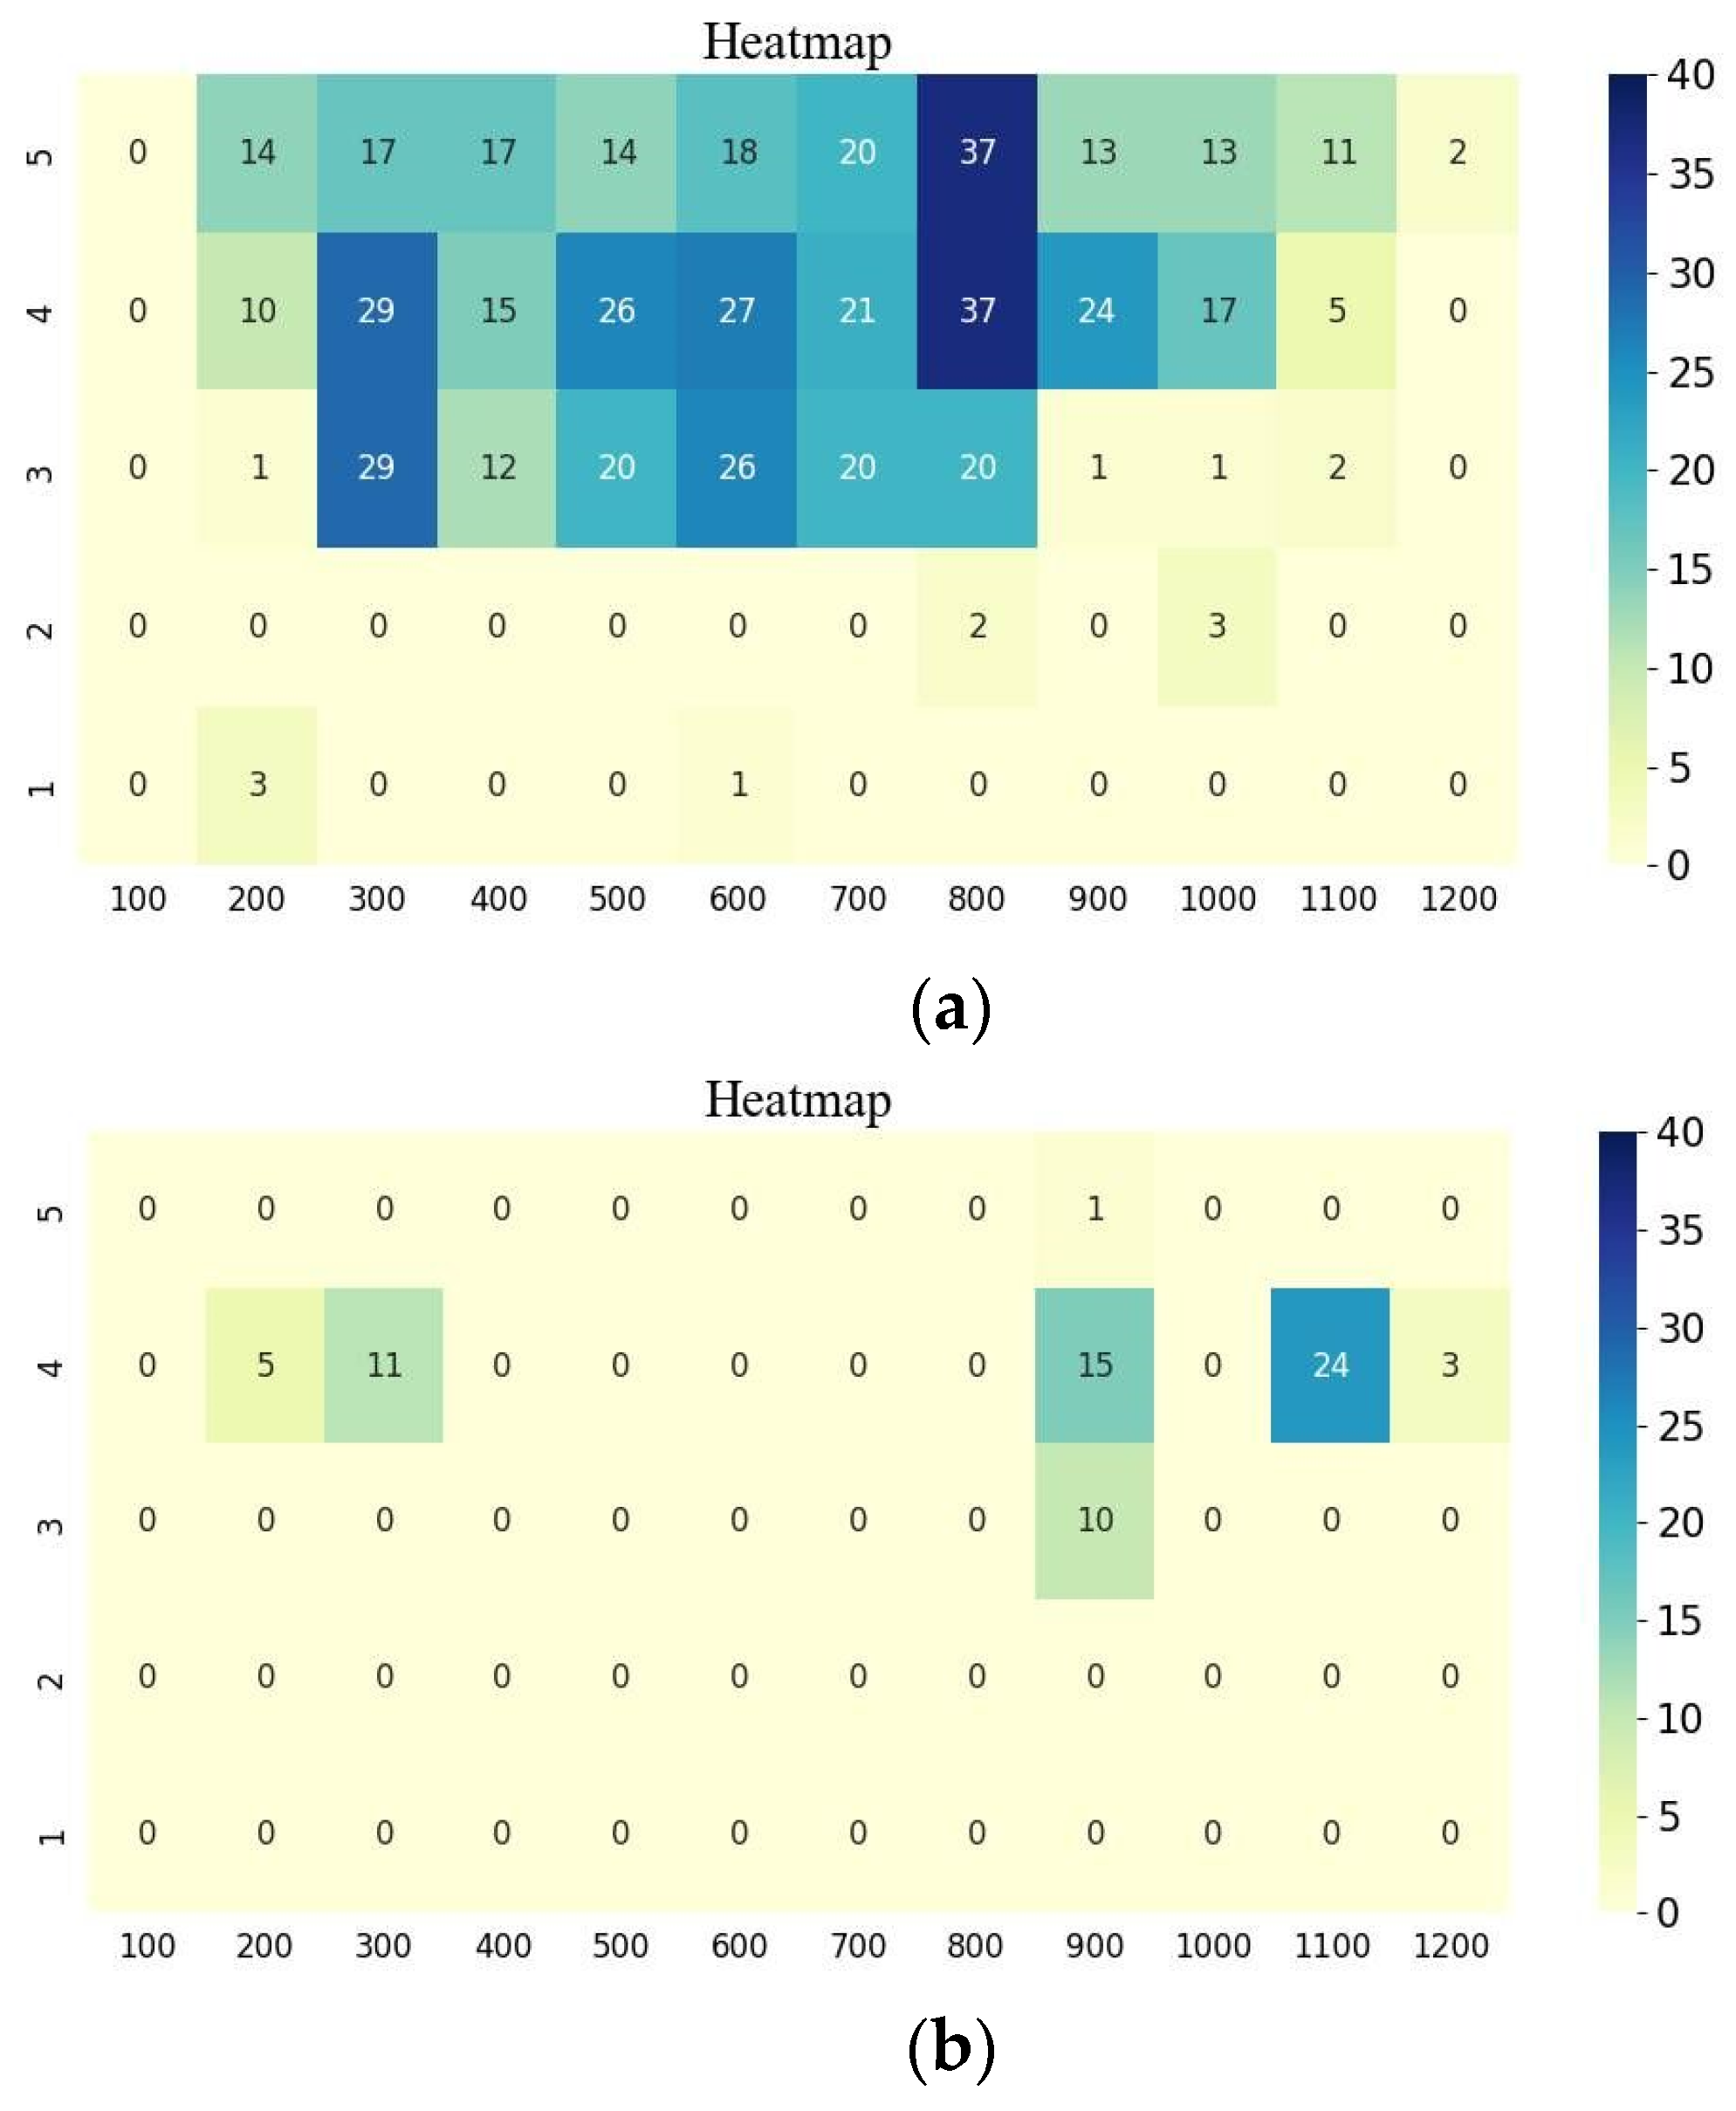
Therefore, the subsequent analysis of the four-lane and conflict number five-lane highway hard shoulder on the left side of the impact of road safety. The highway section is divided into 12 intervals at 100 m intervals, and the number of conflict points falling within each interval is counted.
As seen in Figure 4, the number of conflicts is higher on a four-lane highway without a hard shoulder on the left side than when a hard shoulder on the left side is provided. As the breakdown vehicles on the inner two lanes (lane 3 and lane 4) need to change lanes to the hard shoulder on the right side, the low-speed breakdown vehicles create a queuing phenomenon on the lane, and the location distribution of conflict points is closer to the vehicle trajectory. After setting the hard shoulder on the left side, the number of conflict points is significantly reduced and gathered near the fault occurrence point.
As seen in Figure 5, for a five-lane highway, the number of conflicts caused by a breakdown vehicle on the inner lane (lane 3, lane 4, lane 5) is much larger than that of a four-lane highway without a hard shoulder on the left side, and a breakdown vehicle in the inner lane needs to change lanes several times in succession to get to the hard shoulder on the right side, affecting a larger area. Setting the hard shoulder on the left side can significantly improve the road safety of a five-lane highway when a vehicle breakdown occurs.
As seen in Table 3, using SSAM to output the highway safety performance indicators, it can be found that the mean TTC and maximum deceleration (MaxD) of conflict events are improved with the installation of the left hard shoulder, with the five-lane highway showing a more significant improvement with a 57.2% increase in mean TTC, 19.2% increase in MaxD, and 15.3% increase in DeltaS. Therefore, we believe it is more necessary to have a hard shoulder on the left side of a five-lane highway.

4.2. Multi-Lane Highway Accident Prediction Modeling

According to the prediction model, 11.6 km of the Badou-Shihu mainline was selected for accident prediction. First, the estimated average accident rate of the two-way 6-lane prediction model was calculated according to the current conditions and according to the calibration of the domestic specification of individual parameter values, and all parameters were initially calculated in Table 4.
According to the above table, the expected average accident frequency and observed accident frequencies can be calculated as below:
w = 1 1 + k N p r e d i c t e d = 0.4635
N exp e c t e d = w × N p r e d i c t e d + ( 1 w ) × N o b e r s e v e d = 353   times / year
where
Multi-Vehicle Casualty Accidents Np,fs,6,mv,fi = 70.93 ( times / year );
Multi-Vehicle only property damage accident Np,fs,6,mv,pdo = 149.79 ( times / year );
Single-Vehicle Casualty Accidents Np,fs,6,sv,fi = 40.03 ( times / year );
Single-Vehicle property damage only accidents Np,fs,6,sv,pdo = 92.28 ( times / year ).
Combined with the characteristics of the road section, calibrated two-way ten-lane road section correction factor is calculated as follows Table 5. Initially, set the width of the hard shoulder on the left side as 2.5 m.
Using Badou–Taihe, Taihe–Shihu two-way ten-lane roadway to predict the expected average accident frequency, the predicted target roadway’s expected average accident frequency is shown in Table 6 below.
The effect of the accident correction factor CMF3 on the left (inner) hard shoulder width is shown in Table 7 below.
If only the width of the left hard shoulder is considered, CMF3 is obtained by weighting each type of accident proportion in the predicted accidents and its corresponding correction coefficient. According to Ref. [7], The setting of highway shoulders will have an impact on traffic flow and road alignment. Lin [45] screened out the factors that have the greatest impact on highway vehicle safety before and after the installation of the hard shoulder on the left side. Based on the above study, the factors affecting the setting of the hard shoulder on the left side of the highway mainly include the degree of interweaving, flat and longitudinal linear equilibrium index, truck ratio, road section v/c ratio, and the number of lanes. For the overall two-way ten-lane section transformation of the Badou–Shihu section, the truck ratio and road section v/c ratio are selected to correct the correction coefficient of the hard shoulder on the left side and based on determining the introductory predicted accident rate ( N p ), the Determining of the calculation of the actual accident rate ( N i ) and correction coefficient β .
β = N i N p × β i
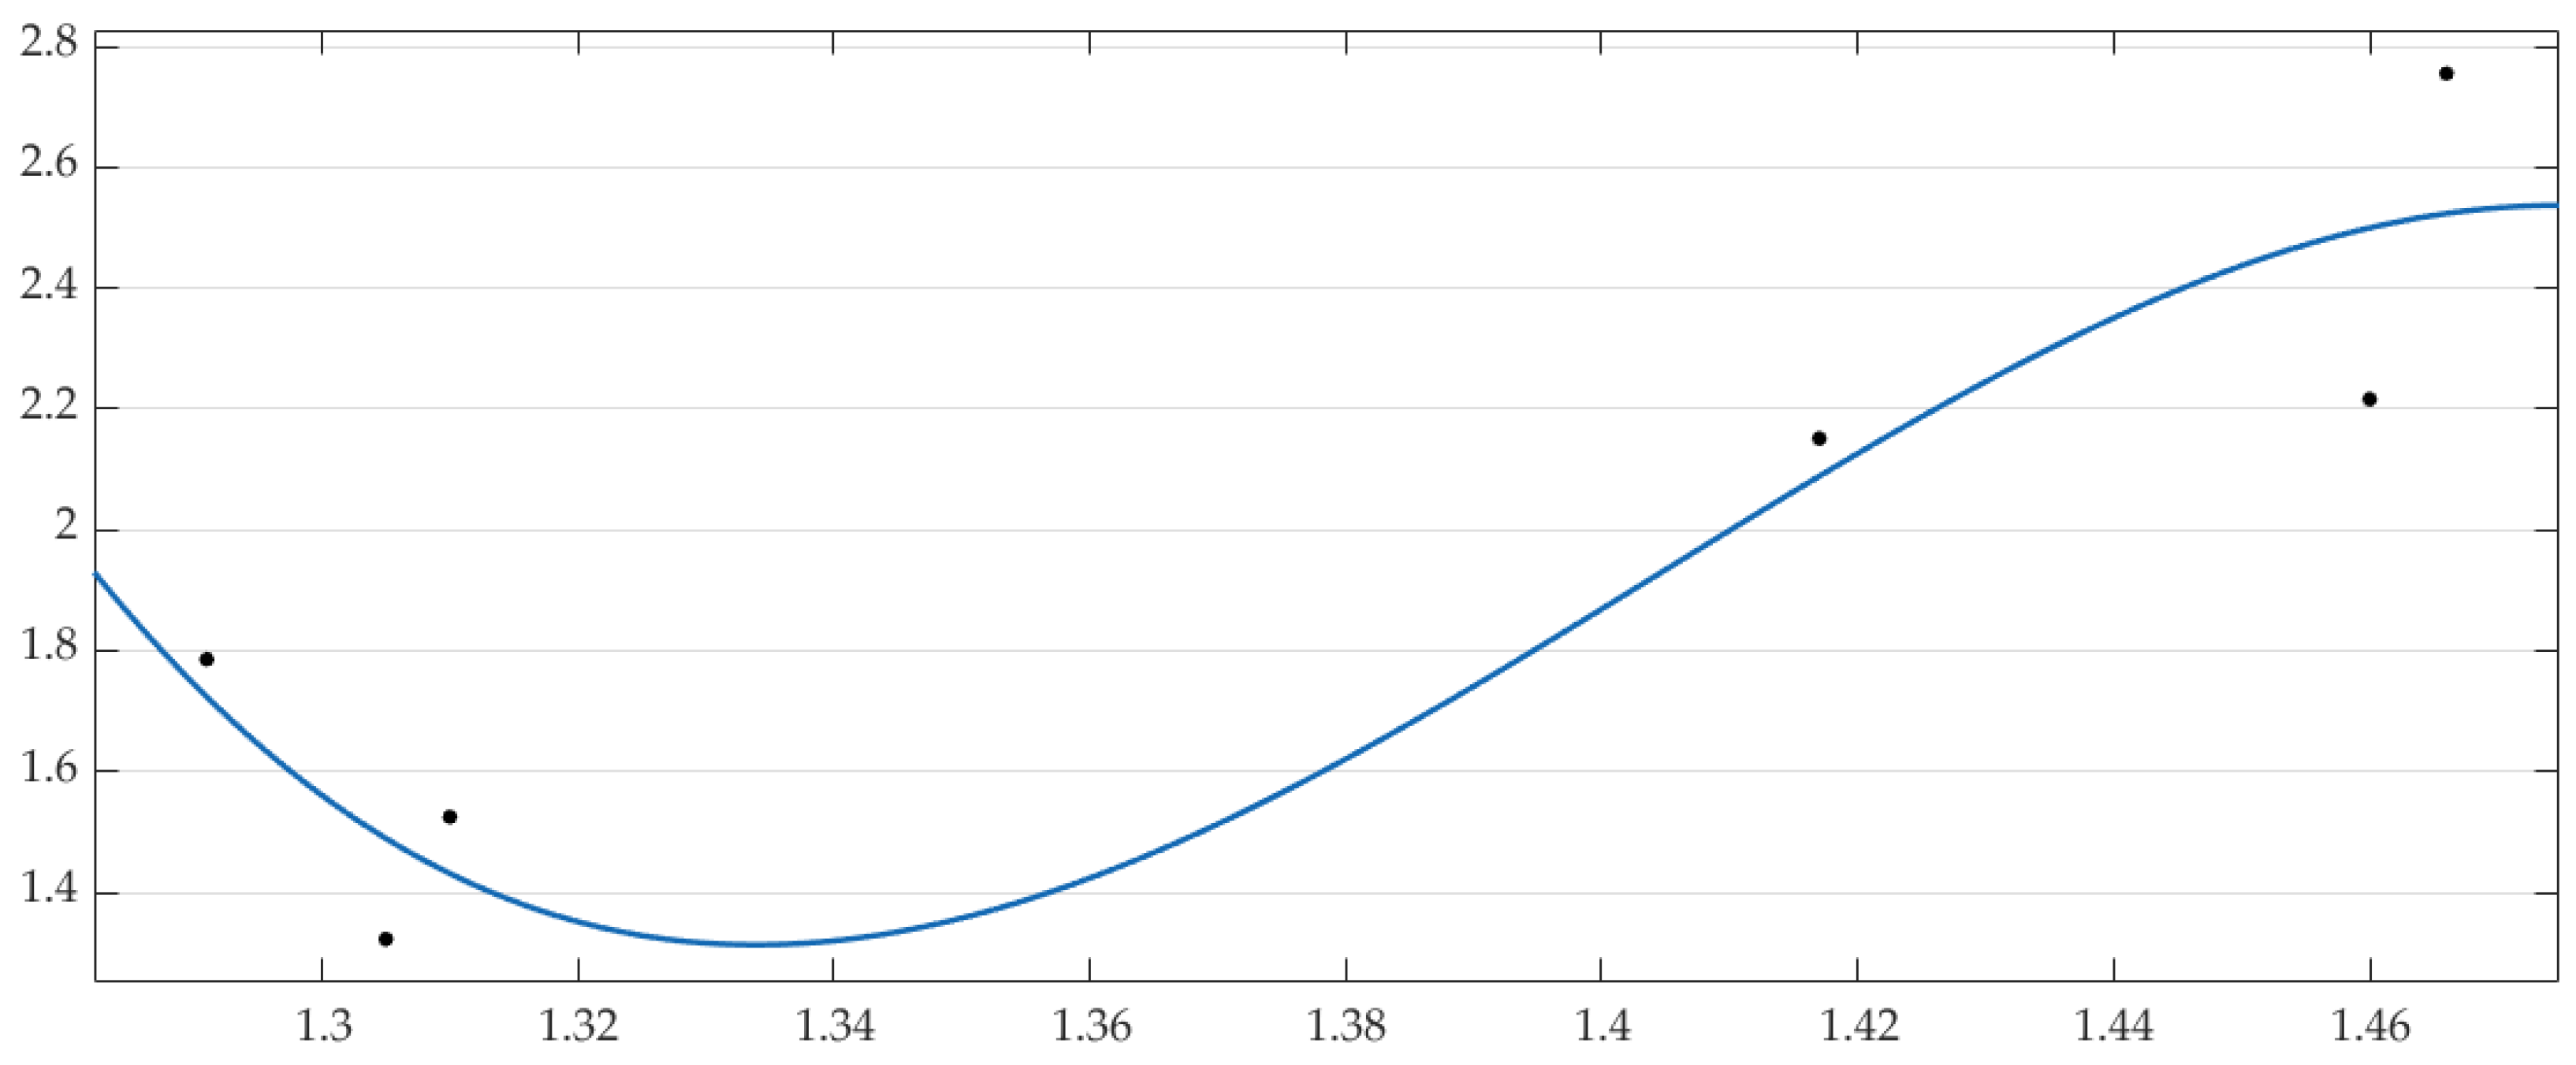
The correction coefficient β is fitted as shown in Figure 6 below,the black dots represent correction coefficient β as calculated by actual data and Equation (11). After the calculation, the fitted values of correction coefficient β are 1.60 and 1.55 for Badou–Taihe and Taihe–Shihu sections in the forecast year, respectively. The goodness of fit R2 is 0.8689.
The corrected CMF3 value is:
C M F 3 = exp ( a × ( W i s 6 ) ) / β
According to the calculation and correction method described above, if the initial set hard shoulder width on the left side is changed from 0–4 m, the expected average accident frequency changes in the Badou–Taihe section and Taihe–Shihu section are shown below.
The preliminary analysis fitting in Figure 7 shows that within the reasonable setting range of the left hard shoulder width (0~4 m), the total number of accidents is predicted to decrease somewhat for a specific section with the increase in the left hard shoulder width, and within the study section if only the effect of the left hard shoulder width is considered, the accident rate decreases by about 1.5% for every 0.5 m increase in the left hard shoulder. The predicted accident numbers for the Badou–Taihe and Taihe–Shihu sections are 183.57 accidents/year and 249.16 accidents/year based on the curb width of 0.75 m, respectively, and 170.69 accidents/year and 231.16 accidents/year based on the left hard shoulder of 3 m, respectively, with a difference of about 7% to 7.2% in the number of accidents on the left hard shoulder-related sections when other influencing factors are not considered. Taking the current accident data as the base, the number of accidents on the road sections with the hard shoulder on the left side accounts for about 41.4% of the total number of accidents on the whole line, so the impact of setting hard shoulder on the overall number of accidents on the whole line is about 2.9%.

5. Discussion

5.1. Theoretical and Practical Applications

This paper investigates the mechanism of the influence of the hard left shoulder on traffic safety of multi-lane freeways, based on field survey data. Ref. [9] used VISSIM software to set up a one-way four-lane intertwined zone and simulated a single vehicle changing lanes continuously to the right hard shoulder. The results showed that a single vehicle changing lanes continuously can have an impact on the speed of other vehicles and lead to an increased potential risk of collisions, thus illustrating the need for a left hard shoulder to reduce lane changes on multi-lane freeways. However, the study did not use safety proxies to quantify the safety gains from reduced lane changes, nor did it discuss the differences between different freeway lane counts. In this paper, the SSAM-Based model under the influence of the left side hard shoulder is constructed using traffic conflict techniques, and the analysis method of the SSAM-Based model is referred to Ref. [38] to further compare the differences in vehicle conflicts on the left hard shoulder when used on one-way three-lane, four-lane, and five-lane highways based on safety and efficiency by summarizing the highway driving rules. The results show that for freeways with more than three lanes in one direction, the indexes MaxS and DeltaS are improved after installing the left hard shoulder than without the left hard shoulder. Using the definition of conflict rate in the study, it is concluded that the left hard shoulder has the most significant improvement effect for freeways with five lanes in one direction, while freeways with three lanes in one direction are the least affected.
The modeling idea of this paper, referring to Ref. [32], is to construct a basic accident prediction model with the segment length and traffic volume of the target section as parameters, and then introduce coefficients of different influencing factors to calibrate the model. Therefore, in this paper, the SPF function is introduced to construct a multi-lane highway accident prediction model under the influence of the hard left shoulder, which further considers the change of accident volume of the predicted road section with the change of shoulder width. In addition, the role and influence of highway shoulders were studied in Ref. [7], and the factors that have the greatest influence on the occurrence of lane change accidents when the left hard shoulder is set were screened in Ref. [45]. Therefore, combining the above studies, this paper adds linear indicators of roadside facilities affected by the left hard shoulder to the basic prediction model, and applies the V/C and truck ratio of the actual road section to the CMF coefficients of the model to further optimize the model and improve the reliability of the accident prediction model. The results show that installing a hard left shoulder for a one-way five-lane highway can significantly reduce the number of accidents that occur. Based on the results of this paper, the road traffic management department can propose conditions for setting the hard shoulder on the left side from roadside facilities, traffic management, and road alignment design to reduce traffic conflicts and avoid secondary accidents caused by vehicles unable to reach the hard shoulder on the right side due to emergencies. For example, when the highway is more than four lanes in one direction, and the terrain is not restricted, the hard shoulder on the left side can be considered to avoid more traffic conflicts.

5.2. Limitations and Future Research Directions

This paper discusses the impact of left-hand hard shoulder installation on traffic safety on multi-lane highways. The conclusions obtained apply to the traffic planning and facility design of highways. However, the conclusions of this paper are only applicable to multi-lane highways with integral roadbed sections, and further research is needed to study the safety of the left hard shoulder for multi-lane highways with separate roadbed sections and different combinations of roadbed sections. Therefore, our future goal is to expand the scope of application of the left hard shoulder and further consider the safety improvement that can be brought by installing the left hard shoulder for multi-lane freeway roadbed section forms and different combinations of forms. For example, in the case of converting a monolithic section to a separated roadbed section, the form of the hard shoulder on the left side may also change, resulting in a difference in safety. Therefore, when the section form of a highway on a continuous section changes, it needs to be further investigated whether the hard shoulder setting on the left side will have a different impact on highway safety for the area of its transition section. In addition, the accident data collected in this study are all accident data of the freeway section, while in the actual freeway, accidents can occur in other places such as ramps, and the effect of the left hard shoulder on the safety of other parts of the freeway still needs to be further studied. At the same time, in the future, it will be possible to calculate the increased investment and construction cost of the highway after the installation of the hard shoulder on the left side, and relate this cost to the safety benefits of the reduction in the number of accidents, so that the local socio-economic situation can be better combined with the judgment of whether the hard shoulder on the left side is needed. In addition, the VISSIM simulation in this paper is based on data from field surveys, but due to errors in data collection, the simulation model may differ from the actual traffic operating environment. With the help of driving simulators, eye-tracking instruments, and other equipment, combining the physiological and psychological characteristics of drivers, the actual measured data under actual road traffic conditions with the empirical data from simulation experiments is also the goal of our continued research in the future. At the same time, the different geometry of the left hard shoulder setting and supporting guidance facilities will also bring different safety impacts. Meanwhile, with the emergence of self-driving cars, more and more research focuses on the safety assurance of self-driving cars in different scenarios. This paper considers only the driver’s use of the hard left shoulder. In the future, it is essential to study the impact of the left hard shoulder on highway traffic safety as a scenario for the safe use of self-driving vehicles.

6. Conclusions

In this paper, the following conclusions are drawn from simulations and accident predictions for the left hard shoulder on highways:
(1)
In this paper, based on the past research on shoulders, we extend the study to the left-side hard shoulders of one-way three-, four-, and five-lane highways and compare their safety benefits. For one-way three, four, and five lanes, the rear-end conflict rates were reduced by 0.17%, 0.75%, and 4.6% after setting the hard shoulder on the left side, respectively. The output of the SSAM model shows that the mean TTC and maximum deceleration (MaxD) of the conflict events improved with the setting of the left hard shoulder, with a more remarkable improvement for the five-lane freeway, with a 57.2% increase in mean TTC, 19.2% increase in MaxD, and 15.3% increase in DeltaS. As the hard shoulder on the left side is the most obvious safety improvement for five lanes in one direction, we believe it is more necessary to set up a hard shoulder on the left side of a one-way five-lane highway.
(2)
In this paper, SPF was introduced to establish an accident prediction model to predict the setting of the left shoulder of a one-way five-lane highway to predict the setting of the left shoulder of a one-way five-lane highway. The results showed that within the reasonable setting range of the left hard shoulder width (0~4 m) if only the effect of the left hard shoulder width is considered, the accident rate decreases by about 1.5% for every 0.5 m increase in the left hard shoulder. The predicted accident numbers for Badou–Taihe and Taihe–Shihu sections are 183.57 cases/year and 249.16 cases/year, respectively, based on the curb width of 0.75 m, and 170.69 cases/year and 231.16 cases/year, respectively, based on the hard shoulder on the left side of 3 m. Increasing the width of the hard shoulder on the left side can gradually reduce the number of accidents when other influencing factors are not considered.

Author Contributions

Conceptualization, P.Z. and J.M.; methodology, P.Z.; software, P.Z.; validation, P.Z; formal analysis, C.X.; investigation, J.M.; resources, P.Z.; data curation, C.Z.; writing—original draft preparation, Z.N.; writing—review and editing, P.Z.; visualization, P.Z.; supervision, J.M.; project administration, P.Z.; funding acquisition, J.M. All authors have read and agreed to the published version of the manuscript.

Funding

This research was supported by the Transportation Science and Technology Project of Jiangsu Province (Grant No. 2018Y15).

Institutional Review Board Statement

Not applicable.

Informed Consent Statement

Not applicable.

Data Availability Statement

Data are available from the corresponding author upon reasonable request.

Conflicts of Interest

The authors declare no conflict of interest.

References

  1. Hadi, M.A.; Aruldhas, J.; Chow, L.-F.; Wattleworth, J.A. Estimating safety effects of cross-section design for various highway types using negative binomial regression. Transp. Res. Record. 1995, 1500, 169. [Google Scholar]
  2. Park, J.; Abdel-Aty, M.; Wang, L.; Lee, G.; Hong, J.J. Influence of multiple freeway design features on freight traffic safety. J. Adv. Transp. 2019, 5739496, 0197–6729. [Google Scholar]
  3. Harwood, D.W.; Council, F.M.; Hauer, E.; Hughes, W.E.; Vogt, A.J.B.T. Prediction of The Expected Safety Performance of Rural Two-Lane Highways; U.S Department Transportation, Federal Highway Administration: Washington, DC, USA, 2000.
  4. Torbic, D.J. Highway Safety Manual; American Association of State Highway and Transportation Officials: Washington, DC, USA, 2010; Volume 19192. [Google Scholar]
  5. Design Specification for Highway Alignment (JTG B01-2017); People’s Traffic Publishing House: Beijing, China, 2017.
  6. Zhong, L.; Hou, D.; Wu, K.J. Necessity analysis of inside shoulder of multi-lane highway. J. Highw. Transp. Res. Dev. 2011, 2, 106–110. [Google Scholar]
  7. Coffey, S.; Park, S. Impact of Part-Time Shoulder Use on Safety through the Highway Safety Manual. In Proceedings of the International Conference on Transportation and Development 2018: Connected and Autonomous Vehicles and Transportation Safety, Pennsylvania, PA, USA, 15–18 July 2018; pp. 180–187. [Google Scholar]
  8. De Ridder, S.; Van der Horst, R.; Naing, C.L.; Thomson, R.; Fagerlind, H.; Lanner, G.; Dupre, G.; Bisson, O.; Garcia, J.; Lopez, F. Roadside Infrastructure for Safer European Roads: D04 Envelope of Vehicle and Driver Response Prior to Collisions; Citeseer: University Park, PA, USA, 2006. [Google Scholar]
  9. Zhong, L.; Li, X.W.; Wu, K.M. Necessity Analysis of Inside Shoulder Setting in Multi-lane Freeway with Traffic Simulation Method. In Software Engineering and Knowledge Engineering: Theory and Practice; Springer: Berlin/Heidelberg, Germany, 2012; pp. 593–598. [Google Scholar]
  10. Kitali, A.E.; Mokhtarimousavi, S.; Kadeha, C.; Alluri, P.J. Severity analysis of crashes on express lane facilities using support vector machine model trained by firefly algorithm. Traffic Inj. Prev. 2021, 22, 79–84. [Google Scholar]
  11. Fitzpatrick, K.; Dixon, K.; Avelar, R.J. Evaluating operational implications of reduced lane and shoulder widths on freeways. J. Transp. Eng. 2016, 142, 04016052. [Google Scholar]
  12. Ma, J.; Hu, J.; Hale, D.K.; Bared, J.J. Dynamic hard shoulder running for traffic incident management. Transp. Res. Record. 2016, 2554, 120–128. [Google Scholar]
  13. Liu, S.; Wang, J.H.; Fu, T. Effects of lane width, lane position and edge shoulder width on driving behavior in underground urban highways: A driving simulator study. Int. J. Environ. Res. Public Health. 2016, 13, 1010. [Google Scholar]
  14. Ben-Bassat, T.; Shinar, D.J. Effect of shoulder width, guardrail and roadway geometry on driver perception and behavior. Accid. Anal. Prev. 2011, 43, 2142–2152. [Google Scholar]
  15. Zhao, X.; Ding, H.; Wu, Y.; Ma, J.; Zhong, L.J. Experimental research on safety impacts of the inside shoulder based on driving simulation. Accid. Anal. Prev. 2015, 76, 6–14. [Google Scholar] [PubMed]
  16. Lord, D.; Washington, S.P.; Ivan, J.N.J. Poisson, Poisson-gamma and zero-inflated regression models of motor vehicle crashes: Balancing statistical fit and theory. Accid. Anal. Prev. 2005, 37, 35–46. [Google Scholar]
  17. Caliendo, C.; Guida, M.; Parisi, A.J. A crash-prediction model for multilane roads. Accid. Anal. Prev. 2007, 39, 657–670. [Google Scholar] [PubMed]
  18. Berhanu, G.J. Models relating traffic safety with road environment and traffic flows on arterial roads in Addis Ababa. Accid. Anal. Prev. 2004, 36, 697–704. [Google Scholar] [PubMed]
  19. Ivan, J.N.; Wang, C.; Bernardo, N.R.J. Explaining two-lane highway crash rates using land use and hourly exposure. Accid. Anal. Prev. 2000, 32, 787–795. [Google Scholar] [CrossRef]
  20. Memon, A.Q. Road Accident Prediction Models and Influence of Traffic Flow, Road Length, Road Class, and Vehicle Class on Accidents. In Proceedings of the Transportation Research Board 87th Annual Meeting, Washington, DC, USA, 13–17 January 2008. [Google Scholar]
  21. Cafiso, S.; Di Graziano, A.; Di Silvestro, G.; La Cava, G.; Persaud, B.J. Development of comprehensive accident models for two-lane rural highways using exposure, geometry, consistency and context variables. Accid. Anal. Prev. 2010, 42, 1072–1079. [Google Scholar] [CrossRef]
  22. Qi, Y.; Smith, B.L.; Guo, J.J. Freeway accident likelihood prediction using a panel data analysis approach. J. Transp. Eng. 2007, 133, 149–156. [Google Scholar]
  23. Elbasyouny, K.; Sayed, T.A. Impact of Flow Measurement Errors on Accident Prediction Models. In Proceedings of the Transportation Research Board Meeting, Washington, DC, USA, 13–17 January 2008. [Google Scholar]
  24. Malyshkina, N.V.; Mannering, F.L.; Tarko, A.P.J. Markov switching negative binomial models: An application to vehicle accident frequencies. Accid. Anal. Prev. 2009, 41, 217–226. [Google Scholar] [PubMed] [Green Version]
  25. Li, X.; Lord, D.; Zhang, Y.; Xie, Y.J. Predicting motor vehicle crashes using support vector machine models. Accid. Anal. Prev. 2008, 40, 1611–1618. [Google Scholar] [CrossRef]
  26. Kermanshah, M.; Najaf, P.; Jahromi, H.N.J. Developing nested logit probability models for rollover accident occurrence and driver injury severity. Transp. Res. J. 2011, 1, 35–45. [Google Scholar]
  27. Wang, C.; Quddus, M.A.; Ison, S.G.J. Predicting accident frequency at their severity levels and its application in site ranking using a two-stage mixed multivariate model. Accid. Anal. Prev. 2011, 43, 1979–1990. [Google Scholar] [CrossRef] [Green Version]
  28. Li, X.; Liu, Y.; Fan, L.S.; Shi, S.L.; Zhang, T.; Qi, M.H. Research on the prediction of dangerous goods accidents during highway transportation based on the ARMA model. J. Loss Prev. Process Ind. 2021, 72, 104583. [Google Scholar] [CrossRef]
  29. Lim, K. Analysis of Railroad Accident Prediction using Zero-truncated Negative Binomial Regression and Artificial Neural Network Model: A Case Study of National Railroad in South Korea. KSCE J. Civ. Eng. 2022, 1976–3808. [Google Scholar] [CrossRef]
  30. Gao, L.; Lu, P.; Ren, Y.H. A deep learning approach for imbalanced crash data in predicting highway-rail grade crossings accidents. Reliab. Eng. Syst. Saf. 2021, 216, 108019. [Google Scholar]
  31. Haleem, K.; Gan, A.; Lu, J.Y. Using multivariate adaptive regression splines (MARS) to develop crash modification factors for urban freeway interchange influence areas. Accid. Anal. Prev. 2013, 55, 12–21. [Google Scholar]
  32. Lord, D.; Persaud, B.N. Estimating the safety performance of urban road transportation networks. Accid. Anal. Prev. 2004, 36, 609–620. [Google Scholar] [PubMed]
  33. Bamzai, R.; Lee, Y.; Li, Z. Safety Impacts of Highway Shoulder Attributes in Illinois; Illinois Center for Transportation Series No. 11-078,0197-9191; Illinois Institute of Technology: Chicago, IL, USA, 2011. [Google Scholar]
  34. Li, Z.; Lee, S.H.; Lee, Y.; Zhou, B.; Bamzai, R. A Methodology for Assessing Safety Impacts of Highway Shoulder Paving. In Proceedings of the Transportation and Development Institute Congress 2011: Integrated Transportation and Development for a Better Tomorrow, Chicago, IL, USA, 13–16 March 2011; pp. 1105–1117. [Google Scholar]
  35. Machordom Gimeno, L. Assessment of Safety impacts of Shoulder Paving in Illinois highways Using Empirical Bayesian and Cross-Sectional Analyses. Bachelor’s Thesis, Universitat Politècnica de Catalunya, Barcelona, Spain, 2010. [Google Scholar]
  36. Huang, F.; Liu, P.; Yu, H.; Wang, W.J. Identifying if VISSIM simulation model and SSAM provide reasonable estimates for field measured traffic conflicts at signalized intersections. Accid. Anal. Prev. 2013, 50, 1014–1024. [Google Scholar] [PubMed]
  37. Ciuffo, B.; Punzo, V. “No free lunch” theorems applied to the calibration of traffic simulation models. IEEE Trans. Intell. Transp. Syst. 2013, 15, 553–562. [Google Scholar]
  38. Xuan, F.; Tamás, T.; Arthur, C.P. Online Calibration of Microscopic Road Traffic Simulator. In Proceedings of the 2020 IEEE 18th World Symposium on Applied Machine Intelligence and Informatics (SAMI), Herl’any, Slovakia, 23–25 January 2020; pp. 275–280. [Google Scholar]
  39. Anil, C.A.; Srinivasan, A.A.; Chilukuri, B.R.; Treiber, M.; Okhrin, O. Calibrating Wiedemann-99 Model Parameters to Trajectory Data of Mixed Vehicular. Traffic. Transp. Res. Record 2022, 2676, 718–735. [Google Scholar]
  40. Xu, C.; Ma, J.X.; Tang, X. A Simulation-Based Study of the Influence of Low-Speed Vehicles on Highway Traffic Safety. Sustainability 2022, 14, 12165. [Google Scholar]
  41. Peterson, B.E. First Workshop on Traffic Conflicts, Oslo, Norway, 1977; Tekniska Hogskolan i Lund: Oslo, Norway, 1977. [Google Scholar]
  42. Guo, Y.; Sayed, T.; Zaki, M.H. Exploring evasive action–based indicators for PTW conflicts in shared traffic facility environments. J. Transp. Eng. Part A Syst 2018, 144, 04018065. [Google Scholar]
  43. Ma, Y.F.; Meng, H.C.; Chen, S.Y.; Zhao, J.G.; Li, S.; Xiang, Q.J. Predicting Traffic Conflicts for Expressway Diverging Areas Using Vehicle Trajectory Data. J. Transp. Eng. Part A Syst. 2020, 146, 04020003. [Google Scholar]
  44. Ge, H.; Huang, M.; Lu, Y.; Yang, Y. Study on Traffic Conflict Prediction Model of Closed Lanes on the Outside of Expressway. Symmetry 2020, 12, 926. [Google Scholar] [CrossRef]
  45. Lin, X.Y.; Zhu, S.Y.; Li, W.J.; Xiao, W.B.; Wang, H. Setting Criterion of Left Hard Shoulder of Multi-lane Expressway Based on Logistic Model. J. Wuhan Univ. Technol. 2022, 46, 219–224. [Google Scholar]
Figure 1. Lane positions of road section.
Sustainability 14 15114 g001
Figure 2. SSAM model workflow.
Sustainability 14 15114 g002
Figure 3. Vehicle Conflict Types.
Sustainability 14 15114 g003
Figure 4. Four-lane highway conflict point distribution map. (a) Without Left Shoulder; (b) With Left Shoulder.
Sustainability 14 15114 g004
Figure 5. Five-lane highway conflict point distribution map. (a) Without Left Shoulder; (b) With Left Shoulder.
Sustainability 14 15114 g005
Figure 6. Correction coefficient β fitting graph.
Sustainability 14 15114 g006
Figure 7. The number of predicted accidents varies with the setting of the hard shoulder on the left.
Sustainability 14 15114 g007
Table 1. Summary of multi-lane highway correction factor.
Applicable SPFCorrection FactorExplanation
Highway SectionCMF1,w,x,y,zFlat Curve
CMF2,w,x,y,fiLane Width
CMF3,w,x,y,zInside Hard Shoulder
CMF4,w,x,y,zMedian Width
CMF5,w,x,y,zMedian Guardrail
CMF6,w,x,y,zHigh Traffic Volume
Multi-vehicle AccidentsCMF7,fs,ac,mv,zLane Change
Single-vehicle AccidentsCMF8,fs,ac,sv,zOuter Hard Shoulder
CMF9,fs,ac,sv,fiShoulder Vibrating Belt
CMF10,fs,ac,sv,fiLateral Residual Width
CMF11,fs,ac,sv,fiOuter guardrail
Table 2. Conflict data before and after hard shoulder setting on the left side.
Three LanesFour LanesFive Lanes
Without Left ShoulderWith Left ShoulderWithout Left ShoulderWith Left ShoulderWithout Left ShoulderWith Left Shoulder
Rear-end ConflictsNumber of Conflicts135581338136
Conflict rate0.28%0.11%0.97%0.22%5.08%0.48%
Lane-change ConflictsNumber of Conflicts3323815232
Conflict rate0.06%0.06%0.38%0.13%2.07%0.43%
Table 3. Statistical Table of Accident Surrogate Indicators.
Three LaneFour LaneFive Lane
Without Left ShoulderWith Left ShoulderWithout Left ShoulderWith Left ShoulderWithout Left ShoulderWith Left Shoulder
TTC1.21.211.20.71.1
MaxD−7.4−7.6−8.1−7.7−8.3−6.7
DeltaS12.818.318.621.319.622.6
MaxS118.2118.497.2118.8100.8104.4
Table 4. Calculation table of traffic accident prediction correction coefficient under current road conditions.
Correction FactorMulti-Vehicle
(Casualties)
Multi-Vehicle
(Property Damage Only)
Single-Vehicle
(Casualties)
Single-Vehicle
(Property Damage Only)
Npredicted33.2770.2618.7843.28
NSPFx21.6446.6316.7037.60
CMF1 (Flat Curve)1.01.01.01.0
CMF2 (Lane Width)1.01.01.01.0
CMF3 (Inside Hard Shoulder)1.1091.0961.1091.096
CMF4 (Median Width)1.1531.1390.9551.137
CMF5 (Median Guardrail)1.0831.1091.0831.109
CMF6 (High Traffic Volume)1.1111.0890.9800.833
CMF7 (lane change)1.01.01.01.0
CMF8 (Outer Hard Shoulder)//1.01
CMF9 (Shoulder Vibrating Belt)//1.0.1.0
CMF10 (Lateral Residual Width)//1.01.0
CMF11 (Outer guardrail)//1.0161.021
Table 5. Two-way ten-lane road section traffic accident prediction correction coefficient calculation table.
Correction FactorMulti-Vehicle
(Casualties)
Multi-Vehicle
(Property Damage Only)
Single-Vehicle
(Casualties)
Single-Vehicle
(Property Damage Only)
CMF1 (Flat Curve)1.01.01.01.0
CMF2 (Lane Width)1.01.01.01.0
CMF3 (Inside Hard Shoulder)0.9630.9670.9630.967
CMF4 (Median Width)1.1531.1390.9551.138
CMF5 (Median Guardrail)1.0831.1091.0831.109
CMF6 (High Traffic Volume)1.1501.1200.9730.783
CMF7 (lane change)////
CMF8 (Outer Hard Shoulder)//1.01.0
CMF9 (Shoulder Vibrating Belt)//1.01.0
CMF10 (Lateral Residual Width)//1.0771.0
CMF11 (Outer guardrail)//1.0161.021
Table 6. Table for calculating the expected average accident frequency (times/year) for the forecast target section.
Road SectionEffective LengthNfNf,fs,10,mv,fiNf,fs,10,mv,pdoNf,fs,10,sv,fiNf,fs,10,sv,pdo
Badou–Taihe4.9 km173.4936.0572.5622.2342.65
Taihe–Shihu6.7 km235.0749.16106.6227.7554.54
Table 7. CMF factor table for left hard shoulder width.
Road Section Type ( x ) Accident Type ( y ) Accident Severity ( z ) CMF VariablesCMF Coefficient ( a )
All type ( a c )Multi-Vehicle
accidents ( m v )
Casualties ( f i )CMF3,fs,ac,mv,fi−0.0172
Property damage only ( p d o )CMF3,fs,ac,mv,pdo−0.0153
Single-Vehicle
accident ( s v )
Casualties ( f i )CMF3,fs,ac,sv,fi−0.0172
Property damage only ( p d o )CMF3,fs,ac,sv,pdo−0.0153
Publisher’s Note: MDPI stays neutral with regard to jurisdictional claims in published maps and institutional affiliations.