Abstract
Determining the lifetime of solar photovoltaic modules is integral to planning future installations and ensuring effective end-of-life management. The lifetime of photovoltaic modules is most commonly considered to be 25 years based on performance guarantees of 80% power output after 25 years of operation; however, influences including climatic conditions, social behaviour, fiscal policy, and technological improvements have the potential to prompt early replacement. Therefore, this work aims to estimate the operating lifetime of photovoltaic panels more accurately in Australia by considering a variety of technical, economic, and social reasons for decommissioning. Based on a range of sources including government organisations, other policymakers, regulators and advisors, energy suppliers, researchers, recyclers, and manufacturers, three lifetime models—power decrease, damage and technical failures, and economic motivation—were developed and then weighted in three scenarios to form overall views of panel lifetime in Australia. In addition, it was concluded that the module lifetime will vary considerably between countries due to differences in market factors. Therefore, these results specifically address Australia as most of the input data were sourced from Australian industry reports and Australian photovoltaic systems and interpreted within the context of the Australian photovoltaic market. However, the methodology of estimating lifetime based on both technical and non-technical factors can be applied to other scenarios by using country-specific data. With the popularity of photovoltaic technology beginning in the early 2010s and given the practical lifetimes of 15–20 years found in this work, Australia will need to act swiftly within the next three years to responsibly manage the looming solar panel waste.
1. Introduction
Solar Photovoltaics (PV) has taken off quickly. The annual installation volume has increased from 18 GW in 2010 to 183 GW in 2021 [1]. The PV industry just hit a new milestone in March 2022: 1 TW solar panels have been installed on the Earth to generate electricity directly from the sun [2]. Leading the world in PV installations per capita, the Australian solar photovoltaic (PV) market has continued to increase at a significant rate since the early 2010s, with the cumulated installed capacity expected to quadruple in less than 10 years, reaching over 80 GW by 2030 [3]. With expected lifespans of 25 years, large volumes of decommissioned panels are anticipated within the decade.
Predicting the lifespan of modules is important to ensure the effective management of end-of-life (EoL) PV for many reasons. For example, knowledge of module lifetime can assist in formulating waste projections, thereby informing the timeliness and location of recycling facilities. More accurate annual waste projections can also improve the economic feasibility of recycling because the operation is usually affected by the volume treated every year [4]. Additionally, lifetime estimates can assist in predicting installation trends, thereby providing an understanding of the installations required to achieve climate targets, including net-zero emissions by 2050 [5]. Furthermore, an understanding of the lifetime can assist in predicting the availability of recycled resources and to what extent these can contribute to manufacturing the required cumulative demand.
Within the literature, PV lifetime estimates are generally based on manufacturers’ warranty guarantees of at least 80% power output after 25 years of operation [6], meaning a 400 W rated module, for example, will be producing at least 320 W under standard testing conditions after 25 years. Most life cycle and economic analyses of PV systems assume a 25-year lifespan [7,8,9], as well as waste projection studies in Italy, Mexico, the USA, Turkey, and Bangladesh [10,11,12,13,14]. Mahmoudi et al. considered 30 years as the regular lifetime of a PV panel and added it to historical PV installation data in Australia to predict future waste volume generations [15]. The International Renewable Energy Agency (IRENA) and the International Energy Agency Photovoltaic Power Systems Programme (IEA-PVPS) considered two causes of end-of-life—early failure and system degradation. They modelled two scenarios using the Weibull distribution. The average panel lifetimes of 26 and 28 years were estimated for the early loss and regular loss scenarios, respectively. From these models, IRENA and IEA-PVPS predicted that PV waste volumes will reach 78 million tonnes in 2050 and that global annual PV installation volumes will equal annual decommission volumes in 2050 [16]. Even though the authors acknowledge their method and baseline assumptions have uncertainties that will need to be refined as more real-world data become available, this Weibull distribution method has been cited in subsequent research to predict solar panel waste generation in Australia, Spain, and South Korea [17,18,19].
All these waste studies concluded that the current low PV waste volume will surge around 2030, based on the 25-year average lifetime estimates. Recent industry reports highlight that the actual PV module lifetime is much shorter than 25 years due to damage and failures, as well as social and economic reasons [20,21,22], which were not considered in IRENA and IEA-PVPS’s baseline assumptions. As reported by Tao et al. [23], an increasing number of modules will reach their end-of-life earlier than expected because of damage during installation or storms, component failures, or simply the economic incentive of replacing older modules with higher-efficiency ones. However, currently, no lifetime models have been developed to encapsulate these influences. Therefore, predictions of PV waste are likely underestimated, meaning the amount of PV waste will increase at a faster rate than expected.
The most referenced lifespan is the industry standard of 25 years. which is based only on performance warranties with limited practical module performance and decommission statistics. Other factors that affect the practical lifetime and decommission of solar panels have been discussed qualitatively but not quantitatively. Addressing this gap in the literature, this paper aims to develop new quantitative lifetime models to better estimate the actual lifetime of solar panels to inform future waste projection. We used actual PV system degradation data in Australia, practical lifetime reported by the Australian industry, and literature assessing practical factors for early PV decommission to provide potential views of the lifespan of Australian PV panels. The new models consider power decreases, damage and technical failures, and economic motivation factors individually, as well as various reasons combined. The overall lifetime models weight individual factors differently for different scenarios, which may not only be applicable to forecast future solar panel waste volume in Australia but also applicable to other countries to better predict the future waste flow from decommissioned solar panels.
2. Background
2.1. Current Lifetime Estimates
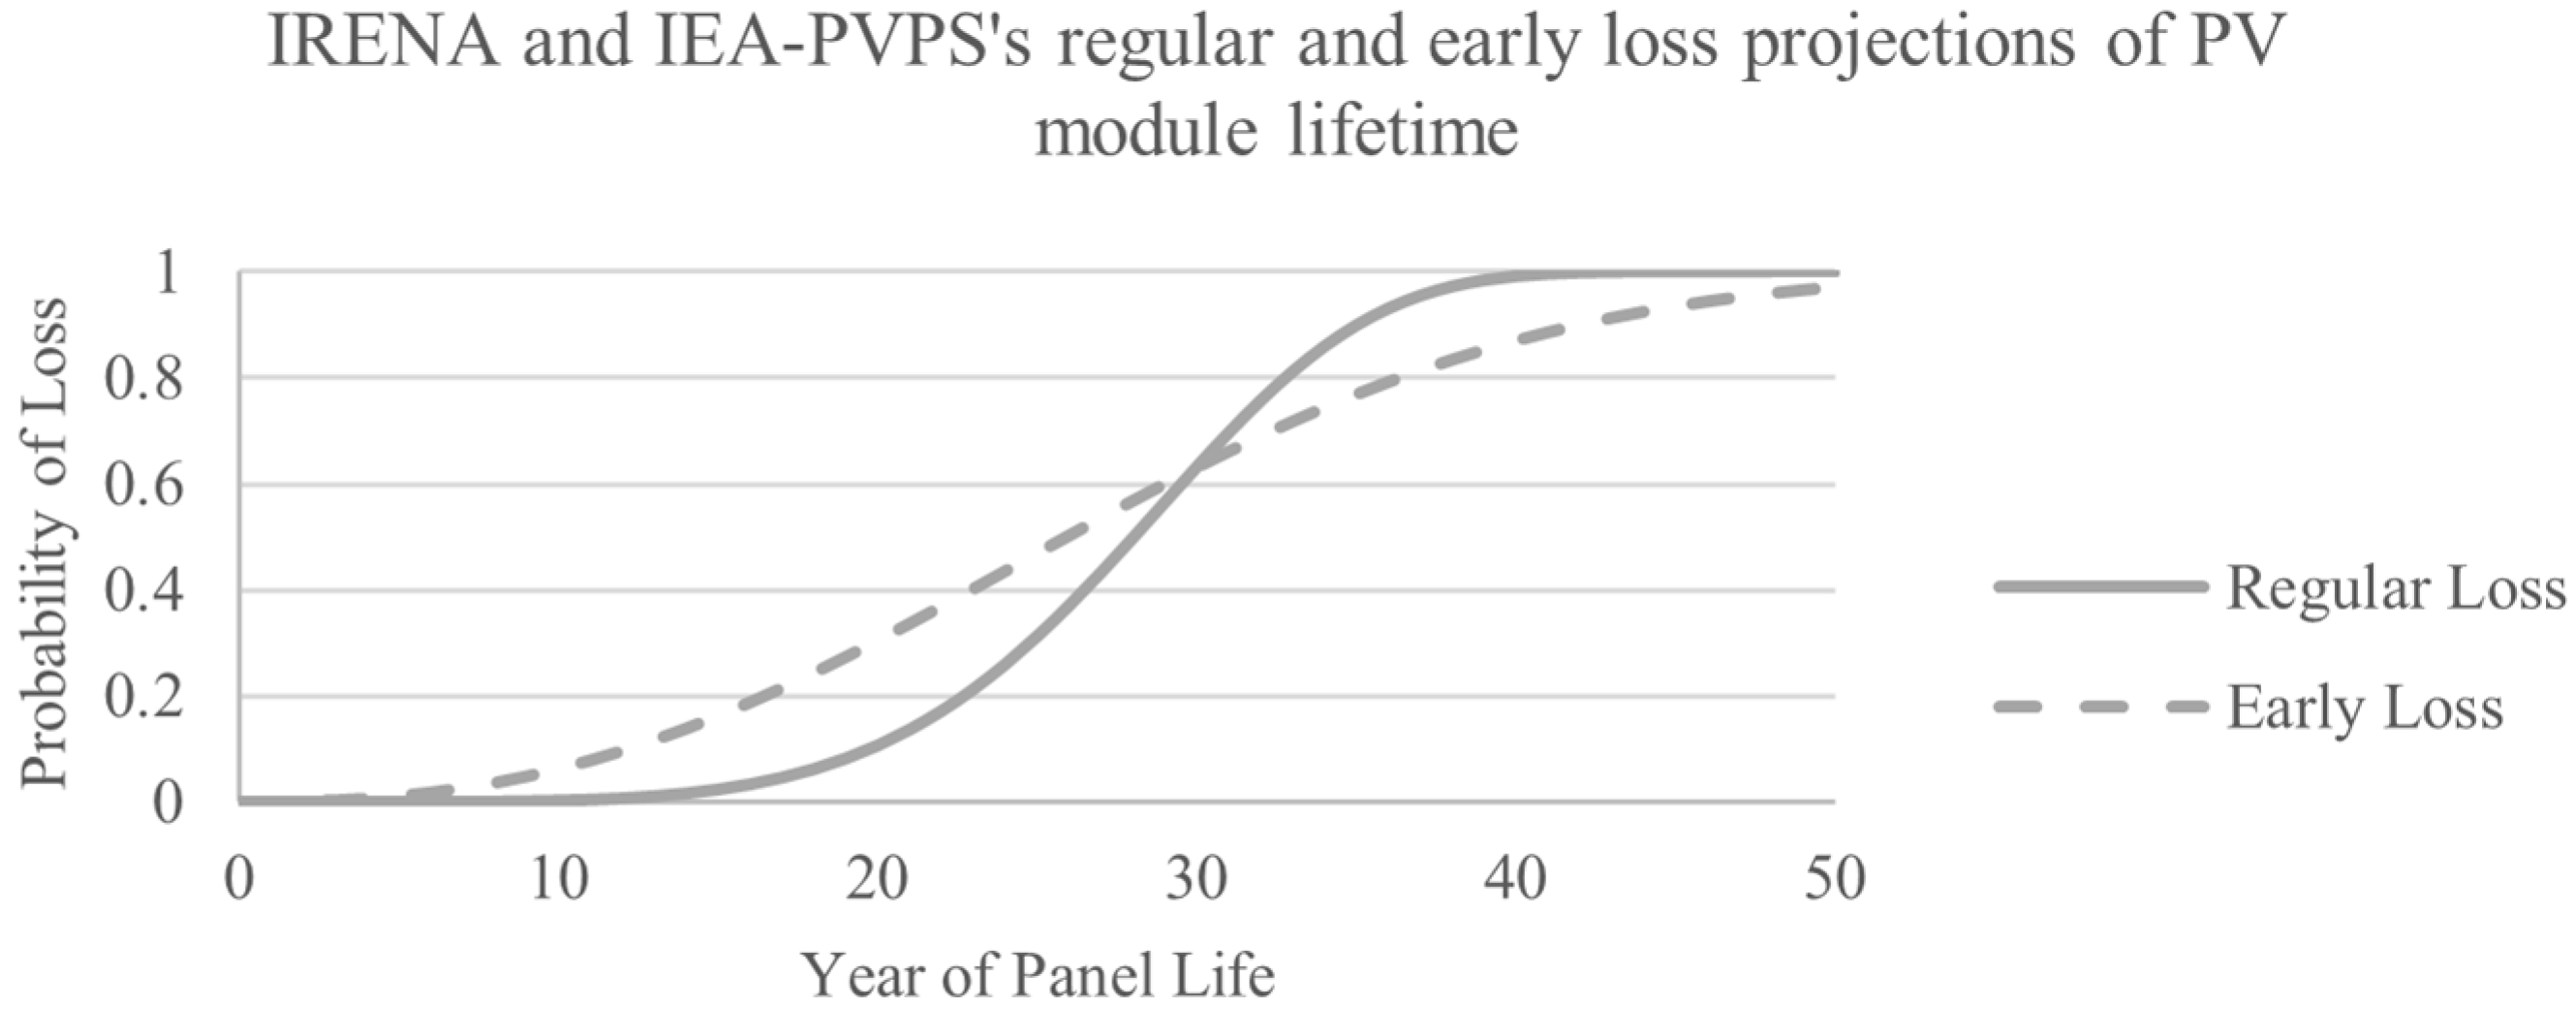
Currently, there is no publicly available data in Australia or globally concerning the age of PV modules when decommissioned; therefore, the actual operating lifetimes of modules are unknown. However, within the sector, perhaps the best-regarded and most-referenced estimate of a lifetime is given by IRENA and IEA-PVPS [16]. That 2016 report provided the first global projections for future PV panel waste volumes to 2050. In estimating the volume of future PV waste, IRENA and IEA-PVPS projected a regular loss scenario based on an average panel lifetime of 28 years, and an early loss scenario that considers ‘infant’, ‘mid-life’, and ‘wear-out’ failures shortening the average lifetime to 26 years. The Weibull function describes the probability (%) of module decommission during the panel life cycle. Both the regular loss and early loss scenarios were modelled with a Weibull distribution as shown in Equation (1),
where t is the time in years, β is the scale parameter, which is the 63.2 percentile of the data, is the shape parameter, and the average lifetime is the 50th percentile of the data [16]. The shape factor for the regular loss scenario is 5.3759 based on the degradation analysis by Kuitche [24], in which power output data for five modules in the USA were linearly extrapolated to 80% and then used to form a lifetime model. In terms of IRENA and IEA-PVPS’s [16] early loss scenario, input assumptions drawn from the literature were considered; however, the method of determining the shape parameter of 2.4928 is not specified. For the scale parameter, both scenarios use 30 years. Figure 1 plots the Weibull functions for IRENA and IEA-PVPS’s regular and early loss scenarios using the scale and shape parameters defined above, and Table 1 provides the input assumptions on ‘infant’, ‘mid-life’, and ‘wear-out’ failures, which were used in IRENA and IEA-PVPS’s early loss scenario.
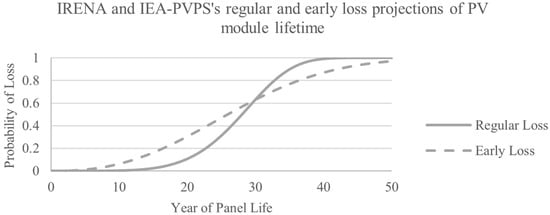
Figure 1.
Regular and early loss projections of PV module lifetime, adapted from IRENA and IEA-PVPS [16].

Table 1.
Input assumptions and reasoning for IRENA and IEA-PVPS’s [16] early loss scenario, which considers EoL due to damage and technical failures.
Regarding other significant bodies within the PV sector, including the National Renewable Energy Laboratory (NREL) in the USA and the Clean Energy Council (CEC) in Australia, module lifetime is estimated significantly lower at 10–12 years based on reports from industry experts [22,25]. Similarly, a scoping report conducted for the New South Wales (NSW) Department of Planning, Industry, and Environment in Australia to inform planning surrounding EoL PV management estimates lifespans of 15–20 years based on expert, industry interviews [20]. Therefore, in the literature, there appears to be variation between IRENA and IEA-PVPS’s [16] 30-year average lifetime and what the industry is reporting, likely because IRENA and IEA-PVPS only considers technical reasons for EoL and not socio-economic reasons, which can prompt early replacement.
2.2. Reasons for Decommissioning
IRENA and IEA-PVPS’s [16] regular and early loss scenarios only consider technical reasons for decommissioning. Specifically, modules can reach EoL either due to a decrease in power output from degradation or early damage and technical failures.
Discussions with those in the industry in Australia have indicated that within the residential market, it is Government rebates and incentives and/or insistent salespeople from solar companies prompting the early replacement of modules despite still being technically sound [26,27]. As the Green Energy Market (GEM) [28] reports, “replacement [of residential panels] is not necessarily because the solar modules have failed. Solar modules [are] often still functioning quite well at 20 years of age, but replacements will be spurred because households decide that they would be better off with a much larger capacity system than was originally installed”, as both demand and electricity prices increase. Additionally, replacements will very likely be of a full-system nature rather than individual modules due to limited roof space and the relative ease of replacing small systems [25].
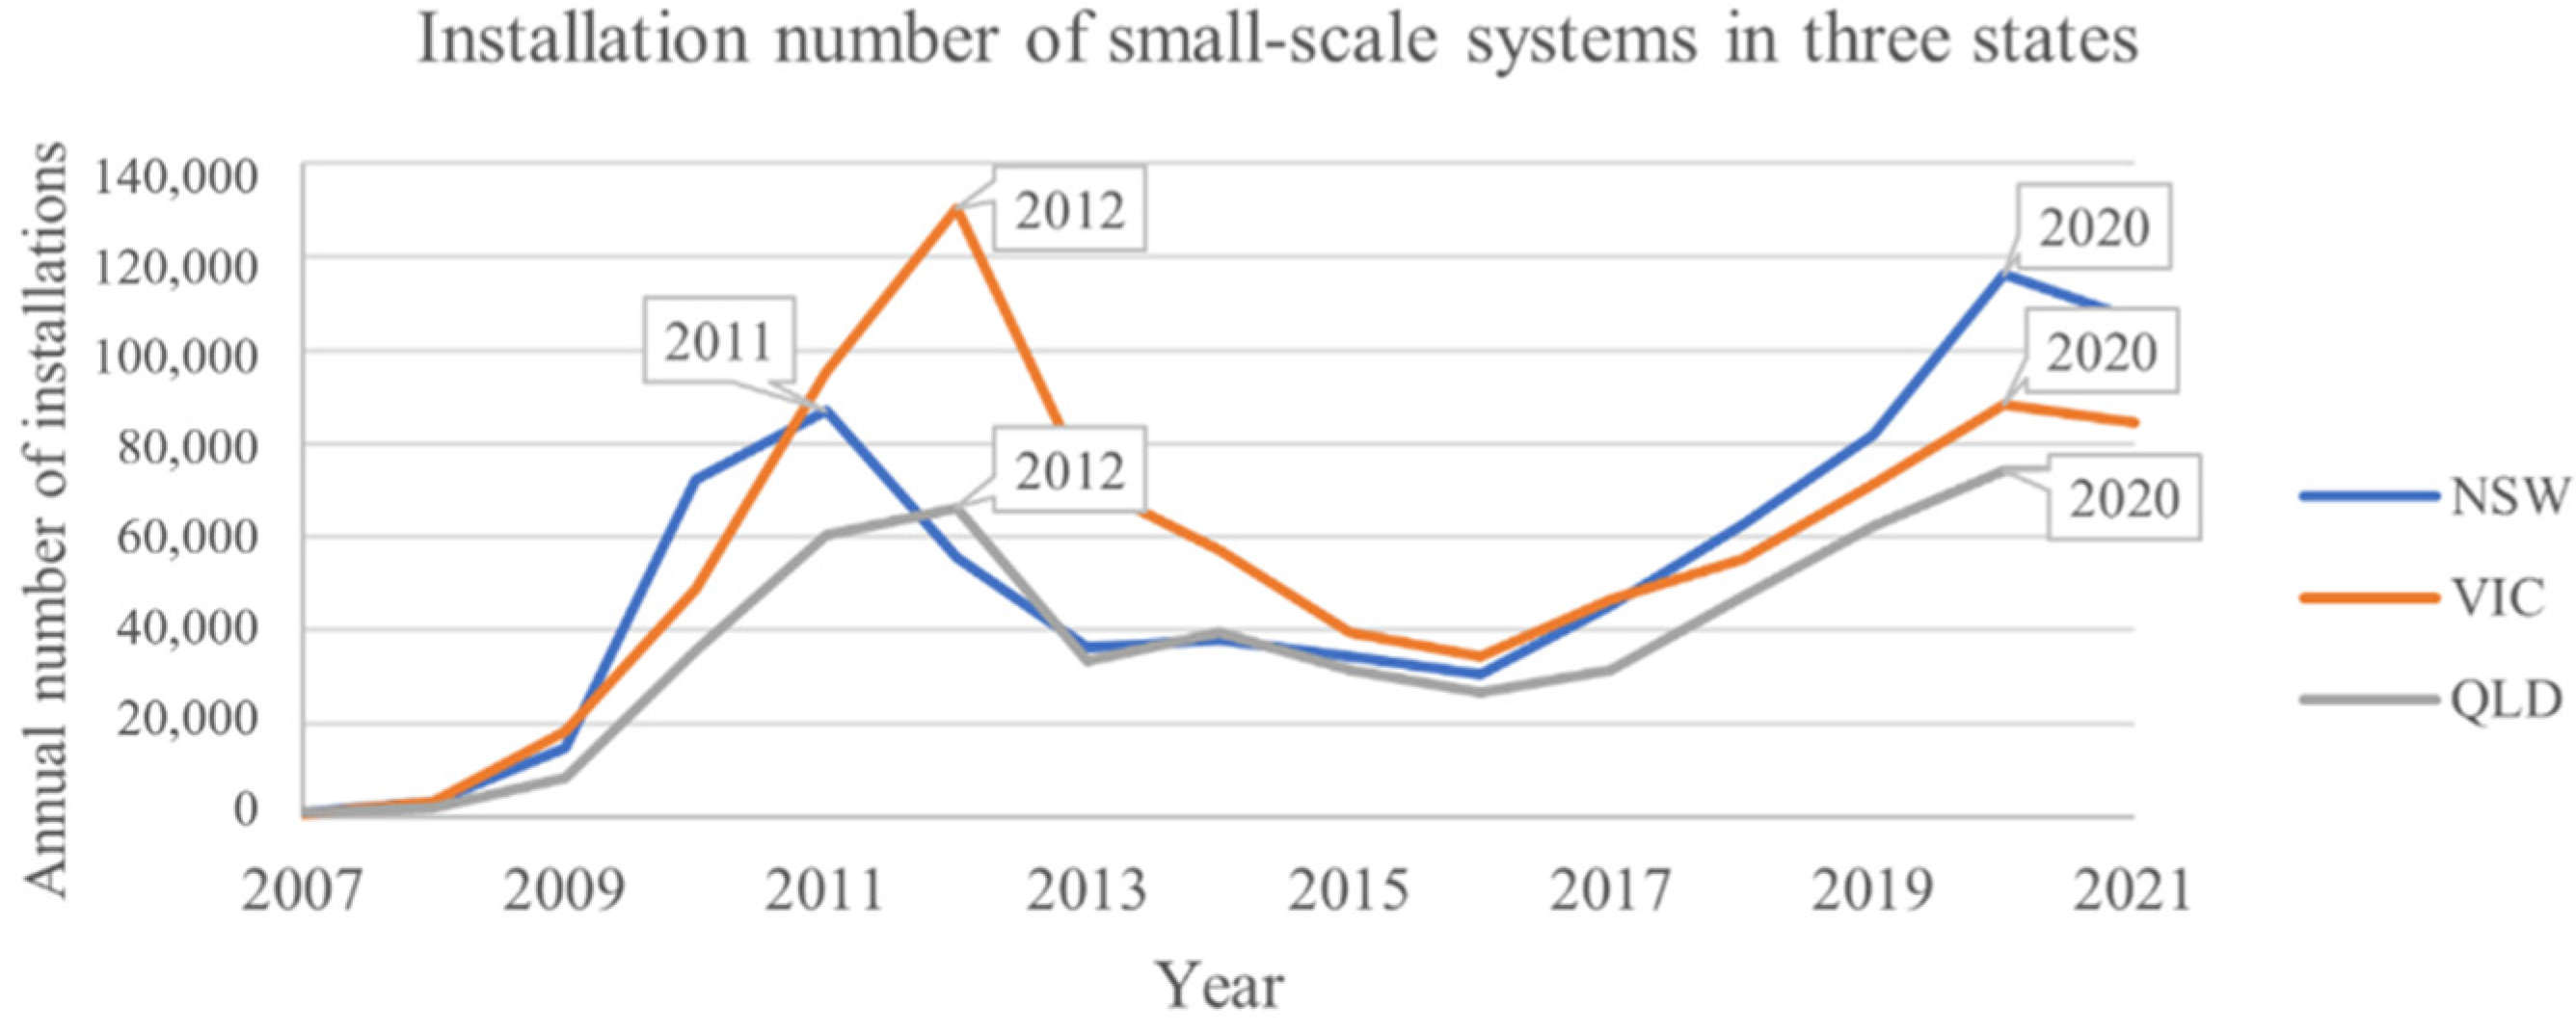
An example of this in the Australian context is depicted in Figure 2 in which two peaks in small-scale installation numbers occurred in 2011/2012 and 2020.

Figure 2.
Annual number of installations of small-scale systems in NSW, VIC, and QLD from 2007–2021 [29].
The first peak in 2011/2012 was promoted by the Federal Government’s introduction of small-scale technology certificates (STCs), which reduced upfront residential PV costs by approximately 30–40% [29,30]. Then the second peak in 2020 occurred when NSW, Queensland (QLD), and Victoria (VIC) introduced their first state-led rebates and interest-free loan schemes [29,31]. These incentives allowed for the replacement of older systems with newer, cheaper, and more efficient modules, therefore triggering the early decommissioning of technically sound systems.
In addition to economics, there are additional social reasons for decommissioning, including inappropriate installation location, damage from vandalism, renovations, battery upgrades, and change in regulations [20,21,22,32,33]. Section 3.2.4 will explore an additional lifetime model that considers these reasons.
2.3. Considerations of Residential, Commercial, and Utility Systems
As discussed in the previous section, early replacement of residential panels is primarily economically motivated. In contrast, as reported by an industry installer with over 10 years of experience, commercial and utility modules will most often be decommissioned at damage or failure due to multiple reasons.
Firstly, as opposed to residential modules, these systems suffer less from space constraints and more from taxing full-system replacement, thus if expansion is desired, modules will be added, and if the system is underperforming, only affected modules will be replaced [26]. Secondly, upon design, these systems are technically and economically planned for a lifespan of at least 25 years, aligning with standard manufacturer warranties, which guarantee panels will produce 80% of their rated output at 25 years. This means commercial and utility modules are intended to remain in operation until reduced power output. Thirdly, commercial and utility systems can be replaced based on economic grounds; however, these consumers are more likely to be savvy and swayed less by salespeople. Moreover, the current incentives in Australia for large-scale systems are limited only to Large-scale Generation Certificates (LGCs), which encourage less premature replacement of modules in comparison to the small-scale incentives discussed. This is because LGCs do not provide any upfront discount on system costs nor do they allow for the replacement of older systems [34].
As of 2021, in Australia, 50% of installed capacity is residential systems, 15% is commercial, and the remaining 35% is utility-scale [29]. Figure 3 shows the majority of utility systems have been installed since 2018, whereas the installation of residential systems has been relatively consistent since 2010.
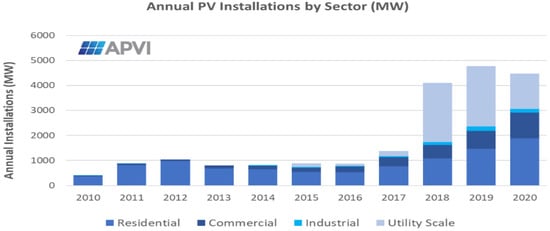
Figure 3.
Annual PV installations by sector in Australia from 2010–2020 [31].
3. Methods
3.1. Pedigree Matrix
There is a necessity to improve the existing forecasting models that only consider the performance warranty and degradation from five experimental modules with a larger real-world dataset to reassess key parameters in the lifetime model.
The following pedigree matrix (Table 2) was employed to assess the credibility of sources and the given lifetime estimates.
Table 2.
Pedigree matrix for assessing source credibility.
Known reliable sources include IRENA and IEA-PVPS, NREL, and CEC. Sources with clear reasoning include reasons for EoL, for example, a power decrease or economic motivation, or a list of various reasons. A clear methodology involves an explanation of the method utilised to determine the lifetime estimate and associated reason. Acceptable methodologies include statistical analyses of performance and the market, as well as interviews within the industry.
In this work, to combine multiple sources, rankings from the pedigree matrix were used. For instance, to form a distribution from two estimates with rankings 3 and 2, the estimate from the former would be repeated three times and the latter twice (used in Section 3.2.4). Similarly, when combining distributions from two sources ranked 3 and 2, the former would be weighted 3/5 and the latter 2/5 (used Section 3.2.1 and Section 3.2.3).
3.2. Development of Lifetime Models
There are three primary reasons for the decommissioning of PV modules in Australia: Power decrease, damage and technical failures, and economic motivation. In this work, lifetime models for each reason have been estimated. Both the power decrease and damage and technical failures model provide lifetime estimates immune to the effects of market imperfections (e.g., subsidies and government policies), similar to the net energy analysis approach [35], whereas the economic motivation model estimates lifetime based on socio-economic influences, aligning with Georgescu-Roegen’s [36] entropy law. These two types of lifetime assessment are then integrated by weighting the models in three scenarios to form potential overall views of panel lifetime in Australia.
Additionally, to consider a range of technical, social, and economic factors, a lifetime model incorporating a variety of reasons was also explored. The following Section 3.2.1, Section 3.2.2, Section 3.2.3, Section 3.2.4 and Section 3.2.5 will provide insight into the development of the models.
3.2.1. Power Decrease Model
Modules that have degraded to 80% power output are commonly considered at EoL [16,24]. In Kuitche [24], power output data for five modules were linearly extrapolated to 80% and then fitted to a Weibull distribution. Similarly, Kumar et al. [37] fit failure data from twenty modules to a Weibull distribution using the method of least squares.
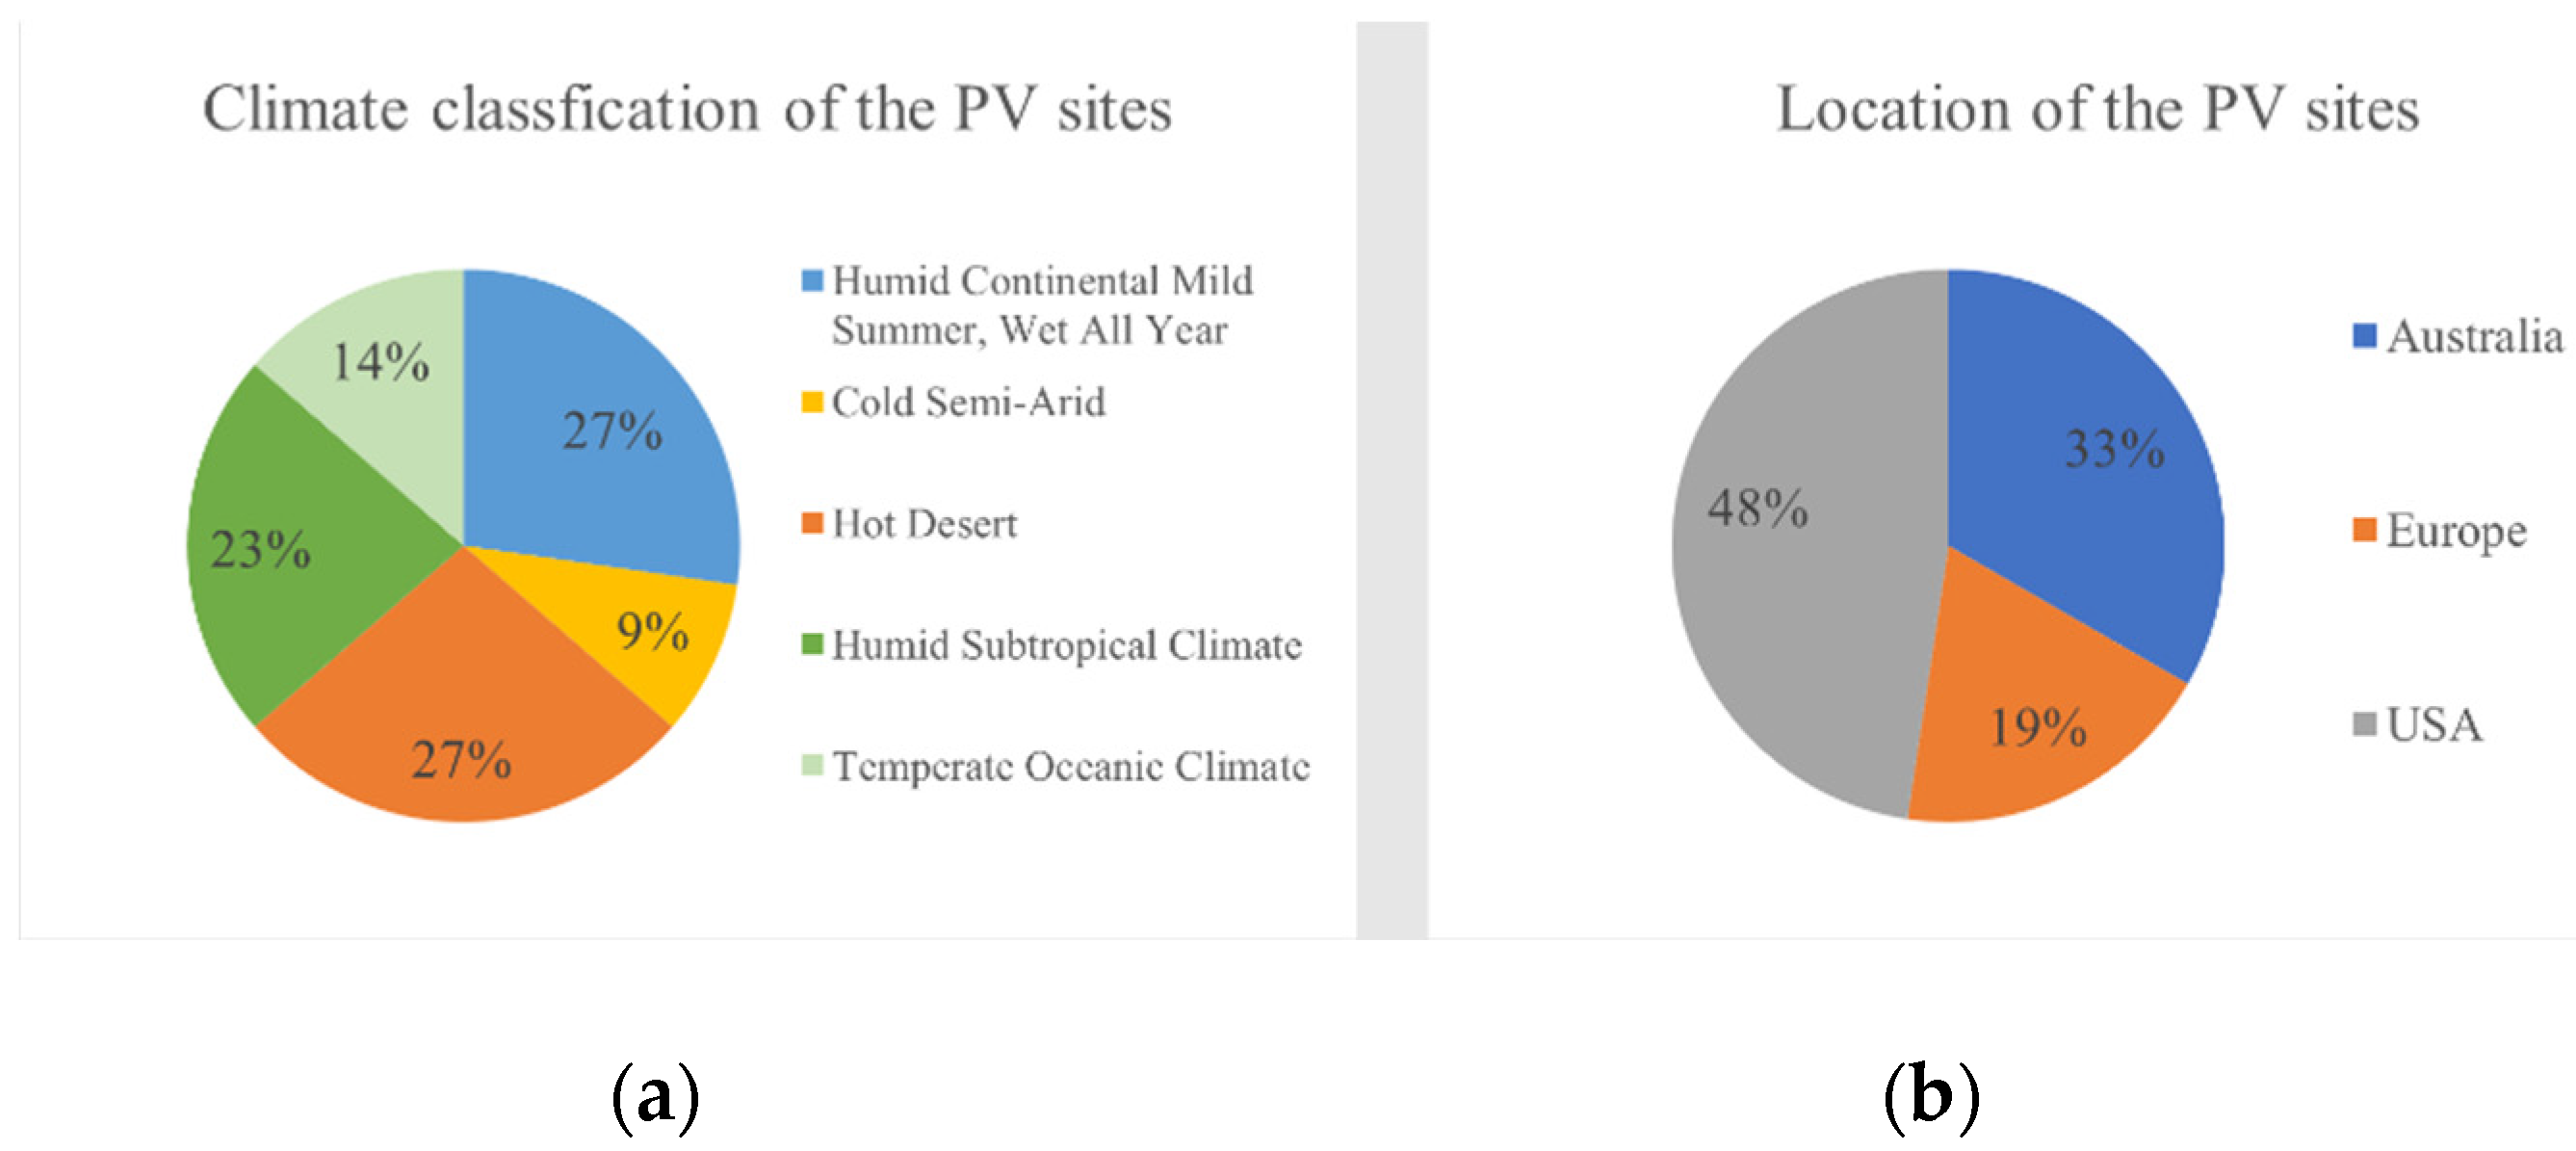
In this work, to model the lifetime due to a power decrease, a similar methodology utilised by Kuitche [24] and Kumar et al. [37] was applied to twenty-two PV sites in Australia, Europe, and the United States [38,39,40]. Figure 4 provides a breakdown of the sites in terms of location and the Köppen–Geiger classification [41].
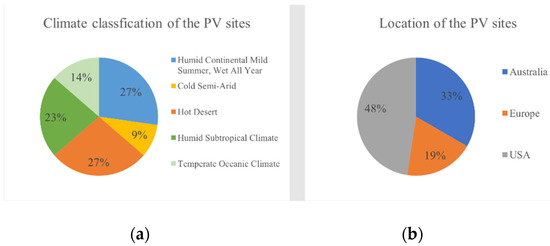
Figure 4.
Breakdown of the twenty-two PV sites in terms of (a) climate classification and (b) location.
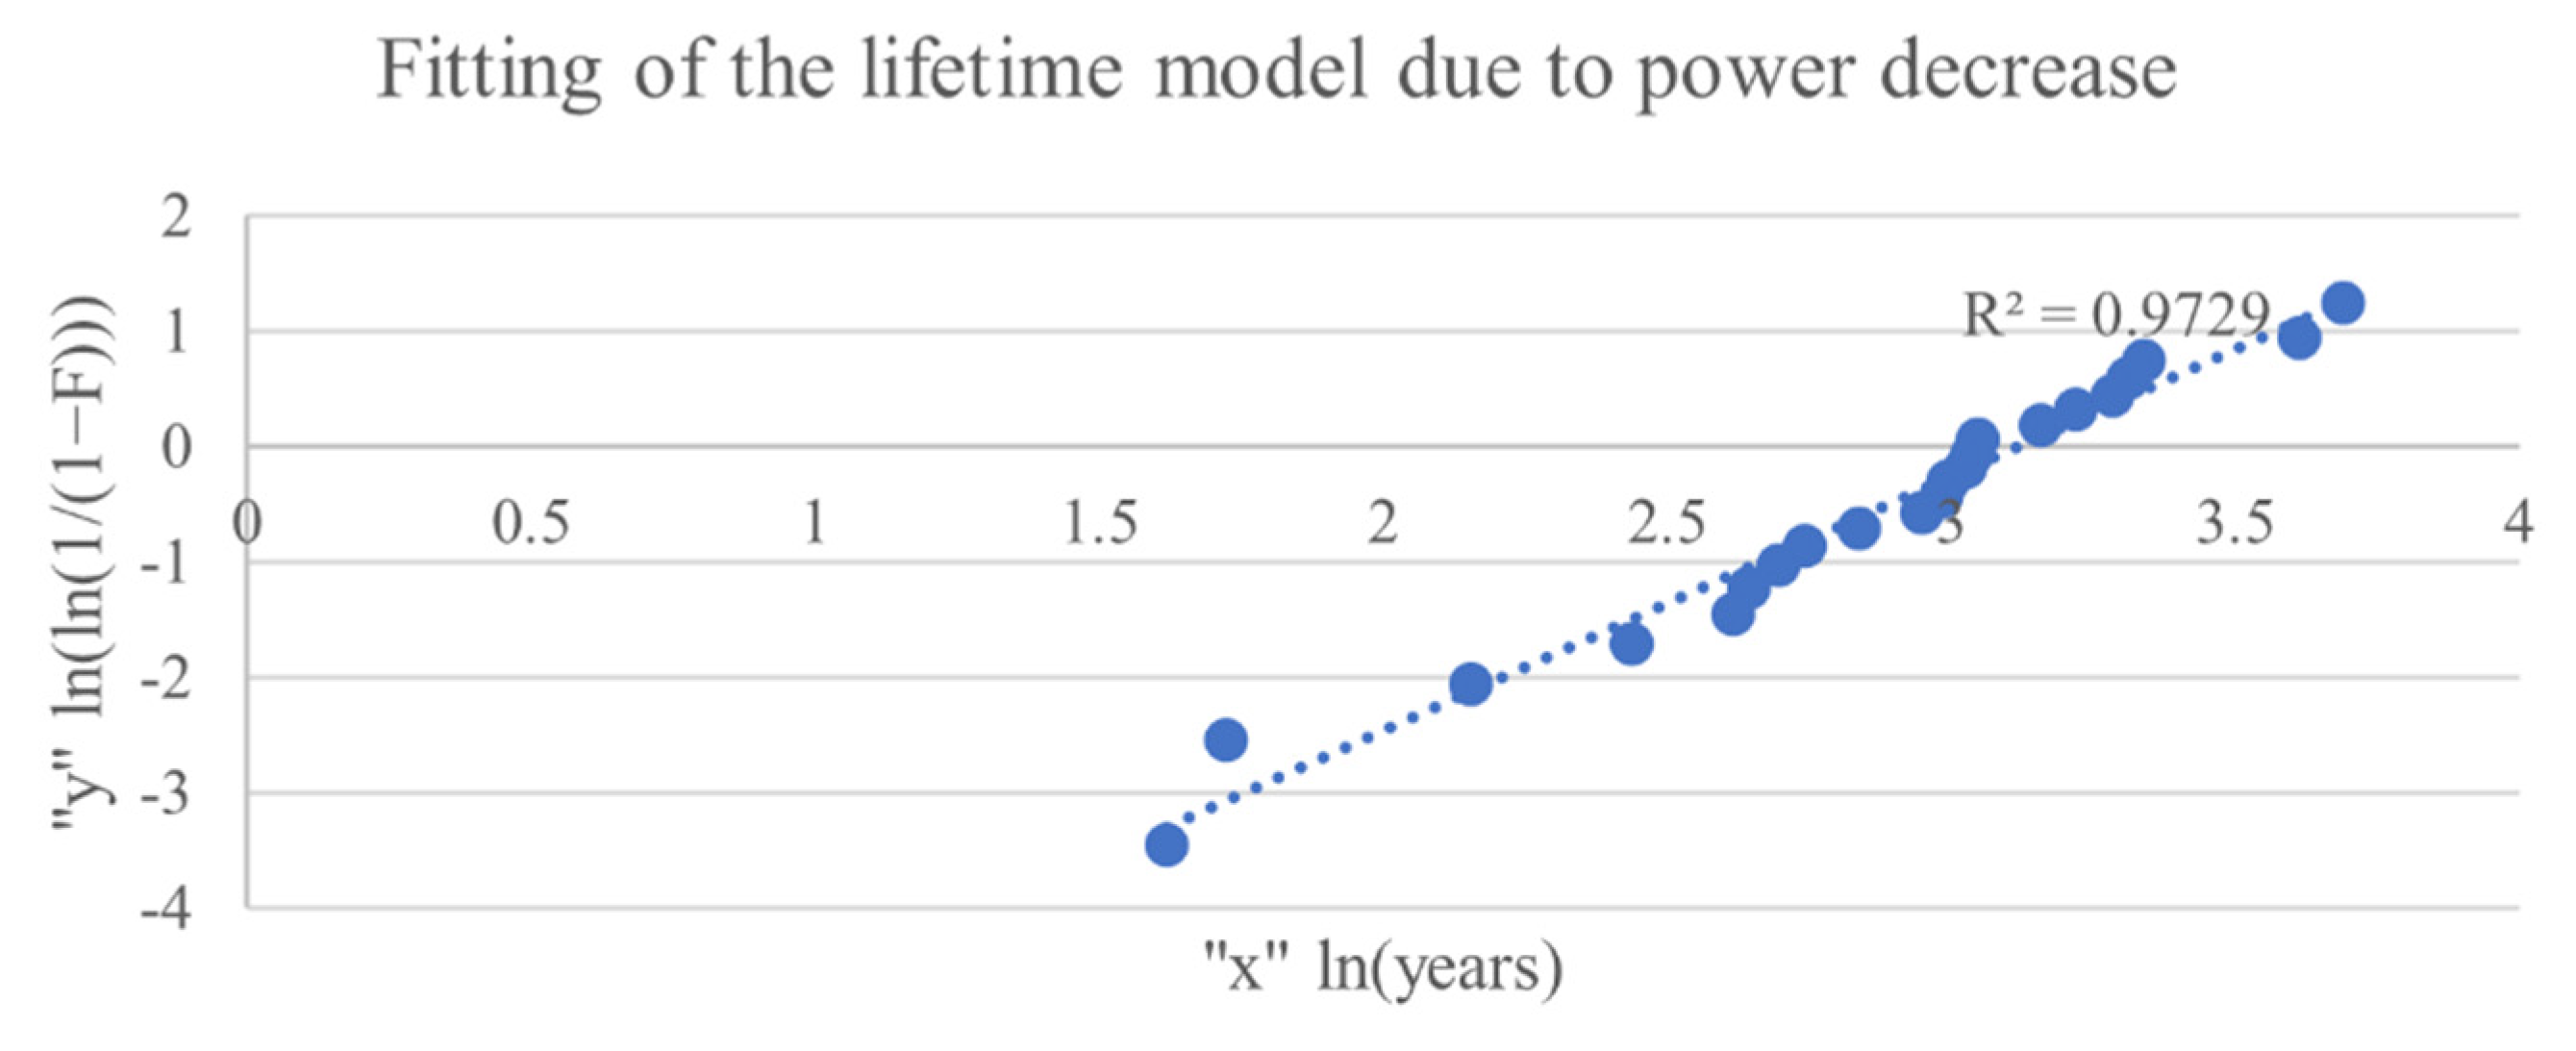
Although nearly half of the sites used in the model are from the USA, over 70% are located in the same climatic conditions as the eastern side of Australia where the density of solar installations is greatest. The performance loss rates (PLRs) from these sites were linearly extrapolated to 80% power output and fitted to a Weibull distribution using the method of least squares. Confirming the goodness-of-fit, the R2 value was 0.97 (Figure 5).
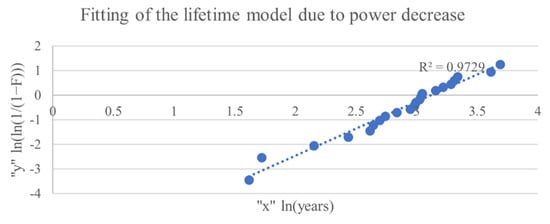
Figure 5.
Fitting of the lifetime model due to power decrease to a Weibull distribution using the method of least squares.
Following this, to give regard to IRENA and IEA-PVPS’s [16] regular loss distribution, it was combined with the above-mentioned power decrease Weibull to create a weighted power decrease model. IRENA and IEA-PVPS [16] was weighted 5/11 and the power decrease Weibull 6/11 (as discussed in Section 3.1).
3.2.2. Damage and Technical Failures Model
PV panels can become waste before reaching their estimated EoL targets of 25–30 years due to damage and technical failures [16]. Reasons for early loss include damage during transportation and installation, electrical system failures, as well as the degradation and corrosion of components [16].
In this work, to model decommissioning due to damage and technical failures, IRENA and IEA-PVPS’s [16] early loss assumptions were used to form a cumulative density function (CDF) summing to 7% at 15 years. The following are the cumulative input assumptions [16]:
- 1 year: 0.5% due to damage during transport and installation phases.
- 2 years: 1% due to bad installation.
- 10 years: 3%.
- 15 years: 7% due to technical failures.
3.2.3. Economic Motivation Model
As mentioned, economic motivation appears to be a major driver for panel replacement, particularly in the small-scale market. Both Duran et al. [42] and Jean et al. [43] have conducted an economic analysis of module lifetimes in the USA. Duran et al. [42] conducted an eight-scenario sensitivity analysis of the economic replaceability of residential panels considering the installation price, module efficiency, and compensation rate, and assuming customers will replace when the new market offer has a positive Net Present Value (NPV). The compensation rate refers to the rate at which consumers are compensated for their solar PV generation. Jean et al. [43] undertook a Levelised Cost of Electricity (LCOE) optimization analysis based on initial degradation rates for residential, commercial, and utility-scale systems, considering improving the module cost and efficiency. Assuming degradation below 1%, for optimal LCOE, all modules should be replaced at 15 years; however, for degradation above 1%, panels in residential systems should be replaced earlier at 10 years [43].
In this work, based on Duran et al. [42] and Jean et al. [43], a CDF function was created to model panel lifetime assuming consumers will replace panels when it is economically beneficial, resulting in an average lifetime of 12–14 years. The following table (Table 3) outlines the inputs, assumptions, and weighting for each CDF.
Table 3.
Cumulative inputs, assumptions, and weighting for the two economic lifetime distributions based on Duran et al. [42] and Jean et al. [43].
3.2.4. Variety of Reasons Model
In researching EoL PV modules in Australia, many sources provide an overarching estimate of lifetime giving multiple possible reasons for decommissioning. Rather than specifying an estimate based solely on damage and technical failures, for example, these sources will provide a list of reasons or only the estimate itself. In this work, to encompass these sources, a Weibull distribution was fitted to the estimates, again utilising the least-squares method. Ten sources and thirty-three weighted data points were used from a variety of references including researchers, policymakers, regulators and advisors, recyclers, energy suppliers, and manufacturers (Table 4).
Table 4.
Average lifetime inputs and weighting for the lifetime model due to a variety of reasons.
Seven of the ten sources are Australian references, thereby providing a greater representation of lifetimes specific to Australia. Confirming the goodness-of-fit, the R2 value is 0.95 (Figure 6).
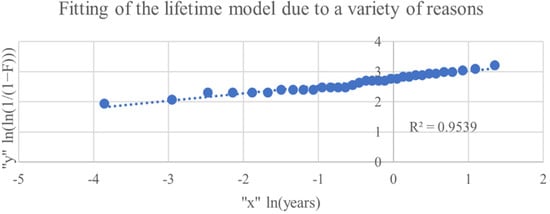
Figure 6.
Fitting of the lifetime model due to a variety of reasons to a Weibull distribution using the method of least squares.
3.2.5. Overall Lifetime Models
To provide possible overall views of panel lifetime in Australia, the three primary reasons for decommissioning, power decrease, damage and technical failures, and economic motivation were weighted in three different scenarios (Table 5).
Table 5.
Overall lifetime model scenarios and the weightings of each reason for decommissioning.
The weightings for the scenarios were selected arbitrarily. Regarding the damage and technical failures model, the original CDF (Section 3.2.2) based on IRENA and IEA-PVPS [16], the single, most reliable source on decommissioning due to this reason, was scaled to 100% cumulative density at 15 years, resulting in the following scaled cumulative input assumptions (Table 6).
Table 6.
Cumulative input assumptions for both the original and scaled damage and technical failures lifetime models.
Then, for all scenarios, the scaled model was weighted at 7% because the original CDF totalled 7% at 15 years. Following this, the weighting of the other two models was varied to provide a scenario in which economic motivation dominates, one in which power decrease dominates, and one in which these reasons are equally split.
Scenario 1 aims to provide a lifetime model for residential modules in Australia. Economic motivation is significantly weighted at 70% because, as discussed, residential PV replacement in Australia is primarily consumer- and market-driven, estimating 70% of decommissioning cases are due to Government rebates and incentives and/or insistent salespeople from solar companies. Scenario 2 provides a ‘middle-ground’ lifetime model in which both power decrease and economic motivation are weighted equally at 46.5%. In Scenario 3, EoL due to power decrease is weighted highly at 70% and economic motivation at 23%. This scenario provides a lifetime model for commercial and utility panels, which are most likely decommissioned when damaged or underperforming, rather than based on current Government incentives and/or favourable market conditions. A Weibull distribution was then fitted to each scenario, which follows the same shape as IRENA and IEA-PVPS’s [16] early loss.
4. Results
4.1. Power Decrease, Damage and Technical Failures, and Economic Motivation Models
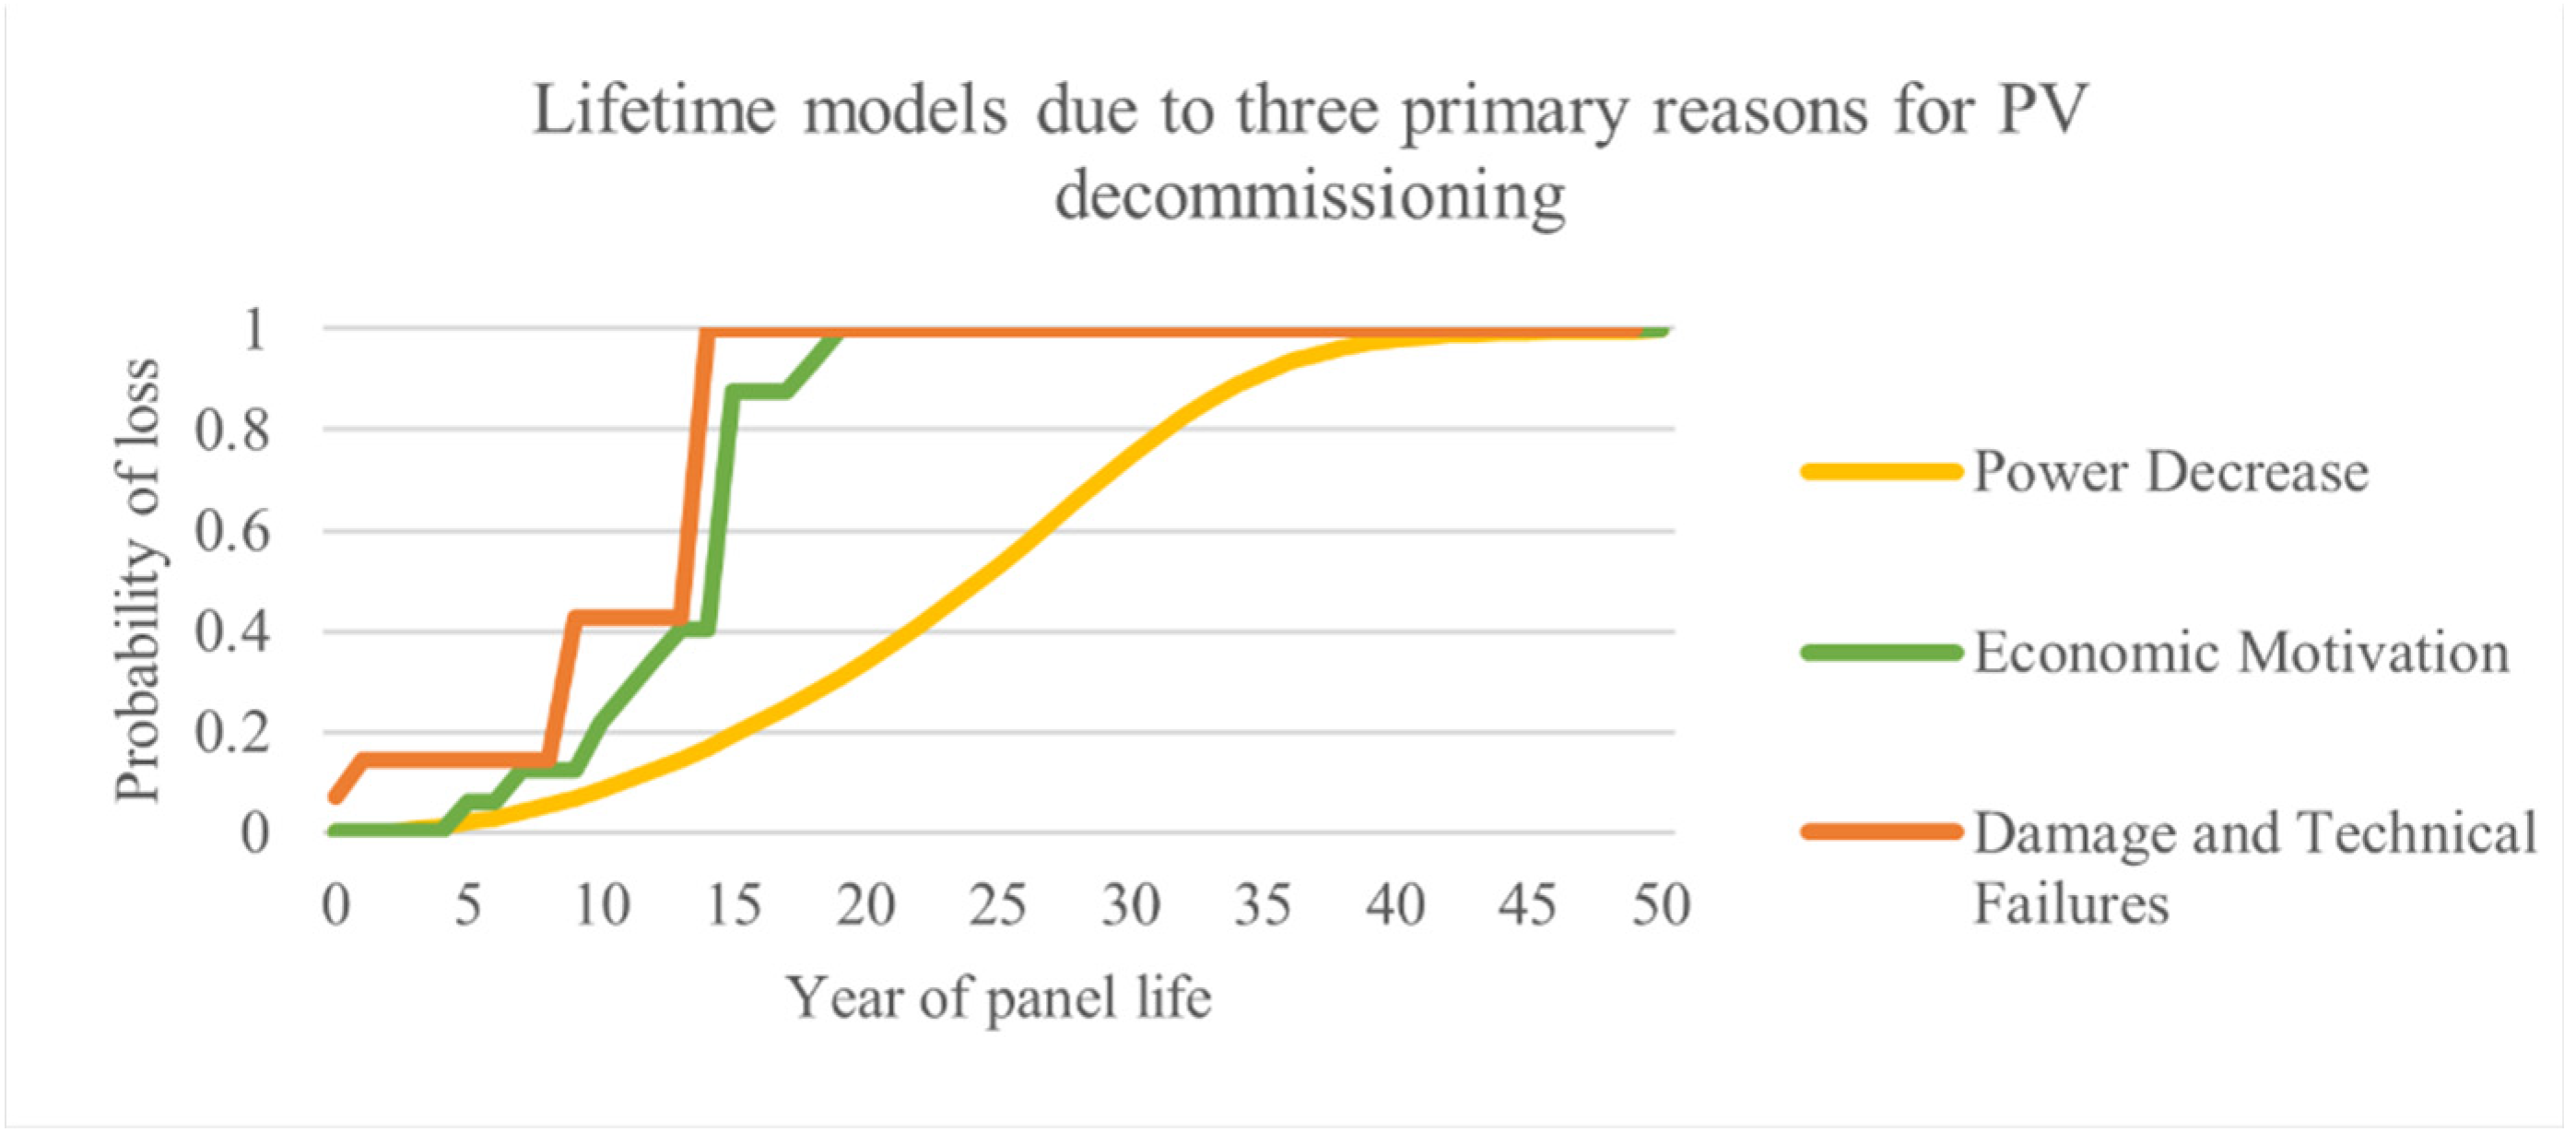
Figure 7 provides the lifetime models due to three primary reasons for the decommissioning of PV modules, and Table 7 provides the average lifetime for each model. We will discuss these models in Section 5.
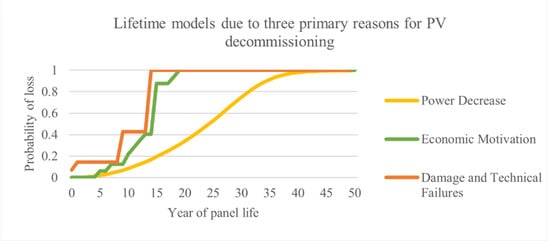
Figure 7.
Lifetime models due to three primary reasons for decommissioning of PV modules in Australia: Decrease in power output, damage and technical failures, and economic motivation. The scaled damage and technical failures CDF are depicted because this is the model that is weighted to form the three scenarios.
Table 7.
Summary table providing the average lifetime for the three lifetime models: Power decrease, damage and technical failures, and economic motivation.
4.2. Variety of Reasons Model
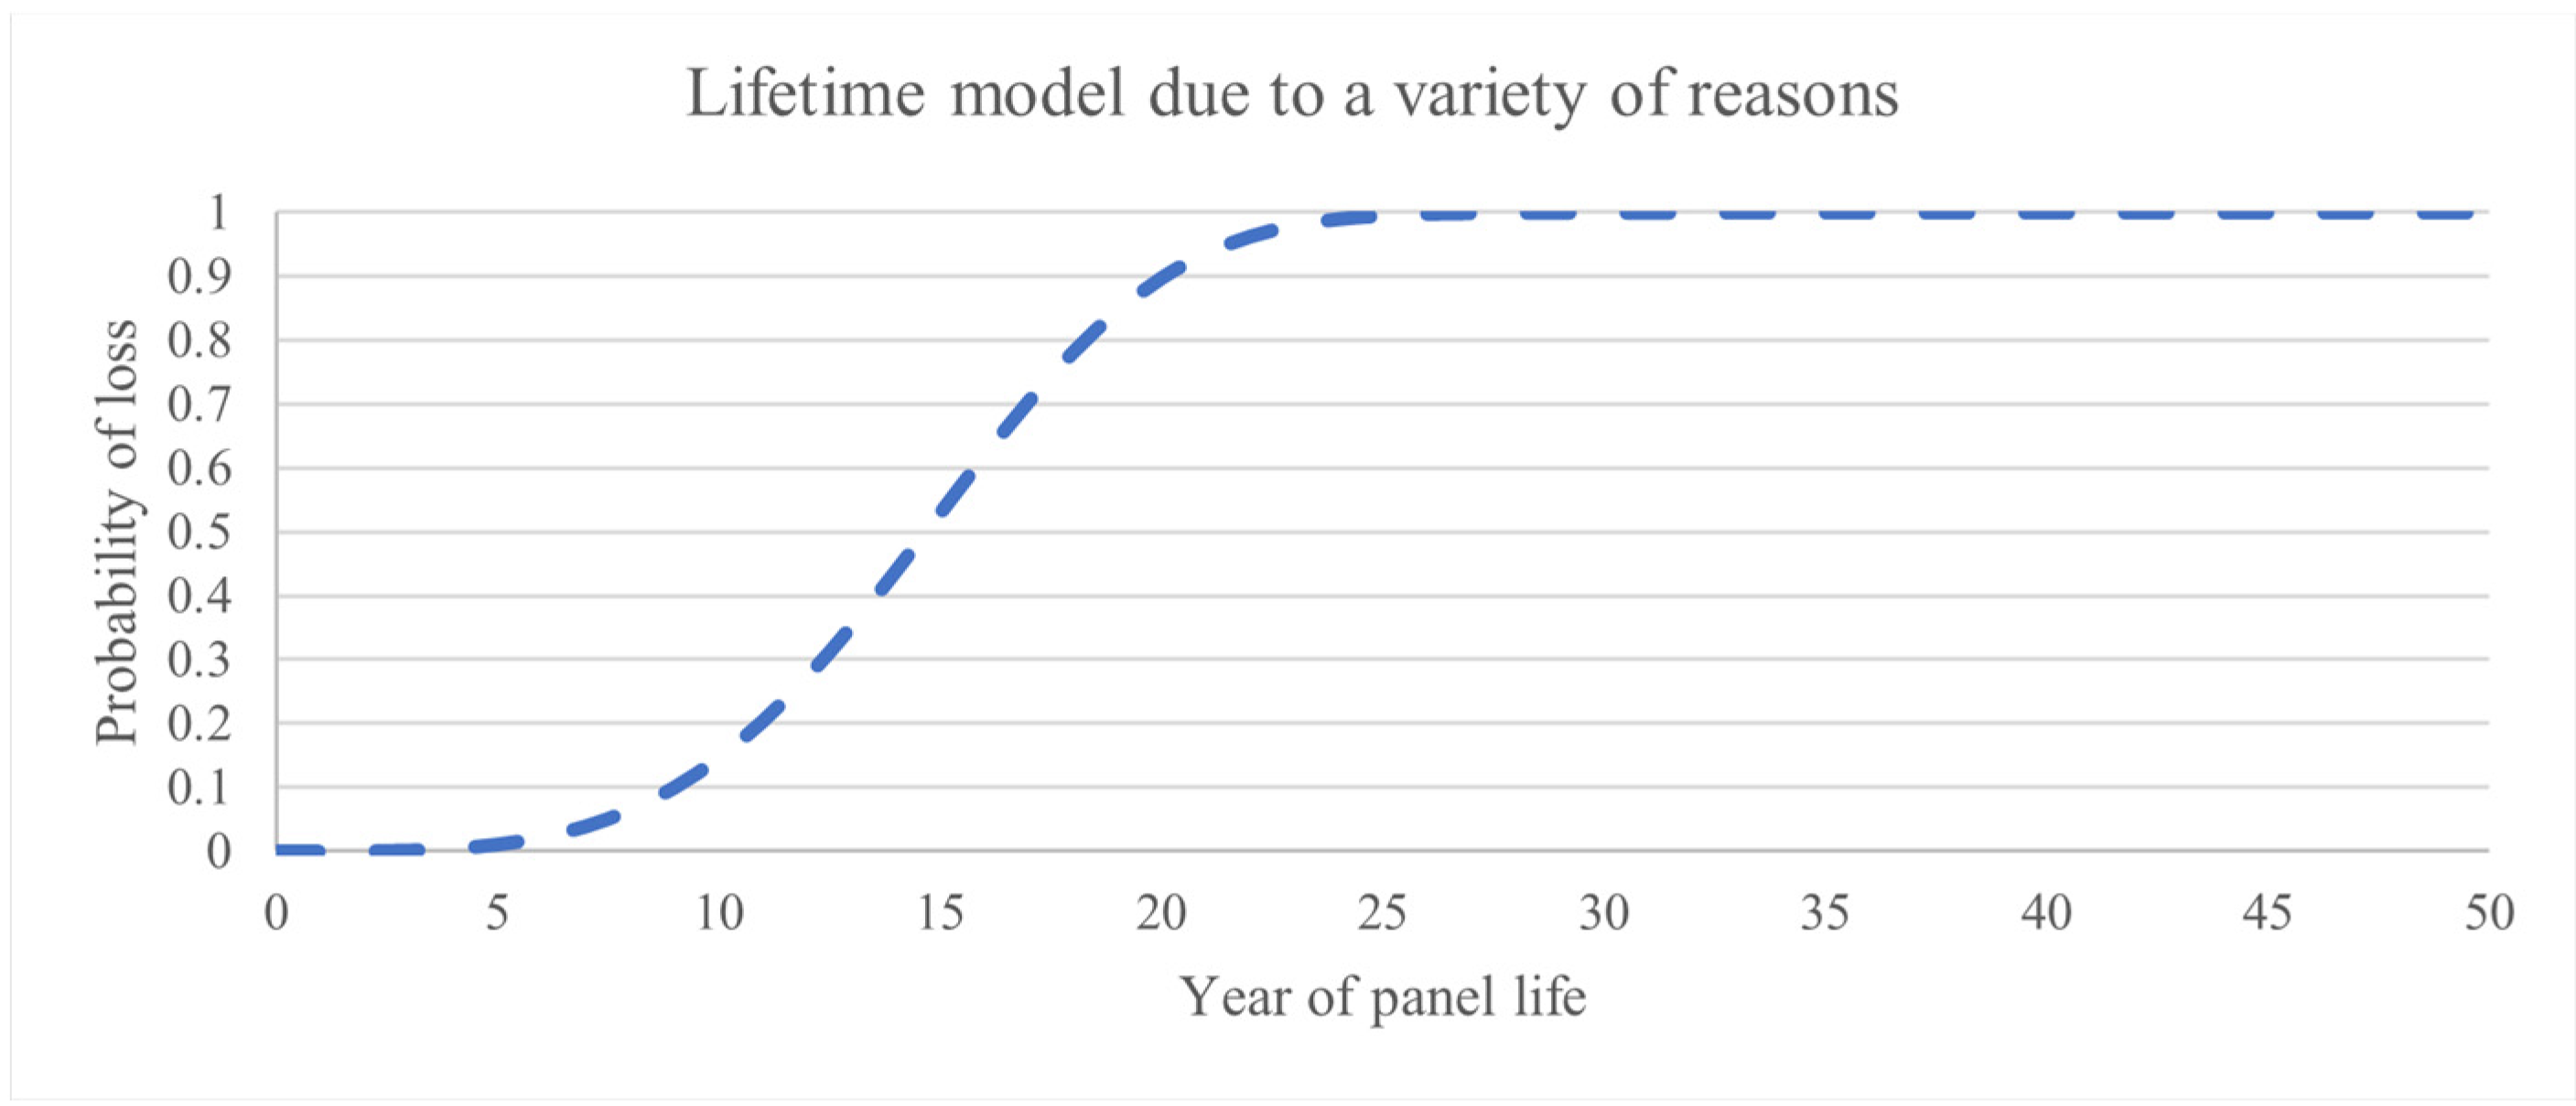
Figure 8 gives the fitted Weibull considering the ten sources and thirty-three weighted data points, providing a lifetime model due to a variety of reasons with an average lifetime of 15 years and β of 16 years.
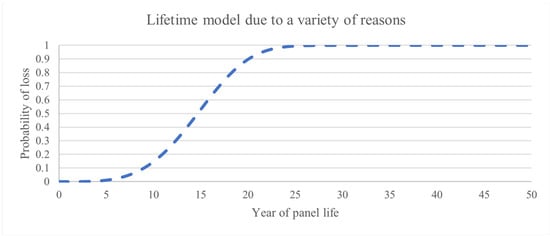
Figure 8.
Lifetime model due to a variety of technical, economic, and social factors, considering ten sources and thirty-three weighted data points from researchers, policymakers and advisors, recyclers, and panel manufacturers.
Testing of the Variety of Reasons Model
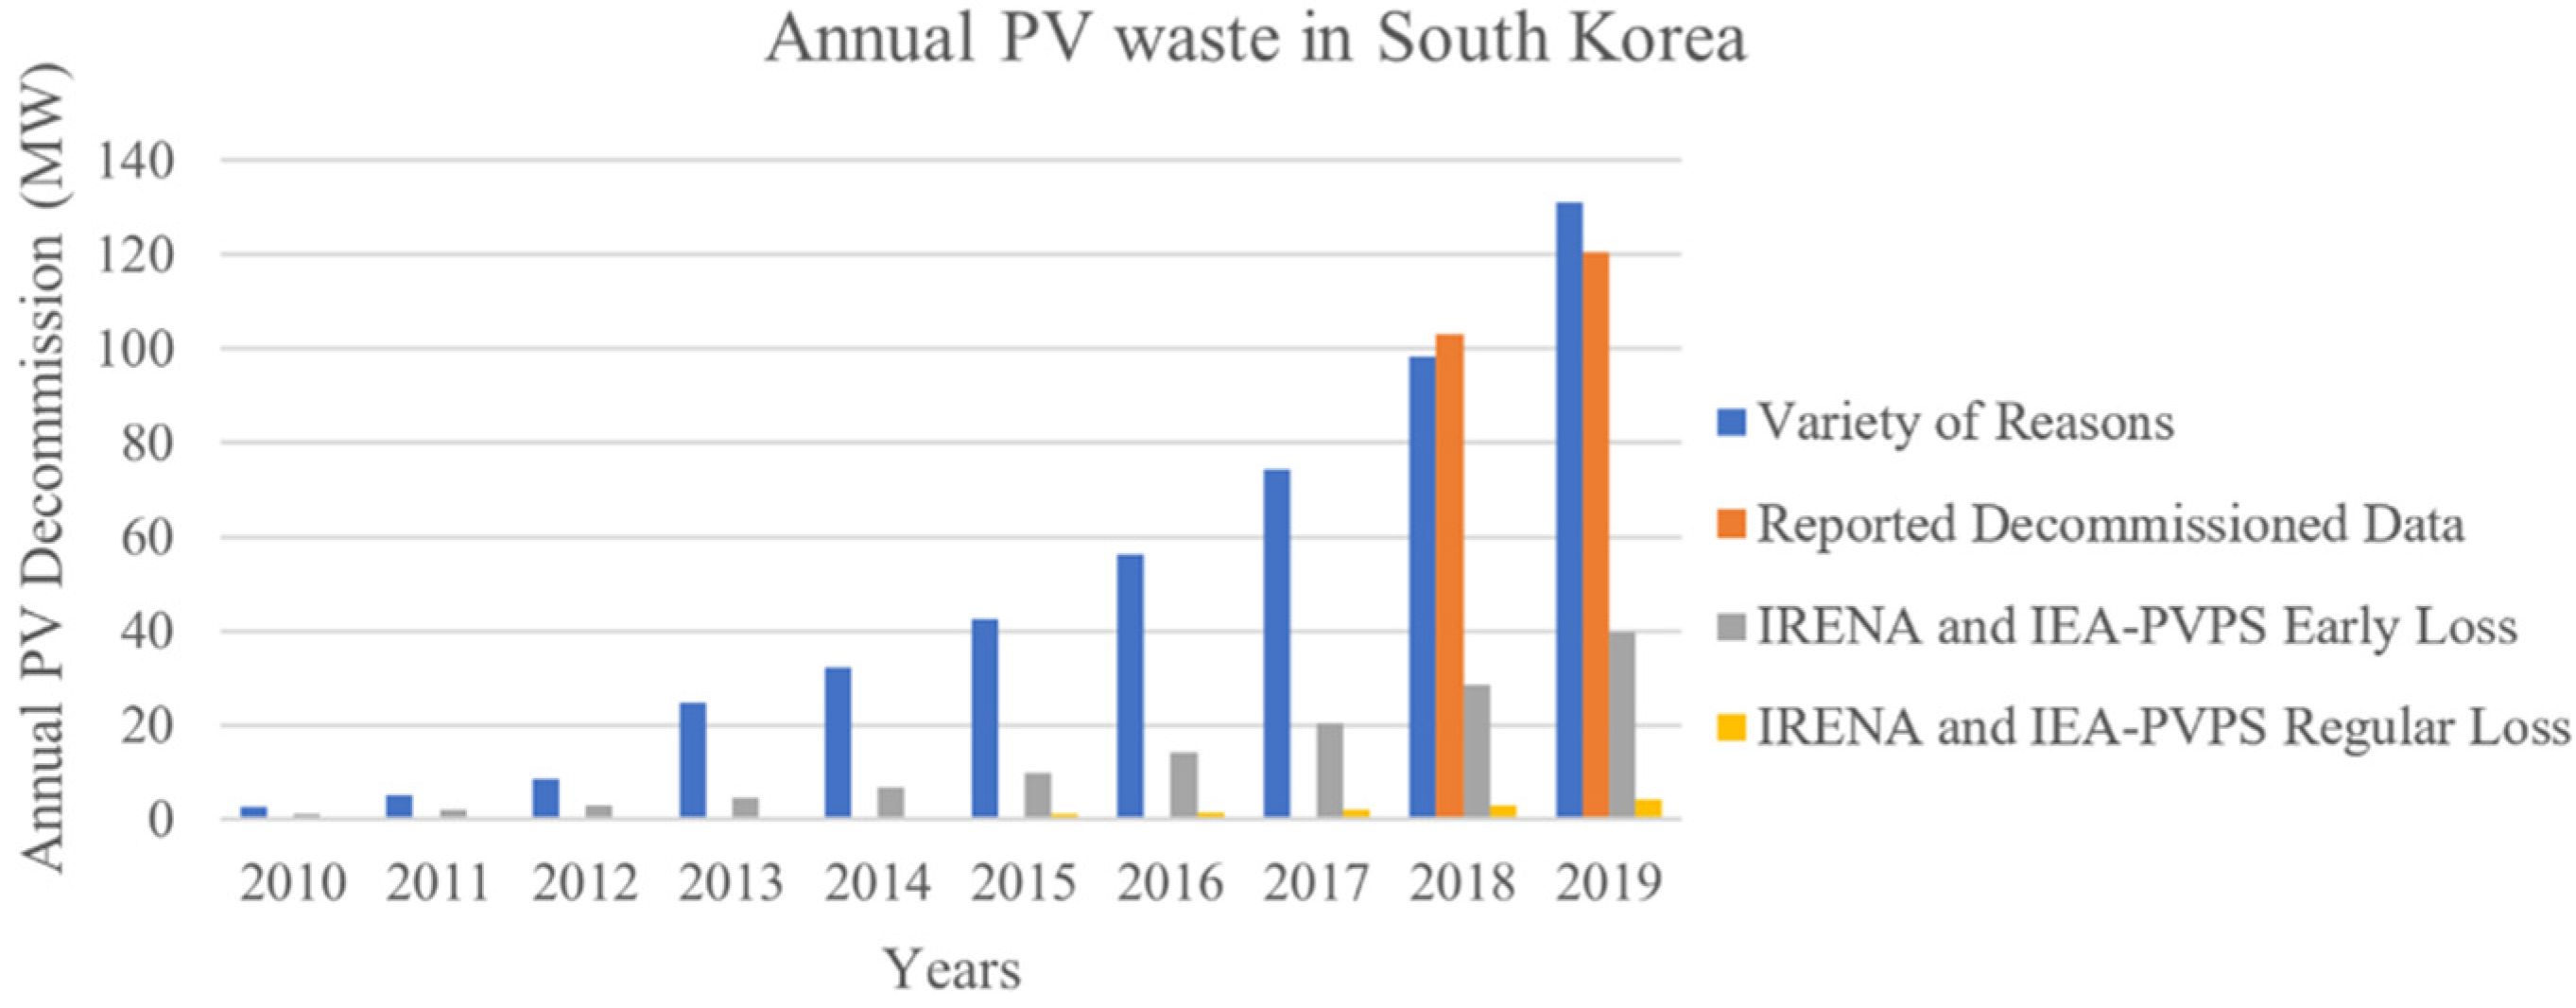
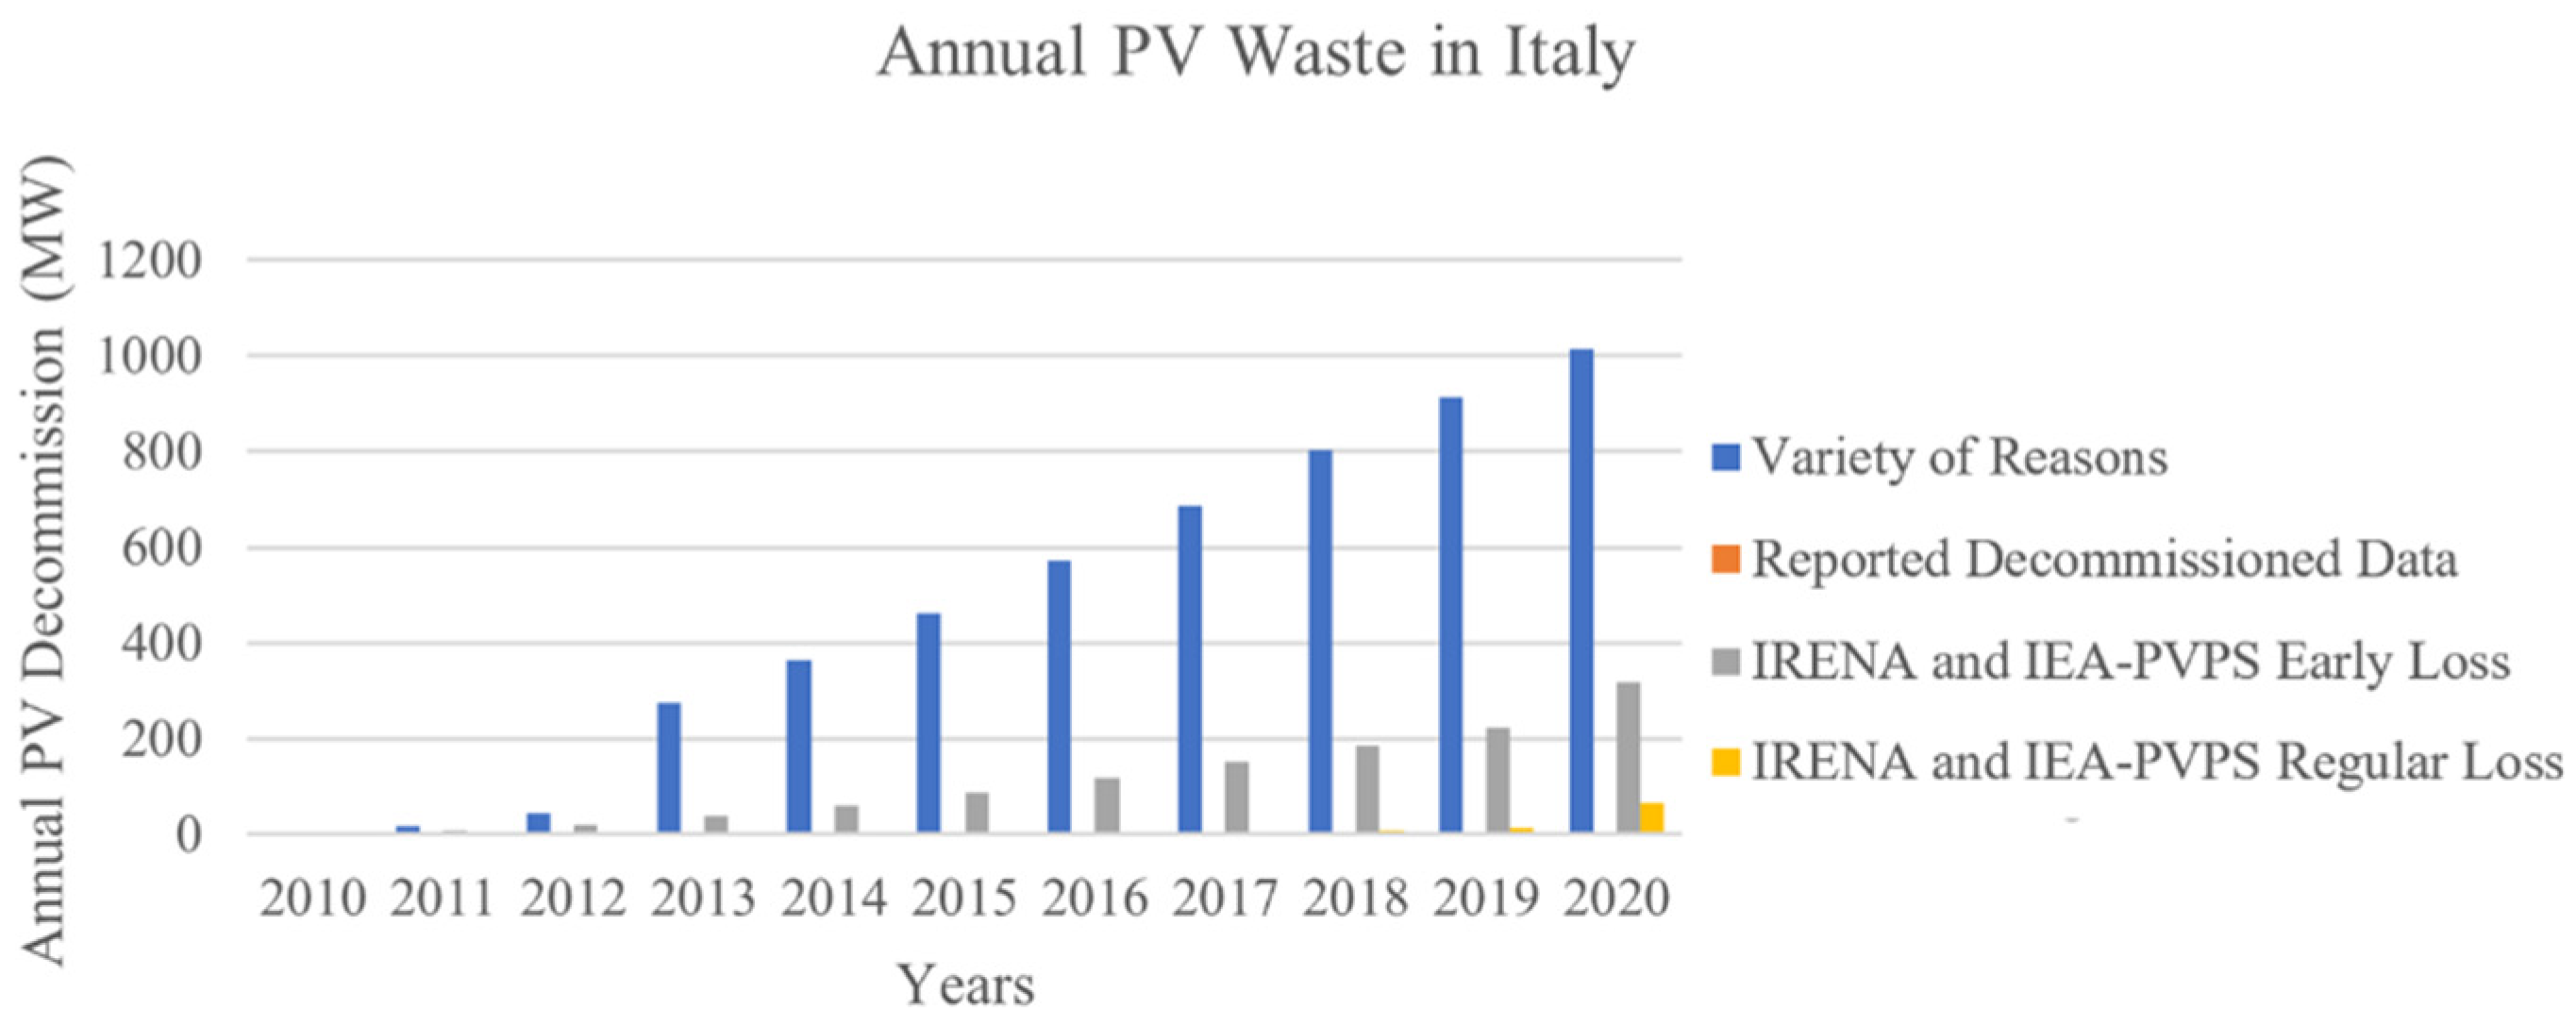
To test the lifetime distribution due to a variety of reasons, waste projections using the model were calculated for South Korea, Japan, and Italy based on installation capacity from 1993 to 2019 [49,50,51]. These three countries were selected rather than Australia because they are the only countries that provide decommissioned data in their IEA-PVPS National Survey Reports. These reported data were then compared to the modelled waste projections (Figure 9, Figure 10 and Figure 11) [49,50,51].
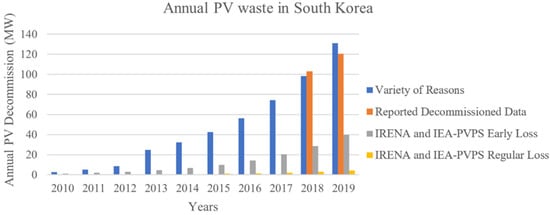
Figure 9.
Comparison between reported decommissioned data [51] and waste projections based on the variety of reasons model and IRENA and IEA-PVPS’s [16] regular and early loss projections in South Korea.
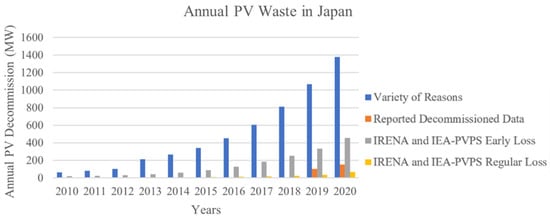
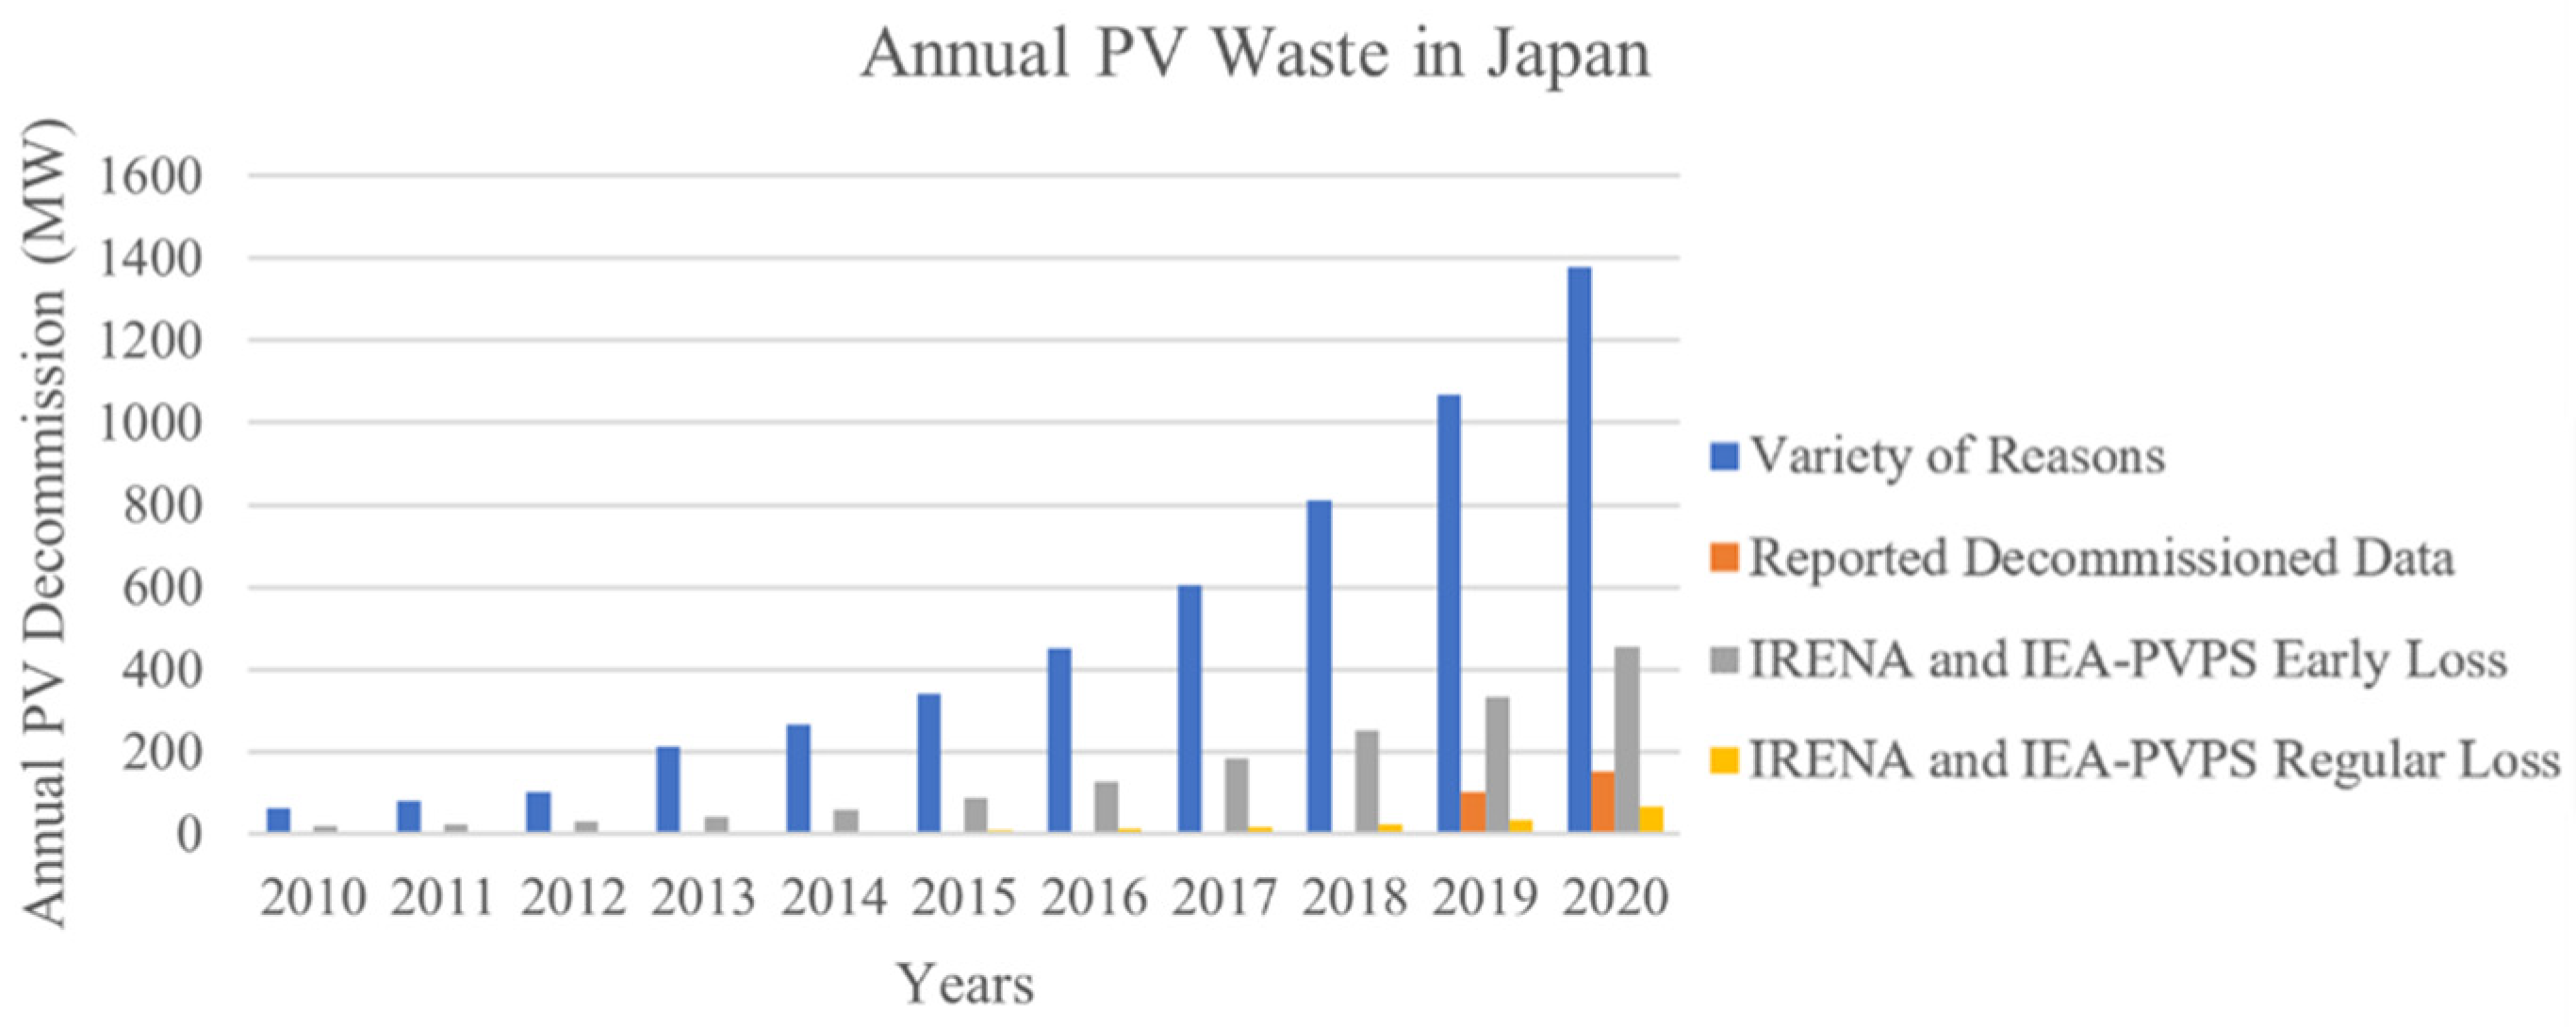
Figure 10.
Comparison between reported decommissioned data [49] and waste projections based on the variety of reasons model and IRENA and IEA-PVPS’s [16] regular and early loss projections in Japan.
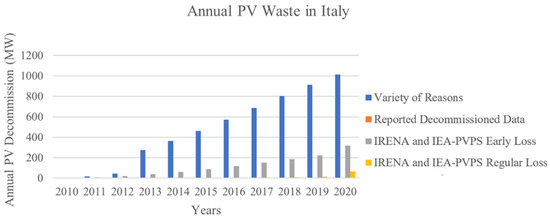
Figure 11.
Comparison between reported decommissioned data [50] and waste projections based on the variety of reasons model and IRENA and IEA-PVPS’s [16] regular and early loss projections in Italy.
For Korea, the modelled decommissioning capacity for 2018 and 2019 matched the real data within 10%; however, for both Japan and Italy, the modelled data were 10–150 times larger. Additionally, in comparison to IRENA and IEA-PVPS’s [16] projections, Japan’s actual waste is 3 times less than the early loss scenario, and Italy’s is 5–10 times less than the conservative, regular loss projection. Section 5.4.1 provides further discussion on these findings.
4.3. Overall Lifetime Models
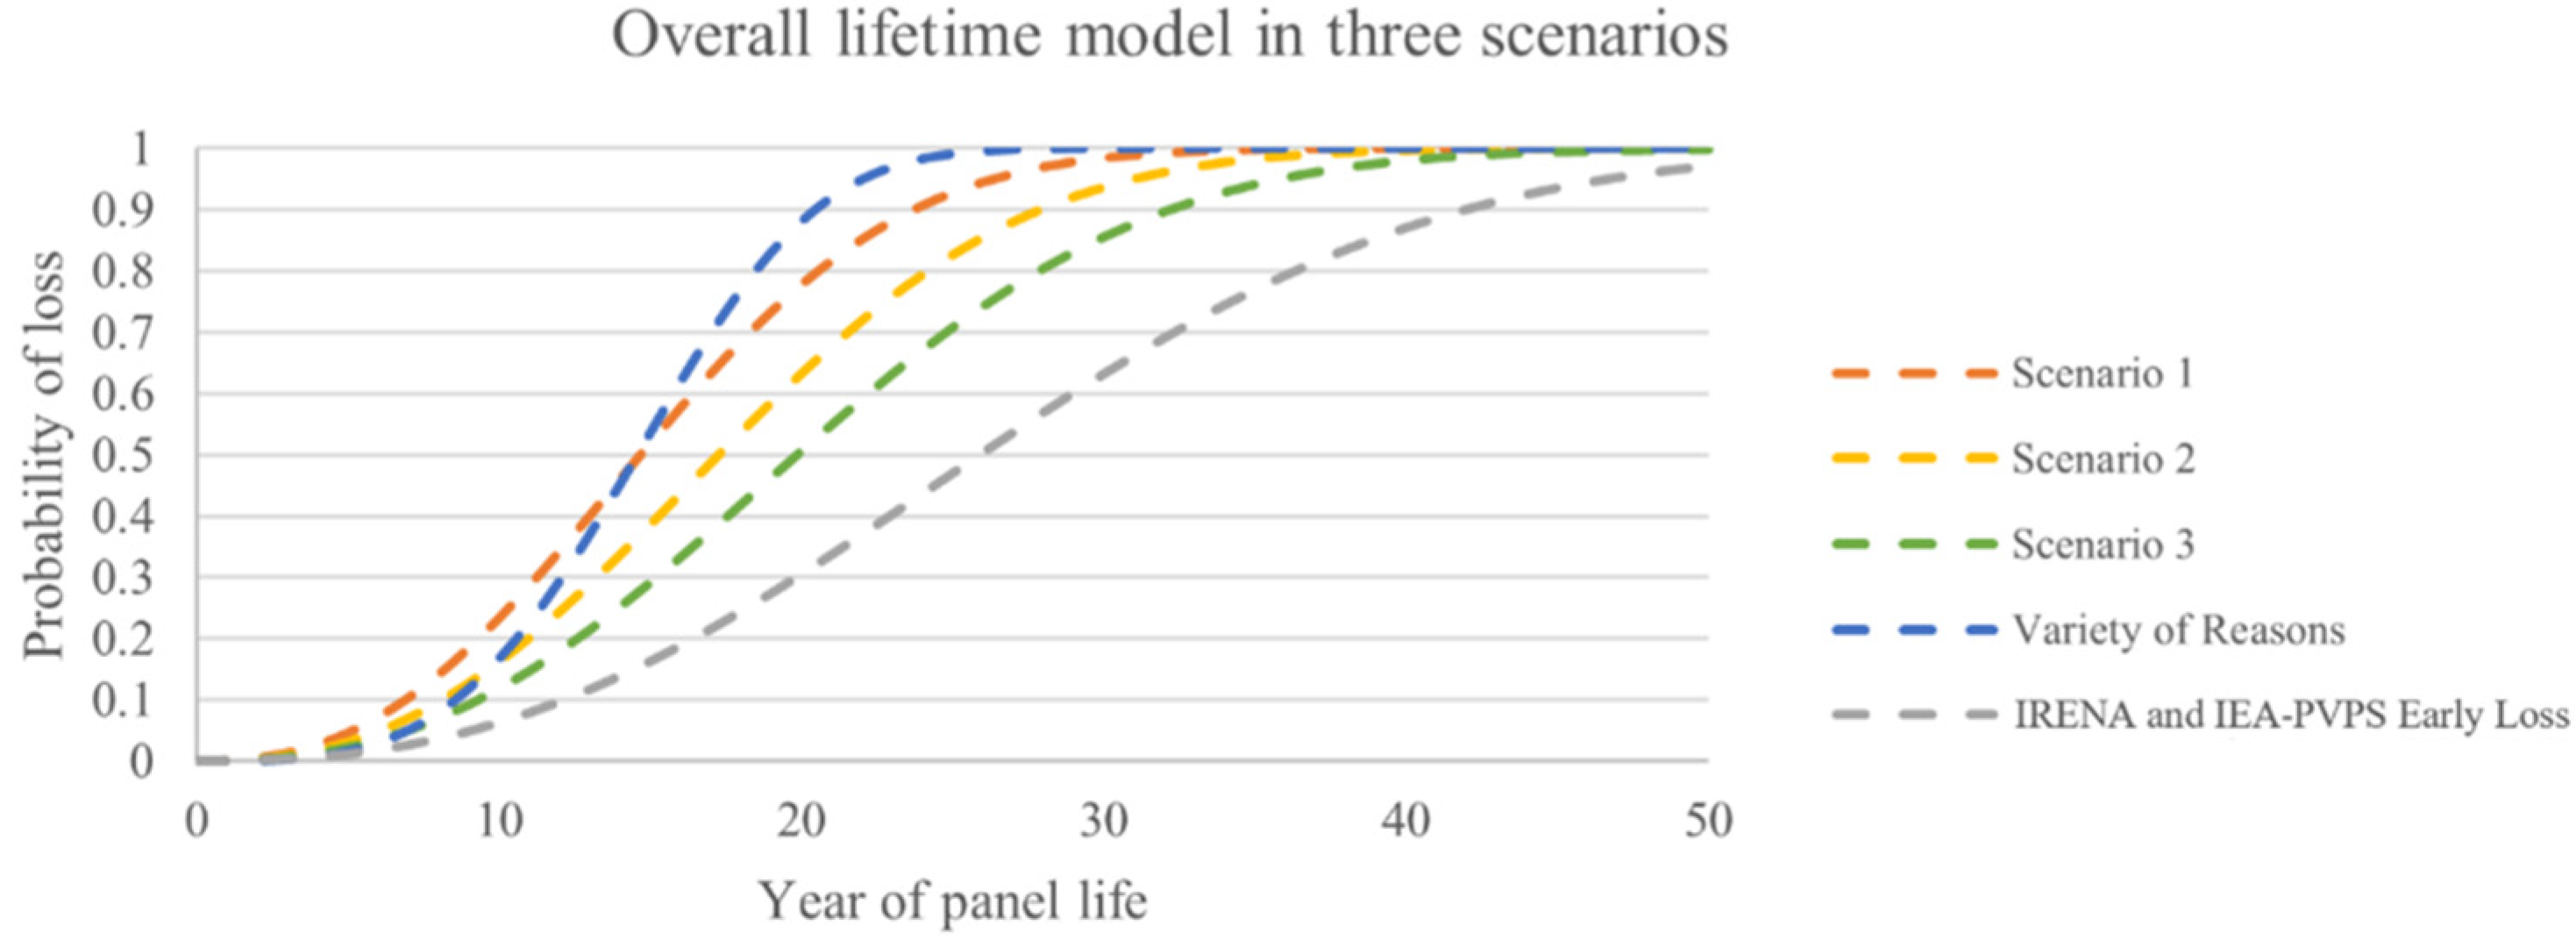
Figure 12 provides the three Weibull distributions fitted to each scenario with a comparison between IRENA and IEA-PVPS’s [16] early loss curve and the lifetime model due to a variety of reasons, and Table 8 provides the average lifetime for each model. Appendix A provides the original weighted CDFs for each scenario before being fitted to the Weibull function.
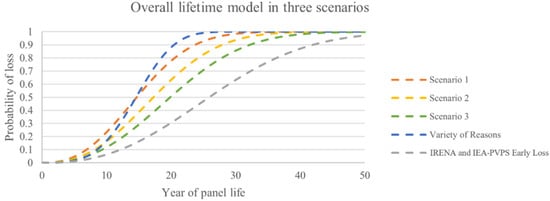
Figure 12.
Overall lifetime model in three scenarios considering EoL due to damage and technical failures, economic motivation, and power decrease, with a comparison between lifetimes due to a variety of reasons and IRENA and IEA-PVPS’s [16]’s early loss. Scenario 1 weights economic motivation highly, scenario 2 weights both economic motivation and power decrease equally, and scenario 3 weights power decrease highly. Damage and technical failures are kept consistent for all scenarios.
Table 8.
Summary table providing the average lifetime for the three scenarios, the variety of reasons model, and IRENA and IEA-PVPS’s [16] early loss.
5. Discussion
The following Section 5.1, Section 5.2, Section 5.3 and Section 5.4 provide a discussion of the lifetime models presented in Section 4.1 and Section 4.2, including a comparison between existing literature and other sources of reference, as well as limitations. Additionally, the two comprehensive models, a variety of reasons, and the overall lifetime will be compared in Section 5.5, and the overall limitations of this work will be addressed in Section 5.6.
5.1. Power Decrease Model
The power decrease model developed in this work has an average module lifetime of 20 years. This differs from the long lifetime of 30 years determined by Kuitche [24], which is used in IRENA and IEA-PVPS’s [16] regular loss situation. This variability is likely due to differences in the degradation analysis. IRENA and IEA-PVPS’s [16] regular loss distribution analyses the degradation of individual modules, whereas the data utilised in this work were measured at the system level, which captures both individual module degradation, as well as system-level losses (e.g., wiring, mismatch). Our model provides similar average lifetime values to Jordan et al. [52], Bolinger et al. [53], kWh Analytics [54], and NREL [55] who found average lifetimes of 17–27 years by applying a robust time-series analysis to measure degradation on a fleet scale. In particular, kWh Analytics [54] have access to 30% of the solar assets in the USA and NREL [55] studied 503 US systems, which provides further confidence in their results.
5.2. Damage and Technical Failures Model
In our damage and technical failures model, we adapted the assumptions used in IRENA and IEA-PVPS’s [16] early loss scenario. These assumptions were difficult to verify due to the limited availability of quality references on this topic. Though sources from the industry in Australia were explored, in particular statements from the solar company Proven Energy [56], as well as the CEC [25], the estimates provided are in qualitative terms. For example, Proven Energy [56] states, “[they] commonly take down faulty panels less than 6 years old,” and the CEC [25] reports, “households often remove…panel[s] prematurely around the 10–12-year mark…[with] the common reason [being], if some part of the…panel system gets damaged it requires the whole system to be replaced.” Additionally, Coghill [27] estimates that 30% of decommissioning cases are due to panel damage or technical failures. These estimates are difficult to include in our model because they are numerically imprecise and/or comment on a limited dataset. To be able to incorporate real decommissioning data into this model, it would be necessary to analyse all modules installed in 2010, for example, and the proportion of which reached EoL in each year following due to damage and technical failures. However, at this time, such data are not available.
5.3. Economic Motivation Model
The economic motivation model described in this work weights two other studies, each of which has its own set of assumptions and limitations. Both studies assume a rational, economically inclined customer who will replace modules when it is economically beneficial, as well as being based on uncertain market predictions. Additionally, because it is based on the PV market, this estimate will be best applied to current conditions and cannot necessarily estimate future lifetimes. For example, as mentioned in Duran et al. [42], the phaseout of the current incentive in the USA will cause a slowdown in early replacement behaviour, perhaps even to a discontinuity of installations in 2022. Furthermore, this model is based in the USA, so the assumptions may not be transferrable to the Australian PV market. However, compared to Australian estimates, according to a modelling report by GEM [28], the Clean Energy Regulator (CER) replacement of small-scale systems from, “2011 to 2013 will emerge as a new source of sales in this decade [the 2020s]”. This estimated lifetime between 7 and 19 years aligns with Duran et al.’s [42] 5–19-year estimate.
5.4. Variety of Reasons Model
The variety-of-reasons model estimates an average lifetime significantly lower than the 30 years used in the IRENA and IEA-PVPS [16] early loss scenario. This variability is likely because IRENA and IEA-PVPS’s [16] model only applies early loss assumptions due to damage and technical failures to the regular loss model, which solely considers degradation. Therefore, there is no representation of the effects of economics, policies, and incentives on EoL. In contrast, the variety-of-reasons model described in this work combines expert opinions on the average module lifetime, where each expert considers all such effects.
5.4.1. Testing of the Variety of Reasons Model
The significant variance in the results between the three countries indicates the module lifetime will likely vary depending on the market. For example, factors including market age, as well as the breakdown of residential, commercial, and utility-scale systems, will affect the average lifetime. This variety-of-reasons distribution is modelled around Australia’s young PV market, which is similar to Korea; however, it does not encapsulate the high proportion of utility systems in Japan and Italy, which would likely increase the estimated lifetime (as discussed in Section 2.3). Currently, in Australia, over 65% of the installed PV capacity consists of residential and commercial systems, therefore this lifetime estimate reflects this market breakdown [29]. Thus, whilst lifetime projections including both the early and regular loss distributions given in IRENA and IEA-PVPS [16] provide generalised estimates, country-based estimation of PV module lifetime will be most accurate.
5.5. Overall Lifetime Models
Compared with the variety-of-reasons distribution, Scenario 1 aligns most closely, implying that, currently in Australia, module EoL is driven by economic motivation. This is supported by Florin et al. [20] who estimates distributed systems (77% of which are residential) will be responsible for nearly 90% of all PV waste in Australia in the next 5 years. However, utility-scale capacity is projected to grow, and by 2035, the waste from utility-scale solar increases so that distributed systems are ~60% of waste and utility-scale ~40% [20]. Thus, in 15 years, module decommissioning in Australia may align more closely with Scenario 2, which considers EoL due to economic reasons and a power decrease as equal contenders.
As Scenarios 2 and 3 weight both the power decrease and damage and technical failure models higher than the economic motivation model, these scenarios are more likely to be applicable in other countries as they are less affected by the influences of the Australian market on lifetime. However, the rate of degradation will vary with climate, and therefore country-based degradation data should be utilised. To account for non-technical influences, market factors specific to the country should then be incorporated within these scenarios, including subsidies, government policies, market age, and the breakdown of residential, commercial, and utility systems.
Regarding limitations, these scenarios do not consider additional reasons for decommissioning, for example, inappropriate installation location, damage from vandalism, renovations, battery upgrades, and changes in regulations [20,21,22,32,33].
5.6. Limitations
The overall, primary limitation of this work is the lack of information on current module lifetimes, as well as uncertainty surrounding future technological and market trends.
Firstly, there is no publicly available record in Australia or globally of the age of EoL panels when decommissioned, therefore the findings of this work rely on the accuracy of estimates provided by other sources, which have been informed by various methodologies (e.g., market analysis, surveys, degradation analysis). Because there is significant variation between these sources, from 7–8 years to 30+ years, it is challenging to optimise the prediction. Additionally, part of the reason there is no available record could potentially be because many of the modules installed in the first boom in 2011–2013 in Australia may still be in operation, especially commercial and utility systems, which are taxing to replace and often designed with an intended 25-year lifetime. Though, again, there is no statistical record to confirm this. Furthermore, because many modules may still be in operation, it is unknown how long panels will and can last, and equally, current decommissioning estimates will be based on the lifetimes of the oldest possible systems of 10 years.
Secondly, changes in market and policy and advances in PV technology will likely affect the lifetime. For example, as discussed for residential modules, there is evidence to support that the introduction of incentives can prompt early replacement. However, because it is unknown when incentives will be introduced or discontinued, lifetime is difficult to predict. Additionally, any shifts in consumer mindset, for instance away from PV being a commodity item, will also affect lifetime. Furthermore, in support of Australia’s transition to net-zero emissions, there is a significant push to further increase the commercial viability of PV, which will involve increasing operating lifetimes from the current 20–30 years to 40–50 years, though it is unknown when this will occur [57].
6. Conclusions
Predicting the lifespan of modules is required in planning future installations, predicting the timeliness and location of recycling facilities, and estimating the supply of recycled materials. This work has sought to provide possible lifetime models using the Weibull function for PV module lifetime in Australia in three scenarios that consider decommissioning due to a power decrease, damage and technical failures, and economic motivation to improve the current lifetime forecasting model that only considers performance warranty.
Scenario 1 yielded an average lifetime of 15 years, weighting economic motivation most significantly at 70% to represent the lifespan of residential modules. This is because residential PV replacement in Australia is primarily consumer- and market-driven due to Government rebates and incentives and/or insistent salespeople from solar companies. Scenario 2 provided a ‘middle-ground’ lifetime model in which both a power decrease and economic motivation are weighted equally at 46.5%, resulting in an average lifetime of 18 years. Lastly, Scenario 3 estimated an average lifetime of 20 years, in which EoL due to a power decrease is weighted highly at 70% and economic motivation at 23%. This scenario aimed to represent commercial and utility panels, which are most likely decommissioned when damaged or underperforming. Weighting economic motivation lower in Scenarios 2 and 3 provided an estimate more immune to the effects of the Australian market and is therefore more likely to be applicable to other countries. However, country-specific degradation data and market factors should be considered. All scenarios predict lifetimes to be significantly shorter than the industry standard of 25 years, which is based on performance guarantees of 80% power output after 25 years of operation, thereby confirming the influence of damage and technical failures and socio-economic factors in prompting the early replacement of modules. Based on the operating lifespans estimated in this work the amount of PV waste will increase at a greater rate than originally expected. Therefore, all stakeholders in the industry must act promptly to ensure responsible end-of-life management.
Additionally, another lifetime model that considers a variety of reasons including social factors was also explored with an average lifetime of 15 years. The variety-of-reasons distribution was tested by comparing waste projections using the model with actual decommissioned data in South Korea, Japan, and Italy. Significant variance in the results between the three countries was found, with the model matching Korea’s data within 10%; however, for both Japan and Italy, the modelled data were 10–150 times larger. This variability indicates the module lifetime will likely vary depending upon the market, with factors including market age, as well as the breakdown of residential, commercial, and utility-scale systems, affecting the average lifespan. For example, as indicated by sources within the PV industry, decommissioning in the residential sector can be influenced by economic incentives, whereas commercial and utility panels are more likely to reach EoL when damaged or underperforming. Therefore, it follows that variance between the variety-of-reasons model and reported decommissioning data in Japan and Italy was found, for this work’s Australian-based model does not encapsulate the high proportion of utility systems in these countries. Therefore, it is concluded that the variety-of-reasons distribution is relevant only to the Australian context or potentially other countries with young, predominately residential PV markets. Thus, further refined lifetime models specific to different markets are required. Though, to improve the reliability of PV module lifetime models, access to more accurate decommissioning data is required because current data are scattered and either unavailable or non-existent.
To account for the limitations of this work, future research is required to improve the modelling of the practical lifetime of solar PV modules. Further work could involve conducting widespread surveys on PV EoL with various stakeholders including consumers and across the industry, research, and government fields, to determine operating lifespans. Equally, these surveys could assist in predicting the market and technological trends, and the consequent effects on lifetime. Additionally, aerial mapping to track system replacements and additions could be explored. There is a need to track decommissioning, and when such statistical data become available, they shall enable more accurate predictions of the lifetime of PV modules in Australia and globally.
Author Contributions
Conceptualization, V.T., P.R.D., N.C., and R.D.; methodology, V.T., P.R.D., N.C., and R.D.; software, V.T., P.R.D., N.C., and R.D.; validation, V.T., P.R.D., N.C., and R.D.; formal analysis, V.T., P.R.D., N.C., and R.D.; investigation, V.T., P.R.D., N.C., and R.D.; resources, V.T., P.R.D., N.C., and R.D.; data curation, V.T., P.R.D., N.C., and R.D.; writing—original draft preparation, V.T., P.R.D., N.C., and R.D.; writing—review and editing, V.T., P.R.D., N.C., and R.D.; visualization, V.T., P.R.D., N.C., and R.D.; supervision, P.R.D., N.C., and R.D.; project administration, P.R.D., N.C., and R.D. All authors have read and agreed to the published version of the manuscript.
Funding
This research received no external funding.
Institutional Review Board Statement
Not applicable.
Informed Consent Statement
Not applicable.
Data Availability Statement
Not applicable.
Acknowledgments
The authors would like to acknowledge the support from the School of Photovoltaci and Renewable Energy Engineering, the Australian Centre for Advanced Photovoltaics (ACAP) and Australian Renewable Energy Agency (ARENA) in this work. Responsibility for the views, information or advice expressed herein is not accepted by the Australian Government.
Conflicts of Interest
The authors declare no conflict of interest.
List of Abbreviations
| CEC | Clean Energy Council | LCOE | Levelised Cost of Electricity |
| CER | Clean Energy Regulator | LGAs | Local Government Areas |
| CDF | Cumulative Density Function | NREL | National Renewable Energy Laboratory |
| EoL | End-of-Life | ||
| GEM | Green Energy Markets | NPV | Net Present Value |
| IEA-PVPSIRENA | International Energy Agency Photovoltaic Power Systems Programme International Renewable Energy Agency | NSW | New South Wales |
| PV | Photovoltaic | ||
| QLD STCs | Queensland Small-scale Technology Certificates | ||
| LGCs | Large-scale Generation Certificates | VIC | Victoria |
Appendix A
The following Figure A1, Figure A2 and Figure A3 provide the original weighted CDFs for each scenario in comparison to the resulting fitted Weibull distribution (Figure 12), therefore the limited difference between the curves indicates a good fit.
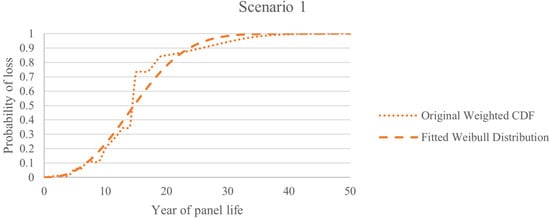
Figure A1.
Scenario 1 original weighted CDF in comparison to the final fitted Weibull distribution.
Figure A1.
Scenario 1 original weighted CDF in comparison to the final fitted Weibull distribution.
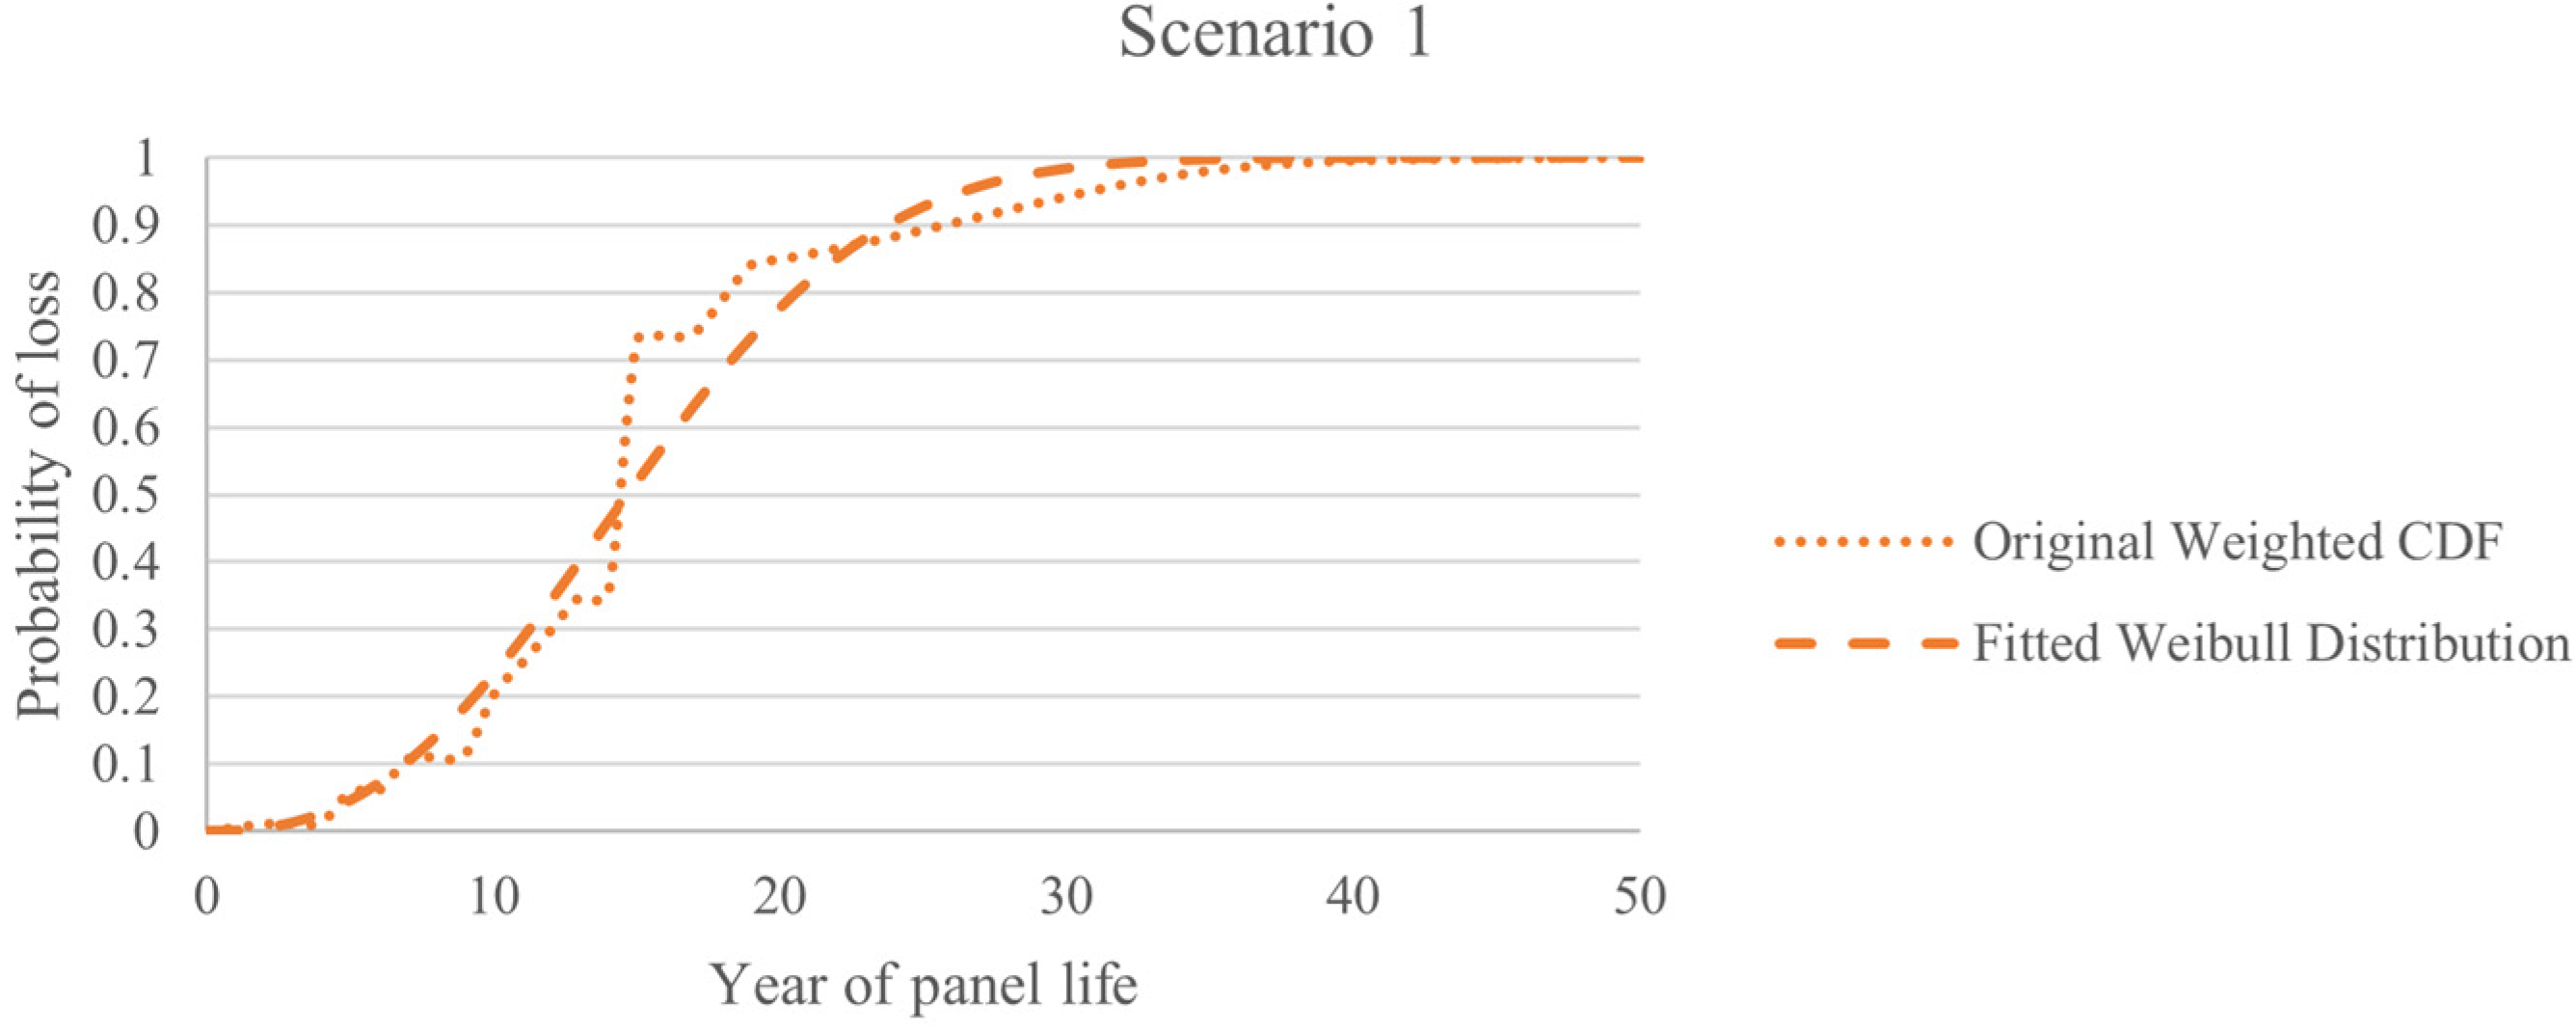
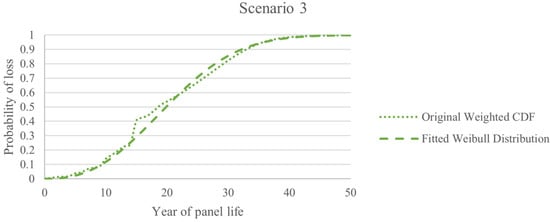
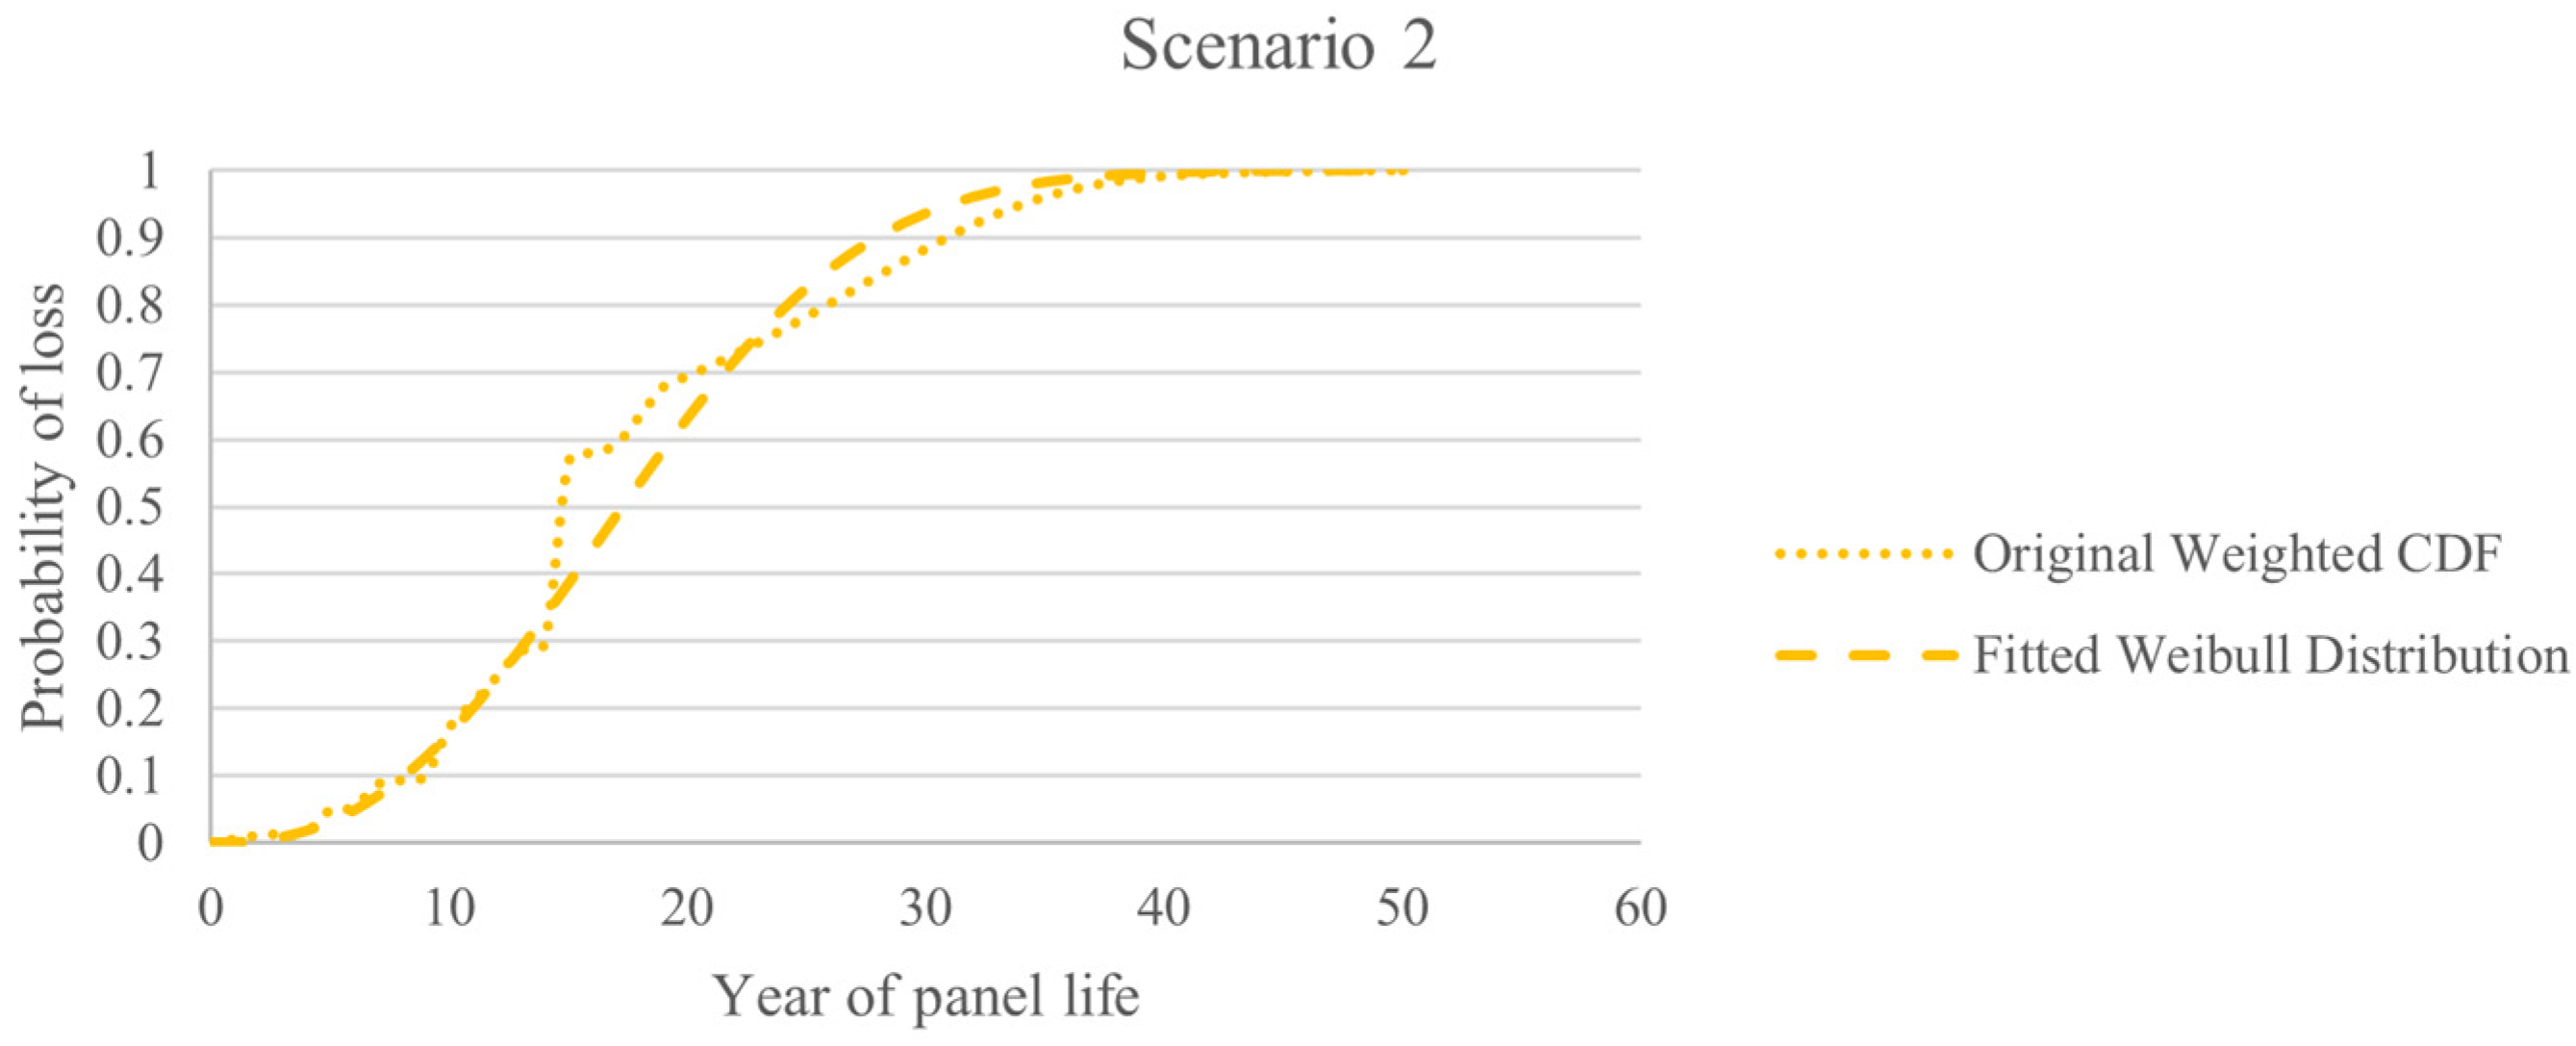
Figure A2.
Scenario 2 original weighted CDF in comparison to the final fitted Weibull distribution.
Figure A2.
Scenario 2 original weighted CDF in comparison to the final fitted Weibull distribution.

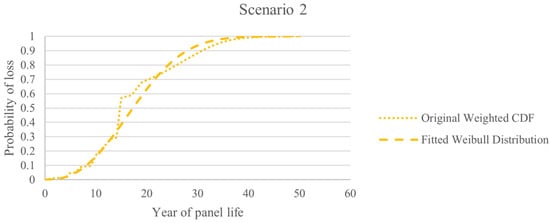
Figure A3.
Scenario 3 original weighted CDF in comparison to the final fitted Weibull distribution.
Figure A3.
Scenario 3 original weighted CDF in comparison to the final fitted Weibull distribution.
References
- Enkhardt, S. BloombergNEF Says Global Solar Will Cross 200 GW Mark for First Time This Year, Expects Lower Panel Prices. Available online: https://www.pv-magazine.com/2022/02/01/bloombergnef-says-global-solar-will-cross-200-gw-mark-for-first-time-this-year-expects-lower-panel-prices/#:~:text=In%202021%2C%20photovoltaic%20systems%20with,between%20204%20and%20252%20GW (accessed on 11 April 2022).
- Weaver, J. World Has Installed 1TW of Solar Capacity. Available online: https://www.pv-magazine.com/2022/03/15/humans-have-installed-1-terawatt-of-solar-capacity/ (accessed on 11 April 2022).
- Australia’s Solar Capacity Could Hit 80 GW by 2030, Says GlobalData. Available online: https://www.pv-magazine.com/2021/05/11/australias-solar-capacity-could-hit-80-gw-by-2030-says-globaldata/ (accessed on 11 February 2022).
- Faircloth, C.C.; Wagner, K.H.; Woodward, K.E.; Rakkwamsuk, P.; Gheewala, S.H. The Environmental and Economic Impacts of Photovoltaic Waste Management in Thailand. Resour. Conserv. Recycl. 2019, 143, 260–272. [Google Scholar] [CrossRef]
- ITRPV. International Technology Roadmap for Photovoltaics. 2021. Available online: https://www.vdma.org/international-technology-roadmap-photovoltaic (accessed on 16 February 2022).
- Kang, D.; White, T.; Thomson, A. PV Module Recycling: Mining Australian Rooftops. In Proceedings of the 2015 Asia-Pacific Solar Research Conference, Brisbane, Australia, 9 December 2015. [Google Scholar]
- Hosseini-Fashami, F.; Motevali, A.; Nabavi-Pelesaraei, A.; Hashemi, S.J.; Chau, K. Energy-Life Cycle Assessment on Applying Solar Technologies for Greenhouse Strawberry Production. Renew. Sustain. Energy Rev. 2019, 116, 109411. [Google Scholar] [CrossRef]
- Ghasemi-Mobtaker, H.; Mostashari-Rad, F.; Saber, Z.; Chau, K.; Nabavi-Pelesaraei, A. Application of Photovoltaic System to Modify Energy Use, Environmental Damages and Cumulative Exergy Demand of Two Irrigation Systems—A Case Study: Barley Production of Iran. Renew. Energy 2020, 160, 1316–1334. [Google Scholar] [CrossRef]
- Nabavi-Pelesaraei, A.; Azadi, H.; van Passel, S.; Saber, Z.; Hosseini-Fashami, F.; Mostashari-Rad, F.; Ghasemi-Mobtaker, H. Prospects of Solar Systems in Production Chain of Sunflower Oil Using Cold Press Method with Concentrating Energy and Life Cycle Assessment. Energy 2021, 223, 120117. [Google Scholar] [CrossRef]
- Tasnia, K.; Begum, S.; Tasnim, Z.; Khan, M.Z.R. End-of-Life Management of Photovoltaic Modules in Bangladesh. In Proceedings of the 2018 10th International Conference on Electrical and Computer Engineering (ICECE), Dhaka, Bangladesh, 20–22 December 2018; pp. 445–448. [Google Scholar]
- Gönen, Ç.; Kaplanoğlu, E. Environmental and Economic Evaluation of Solar Panel Wastes Recycling. Waste Manag. Res. J. A Sustain. Circ. Econ. 2019, 37, 412–418. [Google Scholar] [CrossRef]
- Domínguez, A.; Geyer, R. Photovoltaic Waste Assessment of Major Photovoltaic Installations in the United States of America. Renew. Energy 2019, 133, 1188–1200. [Google Scholar] [CrossRef]
- Domínguez, A.; Geyer, R. Photovoltaic Waste Assessment in Mexico. Resour. Conserv. Recycl. 2017, 127, 29–41. [Google Scholar] [CrossRef]
- Paiano, A. Photovoltaic Waste Assessment in Italy. Renew. Sustain. Energy Rev. 2015, 41, 99–112. [Google Scholar] [CrossRef]
- Mahmoudi, S.; Huda, N.; Alavi, Z.; Behnia, M. Material Flow Analysis of the End-of-Life Photovoltaic Waste in Australia. DEStech Trans. Environ. Energy Earth Sci. 2019. [Google Scholar] [CrossRef]
- IRENA; IEA-PVPS. End-of-Life Management: Solar Photovoltaic Panels. 2016. Available online: https://www.irena.org/publications/2016/Jun/End-of-life-management-Solar-Photovoltaic-Panels (accessed on 19 September 2021).
- Kim, H.; Park, H. PV Waste Management at the Crossroads of Circular Economy and Energy Transition: The Case of South Korea. Sustainability 2018, 10, 3565. [Google Scholar] [CrossRef] [Green Version]
- Santos, J.D.; Alonso-García, M.C. Projection of the Photovoltaic Waste in Spain until 2050. J. Clean. Prod. 2018, 196, 1613–1628. [Google Scholar] [CrossRef]
- Mahmoudi, S.; Huda, N.; Behnia, M. Photovoltaic Waste Assessment: Forecasting and Screening of Emerging Waste in Australia. Resour. Conserv. Recycl. 2019, 146, 192–205. [Google Scholar] [CrossRef]
- Florin, N.; Wakefield-Rann, R.; Dominish, E.; Dwyer, S.; Gertsakis, J.; Harford, N. Scoping Study for Solar Panels and Battery System Reuse and Recycling in NSW; UTS Institute of Sustainable Futures & Equilibrium Consulting: Sydney, Australia, 2020. [Google Scholar]
- Mathur, D.; Gregory, R.; Simons, T. End-of-Life Management of Solar PV Panels. 2020. Available online: https://www.cdu.edu.au/sites/default/files/the-northern-institute/eolmanagemnetsolarpv_final_e-version.pdf (accessed on 10 October 2021).
- Curtis, T.; Buchanan, H.; Smith, L.; Heath, G. A Circular Economy for Solar Photovoltaic System Materials: Drivers, Barriers, Enablers, and U.S. Policy Considerations; National Renewable Energy Laboratory: Golden, CO, USA, 2021. [Google Scholar]
- Tao, M.; Fthenakis, V.; Ebin, B.; Steenari, B.; Butler, E.; Sinha, P.; Corkish, R.; Wambach, K.; Simon, E.S. Major Challenges and Opportunities in Silicon Solar Module Recycling. Prog. Photovolt. Res. Appl. 2020, 28, 1077–1088. [Google Scholar] [CrossRef]
- Kuitche, J. Statistical Lifetime Predictions for PV Modules. Available online: https://www1.eere.energy.gov/solar//pdfs/pvrw2010_kuitche.pdf (accessed on 7 October 2021).
- Clean Energy Council. RE: Public Hearing Invitation Inquiry into Waste Management and Recycling. 2020. Available online: https://assets.cleanenergycouncil.org.au/documents/advocacy-initiatives/submissions/submission-inquiry-waste-management-recycling-wind-turbines-solar-pv-panels.pdf (accessed on 18 November 2021).
- Leyton, D. (University of New South Wales, Sydney, New South Wales, Australia). Personal communication. 2021. [Google Scholar]
- Coghill, M. (Director of Total Green Recycling, Perth, Western Australia, Australia). Personal communication. 2021. [Google Scholar]
- Green Energy Markets. Final 2021 Projections for Distributed Energy Resources—Solar PV and Stationary Energy Battery Systems. Victoria. 2021. Available online: https://aemo.com.au/-/media/files/electricity/nem/planning_and_forecasting/inputs-assumptions-methodologies/2021/green-energy-markets-der-forecast-report.pdf?la=en (accessed on 25 April 2022).
- Australian PV Institute (APVI). Solar Map. Available online: https://pv-map.apvi.org.au/postcode (accessed on 30 September 2021).
- Australian Energy Federation. Are There Any Solar Rebates Available? Available online: https://www.aef.com.au/for-home/solar-power/are-there-any-solar-rebates-available/ (accessed on 21 January 2022).
- Australian PV Institute (APVI). 2020 PV in Australia Report. 2020. Available online: https://iea-pvps.org/national-survey-reports/?year_p=&country=47&order=DESC&keyword= (accessed on 30 September 2021).
- Sustainability Victoria National Approach to Manage Solar Panel, Inverter and Battery Lifecycles. Available online: https://www.sustainability.vic.gov.au/research-data-and-insights/research/recycling-and-reducing-waste/national-approach-to-manage-solar-panel-inverter-and-battery-lifecycles (accessed on 23 October 2021).
- Reclaim PV. Reclaim PV FAQs. Available online: https://www.reclaimpv.com/questions/ (accessed on 23 October 2021).
- Clean Energy Regulator. Large-Scale Generation Certificates. Available online: http://www.cleanenergyregulator.gov.au/RET/Scheme-participants-and-industry/Power-stations/Large-scale-generation-certificates (accessed on 26 February 2022).
- Raugei, M.; Frischknecht, R.; Olson, C.; Sinha, P.; Heath, G. Methodological Guidelines on Net Energy Analysis of Photovoltaic Electricity. 2016. Available online: https://iea-pvps.org/key-topics/task12-methodological-guidelines-on-net-energy-analysis-of-photovoltaic-electricity-2016/ (accessed on 7 April 2022).
- Georgescu-Roegen, N. Energy Analysis and Economic Valuation. South. Econ. J. 1979, XLIV, 1023–1058. [Google Scholar] [CrossRef]
- Kumar, S.; Sarkar, B. Design for Reliability with Weibull Analysis for Photovoltaic Modules. Int. J. Curr. Eng. Technol. 2013, 3, 129–134. [Google Scholar]
- Ingenhoven, P.; Belluardo, G.; Makrides, G.; Georghiou, G.E.; Rodden, P.; Frearson, L.; Herteleer, B.; Bertani, D.; Moser, D. Analysis of Photovoltaic Performance Loss Rates of Six Module Types in Five Geographical Locations. IEEE J. Photovolt. 2019, 9, 1091–1096. [Google Scholar] [CrossRef]
- Dhimish, M.; Alrashidi, A. Photovoltaic Degradation Rate Affected by Different Weather Conditions: A Case Study Based on PV Systems in the UK and Australia. Electronics 2020, 9, 650. [Google Scholar] [CrossRef] [Green Version]
- IEA-PVPS. Assessment of Performance Loss Rate of PV Power Systems. 2021. Available online: https://iea-pvps.org/key-topics/assessment-of-performance-loss-rate-of-pv-power-systems/ (accessed on 27 November 2021).
- Peel, M.C.; Finlayson, B.L.; McMahon, T.A. Updated World Map of the Köppen-Geiger Climate Classification. Hydrol. Earth Syst. Sci. 2007, 11, 1633–1644. [Google Scholar] [CrossRef] [Green Version]
- Duran, S.; Atasu, A.; van Wassenhove, L.N. Cleaning after Solar Panels: A Circular Outlook. SSRN Electron. J. 2021. [Google Scholar] [CrossRef]
- Jean, J.; Woodhouse, M.; Bulović, V. Accelerating Photovoltaic Market Entry with Module Repnlacement. Joule 2019, 3, 2824–2841. [Google Scholar] [CrossRef]
- Zaihidee, F.M.; Mekhilef, S.; Seyedmahmoudian, M.; Horan, B. Dust as an Unalterable Deteriorative Factor Affecting PV Panel’s Efficiency: Why and How. Renew. Sustain. Energy Rev. 2016, 65, 1267–1278. [Google Scholar] [CrossRef]
- WA Recycling. (WA Recycling, Perth, Western Australia, Australia). Personal communication. 2021. [Google Scholar]
- Wambach, K. PV Abfallentwicklung, Einstufung Und Abfallende Kriterien Für PV Module. In Proceedings of the Future of PV-Recycling in Germany Workshop, online, 27 October 2021. [Google Scholar]
- Forti, V.; Baldé, C.P.; Kuehr, R. E-Waste Statistics: Guidelines on Classifications, Reporting and Indicators, 2nd ed.; United Nations University: Bonn, Germany, 2018. [Google Scholar]
- First Solar. First Solar Recycling Recovers up to 90% of Materials. Available online: http://www.firstsolar.com/en-AU/Modules/Recycling (accessed on 23 October 2021).
- IEA-PVPS. National Survey Report of PV Power Applications in Japan, 2002–2020. Available online: https://iea-pvps.org/national-survey-reports/?year_p=&country=35&order=DESC&keyword= (accessed on 20 November 2021).
- IEA-PVPS. National Survey Report of PV Power Applications in Italy, 2002–2020. Available online: https://iea-pvps.org/national-survey-reports/?year_p=&country=36&order=DESC&keyword= (accessed on 20 November 2021).
- IEA-PVPS. National Survey Report of PV Power Applications in Korea, 2002–2020. Available online: https://iea-pvps.org/national-survey-reports/?year_p=&country=34&order=DESC&keyword= (accessed on 20 November 2021).
- Jordan, D.C.; Marion, B.; Deline, C.; Barnes, T.; Bolinger, M. PV Field Reliability Status—Analysis of 100,000 Solar Systems. Prog. Photovolt. Res. Appl. 2020, 28, 739–754. [Google Scholar] [CrossRef]
- Bolinger, M.; Gorman, W.; Millstein, D.; Jordan, D. System-Level Performance and Degradation of 21 GWDC of Utility-Scale PV Plants in the United States. J. Renew. Sustain. Energy 2020, 12, 043501. [Google Scholar] [CrossRef]
- kWh Analytics. Solar Risk Assessment: 2021; KWH ANALYTICS: San Francisco, CA, USA, 2021; Available online: https://www.kwhanalytics.com/solar-risk-assessment (accessed on 25 October 2021).
- NREL. New Solar PV Tool Accurately Calculates Degradation Rates, Saving Money and Guiding Business Decisions. Available online: https://www.nrel.gov/news/press/2018/new-solar-pv-tool-accurately-calculates-degradation-rates-saving-money-and-guiding-business-decisions.html (accessed on 21 January 2022).
- Proven Energy Australian Solar Recycling: How It Works. Available online: https://provenenergy.com.au/solar-recycling/ (accessed on 23 October 2021).
- ARENA. ARENA Corporate Plan. 2018. Available online: https://arena.gov.au/about/publications/corporate-plan/ (accessed on 11 February 2021).


Publisher’s Note: MDPI stays neutral with regard to jurisdictional claims in published maps and institutional affiliations. |
© 2022 by the authors. Licensee MDPI, Basel, Switzerland. This article is an open access article distributed under the terms and conditions of the Creative Commons Attribution (CC BY) license (https://creativecommons.org/licenses/by/4.0/).