Article

Optimal Scheduling of AC–DC Hybrid Distribution Network Considering the Control Mode of a Converter Station

1
Hubei Key Laboratory of Power Equipment & System Security for Integrated Energy, Wuhan 430072, China
2
School of Electrical Engineering and Automation, Wuhan University, Wuhan 430072, China
3
Electric Power Research Institute, State Grid Hubei Electric Power Co., Ltd., Wuhan 430077, China
*
Author to whom correspondence should be addressed.
Sustainability 2023, 15(11), 8715; https://doi.org/10.3390/su15118715
Submission received: 25 April 2023 / Revised: 23 May 2023 / Accepted: 26 May 2023 / Published: 28 May 2023
(This article belongs to the Special Issue Smart Grid Technologies and Applications)

Abstract

:
Due to the difference in types of loads between regions and the increasing integration of random elements such as electric vehicles (EVs) and distributed generations (DGs), distribution station areas (DSAs) are facing challenges such as unbalanced load rates and voltage violations. An AC–DC hybrid distribution network formed by interconnecting AC-DSAs using flexible DC technology can not only address these issues, but also offer more efficient interfaces for EV charging piles and DC devices on the DC side. To fully leverage the advantages of the technology and coordinate dispatchable elements within each DSA, this paper proposes an optimal scheduling model, which balances the load rate between DSAs, improves voltage profiles, and considers the control mode of the converter station as a dispatchable element, taking into account its impact on the voltage deviation on the DC side. Simulation results demonstrate the effectiveness of the proposed model in balancing load rate and improving voltage profiles. Moreover, rational decision-making regarding the selection of the control mode for converter stations can effectively mitigate the voltage deviation on the DC side without deteriorating the voltage deviation on the AC side.

1. Introduction

A distribution station area (DSA) is the end power supply unit of the distribution network, which is the power supply area of a distribution transformer (usually 35 kV/380 V or 10 kV/380 V) [1]. With the increasing penetration of low-carbon elements such as distributed generations (DGs), electric vehicle charging piles, and electrification of industrial and agricultural production equipment, the pressure on renewable energy consumption and power supply in low-voltage DSAs has increased. In urban areas, the rapid growth of load in some areas has led to a dense and uneven distribution of load, with some DSAs experiencing high load rates while others have low load rates, making the load rate unbalanced between DSAs. When the load rate is low, the transformer capacity is underutilized, resulting in low economic efficiency. On the other hand, transformers with high load rates not only have lower capacity margins, but also have a higher risk of overheating and shorter lifespans. Thus, it is necessary to improve this load imbalance situation. However, low-voltage DSAs usually adopt a radial topology, where the load is supplied by a single power source, and the DSAs with a high load rate are unable to transfer the load to the adjacent DSAs with a low load rate. In addition, due to geographical location and other factors, it is difficult to expand the capacity of transformers and lines in old urban areas, tourist attractions, and other load-intensive areas in a short period of time, leading to difficulty in alleviating power supply pressures in high load rate DSAs. In rural areas, some DSAs experience strong seasonal fluctuations in load due to the increasing electrification of production equipment involved. These DSAs may have heavily loaded transformers during peak seasons, while operating with low load rates during the remaining seasons. While expanding and renovating transformers and transmission lines can alleviate the heavy load operation of transformers, it results in significant capacity waste during light load operation seasons, making the economic efficiency of investment poor. Additionally, the different types of loads between regions may result in adjacent DSAs operating under heavy loads while others are in a light load state. The interconnection of DSAs through low-voltage flexible DC technology can help realize load transfer between DSAs, which can provide a potential solution to the above problems and help improve the utilization of surplus capacity.
With the continued development of power electronics, information technology, and distribution equipment technology, the application of flexible DC interconnection technology to AC distribution systems has become increasingly common [2]. This technology enables flexible interconnection of AC–DSAs through low-voltage DC lines, facilitating capacity sharing of multiple DSAs, load transfer, and comprehensive utilization of resources. Specifically, this technology offers the following advantages:
(1)
Achieving load balancing between different DSAs and relieving the pressure of power supply in high load rate DSAs [3].
(2)
Enhance the capability of renewable energy consumption [2].
(3)
Provide an efficient interface for DC loads and DC power sources.
(4)
Improve the reliability of power supply [4].
(5)
Delaying investments. The interconnection of AC–DSAs offers an effective solution to integrate surplus transformer capacity, meet the growing demand, and postpone the need for capacity expansion investments and construction.
Currently, flexible DC interconnection technology has been implemented in various engineering projects in the UK [5], Beijing [6], Guangdong [7], and Ningbo [3]. Scholars have conducted extensive research on optimal scheduling for distribution networks using flexible DC interconnection technology. One typical application of this technology in distribution networks is the use of soft open point (SOP) instead of traditional mechanical interconnection switches for optimal power flow [4]. In [8] a control strategy was developed for real-time suppression of voltage fluctuations in active distribution networks based on SOP. This strategy is designed to effectively mitigate the frequent power fluctuations in renewable energy output. In [9], an optimal dispatching model for active distribution networks including SOP was developed to coordinate and control dispatchable resources for optimal power flow and to suppress voltage violations. In [10] was further considered the problem of real-time voltage control based on [9], and they developed an optimization model considering the QV curve of SOP. In [11] the centralized control method’s communication pressure was addressed and a decentralized optimal scheduling model was developed. In [12] the problem of local voltage control was considered based on [11], and a strategy combining decentralized and local control of SOP was proposed. In [13] it was suggested to integrate the energy storage system (ESS) with SOP to provide flexible regulation in both time and space dimensions. To increase the penetration of renewable energy without voltage violations, [14] proposed a two-layer optimization model to coordinate the operation of SOP, PV, and thermal ESSs in the distribution network. In [15] the problem of transmission line blockage caused by large-scale EV integration was solved by using SOP, and a day-ahead real-time two-stage optimal scheduling model to coordinate SOP and EV operations was established. Another significant application of flexible DC interconnection technology in AC distribution networks is the construction of hybrid AC–DC distribution systems. In [16], they established a single-objective optimization model for hybrid AC–DC distribution networks considering the integration of multiple renewable energy sources and proposed a meta-heuristic optimization algorithm to solve it. In [17], they developed a two-stage energy management model considering frequency safety constraints for the uncertainty of connected renewable energy sources and loads in the hybrid AC–DC microgrid. In [18] a two-stage day-ahead-in-day optimization model was established to improve the renewable energy penetration rate and maintain the optimal operation of the distribution network under high renewable energy penetration rates, considering various flexible adjustable resources in the hybrid AC–DC distribution network. In [19] a two-layer optimal dispatching model considering the uncertainty of the renewable energy output and load demand to maintain the low-carbon operation of the hybrid AC–DC microgrid was proposed. In [20] a quadratic programming (QP) model for AC–DC hybrid distribution networks was established and achieved optimal control in consideration of new energy output fluctuations. In [21,22], a coordination between electric vehicles and energy storage systems with distributed generations in active distribution network was achieved by establishing a bi-level scheduling model for each case.
The purpose of this paper is to propose an optimal scheduling model for flexible interconnected DSAs that can fully coordinate the dispatchable elements within each DSA and take advantage of the flexible interconnection. Previous related studies have significant reference value when applied to the optimal scheduling problem of flexible interconnected DSAs. However, these studies have limitations as they cannot address the practical engineering problem of load balancing and do not consider the control mode of converter stations, which has a significant impact on the voltage profile on the DC side in the optimal scheduling model.
The main contributions of this paper can be summarized as follows:
(1)
An optimal scheduling model is proposed based on the actual requirements of flexible interconnection DSAs, with the objectives of balancing the load rate, improving the voltage profile, and reducing the operation cost.
(2)
The influence of the control mode is analyzed and considered in the optimal scheduling model by taking the control mode of the converter stations as decision variables. By making a reasonable decision on the selection of the control mode of each converter, the voltage deviation on the DC side can be effectively reduced. From a mathematical perspective, taking the control mode of converters into account provides more decision variables for the optimization model, expanding the feasible solution space and enabling a more optimal solution to be found.
The remainder of this paper is organized as follows. Section 2 establishes the mathematical model of the converter station considering the control mode and the mathematical model of the flexible interconnected DSAs; Section 3 establishes the optimal scheduling model for the flexible interconnected DSAs with the goal of achieving load rate balance, voltage profile improvement, and operation cost reduction; Section 4 presents a case study to demonstrate the effectiveness of the proposed model; and Section 5 summarizes the whole paper.

2. Mathematical Model of Flexible Interconnected DSAs Considering Control Modes of Converter Stations

2.1. Topologies of Flexible Interconnected DSAs

The voltage source converter (VSC) is the fundamental device used to achieve flexible interconnection, and the topology of flexible interconnected DSAs can be broadly classified into two categories based on the location of VSC deployment: a centralized structure and decentralized structure, as shown in Figure 1. As illustrated in Figure 1a, the centralized structure employs several back-to-back connected VSCs to interconnect AC–DSAs, which typically necessitates a designated container or room for deployment, thus imposing significant geographical constraints. Moreover, as low-voltage AC lines are required to link the DSA to the converter, the proximity of each DSA is essential to prevent substantial voltage deviation and power losses on the lines. Furthermore, the centralized structure has limited DC interfaces that cannot effectively leverage the advantages of DC distribution.
In contrast, Figure 1b shows the decentralized structure, where each converter is locally deployed in the DSA, and the DSAs are interconnected by DC lines, offering several advantages such as lower transmission loss and freedom from geographical restrictions in comparison to the centralized structure. The decentralized structure also offers greater scalability and a larger interconnection range, making it ideal for practical engineering scenarios. Additionally, the DC distribution network can be established on the DC side, providing ample DC interfaces, enabling efficient and convenient access to various DC loads, ESSs, and DGs, thereby expanding the power supply range. In general, the decentralized structure has broader application prospects. In this paper, the study is based on the topology shown in Figure 1b.

2.2. The Influence of the Control Mode of Converter Station on Voltage Profile on the DC Side

Figure 1b illustrates that the DC side of flexible interconnected DSAs with the decentralized structure is powered by the AC–DSAs via the converters. To balance the load rate of each DSA, precise control of the power transmitted by each converter is essential. Therefore, typically, one converter adopts a Udc-Q control mode while the remaining converters adopt the P-Q control mode during normal operation.
The adoption of different control modes has a notable impact on the voltage profile on the DC side, since the node connected to the converter adopting the Udc-Q control mode is equivalent to the slack bus on the DC side. Selecting a different converter to adopt the Udc-Q control mode is comparable to changing the slack bus on the DC side, which alters the power flow and, consequently, the voltage profile. To elucidate this point, a simple example is introduced. As shown in Figure 2, nodes 1, 2, and 3 are the DC side nodes connected to the converters, and for the sake of analysis, no load is connected to the DC line. Suppose that the power injected in nodes 1 and 2 is P, the power injected in node 3 is −2P, and the rated voltage of the DC line is UN. Table 1 displays the voltage deviation of each node.
The voltage profile on the DC side is significantly affected by the selection of different nodes acting as the slack bus, as evidenced by Table 1. When node 2 is chosen as the slack bus, the total voltage deviation on the DC side is considerably lower than in the other cases. Therefore, while optimizing the scheduling of flexible interconnected DSAs, the selection of slack nodes on the DC side must be considered. That is, the control mode of the converter should also be taken as a decision variable in the optimal scheduling model, to select the most suitable converter to adopt the Udc-Q control mode, thereby maintaining the voltage deviation on the DC side at a low level. This is critical for sustaining the stable operation of the DC distribution network and optimizing the user’s experience. It is important to note that from the perspective of the AC side, the converter is equivalent to a current source, and switching its control mode does not deteriorate the voltage profile on the AC side.

2.3. Mathematical Model of Flexible Interconnected DSAs

2.3.1. Mathematical Model of Converter Station Considering Control Mode

The equivalent circuit of the converter station is shown in Figure 3, which consists of the equivalent impedance and the ideal VSC. In the figure, the part marked in red is the AC side, and the part marked in blue is the DC side. UPCC, t is the voltage at the point of common connection (PCC) between the converter and the DSA, Un, t is the voltage at the outlet of the AC side of the converter, Uk, t is the voltage at the DC side of the converter, ZVSC is the equivalent impedance of the filter and the internal loss of the converter, P n , t V S C , A C + j Q n , t V S C , A C is the power injected into the AC side of the converter, and P k , t V S C , D C is the active power injected into the DC side of the converter.
The power output of the VSC needs to satisfy the capacity constraint as well as the energy conservation constraint:
( P n , t VSC , AC ) 2 + ( Q n , t VSC , AC ) 2 ( S VSC ) 2
P n , t VSC , AC = P k , t VSC , DC
where P n , t V S C , A C and Q n , t V S C , A C are the active and reactive power injected by the converter into the connected AC node n at time t, P k , t V S C , A C is the active power injected by the converter into the connected DC node k at time t, and SVSC is the rated capacity of the converter.
The voltage constraint at the outlet of the converter is shown in Equation (3):
U n , t = μ M t 2 U k , t
where μ is the DC voltage utilization rate, μ = 3 / 2 when SPWM is adopted, and Mt is the degree of modulation at time t, 0 ≤ Mt ≤ 1. Therefore, Equation (3) can be rewritten as follows:
0 U n , t 3 2 2 U k , t
Next, the control mode of the converter will be modeled. When the converter adopts the Udc-Q control mode, the DC side node connected to the converter is considered as a slack bus, and the voltage of this node satisfies Equation (5):
U k , t = U N DC
where U N D C is the rated voltage on the DC side.
When the converter adopts the P-Q control mode, the node voltage of the converter access satisfies Equation (6):
U _ DC U k , t U ¯ DC
where U _ D C and U ¯ D C refers to the lower and upper voltage limits on the DC side.
A binary variable is introduced to represent the control mode in order to represent Equations (5) and (6) uniformly in the form of Equation (7):
δ k , t U N DC + ( 1 δ k , t ) U _ DC U k , t DC δ k , t U N DC + ( 1 δ k , t ) U ¯ DC   , k N VSC , DC
where δk, t is a binary variable, δk, t = 1 means the converter is in Udc-Q control mode, δk, t = 0 means the converter is in P-Q control mode, and N V S C , D C is the set of DC nodes connected to the converter.
The constraint that there is only one slack bus in the DC distribution network is also to be satisfied:
k N VSC , DC δ k , t = 1   , t
Equations (1), (2), (4), (7), and (8) constitute the mathematical model of the converter station considering the control mode, which is the basis for the optimal scheduling modeling in the later section.

2.3.2. Mathematical Model of Power Flow on the AC Side [23]

The power flow constraints that AC distribution network should satisfy are as follows.
i j Ω j U ( P i j , t r i j l i j , t ) + P j , t = j k Ω j D P j k , t
i j Ω j U ( Q i j , t x i j l i j , t ) + Q j , t = j k Ω j D Q j k , t
v i , t v j , t + ( r i j 2 + x i j 2 ) l i j , t 2 ( r i j P i j , t + x i j Q i j , t ) = 0
2 P i j , t 2 Q i j , t l i j , t v i , t 2 l i j , t + v i , t
where Ω j U is the set of branches with j as the end node, Ω j D is the set of branches with j as the first node, P i j , t and Q i j , t are the active and reactive power flowing through branch ij at time t, Pj, t and Qj, t are the active and reactive power injected into node j at time t, rij and xij are the resistance and reactance of branch ij, vj, t is the square of the voltage magnitude at node j at time t, and lij, t is the square of the current magnitude on branch ij at time t.
Equations (1), (2), (4), (7), and (8) constitute the mathematical model of the converter station considering the control mode, which is the basis for the optimal scheduling modeling in the later section.

2.3.3. Mathematical Model of Power Flow on the DC Side [18]

The power flow constraints that DC distribution network should satisfy are as follows.
i j Ω j U ( P i j , t r i j l i j , t ) + P j , t = j k Ω j D P j k , t
v i , t v j , t + r i j 2 l i j , t 2 r i j P i j , t = 0
2 P i j , t l i j , t v i , t 2 l i j , t + v i , t

2.3.4. Mathematical Model of ESS [17]

The constraint that ESS should satisfy is as follow.
S j , t + 1 ESS = S j , t ESS + η ch P j , t ESS , ch Δ t E j ESS P j , t ESS , dis Δ t η dis E j ESS
where S j , t E S S is the state of charge (SoC) of the ESS connected to node j at time t, ηch and ηdis are the charging and discharging efficiency of the ESS, E j E S S is the rated capacity of the ESS, Δt is the scheduling time interval, and P j , t E S S , d i s and P j , t E S S , c h are the discharging and charging power of the ESS connected to node j at time t.

2.3.5. Mathematical Model of PV

With the gradual development of information technology and regulation ability of the power distribution system, PV with adjustable active and reactive power output will gradually replace the traditional uncontrollable PV, and this paper is modeled for PV with an adjustable power output.
0 P j , t PV P j , t PV , max
{ Q j , t PV , max = ( S j PV ) 2 ( P j , t PV ) 2 Q j , t PV , min = ( S j PV ) 2 ( P j , t PV ) 2
where P j , t P V , m a x is the maximum output active power of PV at node j at time t, P j , t P V is the active power actually injected into the distribution network by PV at node j at time t, S j P V is the rated capacity of PV at node j, and Q j , t P V , m a x and Q j , t P V , m i n are the upper and lower limits of the reactive power output of PV, respectively.

3. Optimal Scheduling Model for Flexible Interconnected DSAs

3.1. Objective Function

The optimization model proposed in this paper considers three aspects as the optimization objectives: the balance of load rate of each DSA, the voltage deviation of the whole flexible interconnected DSAs, and the operating cost, as shown in Equation (19).
min F = α 1 f 1 s 1 + α 2 f 2 s 2 + α 3 f 3 s 3
where f1 is the imbalance degree of load rate; f2 is the total voltage deviation; f3 is the operation cost; s1, s2, and s3 are the baseline values for f1, f2, and f3, respectively, based on the values of f1, f2, and f3 when not optimized; and α1, α2, and α3 are the weights of f1, f2, and f3, respectively.
(1)
The specific expression of f1 is shown in Equation (20).
f 1 = t T d D | P d , t S d 1 n d d D P d , t S d |
where T is the dispatch period, D is the set of DSAs, Pd, t is the active power flowing through the distribution transformer of the d-th DSA at time t, Sd is the capacity of the distribution transformer of the d-th DSA, and nd is the number of DSAs.
(2)
The specific expression of f2 is shown in Equation (21).
f 2 = t T j N | v j , t ( U N ) 2 |
where N is the set of nodes in the whole flexible interconnected DSAs, and UN is the rated voltage at node j.
(3)
The specific expression of f3 is shown in Equation (22).
f 3 = c loss t T i j Ω l i j , t r i j Δ t + c cos t t T d D P d , t Δ t + c cur t T j N PV ( P j , t PV , max P j , t PV ) Δ t
where closs is the unit price of power losses, Ω is the set of all branches, ccost is the unit price of electricity purchased from the superior grid, ccur is the penalty unit price of PV output curtailment, and N P V is the set of nodes connected to PV.

3.2. Constraints

3.2.1. Operation Constraints on the AC Side

(1)
Balance of the power injected into the nodes:
P j , t = P j , t PV + P j , t ESS , dis P j , t ESS , ch + P j , t VSC , AC P j , t load
Q j , t = Q j , t PV + Q j , t VSC , AC Q j , t load
where Q j , t P V is the reactive power output of the PV connected to node j at time t. P j , t l o a d and Q j , t l o a d are the active and reactive power demand of the load at node j at time t.
(2)
Security constraints:
( U _ AC ) 2 v j , t ( U ¯ AC ) 2
0 l i j , t ( I max AC ) 2
where U _ A C and U ¯ A C are the upper and lower limits of the voltage magnitude on the AC side, respectively, and the I m a x A C is the upper limit of the current magnitude on the AC side. According to standard [24], the voltage deviation allowed in the 380 V AC low-voltage distribution network is −10%, +7%.

3.2.2. Operation Constraints on the DC Side

(1)
Balance of the power injected into the nodes:
P j , t = P j , t PV + P j , t DS , dis P j , t DS , ch + P j , t VSC , DC P j , t load
(2)
Security constraints:
( U _ DC ) 2 v j , t ( U ¯ DC ) 2
0 l i j , t ( I max DC ) 2
where I m a x D C is the upper limit of the current magnitude on the DC side. According to standard [25], the voltage deviation allowed in the DC distribution network for voltage levels below 1500 V is −20%, +5%.

3.2.3. Operation Constraints of the ESS

(1)
Constraints of SoC:
S _ j ESS S j , t ESS S ¯ j ESS
S j , t = 1 ESS = S j , t = 24 ESS
where S _ j E S S and S ¯ j E S S are the lower and upper limits of the SoC of the ESS connected to the node j, respectively, and Equation (31) indicates that the initial SoC and the final SoC remain equal during a scheduling period (usually 24 h).
(2)
Constraints of charge and discharge power:
0 P j , t ESS , ch λ j , t ch P j , t ESS , ch , max
0 P j , t ESS , dis λ j , t dis P j , t ESS , dis , max
λ j , t dis , λ j , t ch { 0 , 1 }
λ j , t dis + λ j , t ch 1
where λ j , t d i s and λ j , t c h are binary variables indicating the discharging and charging states. λ j , t d i s = 1 indicates discharging, and λ j , t c h = 1 indicates charging; Equation (35) indicates that the ESS is not in charging and discharging states at the same time, and P j , t E S S , c h , m a x and P j , t E S S , d i s , m a x indicate the upper limit of the charging and discharging power, respectively.

3.2.4. Constraint of PV Capacity

The output power during PV operation cannot exceed the capacity limit.
( P j , t PV ) 2 + ( Q j , t PV ) 2 ( S j PV ) 2

3.2.5. Constraint of Distribution Transformers

The power flowing through the transformer cannot exceed its capacity limit.
( P d , t ) 2 + ( Q d , t ) 2 ( S d ) 2
where Qd, t is the reactive power flowing through the transformer in the d-th DSA at time t.

3.3. Model Conversion

The absolute value terms involved in the objective functions f1 and f2 shaped as shown in Equation (38) are not conducive to model solving.
| X 1 X 2 |
Introduce auxiliary variable M to replace the absolute value term and convert Equation (38) into Equation (39).
M
Additionally, add constraints as shown in Equation (40).
{ M X 1 X 2 M ( X 1 X 2 )
In addition, the constraints (1), (36), and (37) can be abstracted as the quadratic circle constraint shown in Equation (41).
( X 1 ) 2 + ( X 2 ) 2 ( C ) 2
The constraints shown in Equation (41), although convex, are nonlinear and have low solving efficiency. Moreover, since Equations (16) and (23) are cone constraints, if the circular constraint in the model is considered to be linearized, this optimization model can be transformed into a mixed-integer second-order cone programming (MISOCP) model, which can be efficiently solved. Therefore, Equation (41) is transformed into the linear constraints shown in Equation (42).
{ C X 1 C C X 2 C 2 C X 1 + X 2 2 C 2 C X 1 X 2 2 C
So far, the optimal scheduling model for flexible interconnected DSAs considering the control mode of the converter station has been developed as shown in Equation (43), and the model is further transformed into an MISOCP model, which can be directly and efficiently solved by commercial solvers such as Gurobi, Cplex, etc., for global optimal solutions.
{ obj .   Equation   ( 19 ) s . t .   Equations   ( 1 ) ,   ( 2 ) ,   ( 4 ) ,   ( 7 ) ,   ( 8 ) ,   ( 9 ) ~ ( 18 )   and   ( 20 ) ~ ( 37 )

4. Case Study

4.1. Setting of the Case

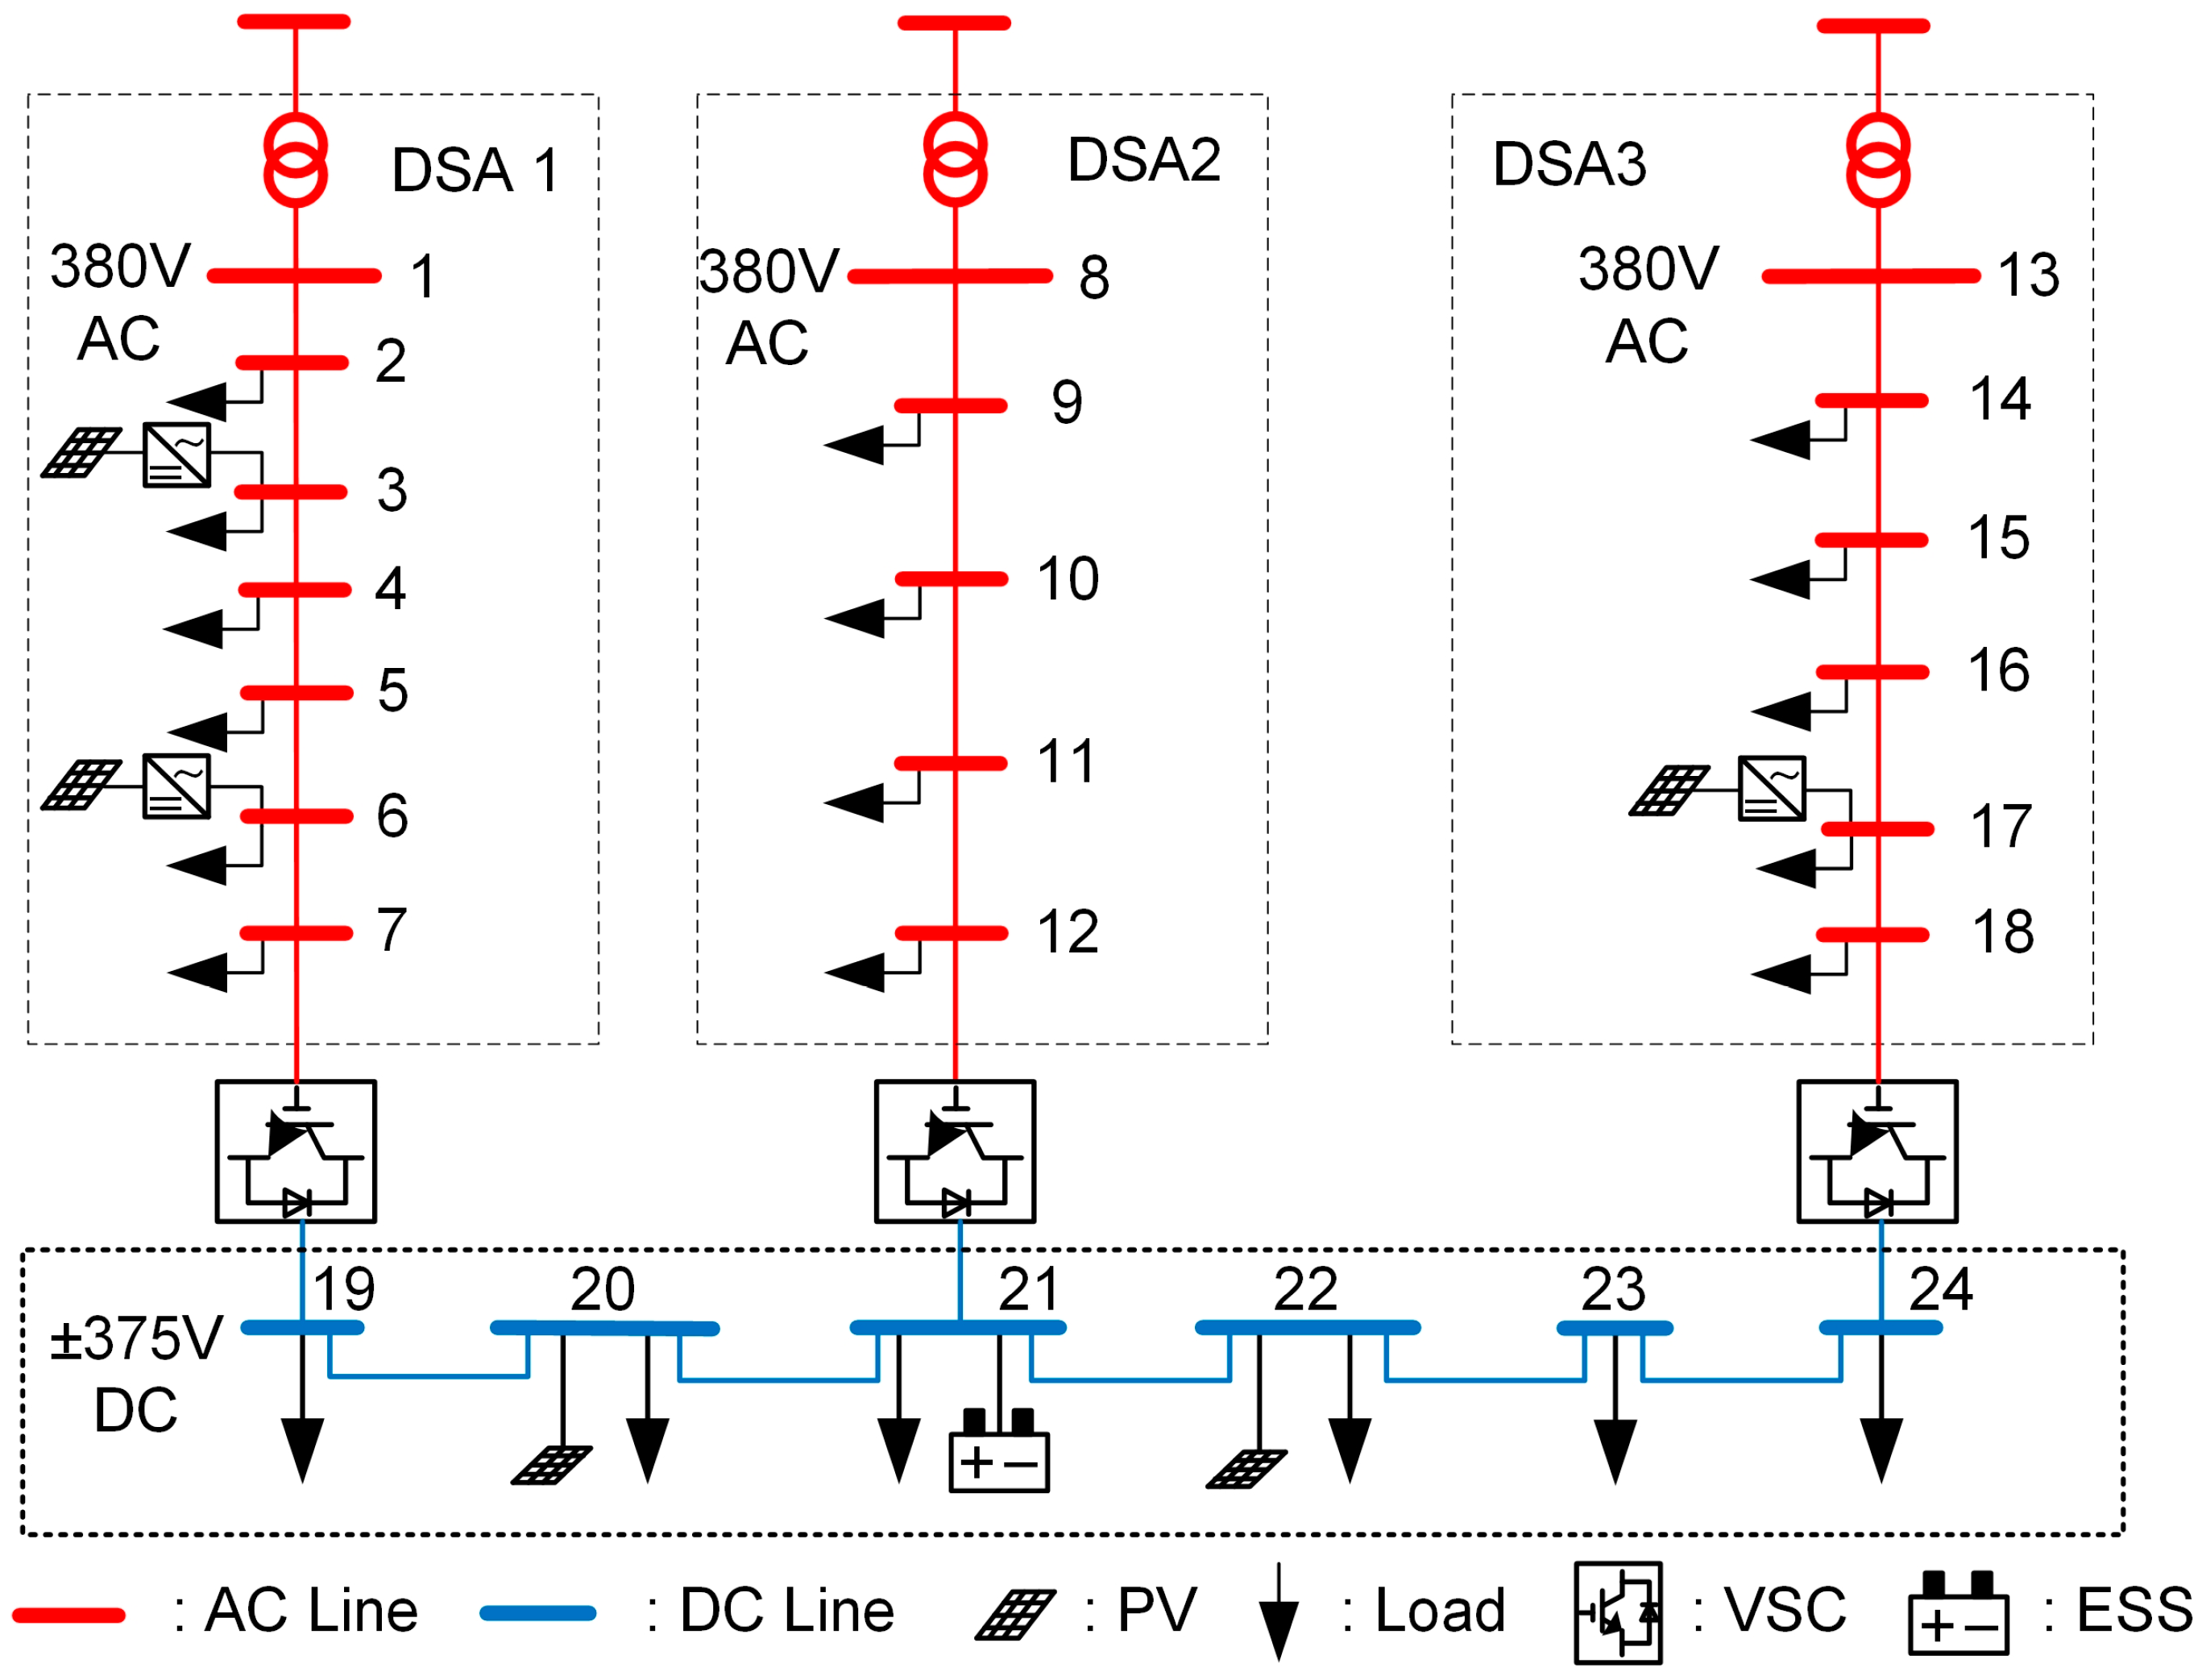
The day-ahead optimal scheduling of the 24-node flexible interconnected DSA shown in Figure 4 is introduced to verify the effectiveness of the proposed optimal scheduling model.
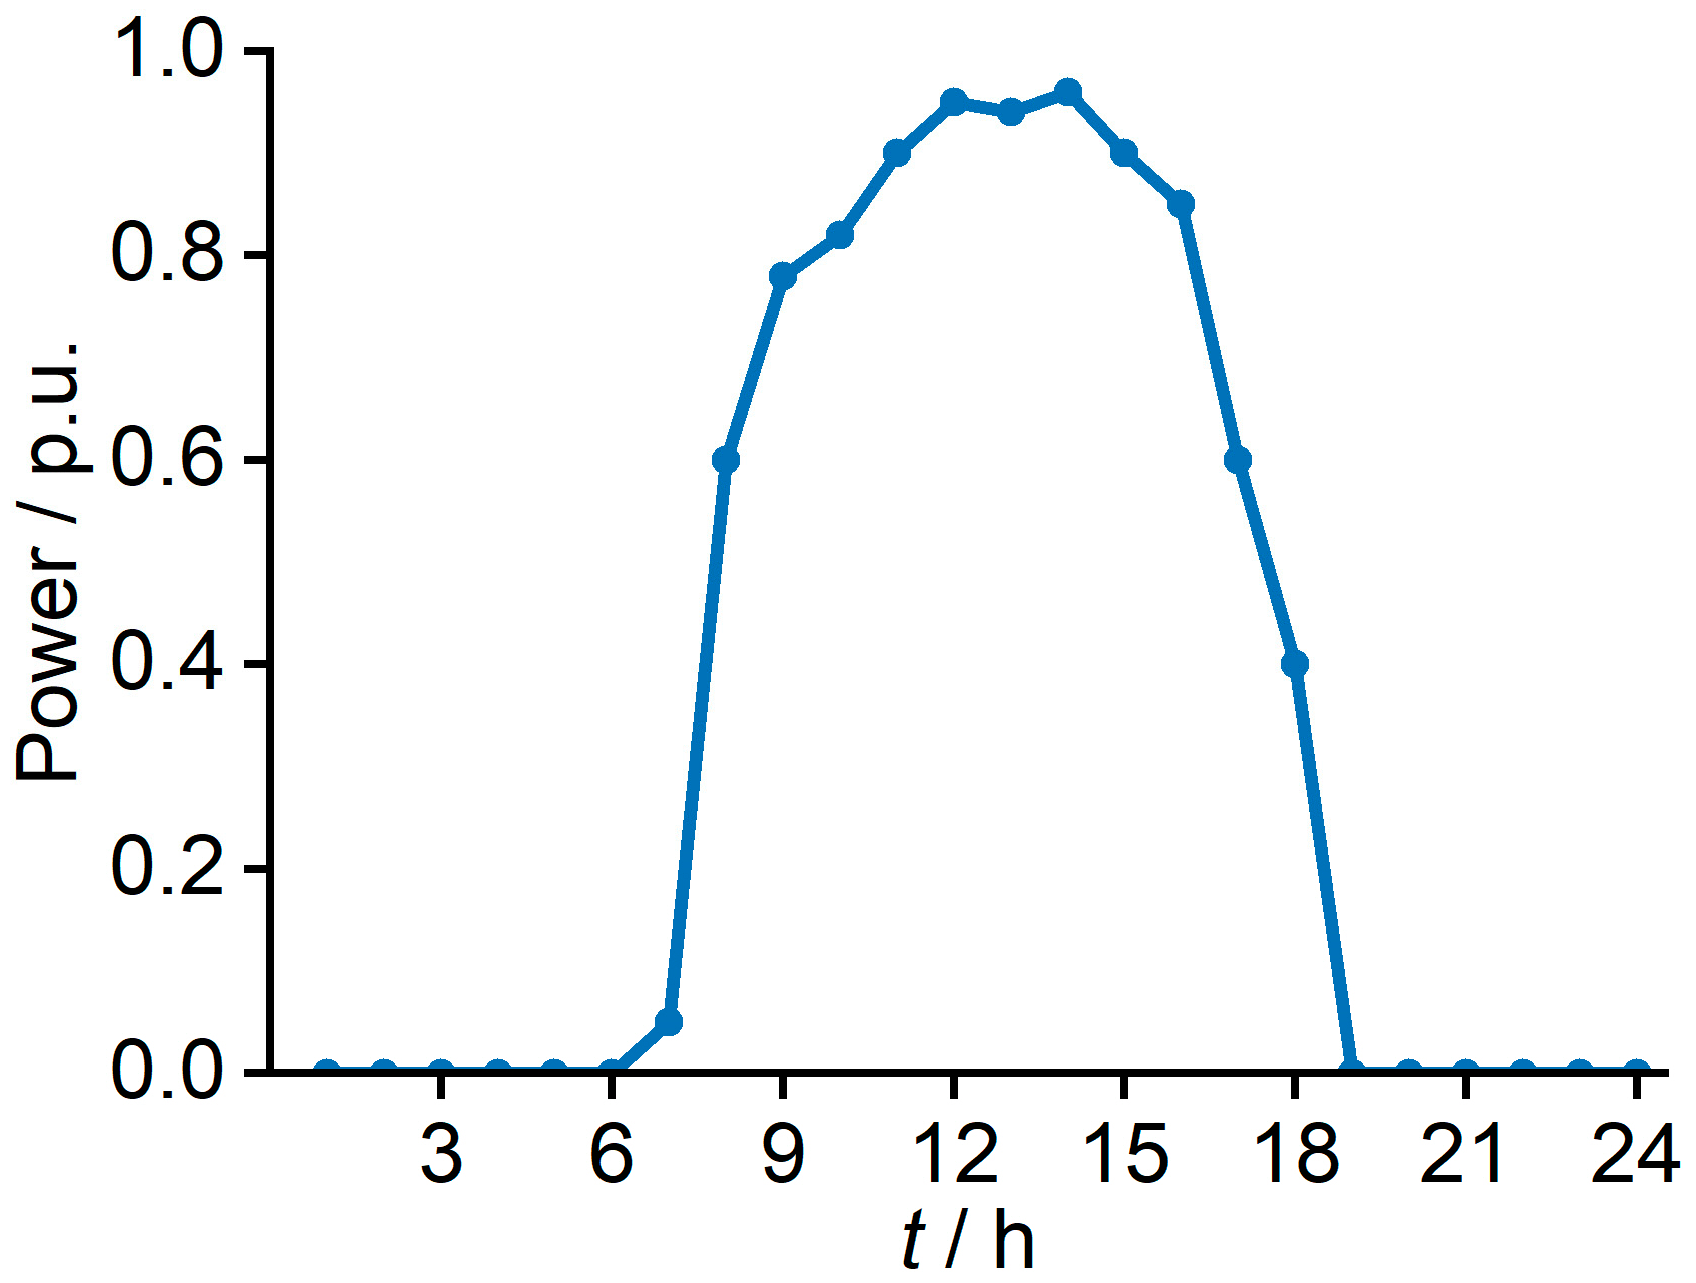
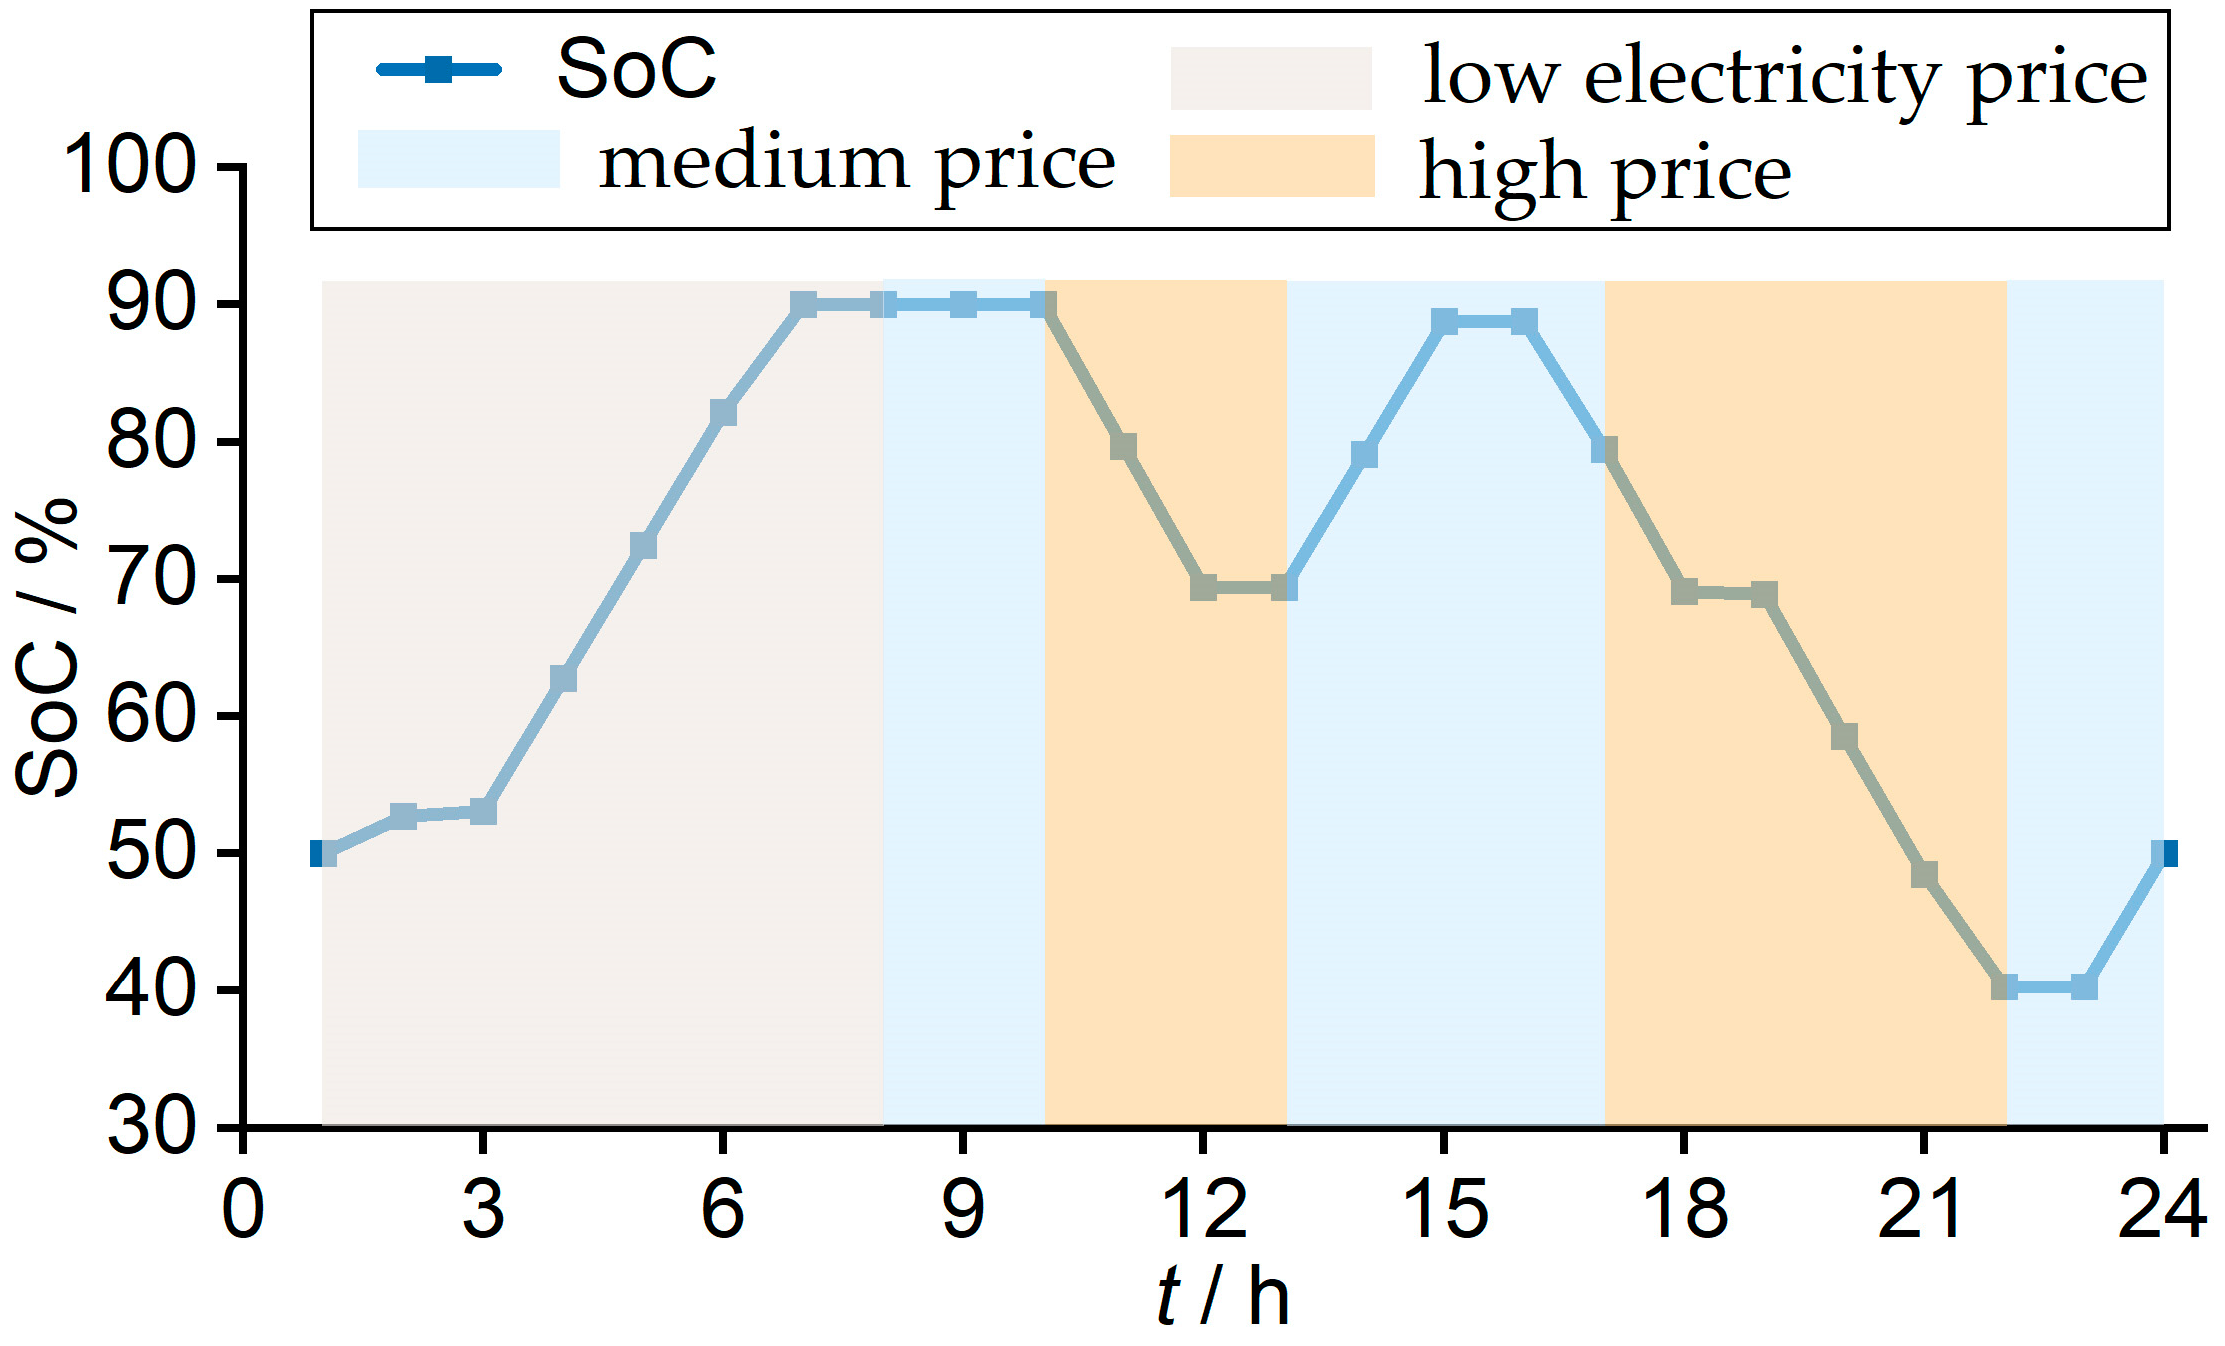
The 24-node flexible interconnected DSA consists of three flexible interconnected 380 V AC–DSAs, and a ±375 V DC distribution network is established on the DC side. The AC–DSA is connected to the superior distribution network through distribution transformers at nodes 1, 8, and 13 with capacities of 400 kV·A, 200 kV·A and 315 kV·A, respectively. An ESS is connected to node 22 on the DC side with a capacity of 250 kW·h, a maximum charging and discharging power of 20 kW, and a charging and discharging efficiency of 0.97. The capacity of the three VSCs located at nodes 7, 12, and 18 is 150 kV·A. The PV capacities connected to nodes 3, 6, 17, 21, and 23 are 10 kV·A, 15 kV·A, 100 kV·A, 30 kV·A, and 30 kV·A, respectively, and their power output normalization curves are shown in Figure 5. The time-of-use (TOU) electricity price for purchasing electricity from the superior power grid is shown in Figure 6, and the penalty unit price of PV output curtailment is set at 2.5 CNY/(kW·h).

4.2. Results Analysis

4.2.1. Effect on Load Rate Balancing between DSAs

Before applying the proposed optimal scheduling model, the load rate of the three AC–DSAs are shown in Figure 7 (At this time, the DC part of Figure 4 is not considered, and the loads, PVs, and ESS on the DC side are connected to the AC–DSAs nearby).
The case takes the unbalanced load rate condition between DSAs into account, as shown in Figure 7; for example, from 9:00 to 17:00, the load rate of DSA 1 and DSA 3 is very low, while the load rate of DSA 2 is very high, and even in extreme cases such as at 16:00, the load rate exceeds the rated capacity and is in the overload operation. It is known that underutilization of the transformer capacity and low economic efficiency occurs when the load rate is low. Conversely, high load rate transformers not only have a limited capacity margin but are also susceptible to overheating, resulting in increased losses and reduced lifespan. Additionally, DSAs with high load rates have the potential to cause voltage violations at the end of the line due to excessive power transmission. Therefore, the issue of the unbalanced load rate needs to be improved.
After the flexible interconnection of the three AC–DSAs, as shown in Figure 4, the optimal scheduling model proposed in Section 3 is used for optimal scheduling, where the weight coefficients of the objective function are taken as α1 = 0.15, α2 = 0.65, and α3 = 0.2. The load rate of each DSA and the active power transmitted by the VSCs are shown in Figure 8.
Comparing Figure 8 with Figure 7, it can be found that the unbalanced load rate between stations can be effectively mitigated after the three DSAs are flexibly interconnected through DC lines and the power is reasonably scheduled to be transmitted by the VSCs. In Figure 7, it can be seen that from 8:00 to 17:00, the load rate of DSA 2 is too high, while the load rates of DSA 1 and 3 are relatively low. Therefore, VSC 1 and VSC 3 transfer the active power to DSA 2 through VSC2, which alleviates the problem of the high load rate of DSA 2 and makes the load rates of each DSA approximately balanced. At 16:00, the overload state of DSA 2 is eliminated. The active power supplied to DSA 2 through other DSAs is equivalent to increasing the capacity of DSA 2, thus realizing dynamic capacity increase.

4.2.2. Effect on Voltage Profile Improvement in AC–DSAs

Before interconnecting AC–DSAs flexibly, when the load factor is too high, the excessive power transmitted on the line causes a large voltage deviation, making the voltage at the end nodes of the DSAs violate the lower limit, as shown in Figure 9.
In Figure 9, it can be observed that the voltage at some moments has violated the lower limit, which can seriously affect the normal power consumption of customers. This situation has been improved by using DC lines to interconnect AC–DSAs flexibly, and the simulation results are shown in Figure 10.
As can be seen in Figure 10, the original voltage violation has been eliminated because part of the load in the DSA with a high load rate has been transferred to the rest of the DSAs through the DC line, and therefore the VSC can provide reactive power compensation for the AC–DSAs.

4.2.3. Effect of Considering Control Mode of Converter Stations on Voltage Profile Improvement on the DC Side

The flexible interconnection of AC–DSAs can improve the voltage profile on the AC side, and as analyzed in Section 2.2, further consideration of the converter control mode in the optimal dispatch model can further improve the voltage profile on the DC side without deteriorating the voltage profile on the AC side. To verify this, a set of comparison experiments has been designed with a total of four experimental schemes, as shown in Table 2.
All the four schemes are simulated under the topology shown in Figure 4 by considering the DC flexible interconnection, but in schemes 1–3, the control mode of a VSC is fixed as the Udc-Q control mode, and the rest of the VSCs are in the P-Q control mode, i.e., Equations (7) and (8) are replaced by Equations (44) and (45) in the optimal scheduling model used in the simulation (taking scheme 1 as an example), and the rest of the model remains unchanged.
U 19 , t = 1   , t T
{ U _ D C U 22 , t U ¯ D C   , t T U _ D C U 25 , t U ¯ D C   , t T
In scheme 4, the proposed optimal scheduling model considering the control mode of converters is used, i.e., Equations (7) and (8) are included in the model. The control mode of the VSC at each moment in this scheme is determined using the optimal scheduling model. A comparison of the average value of the voltage deviation U ¯ on the DC side for the four schemes is shown in Figure 11. The formula for U ¯ is shown in Equation (46). The control modes of VSCs at each moment in scheme 4 are shown in Table 3.
Δ U ¯ = 1 n j = 1 n | U j U N |
where n is the number of nodes on the DC side.
As can be seen in Figure 11, in schemes 1–3, fixing a certain VSC in the Udc-Q control mode cannot guarantee that the U ¯ is kept to a minimum at all times., for e.g., letting VSC1 adopt the Udc-Q control mode at 10:00 gives a smaller voltage deviation than letting VSC3 adopt the Udc-Q control mode, while the opposite is true at 11:00. The effect of selecting different VSCs by adopting the Udc-Q control mode on the voltage deviation on the DC side is related to the power flow in the DC distribution network, which depends on the load demand, the DG’s power output, and the power transmitted by the VSCs. Since the power flow is not fixed, it is not possible to guarantee that the U ¯ of the DC distribution network is always the lowest by fixing a certain VSC to adopt the Udc-Q control mode. In other words, the selection of different VSCs by adopting the Udc-Q control mode leads to different voltage deviations, which means that the control mode can be considered as a decision variable in the optimal scheduling model, so that the most suitable VSC can be selected to adopt the Udc-Q control mode at each time, and then effectively reduce the voltage deviation of the DC distribution network, which is the motivation of the proposed model. As can be seen in Figure 11, scheme 4 with the control mode as the decision variable selects the most suitable VSC by adopting the Udc-Q control mode, thus ensuring that the voltage deviation in scheme 4 is equal to the smallest one among the first three schemes at each time, which verifies the effectiveness of the proposed model. If the control mode is not taken into consideration, the voltage deviation on the DC side increases, e.g., scheme 1 has an average voltage deviation of 4.2% at 9:00, while scheme 4 only has an average voltage deviation of 1.7% at this time.
In addition, the average voltage deviation U ¯ on the AC side is shown in Figure 12.
It can be seen that the U ¯ on the AC side is almost equal among the four schemes, that is, the voltage on the AC side is not affected by the control mode.
In summary, taking the control mode of the converters into consideration as a decision variable in the optimal scheduling model can provide more dispatchable space for optimal scheduling and create more value, such as reducing the voltage deviation in the DC distribution network without deteriorating the voltage deviation on the AC side.

4.2.4. ESS Scheduling Results and Analysis

The SoC of the ESS varies during the day, as shown in Figure 13.
Comparing Figure 13 with Figure 5, it can be seen that the ESS charges at low electricity prices and discharges at high electricity prices, which helps to reduce the system operation cost and verifies the rationality of the proposed optimal scheduling model.

5. Conclusions

The interconnection of AC–DSAs through flexible DC technology can effectively improve the operation of the DSAs and allow the establishment of a DC distribution network on the DC side to provide efficient access to DC loads, DGs, and ESSs, etc. This paper proposes an optimal scheduling model applicable to the flexible interconnected DSAs, which schedules the PVs, ESSs, and the power transmitted by the converters with the load rate balance between the DSAs, voltage deviation, and operation cost as the optimization objective. The results of the case study validate the effectiveness of the proposed model. More valuable is that the proposed model takes the control mode of the converter stations into account, which helps to further reduce the voltage deviation of the DC side. The simulation results prove that the proposed optimization model can reasonably decide the control mode of the converters, which can effectively improve the voltage profile in the DC distribution network without deteriorating the voltage profile on the AC side.
Future work will further consider the uncertainty of the load and DGs and take into account the interaction of EVs with the grid in the scheduling model.

Author Contributions

Methodology, X.T., L.Q., Z.Y. and S.Z.; writing—review and editing, X.T., L.Q., S.Z., X.H., H.M. and K.L.; validation, Z.Y., X.H., H.M. and K.L. All authors have read and agreed to the published version of the manuscript.

Funding

This research was funded by Major Science and Technology Project of State Grid Hubei Electric Power Co., Ltd.: Key Technology Research on Active Distribution Network Structure Optimization and Operation Coordination Adapted to Friendly Interaction of Microgrid Cluster. (Project No. 521532220008).

Institutional Review Board Statement

Not applicable.

Informed Consent Statement

Not applicable.

Data Availability Statement

Not applicable.

Conflicts of Interest

The authors declare no conflict of interest.

References

  1. Liu, W.; Lü, Z.; Liu, H. An overview of morphological development and operation control technology of power electronics dominated distribution area. Proc. CSEE, 2023; in press. [Google Scholar]
  2. Jiang, X.; Zhou, Y.; Ming, W.; Yang, P.; Wu, J. An overview of soft open points in electricity distribution networks. IEEE Trans. Smart Grid 2022, 13, 1899–1910. [Google Scholar] [CrossRef]
  3. Xu, Y.; Liu, H.; Xiong, X.; Ji, Y.; Shao, Y.; Zhang, H.; Sun, L.; Wu, M. Key technologies and development modes of flexible interconnection of low-voltage distribution station area. Proc. CSEE 2022, 42, 3986–4001. [Google Scholar]
  4. Cao, W.; Wu, J.; Jenkins, N.; Wang, C.; Green, T. Benefits analysis of soft open points for electrical distribution network operation. Appl. Energy 2016, 165, 36–47. [Google Scholar] [CrossRef]
  5. Flexible Urban Networks: Low Voltage Project Progress Report; UK Power Networks: London, UK, 2016.
  6. Huang, R.; Pu, T.; Liu, K.; Yang, Z.; Chen, N. Design of hierarchy and functions of regional energy internet and its demonstration applications. Autom. Electr. Power Syst. 2015, 39, 26–33. [Google Scholar]
  7. Huang, Z. Research on Operation and Control of Zhuhai Three Terminal Flexible DC Distribution Network. Master’s Thesis, South China University of Technology, Guangzhou, China, 20 April 2021. [Google Scholar]
  8. Yang, Z.C.; Yang, F.; Min, H.D.; Shen, Y.; Tang, X.; Hong, Y.; Qin, L. A local control strategy for voltage fluctuation suppression in a flexible interconnected distribution station area based on soft open point. Sustainability 2023, 15, 4424. [Google Scholar] [CrossRef]
  9. Li, P.; Ji, H.; Wang, C.; Zhao, J.; Song, G.; Ding, F.; Wu, J. Coordinated control method of voltage and reactive power for active distribution networks based on soft open point. IEEE Trans. Sustain. Energy 2017, 8, 1430–1442. [Google Scholar] [CrossRef]
  10. Li, P.; Ji, H.; Song, G.; Yao, M.; Wang, C.; Wu, J. A combined central and local voltage control strategy of soft open points in active distribution networks. Energy Procedia 2019, 158, 2524–2529. [Google Scholar] [CrossRef]
  11. Ji, H.; Yu, H.; Song, G.; Li, P.; Wang, C.; Wu, J. A decentralized voltage control strategy of soft open points in active distribution networks. Energy Procedia 2019, 159, 412–417. [Google Scholar] [CrossRef]
  12. Li, P.; Ji, H.; Yu, H.; Zhao, J.; Wang, C.; Song, G.; Wu, J. Combined decentralized and local voltage control strategy of soft open points in active distribution networks. Appl. Energy 2019, 241, 613–624. [Google Scholar] [CrossRef]
  13. Zhu, G.; Zhang, Y.; Ge, L.; Wang, L. Multi-timescale voltage optimization of flexible interconnected distribution network with self-energy storage. Autom. Electr. Power Syst. 2021, 45, 71–79. [Google Scholar]
  14. Lu, X.J.; Zhou, J.; Omer, S. Two-layer operation optimization of concentrated solar power with thermal energy storage system and soft open point. Int. J. Electr. Power Energy Syst. 2023, 146, 14. [Google Scholar] [CrossRef]
  15. Wang, J.; Zhou, N.C.; Wang, Q.G.; Liu, H.M. Hierarchically coordinated optimization of power distribution systems with soft open points and electric vehicles. Int. J. Electr. Power Energy Syst. 2023, 149, 11. [Google Scholar] [CrossRef]
  16. Bakir, H.; Guvenc, U.; Duman, S.; Kahraman, H.T. Optimal power flow for hybrid AC/DC electrical networks configured with VSC-MTDC transmission lines and renewable energy sources. IEEE Syst. J. 2023; in press. [Google Scholar]
  17. Li, Z.W.; Xie, X.L.; Cheng, Z.P.; Zhi, C.Y.; Si, J.K. A novel two-stage energy management of hybrid AC/DC microgrid considering frequency security constraints. Int. J. Electr. Power Energy Syst. 2023, 146, 12. [Google Scholar] [CrossRef]
  18. Su, Y.; Teh, J. Two-stage optimal dispatching of AC/DC hybrid active distribution systems considering network flexibility. J. Mod. Power Syst. Clean Energy 2023, 11, 52–65. [Google Scholar] [CrossRef]
  19. Yan, L.Q.; Zhao, Y.L.; Xue, T.L.; Ma, N.; Li, Z.W.; Yan, Z.T. Two-layer optimal operation of AC-DC hybrid microgrid considering carbon emissions trading in multiple scenarios. Sustainability 2022, 14, 10524. [Google Scholar] [CrossRef]
  20. Sciano, D.; Raza, A.; Salcedo, R.; Diaz-Aguilo, M.; Uosef, R.E.; Czarkowski, D.; de Leon, F. Evaluation of DC links on dense-load urban distribution networks. IEEE Trans. Power Deliv. 2016, 31, 1317–1326. [Google Scholar] [CrossRef]
  21. Eajal, A.A.; Shaaban, M.F.; Ponnambalam, K.; El-Saadany, E.F. Stochastic centralized dispatch scheme for AC/DC hybrid smart distribution systems. IEEE Trans. Sustain. Energy 2016, 7, 1046–1059. [Google Scholar] [CrossRef]
  22. Isuru, M.; Hotz, M.; Gooi, H.B.; Utschick, W. Network-constrained thermal unit commitment for hybrid AC/DC transmission grids under wind power uncertainty. Appl. Energy 2020, 258, 114031. [Google Scholar] [CrossRef]
  23. Dorostkar-Ghamsari, M.R.; Fotuhi-Firuzabad, M.; Lehtonen, M.; Safdarian, A. Value of distribution network reconfiguration in presence of renewable energy resources. IEEE Trans. Power Syst. 2016, 31, 1879–1888. [Google Scholar] [CrossRef]
  24. GB/T 15543—2008; Power Quality—Three-Phase Voltage Unbalance. General Administration of Quality Supervision, Inspection and Quarantine of the People’s Republic of China, Standardization Administration of the People’s Republic of China. Standards Press of China: Beijing, China, 2009.
  25. GB/T 35727—2017; Guideline for Standard Voltages of Medium and Low Voltage DC Distribution System. General Administration of Quality Supervision, Inspection and Quarantine of the People’s Republic of China, Standardization Administration of the People’s Republic of China. Standards Press of China: Beijing, China, 2017.
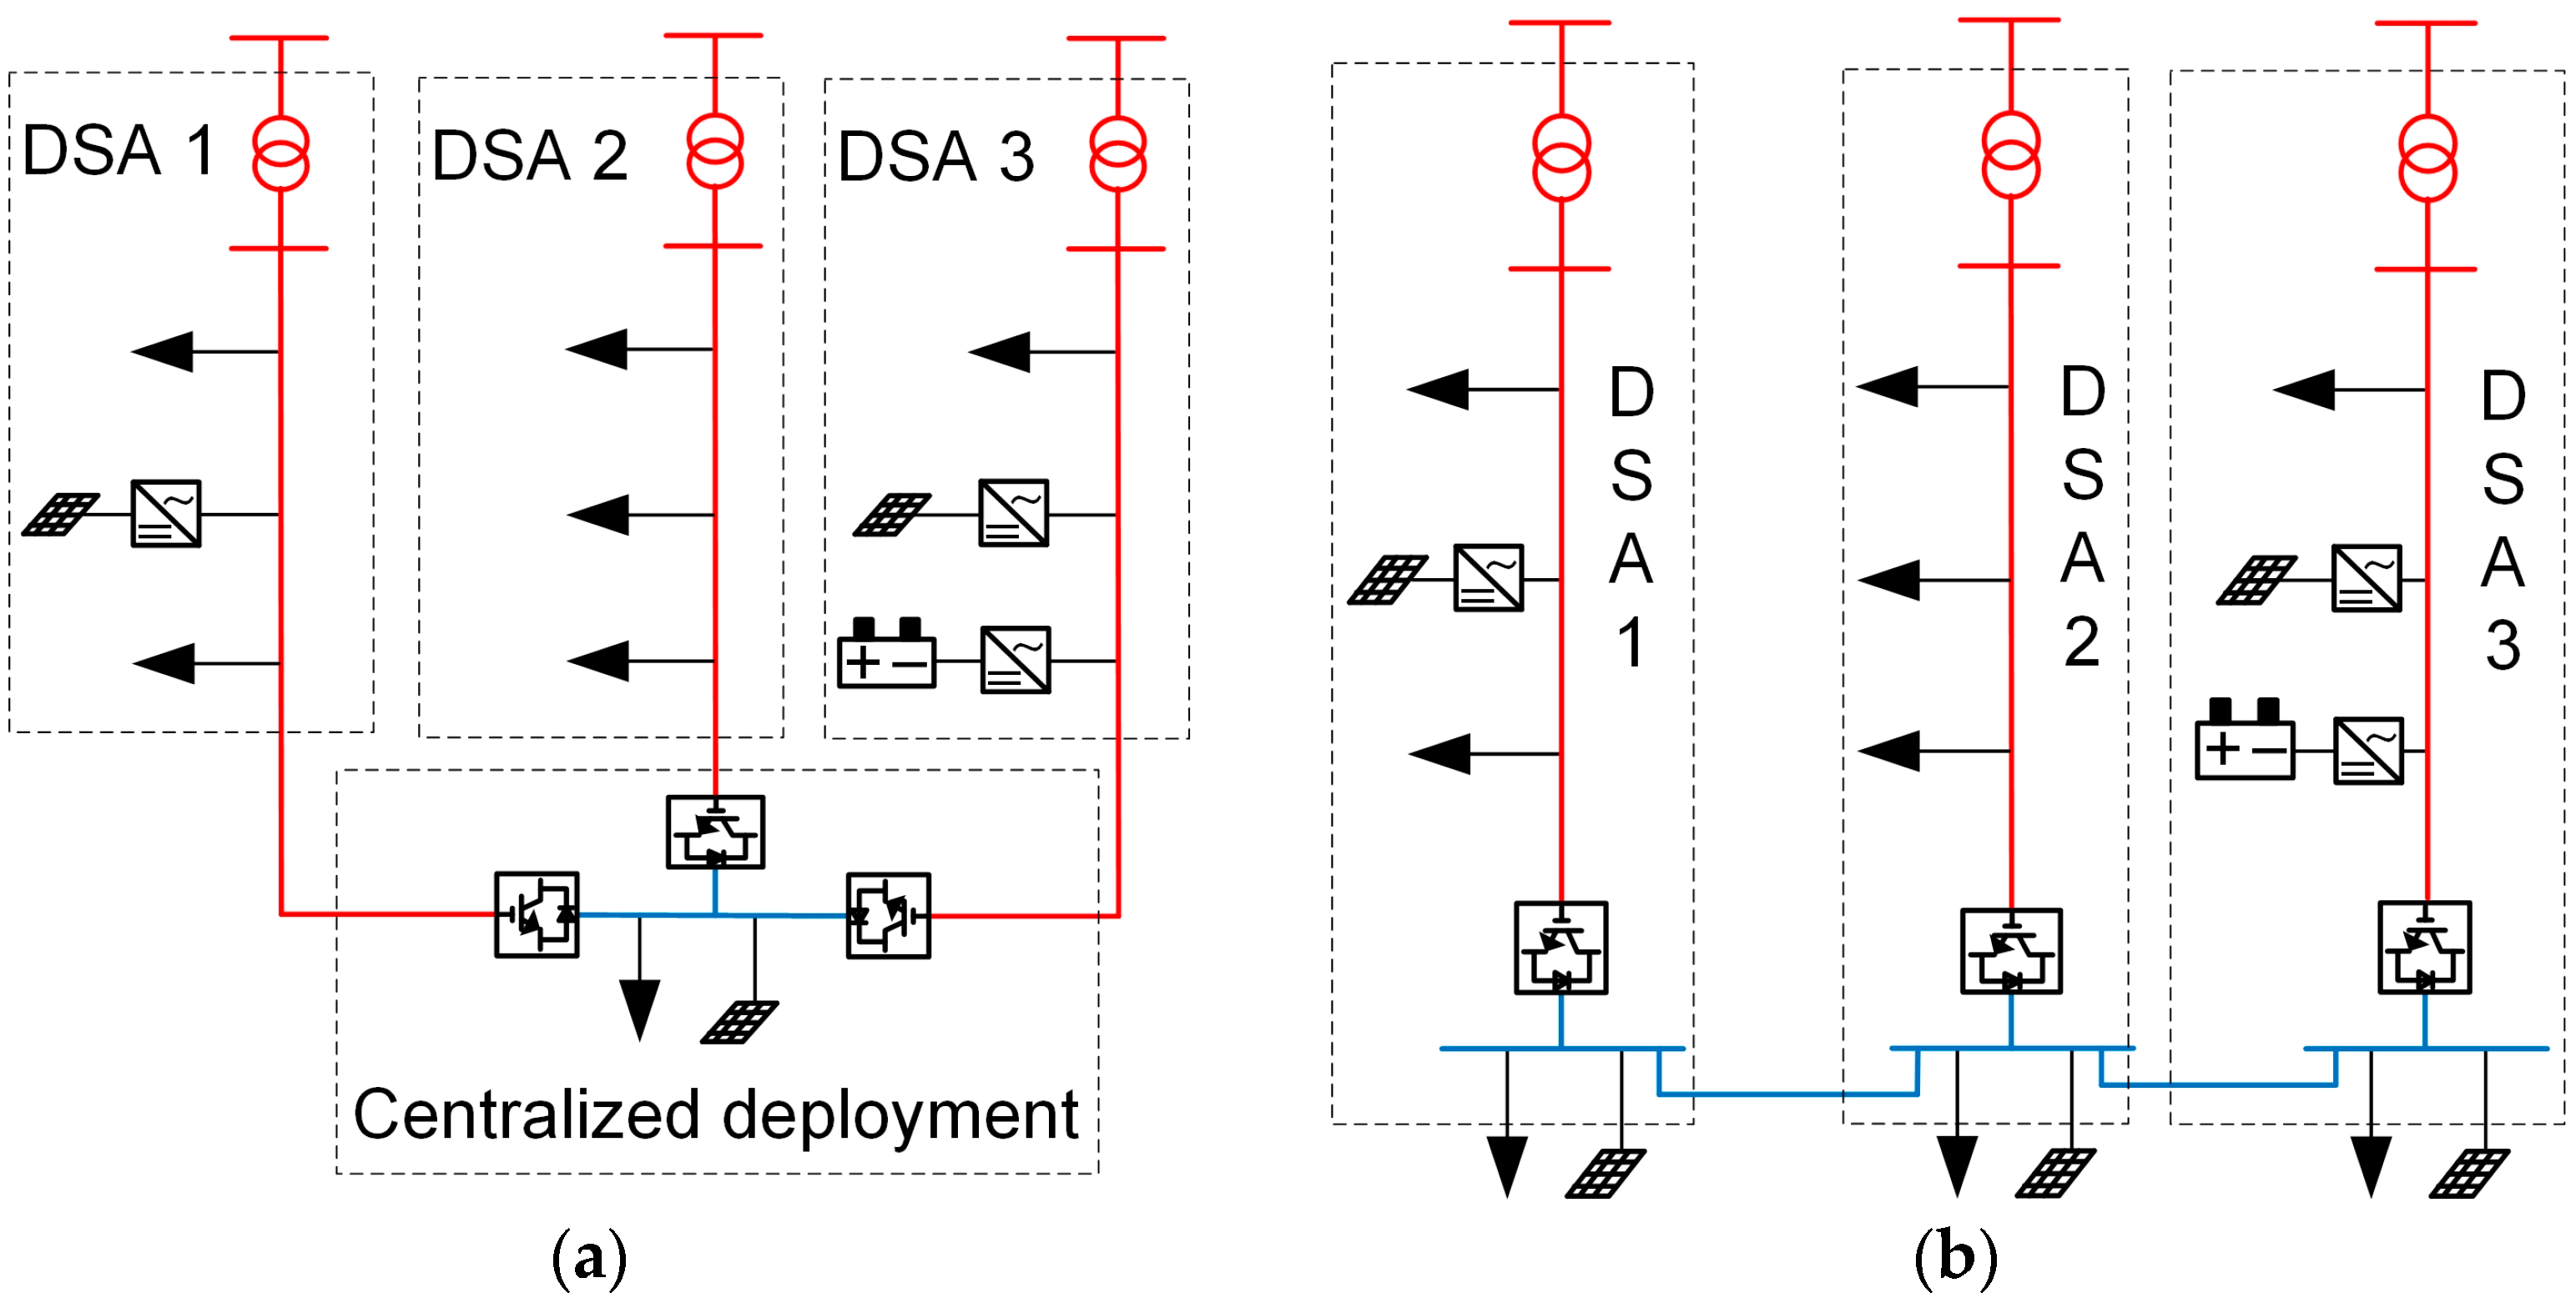
Figure 1. (a) Centralized structure; (b) decentralized structure.
Sustainability 15 08715 g001
Figure 2. Diagram of the example.
Sustainability 15 08715 g002
Figure 3. Equivalent circuit of the converter station.
Sustainability 15 08715 g003
Figure 4. Topology of the 24-node flexible interconnected DSA.
Sustainability 15 08715 g004
Figure 5. Power output normalization curve of PVs.
Sustainability 15 08715 g005
Figure 6. TOU electricity price.
Sustainability 15 08715 g006
Figure 7. Load rate of three DSAs before applying the optimal scheduling model.
Sustainability 15 08715 g007
Figure 8. The load rate of three DSAs and the active power transmitted by VSCs after flexible interconnection.
Sustainability 15 08715 g008
Figure 9. (a) Voltage profile in DSA1; (b) voltage profile in DSA2; (c) voltage profile in DSA3.
Sustainability 15 08715 g009
Figure 10. (a) Voltage profile in DSA1; (b) voltage profile in DSA2; (c) voltage profile in DSA3.
Sustainability 15 08715 g010
Figure 11. Voltage deviation average on the DC side.
Sustainability 15 08715 g011
Figure 12. (a) Voltage deviation average in DSA1; (b) voltage deviation average in DSA2; (c) voltage deviation average in DSA3.
Sustainability 15 08715 g012
Figure 13. The SoC of the ESS.
Sustainability 15 08715 g013
Table 1. Voltage deviation of each node.
Slack Bus No. U 1 U 2 U 3 Total
10 P R U N 3 P R U N 4 P R U N
2 P R U N 0 2 P R U N 3 P R U N
3 3 P R U N 2 P R U N 0 5 P R U N
Table 2. Scheme setting of the comparison experiments.
Scheme No.Control Mode
VSC1VSC2VSC3
1Udc-QP-QP-Q
2PQUdc-QP-Q
3P-QP-QUdc-Q
4Determined using proposed optimal scheduling model
Table 3. Control mode of each VSC in scheme 4.
VSC No.Control Mode 1
123456789101112131415161718192021222324
VSC1100100001101101100000100
VSC2000001110010010011111000
VSC3011010000000000000000011
1 “1” indicates that VSC is in Udc-Q control mode, “0” indicates that it is in the P-Q control mode.
Disclaimer/Publisher’s Note: The statements, opinions and data contained in all publications are solely those of the individual author(s) and contributor(s) and not of MDPI and/or the editor(s). MDPI and/or the editor(s) disclaim responsibility for any injury to people or property resulting from any ideas, methods, instructions or products referred to in the content.