
Research on the Influencing Factors and Decoupling State of Carbon Emissions in China’s Transportation Industry

1
School of Automobile, Chang’an University, Xi’an 710064, China
2
Institute of Transportation Development Strategy and Planning of Sichuan Province, Chengdu 610001, China
*
Author to whom correspondence should be addressed.
Sustainability 2023, 15(15), 11871; https://doi.org/10.3390/su151511871
Submission received: 5 July 2023
/
Revised: 25 July 2023
/
Accepted: 29 July 2023
/
Published: 2 August 2023
(This article belongs to the Special Issue Towards World with Low-Carbon Development: The Conversion and Storage of Clean Energy and Sustainable Development)
Abstract
:To help achieve the dual-carbon target, based on the LMDI model and C-D production function, this study decomposed the influencing factors of CO2 emissions in China’s transportation industry from 2000 to 2020, then combined the Tapio model to explore the decoupling state. The results showed that (1) from 2000 to 2020, CO2 emissions increased from 263.88 million tons to 957.59 million tons in China’s transportation industry. (2) The transportation intensity effect was the most significant factor to curb the growth in carbon emissions, and the total carbon emissions were reduced by about 364.84 million tons. The capital input effect was the primary factor promoting the carbon emissions, increasing the total carbon emissions by about 899.78 million tons. The effect of energy structure is the factor with the most potential to restrain the increase in carbon emissions in the future. (3) The decoupling state of the transportation industry mainly consists of expansive coupling and weak decoupling. Especially after 2010, the decoupling state remained a weak decoupling and continued to improve. The results can provide lessons for the establishment of policies in China’s transportation industry.
1. Introduction
Since the industrial revolution, mankind has used fossil fuels extensively in the processes of industrialization and urbanization, resulting in a continuous increase in greenhouse gas emissions; climate change may become the greatest challenge ever faced by mankind [1]. Global CO2 emissions rebounded from the decline caused by COVID-19 to about 34 Gt in 2020, with CO2 emissions from the transportation industry exceeded 7 Gt [2]. The transportation industry has become one of the most popular industries in energy consumption and greenhouse gas emissions. To actively address the climate challenge, China has made it clear that it aims to reach peak carbon emissions by 2030 and achieve carbon neutrality by 2060 [3]. China’s transportation industry emitted about 930 million tons of carbon, making it the third-largest source of carbon emissions [4,5], and as the population and economy grow, it will increase transportation activities and infrastructure [6,7]. The carbon emissions of the transportation industry in 2019 measured by the International Energy Agency (IEA) are shown in Table 1.
Compared to other countries, carbon emissions from China’s transport industry account for a small proportion of the country’s total carbon emissions, but the growth rate is fast. Considering the development path of the transportation industry in developed countries, there is little doubt that the road transport sector will become dominant in China’s emissions inventory in the near future [8]. Therefore, it is necessary to study the influencing factors and identify the decoupling state in China’s transportation industry, which can provide guidance for the formulation of laws and regulations and help realize low-carbon transportation. The research framework of this paper is shown in Figure 1.
2. Literature Review
There are two main areas of research on carbon dioxide emissions: (1) discovering the influencing factors of carbon emissions and (2) identifying the decoupling state of carbon emissions. For specific research problems, scholars have adopted different research methods.
At present, academic research on CO2 emissions in the transportation industry has achieved certain results. Among the studies, there are three main methods for decomposing the factors influencing carbon emissions: the LMDI (logarithmic mean Divisia index) model [9], the STIRPAT (stochastic impacts by regression on population, affluence, and technology) model [10], and an econometric model based on panel data [11,12]. In most studies, economic development was considered to be the main driving force for carbon emissions and a more stable dominant factor in the decomposition results [13,14,15]. Zhu et al. used the LMDI model and found that economic development and population growth promoted CO2 emissions, while the reduction in energy intensity and optimization of energy structure suppressed CO2 emissions [16]. Moreover, Li analyzed the influencing factors of carbon emissions in China’s three major economic circles and suggested that the three regions should control the growth in transportation demand and adjust the transportation structure, but different regions should have different priorities [17]. The development of public transportation is important for low-carbon development. China should strengthen joint government and market regulation to promote low-carbon development [18]. Liu et al. decomposed the driving factors of CO2 emission and concluded that there will be no major changes in energy intensity in a short time. China should promote the electrification of cars and trains and promote low-carbon transition in key industries [19]. Furthermore, Sun et al. used the partial least squares method and STIRPAT model to quantify the contribution of different factors and pointed out that in addition to population growth and economic development, the growth in passenger and freight turnover also promoted carbon emissions [20]. In addition, Lin et al., by means of quantile regression analysis, found that the main means of achieving carbon emission reductions are to reduce carbon intensity and improve energy consumption structure [21]. Among the above research methods, the LMDI model has been favored to study the influencing factors because of its ability to decompose and quantify the influencing factors while solving the residual error and zero value problems [5,22]. In addition, in previous studies, the decomposition of influencing factors is usually limited to macroeconomic factors such as energy intensity, economic development, etc., and there is less research in the area of carbon emission concentration, and the traditional factor decomposition is unable to analyze the level of technology, capital input and so on [23].
The decoupling theory was first used to characterize the relationship between economic development and environmental pressure. After the elastic coefficient was introduced by Tapio, the decoupling state was subdivided, which has become the main method to study the decoupling state [24]. By analyzing the change in the decoupling state, the effectiveness of current emission-reduction policies can be evaluated. Wang et al. studied the decoupling state and found that China’s decoupling elasticity has shown a declining trend since 2000, dominated by expansive negative decoupling and weak decoupling [25]. According to the study of Xie et al., government intervention is the main influence on the decoupling state over a short period, and the increase in the share of green power plays a major role in promoting decoupling over a long period [26]. Pan et al. conducted an analysis based on the targets set by the Paris Agreement, and the results showed that the improvement in energy carbon emission intensity was the main cause of carbon emission mitigation in China’s transportation industry, followed by the reduction in transport activities [27]. Zhu pointed out that carbon emissions are out of step with economic development, and different factors have different impacts on carbon emissions in different cities [28]. According to Liu et al., China needs to change the imbalanced transportation structure, unreasonable energy consumption structure and low-energy efficiency to accelerate the decoupling process [29]. Previous studies mainly discussed the decoupling relationship between economic growth and carbon emissions at the national level, but the decoupling state of China’s transportation industry has not been clear. Fewer studies have combined a decoupling analysis with the decomposition of impact factors to jointly explore the impact of transportation industry influences on the decoupling state.
In short, the progress of urbanization in China will further stimulate transportation demand, resulting in a large consumption of fossil energy [30]. With this in mind, it is necessary to research the present status and trends of carbon emissions in the transportation industry and explore its development rules and trends for developing emission-reduction strategies. Based on the calculation of CO2 emissions, the C-D production function was introduced into the LMDI model to deeply explore the influence of industry factors in the transportation industry on the changes in CO2 emissions. This study focuses on the decoupling state and the influencing factors in the transportation industry. The purpose is to accurately understand the decoupling state and to provide a scientific reference for China’s energy policy formulation. The research contents are arranged as follows: Section 3 introduces the methods and data sources; Section 4 presents the results and discussion; Section 5 analyzes and discusses the research results of this study and Section 6 summarizes the main findings and makes relevant recommendations.
3. Materials and Methods
3.1. CO2 Emission Measurement
There are two calculation methods for CO2 emissions. One is to refer to carbon emissions calculations from the IPCC (Intergovernmental Panel on Climate Change), based on energy consumption data, which are easily available [31]. The other is to calculate CO2 emissions by taking all the kinds of transportation as the main energy consumption, but the data are hard to obtain and the quality is difficult to ensure [32,33]. This study uses the first method, as shown in Equation (1):
where C1 is the CO2 emissions from fossil energy consumption; i is the type of energy; Ei is the i-th energy consumption; AVLi is the average low calorific value of i-th energy; vi is the carbon content per unit calorific value of i-th energy and ri is the carbon oxidation rate of i-th energy.
What is different in this study from previous studies is the consideration of carbon emissions generated by electricity. Carbon emissions from electricity mainly come from thermal power. CO2 emissions estimated by electricity consumed can be expressed as
where C2 is the CO2 emissions from electricity consumption; Ee is the electricity consumption; Ef is the electricity carbon emission factor and K is the share of thermal power generation in total electricity production. Therefore, the total CO2 emissions of China’s transportation industry can be expressed as
3.2. Decomposition Model of CO2 Emission Influencing Factors
3.2.1. C-D Production Function
In economics, the C-D (Cobb–Douglas) production function describes how to convert capital input and labor input into GDP, as shown in Equation (4) [25]:
where GDPt stands for the GDP of the transportation industry in year t; At stands for the level of technology in year t; Kt stands for the capital input in year t; Lt stands for the labor input in year t and α and β are the elasticity coefficients.
3.2.2. LMDI Model Based on the C-D Production Function
After measuring the CO2 emissions of the transportation industry, the decomposition model of influencing factors is obtained by extending Kaya [34,35]. Specifically, the decomposition model of the total CO2 emissions in year t is shown in the following equation:
In order to identify more factors influencing the CO2 emissions in China’s transportation industry, the LMDI model based on the C-D production function was used for decomposition, as shown in the following equation:
where Ct stands for the total carbon emissions in year t; i is the type of energy; is the carbon emissions of i-th energy in year t; is the consumption of the i-th energy in year t; is the total energy consumption in year t; is the transport turnover in year t and is the GDP in year t.
The meanings of all the kinds of influencing factors are as follows:
- represents the carbon emission intensity of the i-th energy in year t.
- represents the proportion of the i-th energy consumption in year t.
- represents the unit consumption level of transportation (energy consumption per unit of turnover).
- represents transportation intensity.
- At represents the level of technology in year t, Kt represents the capital input in year t and Lt represents the labor input in year t, respectively.
According to the addition decomposition of the LMDI model, the overall change effect is expressed by , which is decomposed into the energy emission intensity effect , energy structure effect , unit consumption level effect , transportation intensity effect , capital input effect , technology level effect and labor input effect . This study assumes that the carbon emission coefficients of each energy source remain constant in different years, so , and Ct and C0 are the CO2 emissions in the target and base years, respectively, as shown in Equation (7):
where
3.3. Decoupling Model for CO2 Emissions
In 2002, OECD (Organization for Economic Cooperation and Development) proposed the decoupling theory. The Tapio model reflects the decoupling relationship between variables with the elastic analysis method, which effectively overcomes the difficulty in selecting the base year of the OECD index model [36,37]. In this paper, the decoupling state between carbon emissions and economic development is calculated according to the Tapio model. The expression of decoupling elasticity is shown in the following equation:
where is the decoupling elasticity index in year t; and are the carbon emissions in year t and the base year, respectively, and and are the transportation GDP in year t and the base year, respectively.
Specifically, the Tapio decoupling model can be divided into three types and further subdivided into eight decoupling states, improving the decoupling evaluation system, as shown in Table 2.
In order to determine all the factors’ contributions to the state of decoupling, the value of the contribution of each influencing factor to the change in the decoupling elasticity index is explored in the Equation (11):
where , and represent the effects of energy structure, unit consumption level, transport intensity, technology level, capital input and labor input on the change in the decoupling state, respectively.
3.4. Data Source
This study analyzed the change in CO2 emissions during 2000–2020. All the kinds of energy consumption data, passenger transport turnover data, freight turnover data and labor input data are from the National Bureau of Statistics of China, and the data on capital input are obtained from the Statistical Bulletin on the Development of the Transportation Industry (2000–2020) of the Ministry of Transport of China and epsnet.com.cn. The average low-level heating value, carbon content, and carbon oxidation rate of each energy were obtained from the Guide for the Preparation of Provincial Greenhouse Gas Inventories (Trial) (2011), and the emission factors for electricity were obtained from the Baseline Emission Factors for China’s Electricity Grids. In calculating the total transportation turnover of the transportation industry, statistics are made according to five modes of transport, specifically divided into road transport, water transport, railway transport, air transport and pipeline transport. Among them, pipeline transport does not involve passenger transport, so only the freight turnover of pipeline transport is counted, and the passenger turnover of the other four modes of transport is uniformly measured as tons/km by the conversion coefficient.
4. Results
4.1. Results of CO2 Emission Changes
Figure 2 describes the trends of CO2 emissions, CO2 emission growth rate, and GDP growth rate in China’s transportation industry. From 2000 to 2019, China’s transport GDP and CO2 emissions maintained a steady growth, and the trends of both changes were similar. This is because the rapid development of the industrial economy is accompanied by a large amount of fossil fuel consumption, resulting in a large amount of greenhouse gas emissions, which is consistent with previous research [38,39]. In 2019–2020, due to the impact of COVID-19, China’s transportation activities were greatly weakened, so the industry’s GDP and CO2 emissions decreased.
In 2000, the GDP of China’s transportation industry was about CNY 616.19 billion, and CO2 emissions were about 26,000 tons. In 2019, the industry’s GDP was about CNY 4246.63 billion, and CO2 emissions exceeded 1 billion tons. During the study period, coal consumption has been significantly reduced, while diesel and gasoline, the main energy sources for transportation, continued to grow, but the growth trend has gradually slowed down, and carbon emissions from natural gas and electricity have shown an upward trend.
4.2. Decomposition Results of Influencing Factors
A decomposition model combining the C-D production function and the LMDI model was used to decompose the CO2 emissions from China’s transportation industry during 2000–2020. The year-by-year effects of energy structure, unit consumption level, transportation intensity, technology level and labor, and capital input were calculated, respectively, and then the cumulative effects were derived, and the different influencing factors were analyzed. The results are shown in Table 3. Overall, CO2 emissions from China’s transport industry maintained a growing trend during 2000–2020, with a cumulative effect of about 693.7 million tons. Combined with Table 3 and Figure 3, the specific analysis is as follows:
(1) From 2000 to 2020, the energy structure effect had little influence on the change in CO2 emissions. This is because during the study period, the energy consumption structure of China’s transportation industry was not optimized, and the proportion of fossil energy consumption first increased and then decreased, which will be about 74.6% in 2020. Clean energy and new energy are growing slowly and account for a small proportion of energy consumption. The inhibition effect of energy structure on CO2 emissions has not been fully exploited.
(2) The unit consumption level refers to the energy consumption per unit of transportation turnover, which can represent the energy consumption efficiency of the transportation industry to a certain extent [29]. From 2000 to 2020, the unit consumption level effect inhibited CO2 emission increase, and the negative cumulative effect was about −93 million tons. Accelerating the spread of clean energy in road transport and the electrification of rail transport can promote an improvement in energy consumption structure.
(3) Transport intensity can somewhat reflect the correlation of economic development on transport activities. The higher the intensity of transportation, the more energy consumption and CO2 emissions. From 2000 to 2020, the transport intensity effect inhibited the increase in CO2 emissions, and the negative cumulative effect was about 365 million tons, which was the most important factor to inhibit carbon emissions.
(4) The technology level effect and capital and labor input effects had a positive impact on the increase in CO2 emissions, with cumulative effects of 114.63 million tons, 899.78 million tons and 84.34 million tons, respectively. Among them, in 2008–2009 and 2019–2020, capital input increased significantly, labor input changed little, but the output did not increase significantly or even decreased, leading to a reduction in technical level. In general, capital input leads to an expansion of industry scale, and it is still the first driving factor for CO2 emission increase, while labor input changes have little impact on the transportation industry.
4.3. Results of the Decoupling Effect Analysis
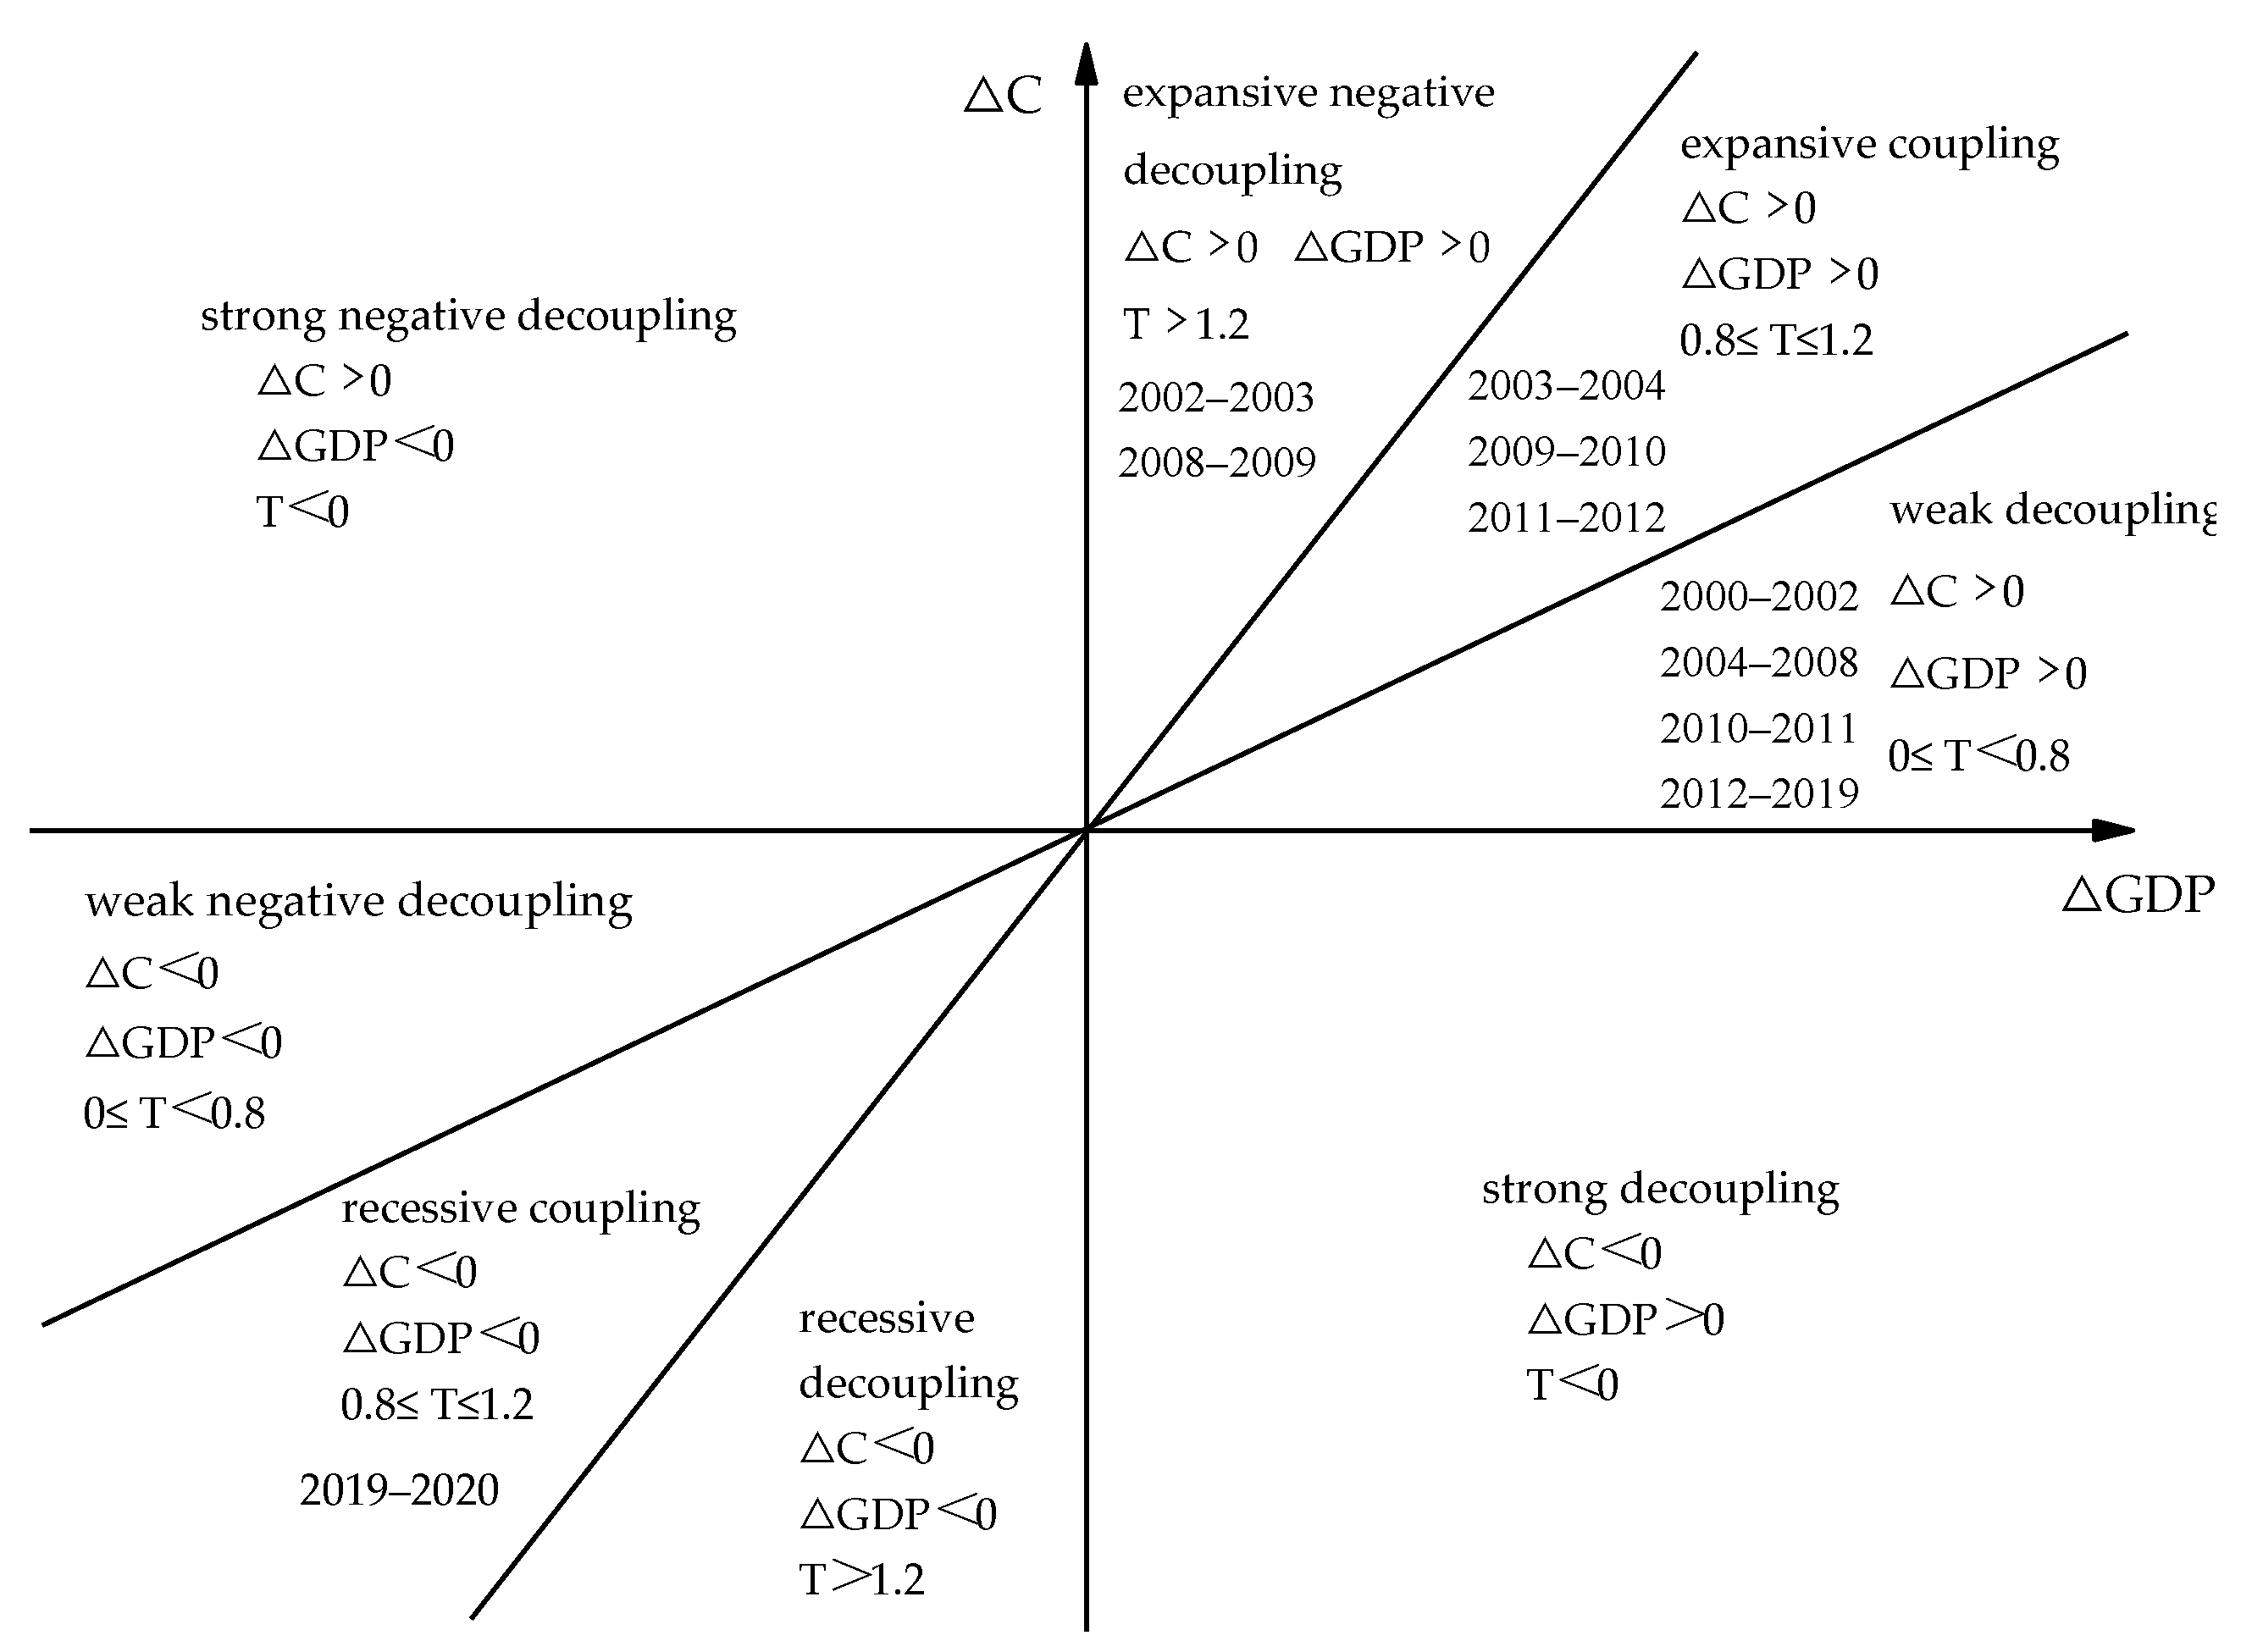
Based on the decomposition of the influencing factors of CO2 emissions, this paper analyzed the decoupling state year by year by combining the Tapio decoupling model. Except for 2019–2020, carbon emissions and the economy grew. In 2002–2003 and 2008–2009, the economy grew, but carbon emissions rose even more, resulting in the decoupling state of expansion and negative decoupling in these two years.
Table 4 shows the contribution of different influencing factors to the decoupling index, where t1 indicates the contribution of energy structure to the decoupling index, and its value hovers around 0, indicating that the change in energy structure during the study period did not make a significant contribution to decoupling; t2 and t3 represent the contributions of transport intensity and unit consumption levels to the decoupling index, respectively, which are mainly negative values, indicating that the reduction in unit consumption levels and the weakening of transport intensity promoted decoupling, and t4, t5 and t6 represent the contributions of technology level, capital input and labor input, respectively, to the decoupling index, which mainly show positive values, indicating that the change in technology level, the increase in capital input and the increase in labor input during the study period inhibited decoupling.
The decoupling state of 2000–2020 was classified, and the results are shown in Figure 4. In the research interval, the decoupling state of 2019–2020 is shown as a recessive coupling because transportation activity in China in 2020 was significantly reduced due to COVID-19, and the industry GDP decreased less than the carbon emission reduction rate. On the whole, there are three decoupling states between China’s transportation industry and economic development: expansive negative decoupling, expansive coupling and weak decoupling. Weak decoupling occurred in most years, indicating that China’s economic development has maintained a positive growth rate since 2000, and it is growing faster than carbon emissions. Especially since 2010, with the vigorous development of energy conservation, emission reduction and clean energy, China’s economy has shifted from high-speed development to high-quality development. The decoupling index is in a stable declining stage, and the decoupling state has been improved, but carbon emissions are still at a growing stage in the short term, and China’s economic development and the carbon emissions of the transportation industry have not been decoupled.
5. Discussion
As one of the major industries of energy consumption and carbon emissions in China, transportation has an important impact on the achievement of the dual-carbon target. By analyzing the influencing factors and decoupling state of carbon emissions from China’s transport industry, this study mainly draws the following conclusions:
(1) Since 2000, transportation GDP and CO2 emissions have continued to grow [40]. The proportion of fossil energy consumption, mainly gasoline and diesel, has been maintained at more than 70%. The consumption of natural gas and electricity has grown, but at a slower rate. The economic output of the transportation industry is still dependent on fossil fuels.
(2) The suppression effect of the energy structure effect on carbon emissions is not fully exploited [40]. The unit consumption level effect and transportation intensity effect suppress the increase in carbon emissions, and the labor input effect, technology level effect and capital input effect promote carbon emissions. Among them, energy structure is the factor with the most potential to restrain the increase in carbon emissions in the future [41], and capital input is still the first driver of CO2 emission growth in China’s transportation industry.
(3) There are three decoupling states between China’s transportation industry and economic development: expansive negative decoupling, expansive coupling and weak decoupling. Especially since 2010, the state of decoupling has mainly been weak decoupling, indicating that the growth rate of economic development is faster than that of carbon emissions [42]. In the short term, transportation carbon emissions still maintain growth [43], and economic development and transportation carbon emissions have not yet decoupled.
(4) At present, when measuring carbon emissions, it is mainly based on the greenhouse gas accounting method proposed by the IPCC [44,45]. China does not consider the energy consumption of non-operational vehicles in the energy consumption data statistics. Therefore, there are some discrepancies between the data and the actual results of the studies on carbon emissions in the transportation industry.
6. Conclusions and Suggestions
China’s sustainable development requires the development of a low-carbon path. As a major industry of national economy and energy consumption, carbon emission reduction in the transportation industry is crucial for China to achieve green development. We summarize the research results of this paper and put forward policy suggestions as follows.
6.1. Conclusions
(1) Carbon emissions from China’s transportation industry still maintain an increasing trend [5,6], which is consistent with previous studies. Population and economic development have promoted the increase in transportation demand [46], the advancement of urbanization and the effective integration of industrialization and information technology and further stimulated the construction of China’s transportation infrastructure, which has caused a large amount of fossil fuel consumption, and the transportation industry has become a high-energy-consumption industry [12].
(2) The innovation of this paper is that it overcomes the limitation that influencing factors only focus on macroeconomic factors, increases the expansion of factors such as technology level and labor input and combines the decomposition of influencing factors with decoupling state analysis to build a complete framework for carbon emission research based on historical energy consumption data.
(3) It is worth noting that the inhibition effect of energy structure on carbon emissions is not significant, mainly because the energy consumption structure of China’s transportation industry is still dominated by fossil fuels [41], so energy consumption structure is expected to become the factor with the most potential to inhibit the growth of carbon emissions in the future.
(4) On the basis of the historical-verification research on the carbon emissions of the transportation industry, the peak time and peak level of the transportation industry can be predicted by referring to national and industry planning and the change trend of various influencing factors, so as to provide an effective reference for policy formulation, which will be the content of subsequent research.
6.2. Suggestions
(1) Accelerate the establishment of greenhouse gas accounting methods applicable to China’s transportation industry, explore methods for collecting data from non-operating vehicles, strengthen the construction of energy consumption data platforms and encourage transport departments and logistics enterprises to carry out data statistics and sharing, which will promote the efficient development of the basic work on carbon emissions in the transportation industry and contribute to the research of scholars.
(2) Further optimize the energy consumption structure of the transportation industry and give full play to the energy structure effect on carbon emission suppression. The government should encourage people to choose clean and green modes of travel, promote the cheap and rapid development of public transportation and change people’s travel patterns by adjusting transportation travel costs [47] and through vehicle purchase tax, fuel surtax and other policies to improve people’s choice of new-energy vehicles [48]. These measures will not only promote the transformation of the energy consumption structure but also help the development of the new-energy automobile industry.
(3) Road transport is the largest source of carbon emissions in China’s transportation industry [49,50]. Future research should pay more attention to the effects of different transport modes on transport decarbonization [51]. China must accelerate the construction of a safe, convenient and green modern integrated transportation system, vigorously promote the level of the development of multimodal transport, by changing road transport to waterway transport or railway transport modes, adjust the structure of transport, reduce the proportion of road transport in the transport structure, accelerate the construction of railroad electrification, improve the efficiency of integrated transport and promote the accelerated realization of a country with a strong transportation network, helping the country meet its carbon reduction commitments.
Author Contributions
Conceptualization, X.-Y.L. and T.C.; methodology, X.-Y.L. and T.C.; software, T.C. and B.C.; validation, X.-Y.L. and T.C.; formal analysis, X.-Y.L. and T.C.; resources, T.C. and B.C.; data curation, X.-Y.L. and T.C.; writing—original draft preparation, X.-Y.L. and T.C.; writing—review and editing, T.C. and B.C.; visualization, X.-Y.L. and T.C.; supervision, T.C. and B.C.; project administration, T.C. and B.C. All authors have read and agreed to the published version of the manuscript.
Funding
This research was funded by the National Natural Science Foundation of China, grant number 51978075, and the Science and Technology Program of Sichuan, China, grant number 2022YFG0132.
Institutional Review Board Statement
Not applicable.
Informed Consent Statement
Not applicable.
Data Availability Statement
The data presented in this study are openly available at http://www.stats.gov.cn/ (accessed on 28 July 2023).
Conflicts of Interest
The authors declare no conflict of interest.
References
- Net Zero by 2050—A Roadmap for the Global Energy Sector. Available online: iea.blob.core.windows.net/assets/deebef5d-0c34-4539-9d0c-10b13d840027/NetZeroby2050-ARoadmapfortheGlobalEnergySector_CORR.pdf (accessed on 22 March 2023).
- Birol, D.F. World Energy Outlook 2022. Available online: iea.blob.core.windows.net/assets/830fe099-5530-48f2-a7c1-11f35d510983/WorldEnergyOutlook2022.pdf (accessed on 22 March 2023).
- Progress on the Implementation of China’s Nationally Determined Contributions. 2022. Available online: https://unfccc.int/sites/default/files/NDC/2022-11/Progress%20of%20China%20NDC%202022.pdf (accessed on 22 March 2023).
- Xu, H.C.; Li, Y.L.; Zheng, Y.J.; Xu, X.B. Analysis of spatial associations in the energy-carbon emission efficiency of the transportation industry and its influencing factors: Evidence from China. Environ. Impact Assess. Rev. 2022, 97, 106905. [Google Scholar]
- Li, R.R.; Li, L.J.; Wang, Q. The impact of energy efficiency on carbon emissions: Evidence from the transportation sector in Chinese 30 provinces. Sust. Cities Soc. 2022, 82, 103880. [Google Scholar]
- Vivien, F.R.; Céline, G. Transportation infrastructures in a low carbon world: An evaluation of investment needs and their determinants. Transport. Res. Part D Transport Environ. 2019, 17, 203–219. [Google Scholar]
- Dong, F.; Hua, Y.F.; Yu, B.L. Peak Carbon Emissions in China: Status, Key Factors and Countermeasures—A Literature Review. Sustainability 2018, 10, 2895. [Google Scholar]
- Wang, C.; Cai, W.J.; Lu, X.D.; Chen, J.N. CO2 mitigation scenarios in China’s road transport sector. Energy Conv. Manag. 2007, 48, 2110–2118. [Google Scholar] [CrossRef]
- Zhu, C.Z.; Wang, M.; Yang, Y.R. Analysis of the Influencing Factors of Regional Carbon Emissions in the Chinese Transportation Industry. Energies 2020, 13, 1100. [Google Scholar]
- Su, K.; Lee, C.M. When will China achieve its carbon emission peak? A scenario analysis based on optimal control and the STIRPAT model. Ecol. Indic. 2020, 112, 106138. [Google Scholar]
- Mi, Z.F.; Wei, Y.M.; Wang, B.; Meng, J.; Liu, Z.; Shan, Y.L.; Liu, J.R.; Guan, D.B. Socioeconomic impact assessment of China’s CO2 emissions peak prior to 2030. J. Clean. Prod. 2017, 142, 2227–2236. [Google Scholar]
- Xu, X.B.; Xu, H.C. The Driving Factors of Carbon Emissions in China’s Transportation Sector: A Spatial Analysis. Front. Energy Res. 2021, 9, 664046. [Google Scholar]
- Ma, X.J.; Fan, Y.J.; Shi, F.; Song, Y.Q.; He, Y. Research on the relation of Economy-Energy-Emission (3E) system: Evidence from heterogeneous energy in China. Environ. Sci. Pollut. Res. 2022, 29, 62592–62610. [Google Scholar]
- Guo, M.Y.; Meng, J. Exploring the driving factors of carbon dioxide emission from transport sector in Beijing-Tianjin-Hebei region. J. Clean. Prod. 2019, 226, 692–705. [Google Scholar]
- Wang, S.J.; Liu, X.P.; Zhou, C.S.; Hu, J.C.; Ou, J.P. Examining the impacts of socioeconomic factors, urban form, and transportation networks on CO2 emissions in China’s megacities. Appl. Energy 2017, 185, 189–200. [Google Scholar]
- Zhu, C.Z.; Yang, S.; Liu, P.B. Study on the Factors Influencing on the Carbon Emissions of Shaanxi Province’s Transportation Industry in China. Sustainability 2022, 14, 8610. [Google Scholar]
- Li, L. Structure and influencing factors of CO2 emissions from transport sector in three major metropolitan regions of China: Estimation and decomposition. Transportation 2019, 46, 1245–1269. [Google Scholar] [CrossRef]
- Jing, Q.L.; Liu, H.Z.; Yu, W.Q.; He, X. The impact of public transportation on carbon emissions—From the perspective of energy consumption. Sustainability 2022, 14, 6248. [Google Scholar] [CrossRef]
- Liu, Q.; Gu, A.L.; Teng, F.; Song, R.P.; Chen, Y. Peaking China’s CO2 Emissions: T rends to 2030 and Mitigation Potential. Energies 2017, 10, 209. [Google Scholar] [CrossRef]
- Sun, H.P.; Hu, L.X.; Geng, Y.; Yang, G.C. Uncovering impact factors of carbon emissions from transportation sector: Evidence from China’s Yangtze River Delta Area. Mitig. Adapt. Strateg. Glob. Chang. 2020, 25, 1423–1437. [Google Scholar] [CrossRef]
- Lin, B.Q.; Nelson, I.B. Influencing factors on carbon emissions in China transport industry. A new evidence from quantile regression analysis. J. Clean. Prod. 2017, 150, 175–187. [Google Scholar]
- Yu, Y.; Dai, Y.Q.; Xu, L.Y.; Zheng, H.Z.; Wu, W.H.; Chen, L. A multi-level characteristic analysis of urban agglomeration energy-related carbon emission: A case study of the Pearl River Delta. Energy 2023, 263, 125651. [Google Scholar] [CrossRef]
- Du, K.R.; Xie, C.P.; Ouyang, X.L. A comparison of carbon dioxide (CO2) emission trends among provinces in China. Renew. Sustain. Energ. Rev. 2017, 73, 19–25. [Google Scholar]
- Petri, T. Towards a theory of decoupling: Degrees of decoupling in the EU and the case of road traffic in Finland between 1970 and 2001. Transp. Policy 2005, 12, 137–151. [Google Scholar]
- Wang, Q.; Jiang, R. Is China’s economic growth decoupled from carbon emissions? J. Clean. Prod. 2019, 225, 1194–1208. [Google Scholar]
- Xie, P.J.; Gong, N.Y.; Sun, F.H.; Li, P.; Pan, X.Y. What factors contribute to the extent of decoupling economic growth and energy carbon emissions in China? Energy Policy 2023, 173, 113416. [Google Scholar]
- Pan, X.Z.; Wang, H.L.; Wang, L.N.; Chen, W.Y. Decarbonization of China’s transportation sector: In light of national mitigation toward the Paris Agreement goals. Energy 2018, 155, 853–864. [Google Scholar]
- Zhu, X.P.; Li, R.R. An analysis of decoupling and influencing factors of carbon emissions from the transportation sector in the Beijing-Tianjin-Hebei area, China. Sustainability 2017, 9, 722. [Google Scholar]
- Liu, M.Z.; Zhang, X.X.; Zhang, M.Y.; Feng, Y.Q.; Liu, Y.J.; Wen, J.X.; Liu, L.Y. Influencing factors of carbon emissions in transportation industry based on C–D function and LMDI decomposition model: China as an example. Environ. Impact Assess. Rev. 2021, 90, 106623. [Google Scholar]
- Lu, Q.Y.; Chai, J.; Wang, S.Y.; Zhang, Z.G.; Sun, X.J.C. Potential energy conservation and CO2 emissions reduction related to China’s road transportation. J. Clean. Prod. 2020, 245, 118892. [Google Scholar]
- Lin, D.T.; Zhang, L.Y.; Chen, C.; Lin, Y.Y.; Wang, J.K.; Qiu, R.Z.; Hu, X.S. Clean Technologies and Environmental Policy. Clean Technol. Environ. Policy 2019, 21, 1307–1322. [Google Scholar]
- Cai, J.; Ma, S.Y.; Ji, H.M.; Jiang, W.Y.; Bai, Z.R. Spatial–temporal characteristics and decoupling effects of China’s transportation CO2 emissions. Environ. Sci. Pollut. Res. 2022, 30, 32614–32627. [Google Scholar]
- Zhang, L.L.; Long, R.Y.; Chen, H.; Geng, J.C. A review of China’s road traffic carbon emission. J. Clean. Prod. 2019, 207, 569–581. [Google Scholar]
- Zhang, X.; Zhao, X.R.; Jiang, Z.J.; Shao, S. How to achieve the 2030 CO2 emission-reduction targets for China’s industrial sector: Retrospective decomposition and prospective trajectories. Glob. Environ. Chang. 2017, 44, 83–97. [Google Scholar]
- Wang, Q.; Li, R.R. Journey to burning half of global coal: Trajectory and drivers of China’s coal use. Renew. Sustain. Energ. Rev. 2016, 58, 341–346. [Google Scholar]
- Du, Y.; Liu, Y.; Hossain, M.A.; Chen, S. The decoupling relationship between China’s economic growth and carbon emissions from the perspective of industrial structure. Chin. J. Popul. Resour. Environ. 2022, 20, 49–58. [Google Scholar]
- Chen, W.G.; Yan, S.H. The decoupling relationship between CO2 emissions and economic growth in the Chinese mining industry under the context of carbon neutrality. J. Clean. Prod. 2022, 379, 134692. [Google Scholar]
- Ou, X.M.; Yuan, Z.Y. Development Paths for China’s Transport Sector under the Carbon Neutrality Goal. Chin. J. Urban. Env. Stu. 2022, 10, 2250010. [Google Scholar] [CrossRef]
- Jiang, X.T.; Su, M.; Li, R.R. Investigating the Factors Influencing the Decoupling of Transport-Related Carbon Emissions from Turnover Volume in China. Sustainability 2018, 10, 3034. [Google Scholar] [CrossRef] [Green Version]
- Lin, B.Q.; Xie, C.P. Reduction potential of CO2 emissions in China’s transport industry. Renew. Sustain. Energ. Rev. 2014, 33, 689–700. [Google Scholar] [CrossRef]
- Wang, W.J.; Wang, J.X. Determinants investigation and peak prediction of CO2 emissions in China’s transport sector utilizing bio-inspired extreme learning machine. Environ. Sci. Pollut. Res. 2021, 28, 55535–55553. [Google Scholar]
- Jiang, R.; Zhou, Y.L.; Li, R.R. Moving to a Low-Carbon Economy in China: Decoupling and Decomposition Analysis of Emission and Economy from a Sector Perspective. Sustainability 2018, 10, 978. [Google Scholar] [CrossRef] [Green Version]
- Xiong, S.Q.; Yuan, Y.; Zhang, C.L. Achievement of carbon peak goals in China’s road transport—Possibilities and pathways. J. Clean. Prod. 2023, 388, 135894. [Google Scholar]
- Aqib, Z.; Faryal, M.; Mao, G.Z.; Yu, Y.J.; András, S. The carbon neutrality feasibility of worldwide and in China’s transportation sector by E-car and renewable energy sources before 2060. J. Energy Storage 2023, 61, 106696. [Google Scholar]
- Jiang, R.; Wu, P.; Wu, C.K. Driving Factors behind Energy-Related Carbon Emissions in the U.S. Road Transport Sector: A Decomposition Analysis. Int. J. Environ. Res. Public Health 2022, 19, 2321. [Google Scholar] [CrossRef] [PubMed]
- Li, Y.; Du, Q.; Lu, X.R.; Wu, J.; Han, X. Relationship between the development and CO2 emissions of transport sector in China. Transport. Res. Part D Transport Environ. 2019, 74, 1–14. [Google Scholar]
- Guo, M.Y.; Chen, S.L.; Zhang, J.; Meng, J. Environment Kuznets Curve in transport sector’s carbon emission: Evidence from China. J. Clean. Prod. 2022, 371, 133504. [Google Scholar]
- Wang, H.L.; Ou, X.M.; Zhang, X.L. Mode, technology, energy consumption, and resulting CO2 emissions in China’s transport sector up to 2050. Energy Policy 2017, 109, 719–733. [Google Scholar] [CrossRef]
- Liu, M.Z.; Wang, J.F.; Wen, J.X.; He, G.; Wu, J.X.; Chen, H.Y.; Yang, X.T. Carbon Emission and Structure Analysis of Transport Industry Based on Input-output Method: China as an Example. Sustain. Prod. Consump. 2022, 33, 168–188. [Google Scholar]
- Li, R.; Sun, T. Research on Measurement of Regional Differences and Decomposition of Influencing Factors of Carbon Emissions of China’s Logistics Industry. Pol. J. Environ. Stud. 2021, 30, 3137–3150. [Google Scholar]
- Tobias, H.; Hendrik, S. Decarbonizing Transport in the European Union: Emission Performance Standards and the Perspectives for a European Green Deal. Sustainability 2020, 12, 8381. [Google Scholar]
Figure 1.
Research framework.
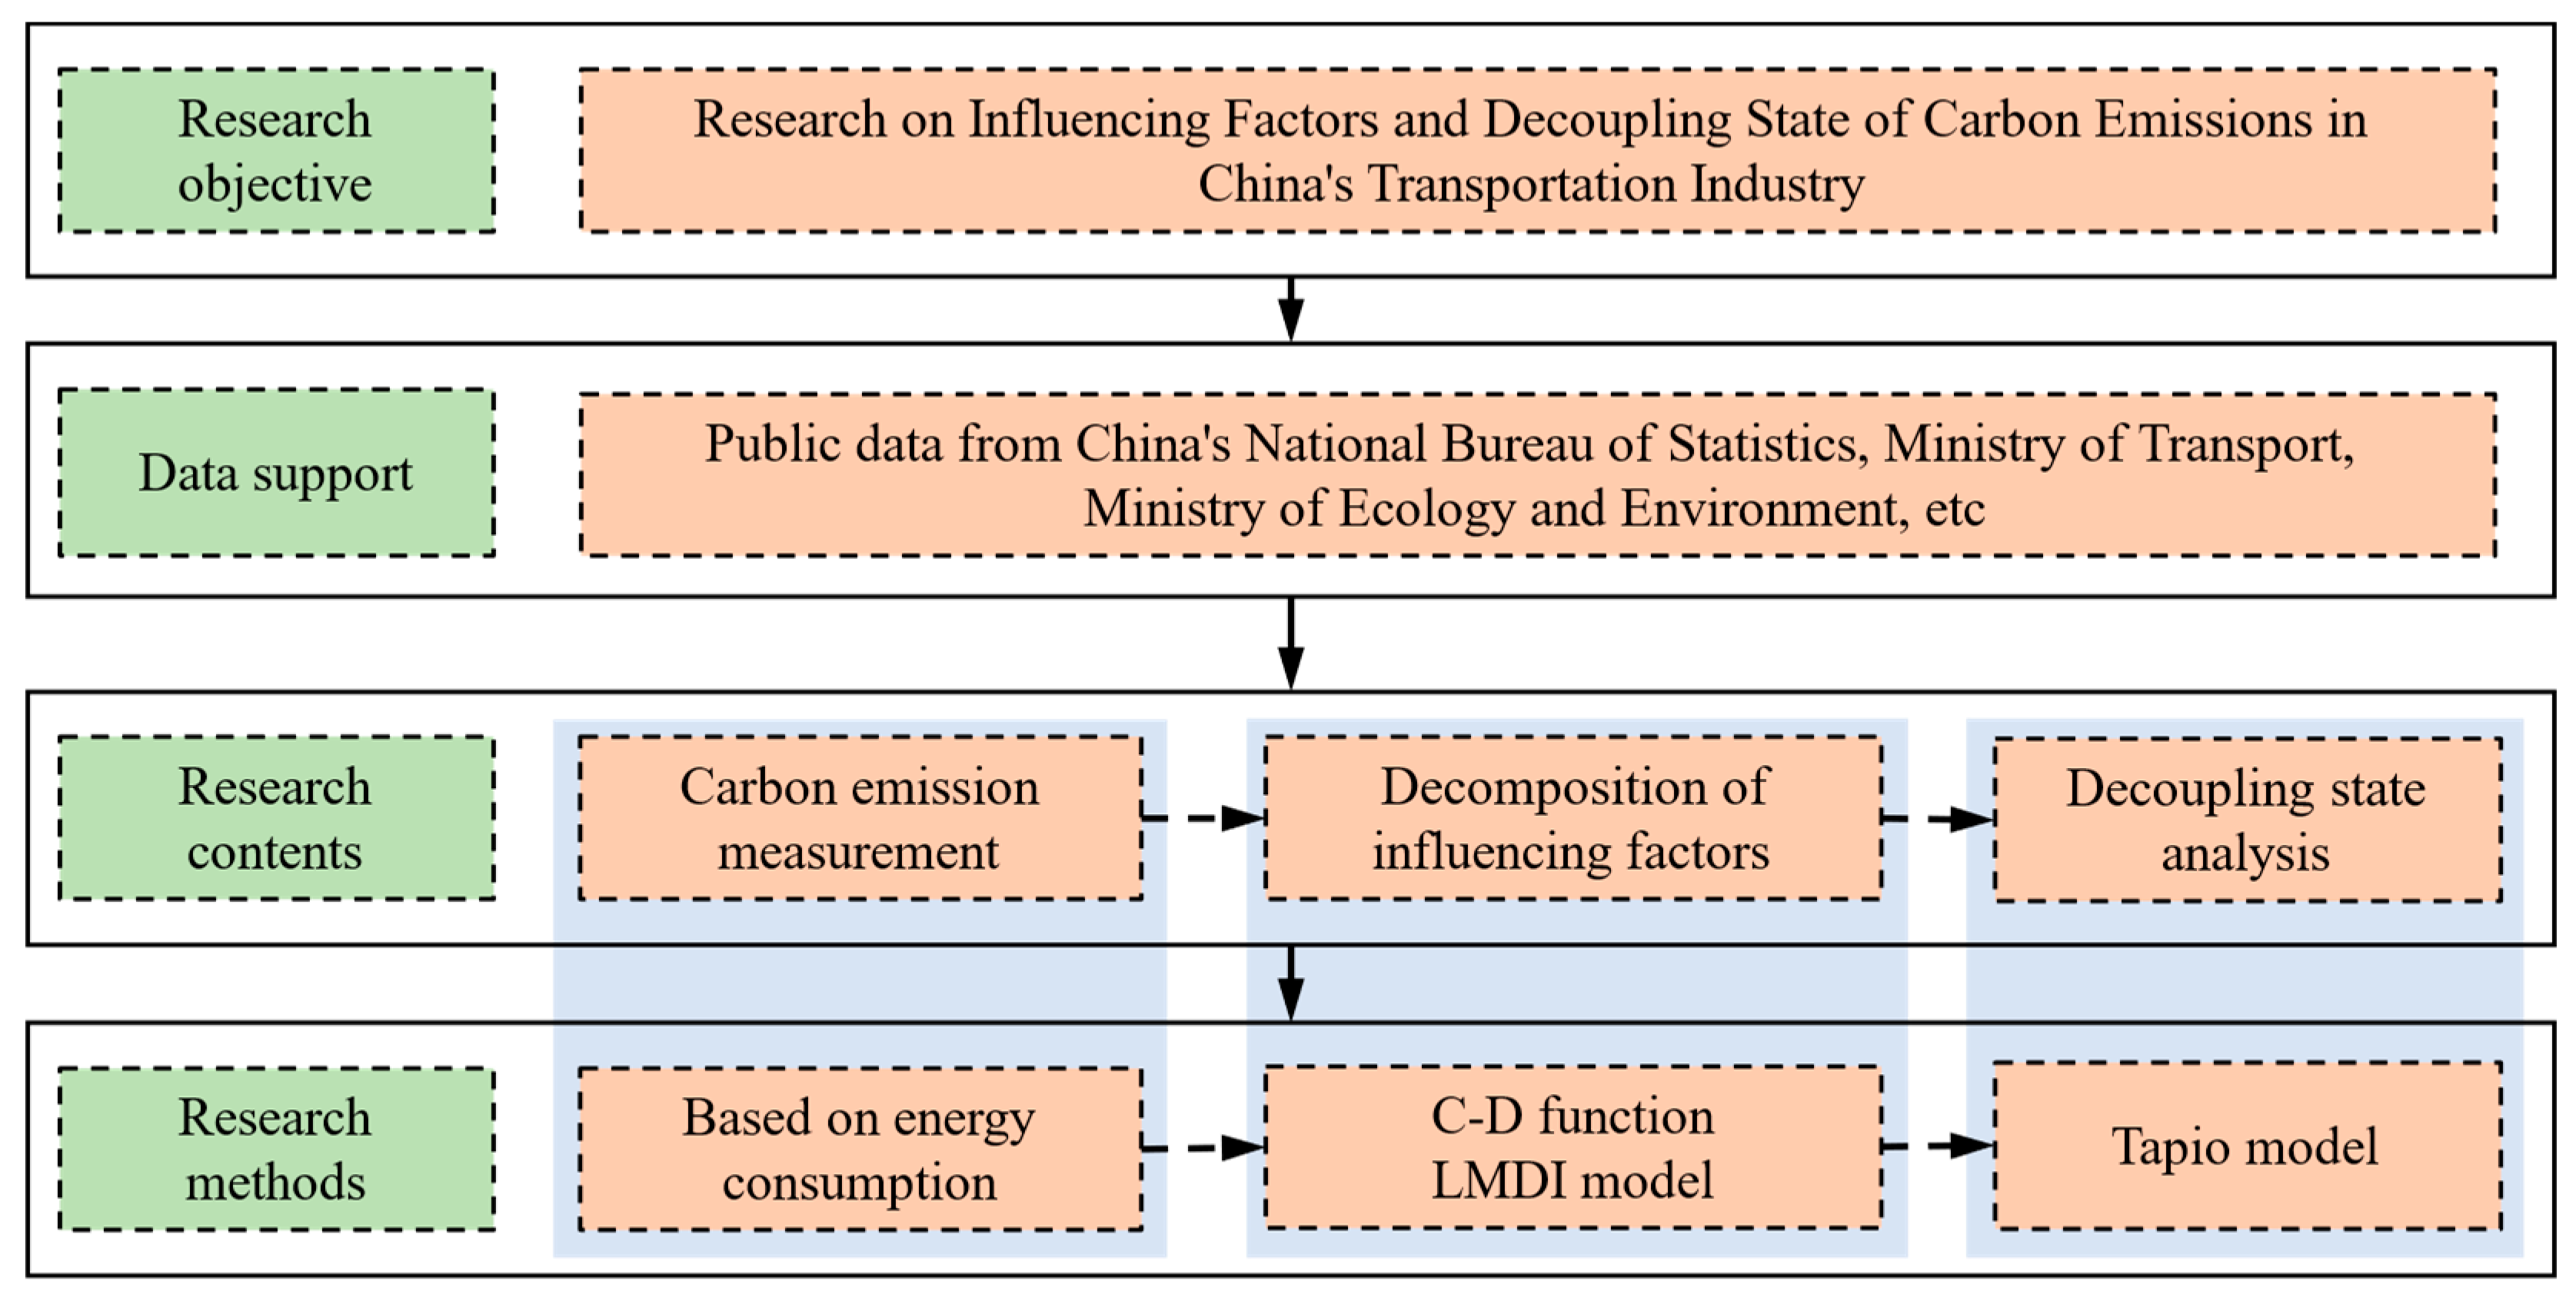
Figure 2.
Changes in GDP and CO2 emissions, 2000–2020.
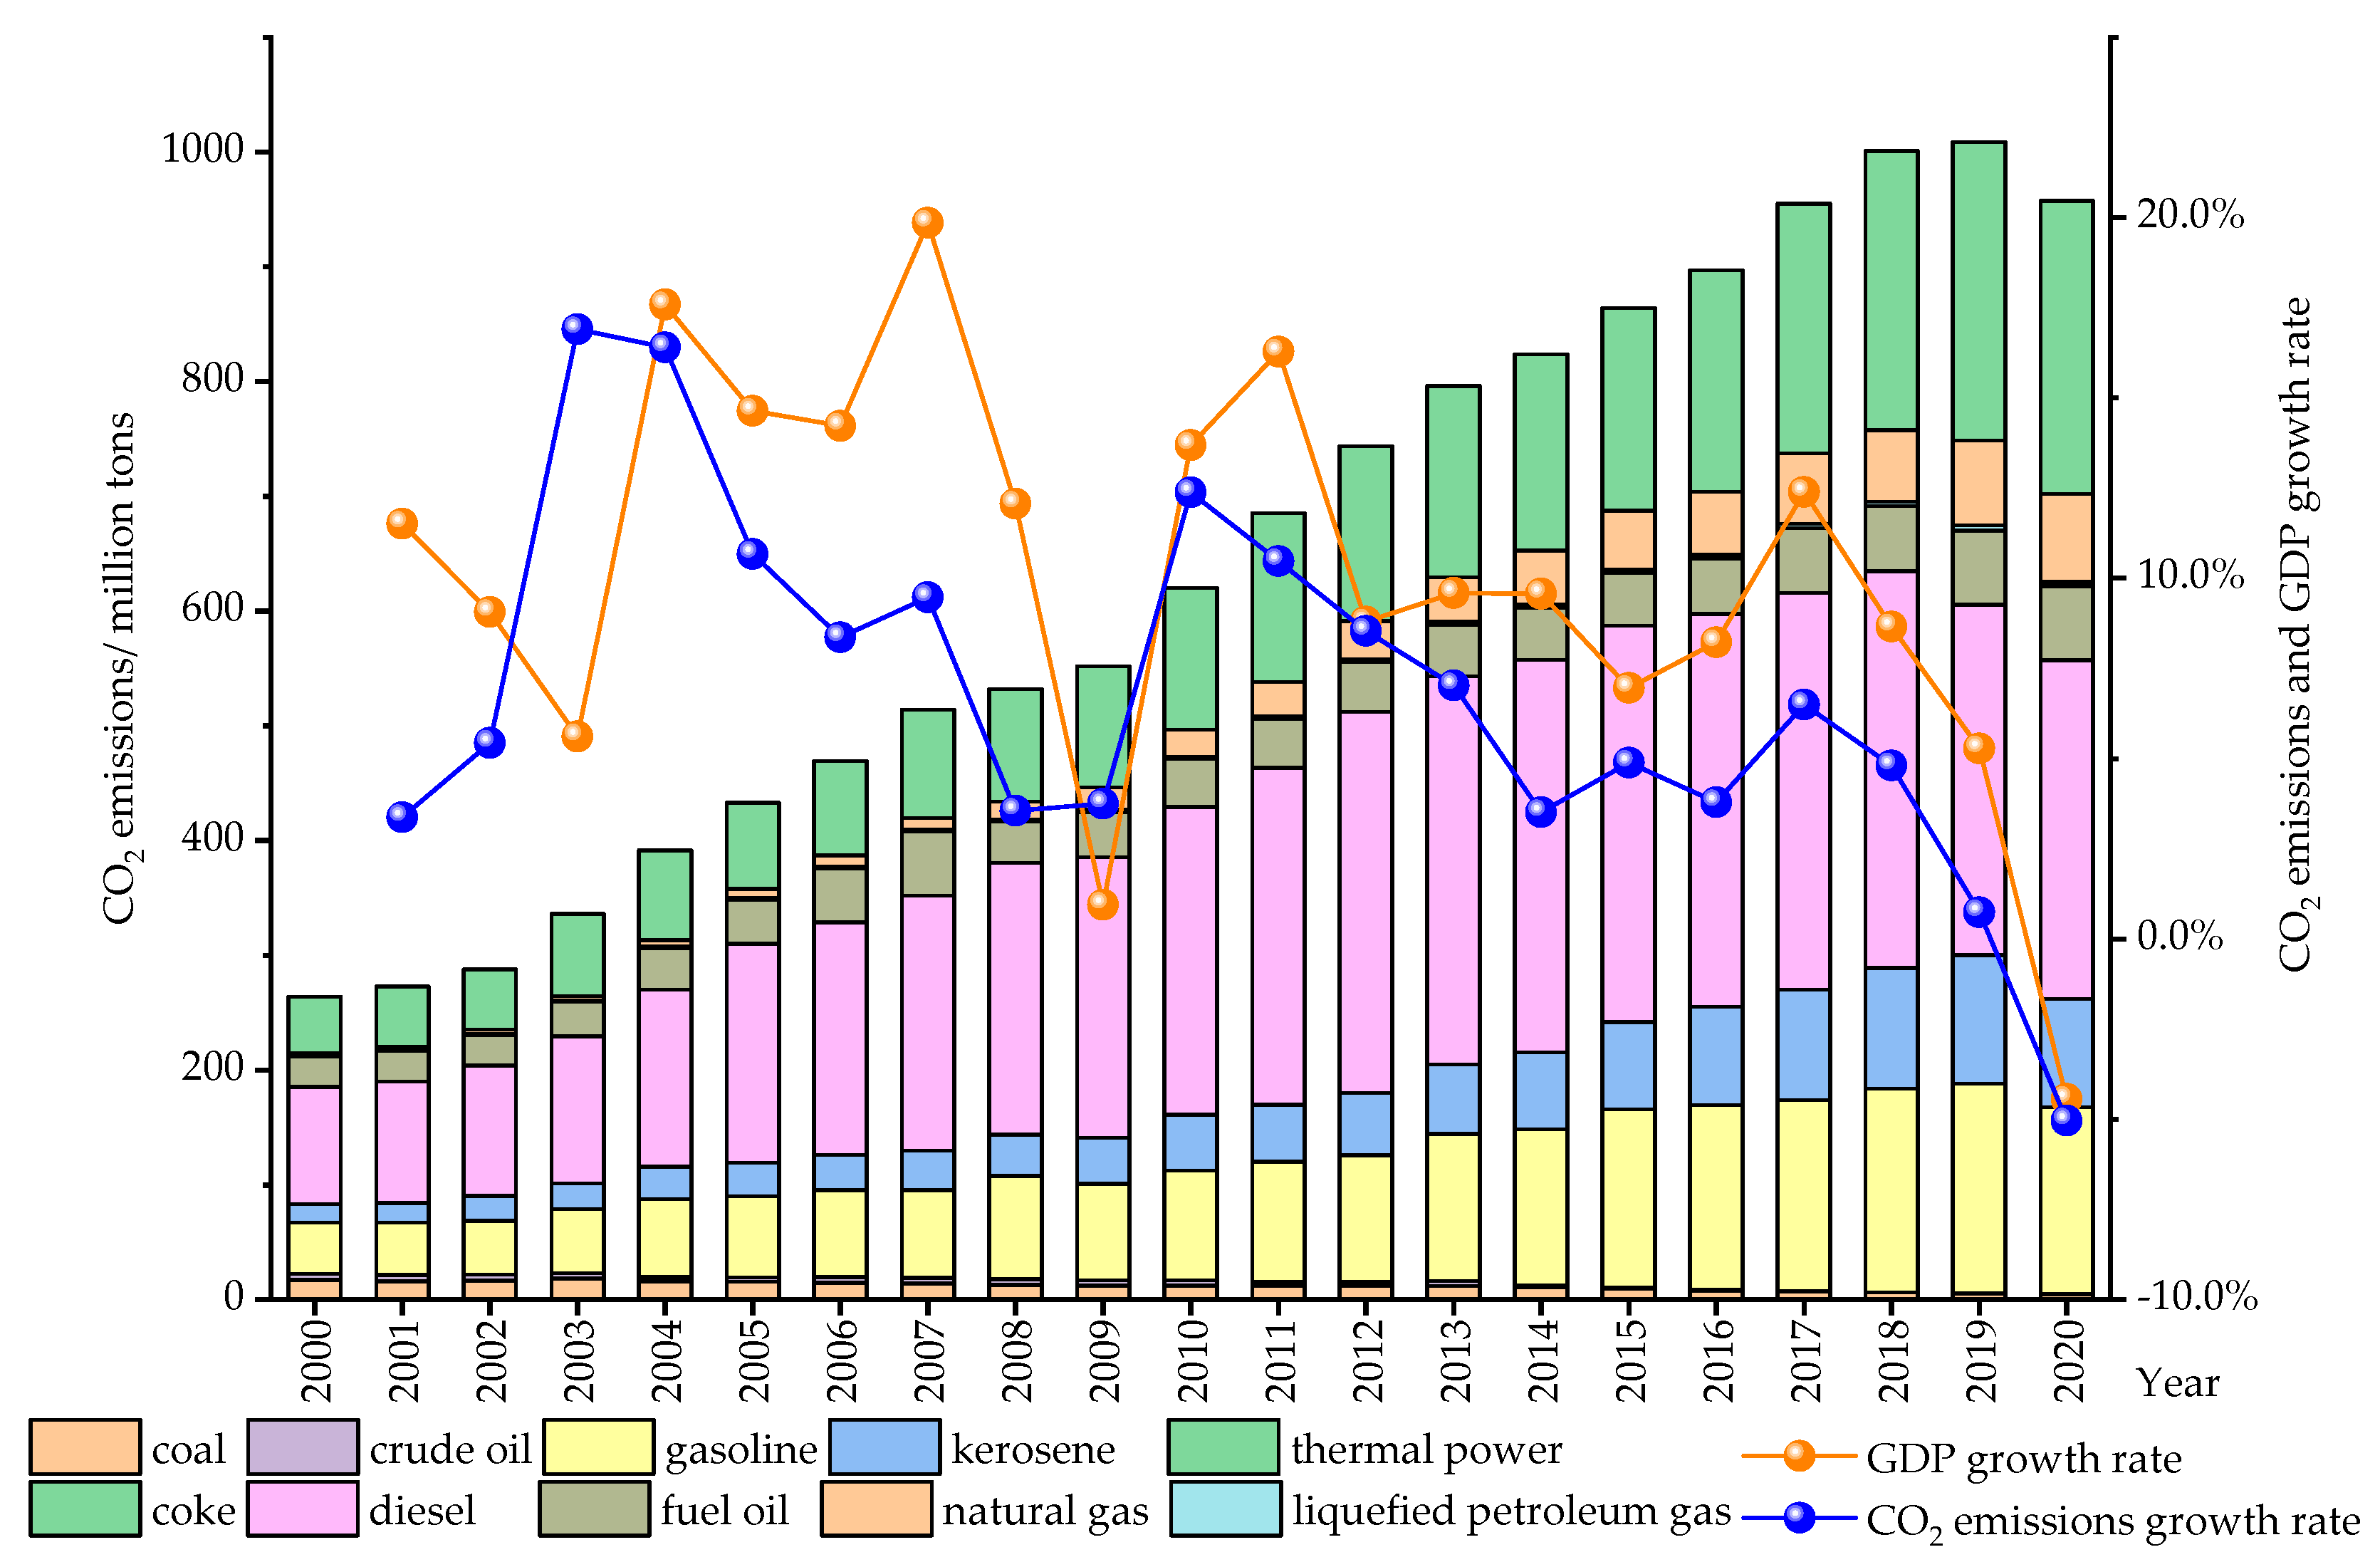
Figure 3.
The contribution value of each influencing factor (2000–2020).

Figure 4.
Carbon emission decoupling classification, 2000–2020.

Table 1.
Comparison of transport CO2 emissions by country in 2019.
| Carbon Emissions from the Transportation Industry | Increase in Carbon Emissions from 1990 to 2019 | |||
|---|---|---|---|---|
| Emission (Million t) | Proportion of World Transportation Carbon Emissions | Proportion of the Country’s Total Carbon Emissions | ||
| China | 1233 | 15.00% | 12.43% | 819% |
| USA | 1757 | 21.37% | 37.03% | 23% |
| Japan | 201 | 2.44% | 19.00% | −5% |
| EU | 932 | 11.34% | 31.14% | 23% |
| Germany | 160 | 1.95% | 19.63% | 1% |
| France | 126 | 1.53% | 42.71% | 12% |
| UK | 118 | 1.44% | 34.40% | 3% |
| Sweden | 16 | 0.19% | 48.48% | −20% |
Table 2.
Decoupling state classification.
| Decoupling Classification | Decoupling State | ∆C | ∆GDP | Meaning | |
|---|---|---|---|---|---|
| Decoupling | Strong decoupling | <0 | >0 | < 0 | The economy is growing, but carbon emissions are falling |
| Weak decoupling | >0 | >0 | 0 ≤ < 0.8 | The economy is growing faster than carbon emissions | |
| Recessive decoupling | <0 | <0 | > 1.2 | The rate of economic decline is less than the rate of reduction in carbon emissions | |
| Coupling | Expansive coupling | >0 | >0 | 0.8 ≤ ≤ 1.2 | Economic growth is increasing at the same rate as carbon emissions |
| Recessive coupling | <0 | <0 | 0.8 ≤ ≤ 1.2 | Economic recession and carbon emissions decrease at comparable rates | |
| Negative decoupling | Expansive negative decoupling | >0 | >0 | > 1.2 | The rate of economic growth is less than the rate of increase in carbon emissions |
| Weak negative decoupling | <0 | <0 | 0 ≤ < 0.8 | Economic recession is faster than carbon emission reduction | |
| Strong negative decoupling | >0 | <0 | < 0 | Economic recession and increased carbon emissions |
Table 3.
Decomposition of CO2 carbon emission influencing factors, 2000–2020.
| Year | ∆Ces | ∆Cet | ∆Ctg | ∆At | ∆Kt | ∆Lt | ∆C |
|---|---|---|---|---|---|---|---|
| 2000–2001 | 140.71 | −305.76 | −1002.08 | 729.91 | 2748.67 | −555.09 | 890.87 |
| 2001–2002 | −393.01 | −990.52 | −773.74 | −535.93 | 3252.35 | −286.31 | 1481.13 |
| 2002–2003 | 1022.94 | −2298.22 | −103.69 | −7143.89 | 3768.52 | 5073.47 | 4862.48 |
| 2003–2004 | −699.98 | −2238.93 | 3072.66 | −477.66 | 6500.45 | −146.13 | 5512.78 |
| 2004–2005 | −1179.05 | −3581.49 | 40.04 | 167.00 | 5676.68 | −222.58 | 4176.33 |
| 2005–2006 | 75.10 | −2189.66 | −1460.81 | 1590.06 | 4383.63 | 22.39 | 3619.84 |
| 2006–2007 | 458.64 | −1893.94 | −2516.76 | 6867.89 | 1802.55 | 131.89 | 4446.00 |
| 2007–2008 | −277.07 | 681.21 | −1604.65 | 3366.48 | 2587.49 | −10.05 | 1823.28 |
| 2008–2009 | 364.87 | 7398.49 | 4702.64 | −12,028.78 | 11,243.71 | 1295.02 | 1995.98 |
| 2009–2010 | 437.61 | −3032.30 | 1074.71 | 480.27 | 7131.55 | −103.43 | 6831.04 |
| 2010–2011 | 901.26 | 5684.21 | −2348.18 | 4657.40 | 4218.30 | 959.07 | 6493.91 |
| 2011–2012 | −791.16 | −1595.12 | −57.63 | 5777.47 | 170.11 | 71.40 | 5851.40 |
| 2012–2013 | 215.79 | −579.63 | −9438.08 | −1934.24 | 3739.03 | 5242.47 | 5223.45 |
| 2013–2014 | −367.53 | −676.08 | −1202.92 | 1176.24 | 5802.62 | 416.54 | 2792.64 |
| 2014–2015 | −541.87 | 1689.20 | −6787.85 | 1633.68 | 4237.01 | −196.57 | 4028.61 |
| 2015–2016 | 868.48 | −3939.74 | −2956.53 | 2234.98 | 4820.42 | −100.58 | 3271.65 |
| 2016–2017 | 1180.41 | −9313.22 | −5590.56 | 944.75 | 10,026.26 | −159.42 | 5821.81 |
| 2017–2018 | 1640.37 | −305.76 | −4490.04 | 9955.88 | 634.47 | −2469.00 | 4595.61 |
| 2018–2019 | 1210.02 | −990.52 | −7327.35 | 5151.07 | 307.28 | −294.54 | 735.68 |
| 2019–2020 | 1026.10 | −2298.22 | 2287.12 | −11,149.10 | 6927.11 | −234.66 | −5083.17 |
| Cumulative | 5292.64 | −9313.22 | −36,483.71 | 11,463.49 | 89,978.23 | 8433.89 | 69,371.32 |
Table 4.
Contribution of each influencing factor to the decoupling index, 2000–2020.
| Year | t1 | t2 | t3 | t4 | t5 | t6 | T |
|---|---|---|---|---|---|---|---|
| 2000–2001 | 0.046 | −0.386 | −0.330 | 0.240 | 0.905 | −0.183 | 0.293 |
| 2001–2002 | −0.159 | 0.088 | −0.313 | −0.217 | 1.315 | −0.116 | 0.599 |
| 2002–2003 | 0.634 | 1.391 | −0.064 | −4.427 | 2.335 | 3.144 | 3.013 |
| 2003–2004 | −0.118 | −0.463 | 0.520 | −0.081 | 1.100 | −0.025 | 0.932 |
| 2004–2005 | −0.206 | −0.053 | 0.007 | 0.029 | 0.991 | −0.039 | 0.729 |
| 2005–2006 | 0.012 | −0.161 | −0.237 | 0.258 | 0.712 | 0.004 | 0.588 |
| 2006–2007 | 0.049 | −0.247 | −0.270 | 0.737 | 0.194 | 0.014 | 0.477 |
| 2007–2008 | −0.045 | −0.361 | −0.259 | 0.543 | 0.417 | −0.002 | 0.294 |
| 2008–2009 | 0.725 | −7.118 | 9.346 | −23.906 | 22.346 | 2.574 | 3.967 |
| 2009–2010 | 0.058 | −0.290 | 0.142 | 0.064 | 0.944 | −0.014 | 0.904 |
| 2010–2011 | 0.089 | −0.188 | −0.233 | 0.461 | 0.418 | 0.095 | 0.643 |
| 2011–2012 | −0.131 | 0.113 | −0.010 | 0.959 | 0.028 | 0.012 | 0.971 |
| 2012–2013 | 0.030 | 1.037 | −1.323 | −0.271 | 0.524 | 0.735 | 0.732 |
| 2013–2014 | −0.048 | −0.398 | −0.158 | 0.154 | 0.762 | 0.055 | 0.367 |
| 2014–2015 | −0.095 | 0.992 | −1.184 | 0.285 | 0.739 | −0.034 | 0.703 |
| 2015–2016 | 0.122 | −0.225 | −0.416 | 0.315 | 0.678 | −0.014 | 0.460 |
| 2016–2017 | 0.106 | −0.052 | −0.503 | 0.085 | 0.902 | −0.014 | 0.524 |
| 2017–2018 | 0.198 | −0.082 | −0.543 | 1.203 | 0.077 | −0.298 | 0.556 |
| 2018–2019 | 0.229 | 0.320 | −1.387 | 0.975 | 0.058 | −0.056 | 0.139 |
| 2019–2020 | −0.229 | 0.881 | −0.511 | 2.493 | −1.549 | 0.052 | 1.137 |
Disclaimer/Publisher’s Note: The statements, opinions and data contained in all publications are solely those of the individual author(s) and contributor(s) and not of MDPI and/or the editor(s). MDPI and/or the editor(s) disclaim responsibility for any injury to people or property resulting from any ideas, methods, instructions or products referred to in the content. |
© 2023 by the authors. Licensee MDPI, Basel, Switzerland. This article is an open access article distributed under the terms and conditions of the Creative Commons Attribution (CC BY) license (https://creativecommons.org/licenses/by/4.0/).
Share and Cite
MDPI and ACS Style
Li, X.-Y.; Chen, T.; Chen, B. Research on the Influencing Factors and Decoupling State of Carbon Emissions in China’s Transportation Industry. Sustainability 2023, 15, 11871. https://doi.org/10.3390/su151511871
AMA Style
Li X-Y, Chen T, Chen B. Research on the Influencing Factors and Decoupling State of Carbon Emissions in China’s Transportation Industry. Sustainability. 2023; 15(15):11871. https://doi.org/10.3390/su151511871
Chicago/Turabian StyleLi, Xiao-Yang, Tao Chen, and Bin Chen. 2023. "Research on the Influencing Factors and Decoupling State of Carbon Emissions in China’s Transportation Industry" Sustainability 15, no. 15: 11871. https://doi.org/10.3390/su151511871
Note that from the first issue of 2016, this journal uses article numbers instead of page numbers. See further details here.