Article

Sensitivity Analysis of Factors Influencing the Blast Resistance of Reinforced Concrete Columns Based on Grey Relation Degree

1
State Key Laboratory of Precision Blasting, Jianghan University, Wuhan 430056, China
2
Hubei Key Laboratory of Blasting Engineering, Jianghan University, Wuhan 430056, China
3
School of Safety Science and Engineering, Anhui University of Science and Technology, Huainan 232001, China
*
Author to whom correspondence should be addressed.
Sustainability 2023, 15(16), 12285; https://doi.org/10.3390/su151612285
Submission received: 11 May 2023 / Revised: 7 August 2023 / Accepted: 8 August 2023 / Published: 11 August 2023

Abstract

:
Reinforced concrete (RC) column is an important load-bearing component in building structures. In order to study the blast resistance of RC columns, the numerical simulation model was verified based on the field test data, and the ANSYS/LS-DYNA 2020R2 software was used to expand the working conditions. The sensitivity analysis method of grey relation degree was used to study the effects of factors, such as the diameter of longitudinal reinforcement, number of longitudinal reinforcement, the diameter of the stirrup, stirrup spacing, strength of concrete, scale distance, and strength of reinforcement on the blast resistance of RC columns. The results show that changing the number of longitudinal reinforcements to control the reinforcement ratio can make the peak displacement of RC columns smaller rather than changing the diameter of longitudinal reinforcement. Changing the stirrup spacing to control the stirrup ratio can make the RC column have better blast resistance rather than changing the diameter of the stirrup. The strength of reinforcements and concrete materials has little effect on the mid-span peak displacement of RC columns. The grey relation degree of the influencing factors of the mid-span peak displacement of the RC column is in the order of stirrup spacing, the diameter of the stirrup, scale distance, the diameter of longitudinal reinforcement, the number of longitudinal reinforcement, and the strength of concrete. The relation between stirrup spacing and the diameter of the stirrup is larger, and the grey relation degree is 0.6914 and 0.6660, respectively. This study can provide a reference for the design and construction of RC column structures.

1. Introduction

Local wars and terrorist attacks caused by hegemonic and religious reasons have never ceased, posing a serious threat to building structures [1,2,3]. In addition, flammable and explosive substances in industrial production processes [4,5,6] and natural gas in daily life [7,8,9] pose a serious threat to buildings, putting people’s lives and property at risk. In the traditional design and construction process of buildings, blast loads are ignored. For important buildings, blast resistance design should be conducted to prevent accidental explosions and violent terrorist attacks [10,11,12].
Columns are the most important load-bearing components in building structures, which will bend and fracture after being damaged by blast loads, leading to the tilting or even collapse of the entire building. A thorough study of the blast resistance of columns can better guide the design and construction of buildings [13,14]. For RC columns, traditional research mainly involves changing factors, such as strength of reinforcement [15], reinforcement ratio [16,17,18], stirrup spacing [17,19], strength of concrete [20], size and shape of columns [21,22], slenderness ratio of columns [23], scale distance [24], blast location [25], and axial compression ratio [26,27] to determine the failure mode and morphology of RC columns under blast loads. P–I curve [28,29,30], residual bearing capacity [31,32], displacement [33], and support angle [34] are indicators used to evaluate the damage level of RC columns.
The latest research focuses on strengthening RC columns and other aspects. Ma et al. [35] determined the critical scale distance for local and global failure based on on-site explosion tests. Welt et al. [36] proposed formulas for compressive strength and strain-bearing capacity, as well as a monotonic conservative model, and established a rectangular RC prism test database for verification. Shi et al. [37] enhanced the explosion resistance of RC columns by hanging granite slabs outside the column structure. Jiang et al. [38] studied the dynamic response of RPC-filled steel tubular columns under explosive loads. Mohammed and Abebe [39] studied the enhancement effect of CFRP on the explosion resistance of RC columns. In addition, scholars have also studied the blast resistance of RC columns after damage, such as those subjected to vehicle impact [40,41,42], earthquakes [43,44], fire [45,46,47], and corrosion aging [48,49].
In the above research, some studies have selected two or more influencing factors for a simple comparison of the factors affecting the blast resistance of RC columns. The research conclusions are scattered and not systematic. Based on the numerical calculation model verified by field chemical explosion experimental data, this paper uses LS-DYNA software to expand the working conditions, and studies the influence of common factors, such as the diameter of longitudinal reinforcement, number of longitudinal reinforcement, the diameter of the stirrup, stirrup spacing, strength of concrete, scale distance and strength of reinforcements on the blast resistance of RC columns by grey relation sensitivity analysis methods. Quantitatively expressing the strength of their correlation, more consideration should be given to changing the influencing factors of strong correlation in the design and construction of reinforced concrete structures. In addition, the blast resistance of RC columns when changing the diameter of longitudinal reinforcement and changing the number of longitudinal reinforcements to control the reinforcement ratio is compared, and the blast resistance of RC columns when changing the diameter of the stirrup and changing the stirrup spacing to control the stirrup ratio is compared.

2. Grey Relation Analysis Methods

The grey relation method is a sensitivity analysis method that can identify the main influencing factors among some uncertain factors. The grey system theory was proposed by Professor Deng in the late 1970s [50]. Grey relation analysis is an important sensitivity analysis method. This method requires a unified processing and analysis of various influencing factors, calculating their relation and sorting them according to the magnitude of the relation to identify the main influencing factors [51]. Many scholars have applied this method to different fields [52,53,54]. It is suitable for analyzing and evaluating the influencing factors of mid-span peak displacement of RC columns. The calculation program for this method is as follows:
  • List comparison data matrix X and reference data matrix Y.
Take n factors that affect the mid-span peak displacement of RC columns (diameter of longitudinal reinforcement, number of longitudinal reinforcement, diameter of stirrup, stirrup spacing, strength of concrete, scale distance, and strength of longitudinal reinforcement) as the comparison sequence X, X = (X1X2Xn)T, and the corresponding mid-span peak displacement of RC columns as the reference sequence Y, Y = (Y1Y2Yn)T. Among them, each factor in sequence X and Y has m values, as shown in Equations (1) and (2):
X i = ( X i ( 1 ) X i ( 2 ) X i ( m ) )
Y i = ( Y i ( 1 ) Y i ( 2 ) Y i ( m ) )
Write the comparison sequence X and reference sequence Y in matrix form, as shown in Equations (3) and (4):
X = X 1 X 2 X n = X 1 ( 1 ) X 1 ( 2 ) X 1 ( m ) X 2 ( 1 ) X 2 ( 2 ) X 2 ( m ) X n ( 1 ) X n ( 2 ) X n ( m )
Y = Y 1 Y 2 Y n = Y 1 ( 1 ) Y 1 ( 2 ) Y 1 ( m ) Y 2 ( 1 ) Y 2 ( 2 ) Y 2 ( m ) Y n ( 1 ) Y n ( 2 ) Y n ( m )
2.
Dimensionless treatment of comparison data matrix X and reference data matrix Y.
By performing interval relative value processing on the data, the comparison data matrix X and the reference data matrix Y can be dimensionless. The calculation process is shown in Equations (5) and (6).
X i = ( X i ( 1 ) X i ( 2 ) X i ( m ) )
X i ( j ) = X i ( j ) min j X i ( j ) max j X i ( j ) min j X i ( j )
Similarly, the reference data matrix Y can be dimensionless processed using the same method.
3.
Solve the grey correlation difference information between the comparison data matrix X and the reference data matrix Y.
The difference matrix Δ can be solved by Equation (7):
Δ i j = Y i ( j ) X i ( j )
The selection of maximum and minimum values in the difference matrix Δ is shown in Equation (8):
Δ m a x = m a x ( Δ i j ) Δ m i n = m i n ( Δ i j )
4.
Solve the grey correlation coefficient matrix γ .
The calculation formula for the grey relation coefficient matrix γ is shown in Equation (9):
γ i j = Δ m i n + ξ Δ m a x Δ i j + ξ Δ m a x
where ξ is the resolution coefficient, ξ  [0, 1], and generally ξ = 0.5.
5.
Solving grey relation degree A.
Solving the average value of each row of grey relation coefficients in the grey relation coefficient matrix and using this average value as the relation degree of the corresponding row’s influencing factors can solve the problem of multiple and scattered relation coefficients. The relation degree calculation formula is shown in Equation (10):
A i = 1 m j = 1 m γ i j
The value of the relation degree can reflect the sensitivity of influencing factors. The range of relation degree values is [0, 1]. The smaller the correlation degree value, the weaker the relation between comparative factors and reference factors. The larger the relation value, the stronger the relation between the comparative factor and the reference factor. The grey relation analysis flowchart is shown in Figure 1.

3. Model Validation for Numerical Simulation

3.1. Introduction of Experiment

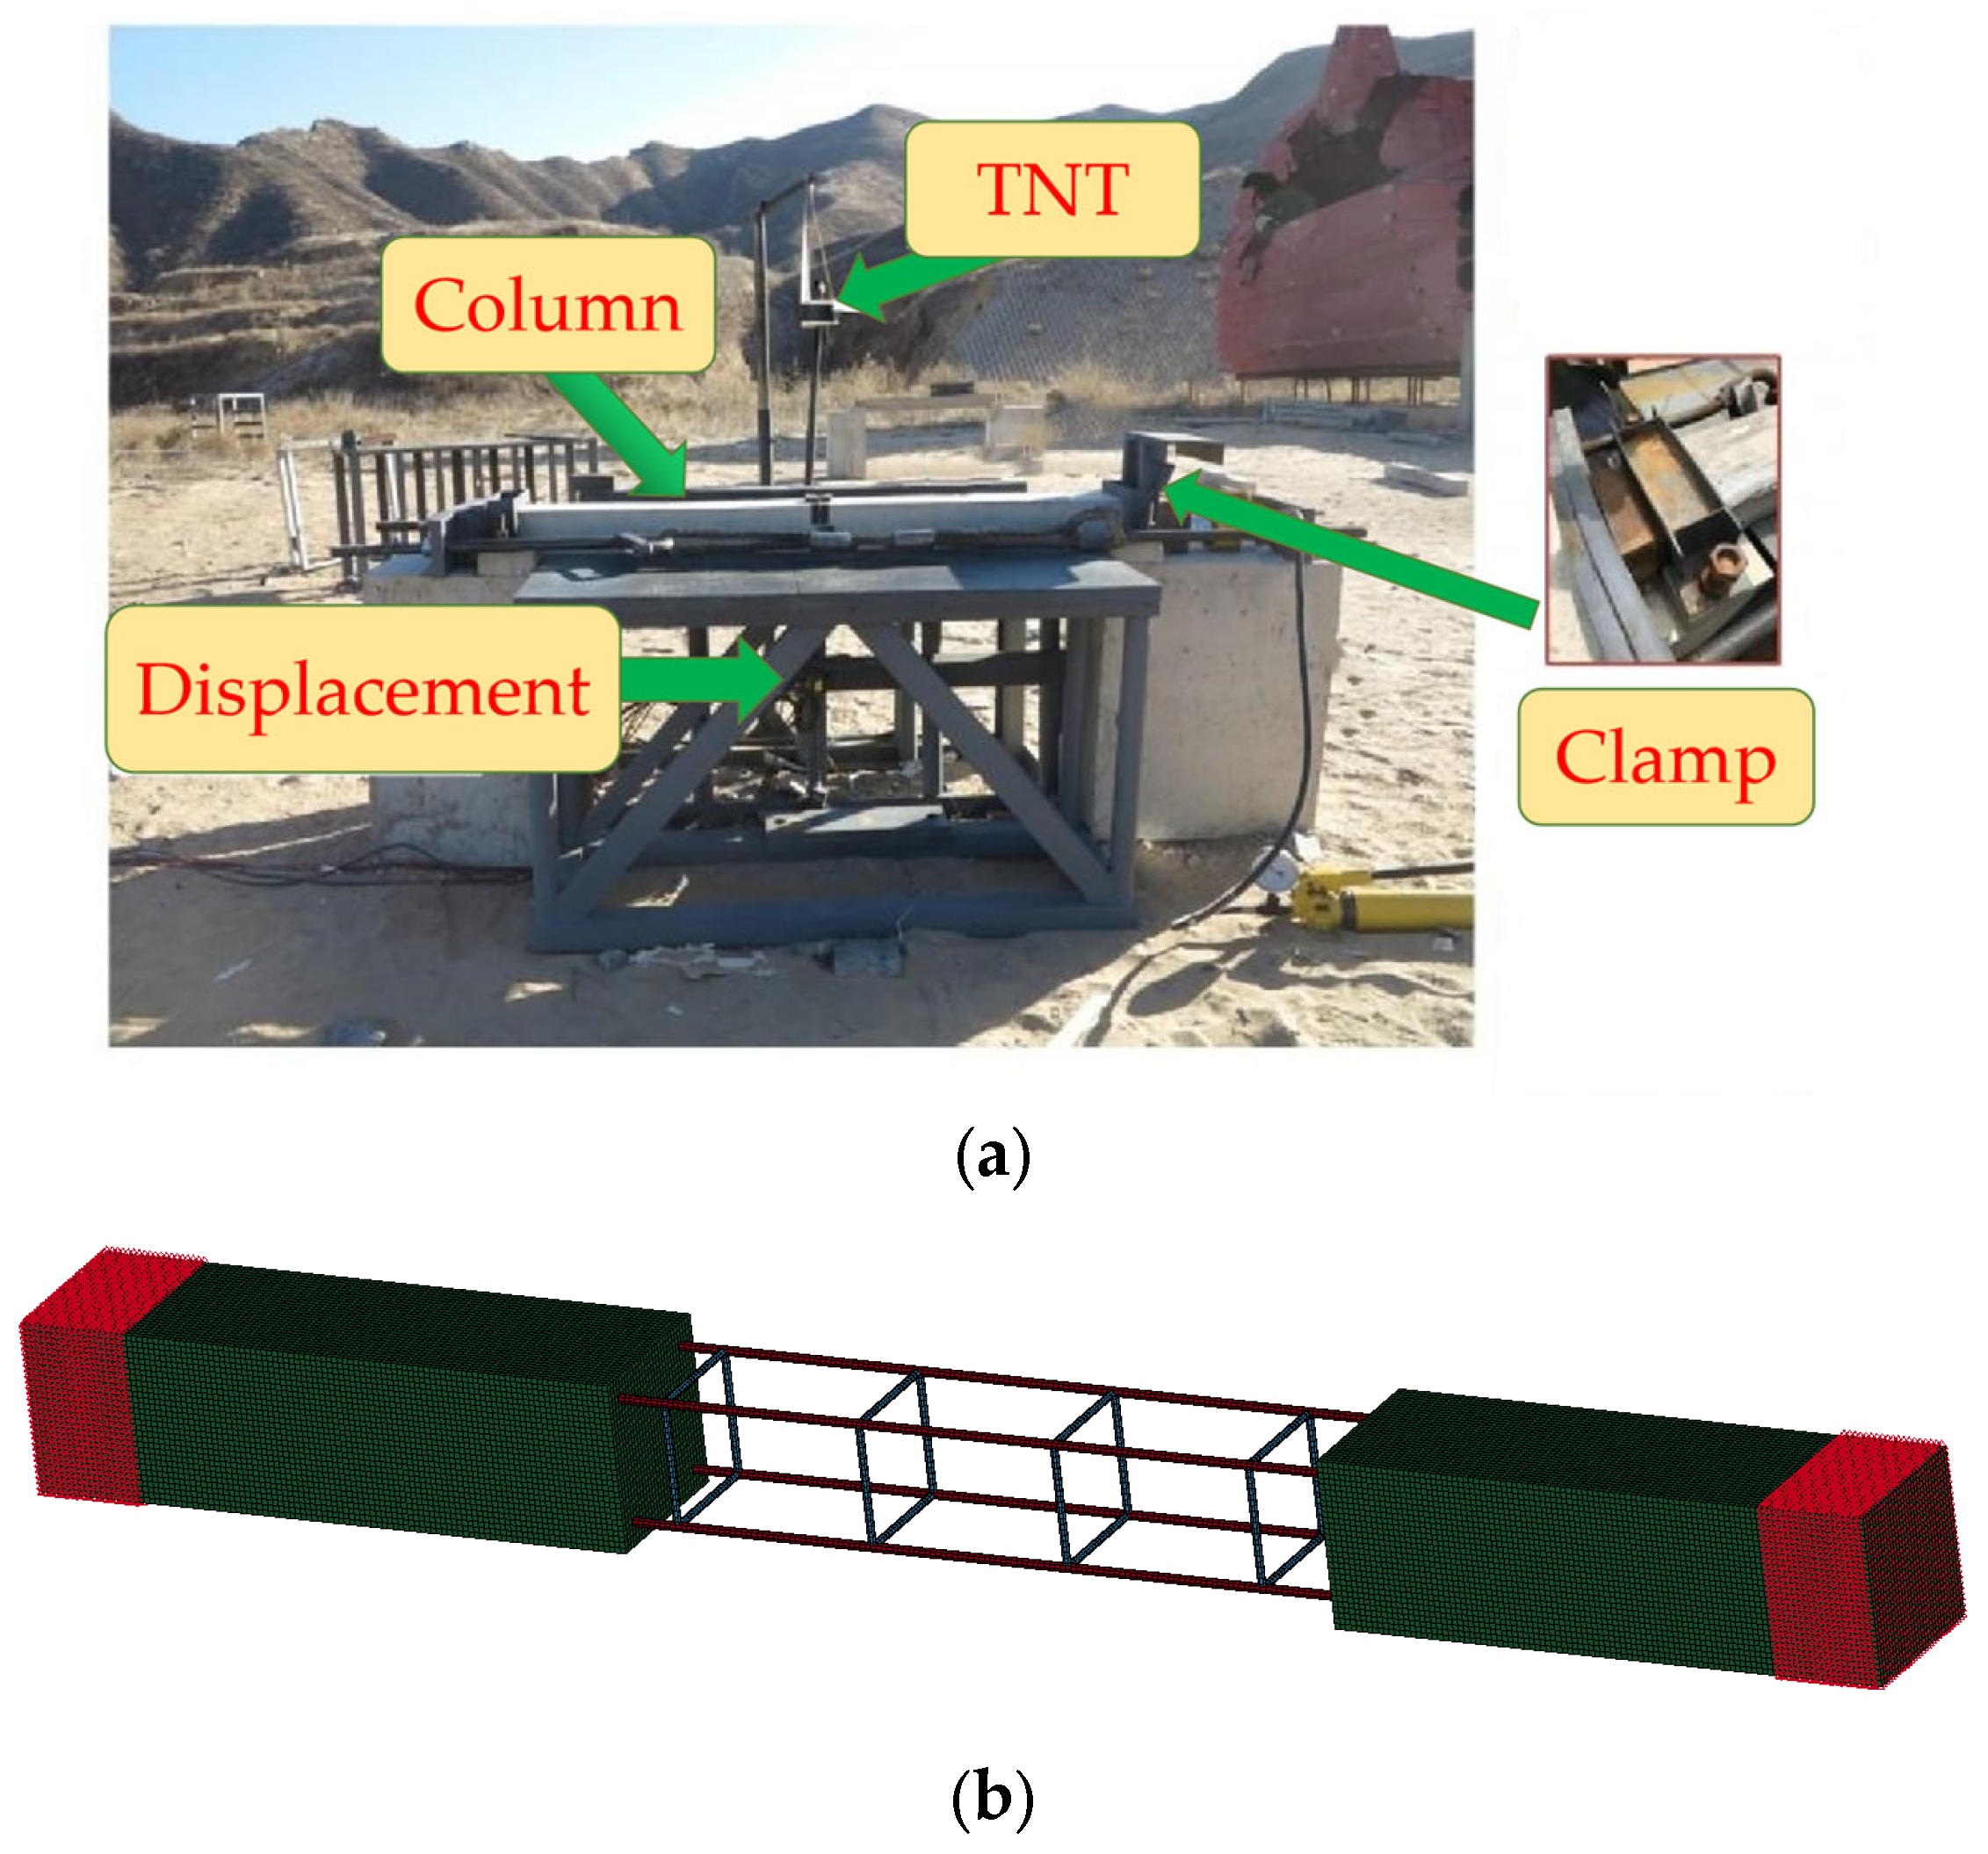
The research object of this paper is the common RC columns in building structures, based on the RC columns introduced in reference [55], which have a size of 1700 mm × 150 mm × 150 mm, with four longitudinal reinforcements and ten stirrups arranged. The longitudinal reinforcement is HRB400 with a diameter of 8 mm, and the stirrup is CRB550 with a diameter of 6.5 mm, produced in China. The strength grade of concrete is C30, the uniaxial compressive strength of concrete is 31.3 MPa, and the thickness of the concrete protective layer is 20 mm. The schematic diagram of RC columns is shown in Figure 2. The experiment was conducted using a trinitrotoluene (TNT) explosive, with a charge of 0.4 kg and a blast distance of 0.5 m. The scale distance of this working condition is 0.68 m·kg−1/3, which is a near-explosion experiment. Both ends of the RC column are supported by 10 cm fixtures, and the KD 9–20 precision wire displacement sensor is used to measure the mid-span displacement. The overall layout of the experiment is shown in Figure 3a.

3.2. Introduction of Numerical Simulation

3.2.1. Type of Unit

This paper uses LS-DYNA software to perform numerical simulation calculations on RC columns in the experiment, using a separate modeling method between the reinforcement and concrete. Both longitudinal reinforcement and stirrup are modeled using *SECTION_BEAM, and concrete is modeled using *SECTION_SOLID, with all units using a 5 mm grid size. The overall layout of the numerical simulation model is shown in Figure 3b. After modeling, the reinforcement and concrete are coupled by adding the key field *CONSTRAINED_BEAM_IN_SOLID in the keyword file.

3.2.2. Type of Material

  • Reinforcement
The reinforcement adopts the *MAT_PLASTIC_KINEMATIC model, which is suitable for simulating isotropic and motion-hardening plasticity considering strain rate effects. The specific material parameters of longitudinal bars and stirrups are shown in Table 1.
2.
Concrete
The concrete adopts the *MAT_CONCRETE_DAMAGE_REL3 (MAT72) model. The main advantage of this model is that it is based on a single user input parameter, which is the unconfined compressive strength. It automatically generates the remaining model parameters using built-in algorithms, which can be modified by the user.
Concrete is a material with a strong relation with strain rate, and it is necessary to consider the strain rate effect to simulate the dynamic response of RC column structures under blast loads.
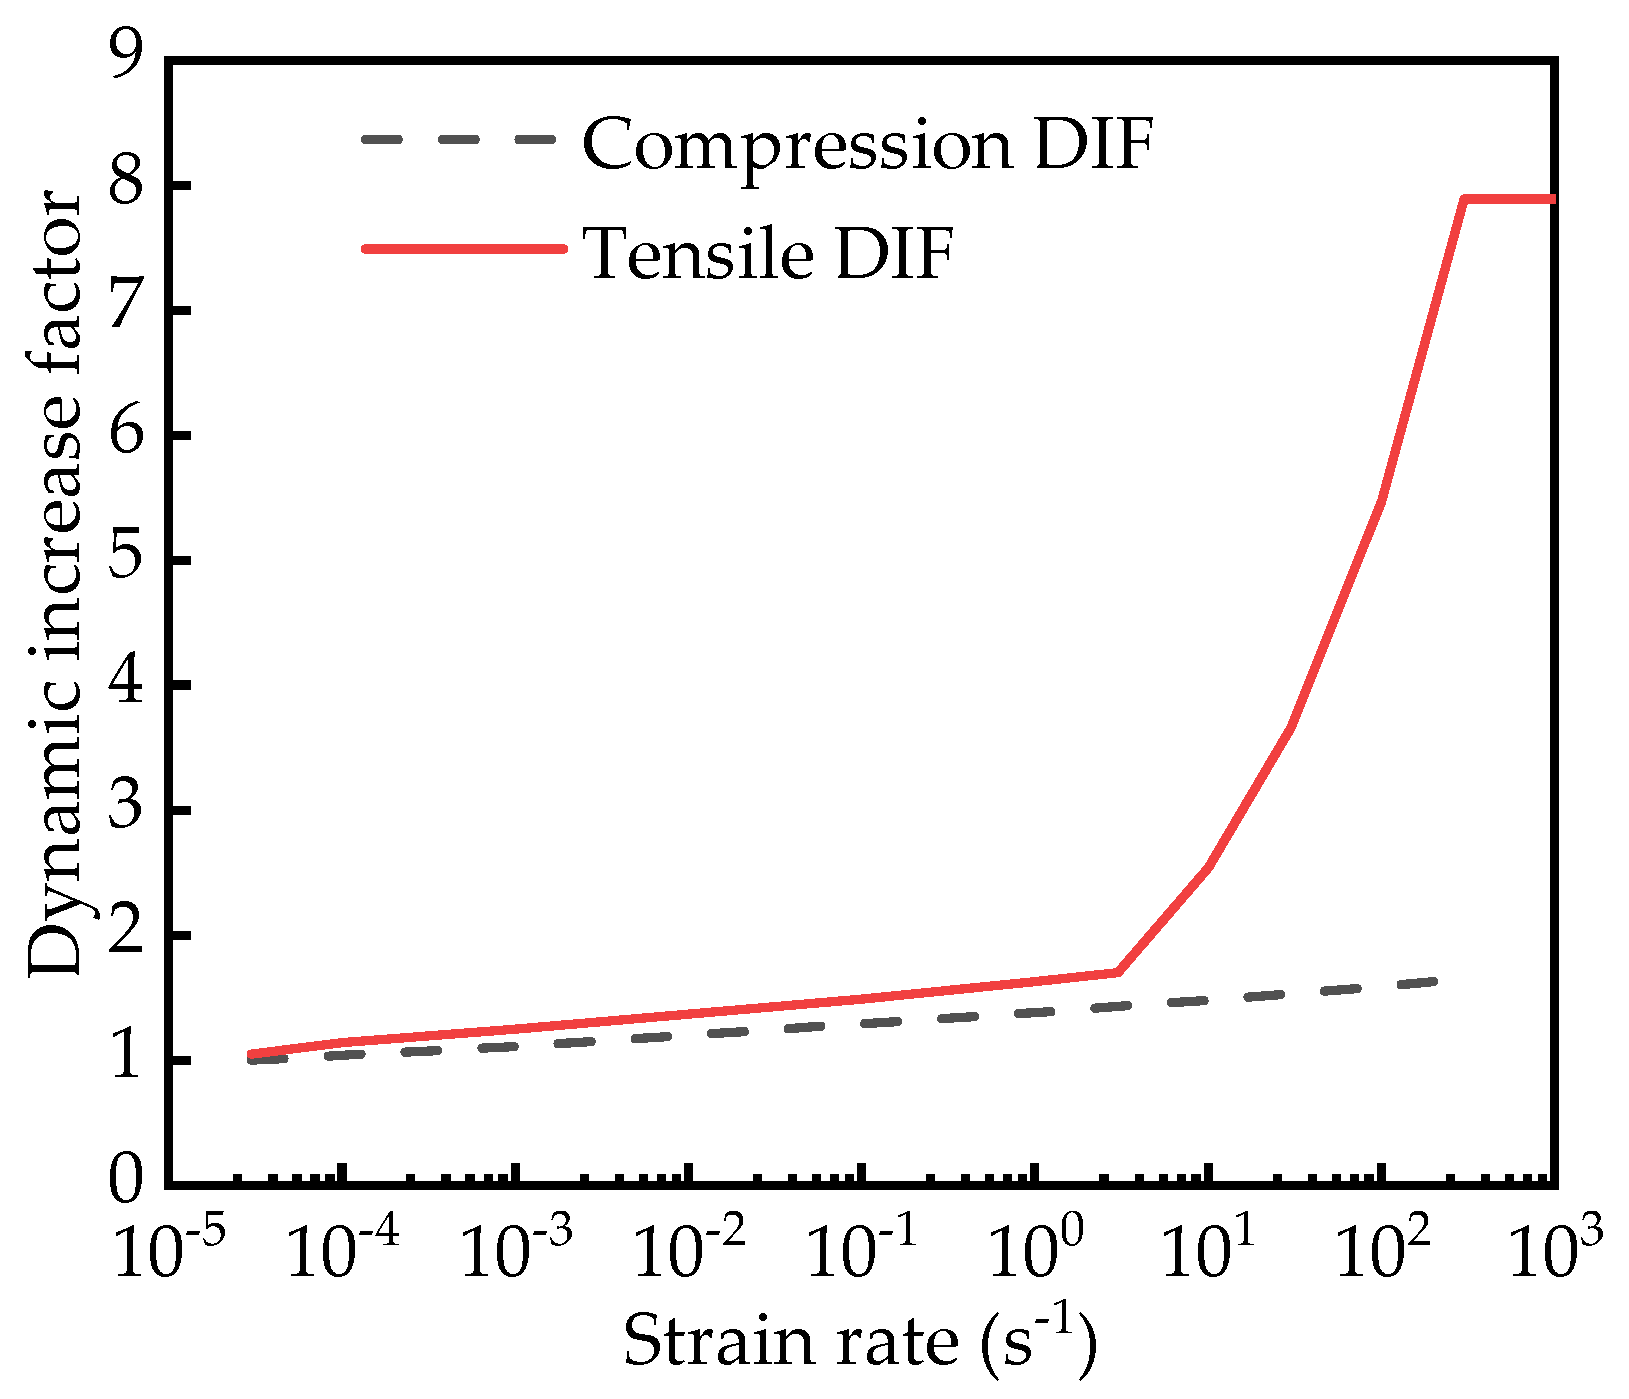
This paper requires the use of compression dynamic increase factor (CDIF) and tension dynamic increase factor (TDIF).
Based on the empirical function provided by the CEB model [56], the CDIF of concrete was determined.
C D I F = ε ˙ ε ˙ s 1.026 α ε ˙ 10 6 s 1 γ ε ˙ ε ˙ s 1 / 3 ε ˙ > 10 6 s 1
γ = 10 6.156 α 2
α = 1 5 + 9 f c / f c o
where ε ˙ is the strain rate of dynamic load, ε ˙ s is the strain rate of static load, ε ˙ s = 3 × 10 5 s 1 ; f c is the unconfined compressive strength of concrete, f c = 31.3   MPa ; f c o = 1450   psi = 10   MPa .
According to Malvar and Crawford [57,58], the TDIF of concrete is as follows:
T D I F = ε ˙ ε ˙ s δ ε ˙ 1.0 s 1 β ε ˙ ε ˙ s 1 / 3 ε ˙ > 1.0 s 1
β = 10 6 δ 2
δ = 1 1 + 8 f c / f c o
The DIF curves of compression and tension for concrete are shown in Figure 4. The material parameters of concrete are shown in Table 2.

3.2.3. Boundary Conditions and Blast Loading

Select all nodes within 10 cm of each end of the RC column, and constrain the displacement in three directions of the selected nodes to simulate the boundary conditions of the fixture fixed column at both ends. Use keyword *LOAD_BLAST_ENHANCED to activate the Conventional Weapon Effects Program (CONWEP) data to generate overpressure time curves related to charge volume and detonation center distance, which act on the detonation face of the column. The parameters are consistent with the experiment, with a charge of 0.4 kg and a blast distance of 0.5 m.

3.3. Model Validation for Numerical Simulation

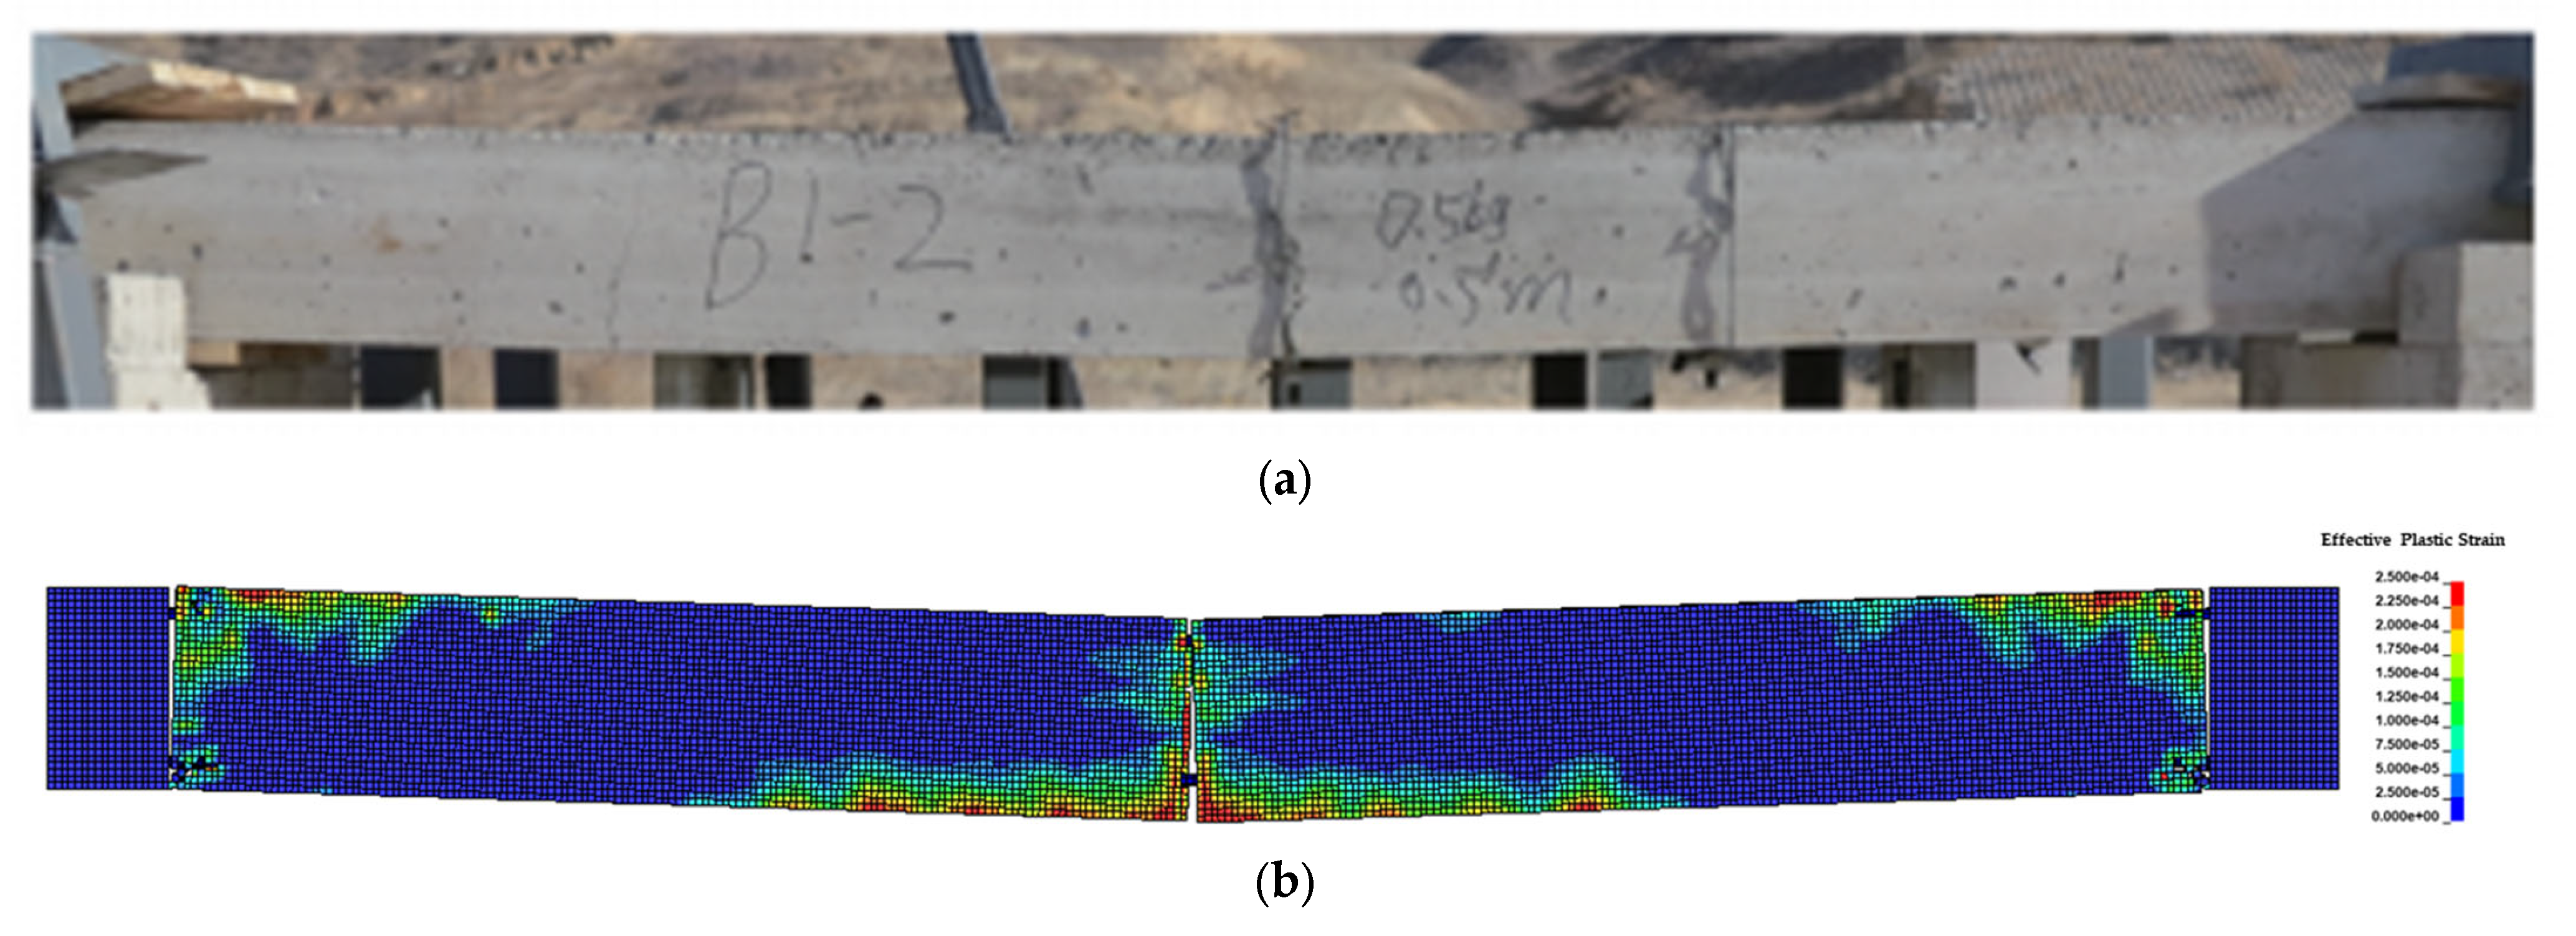
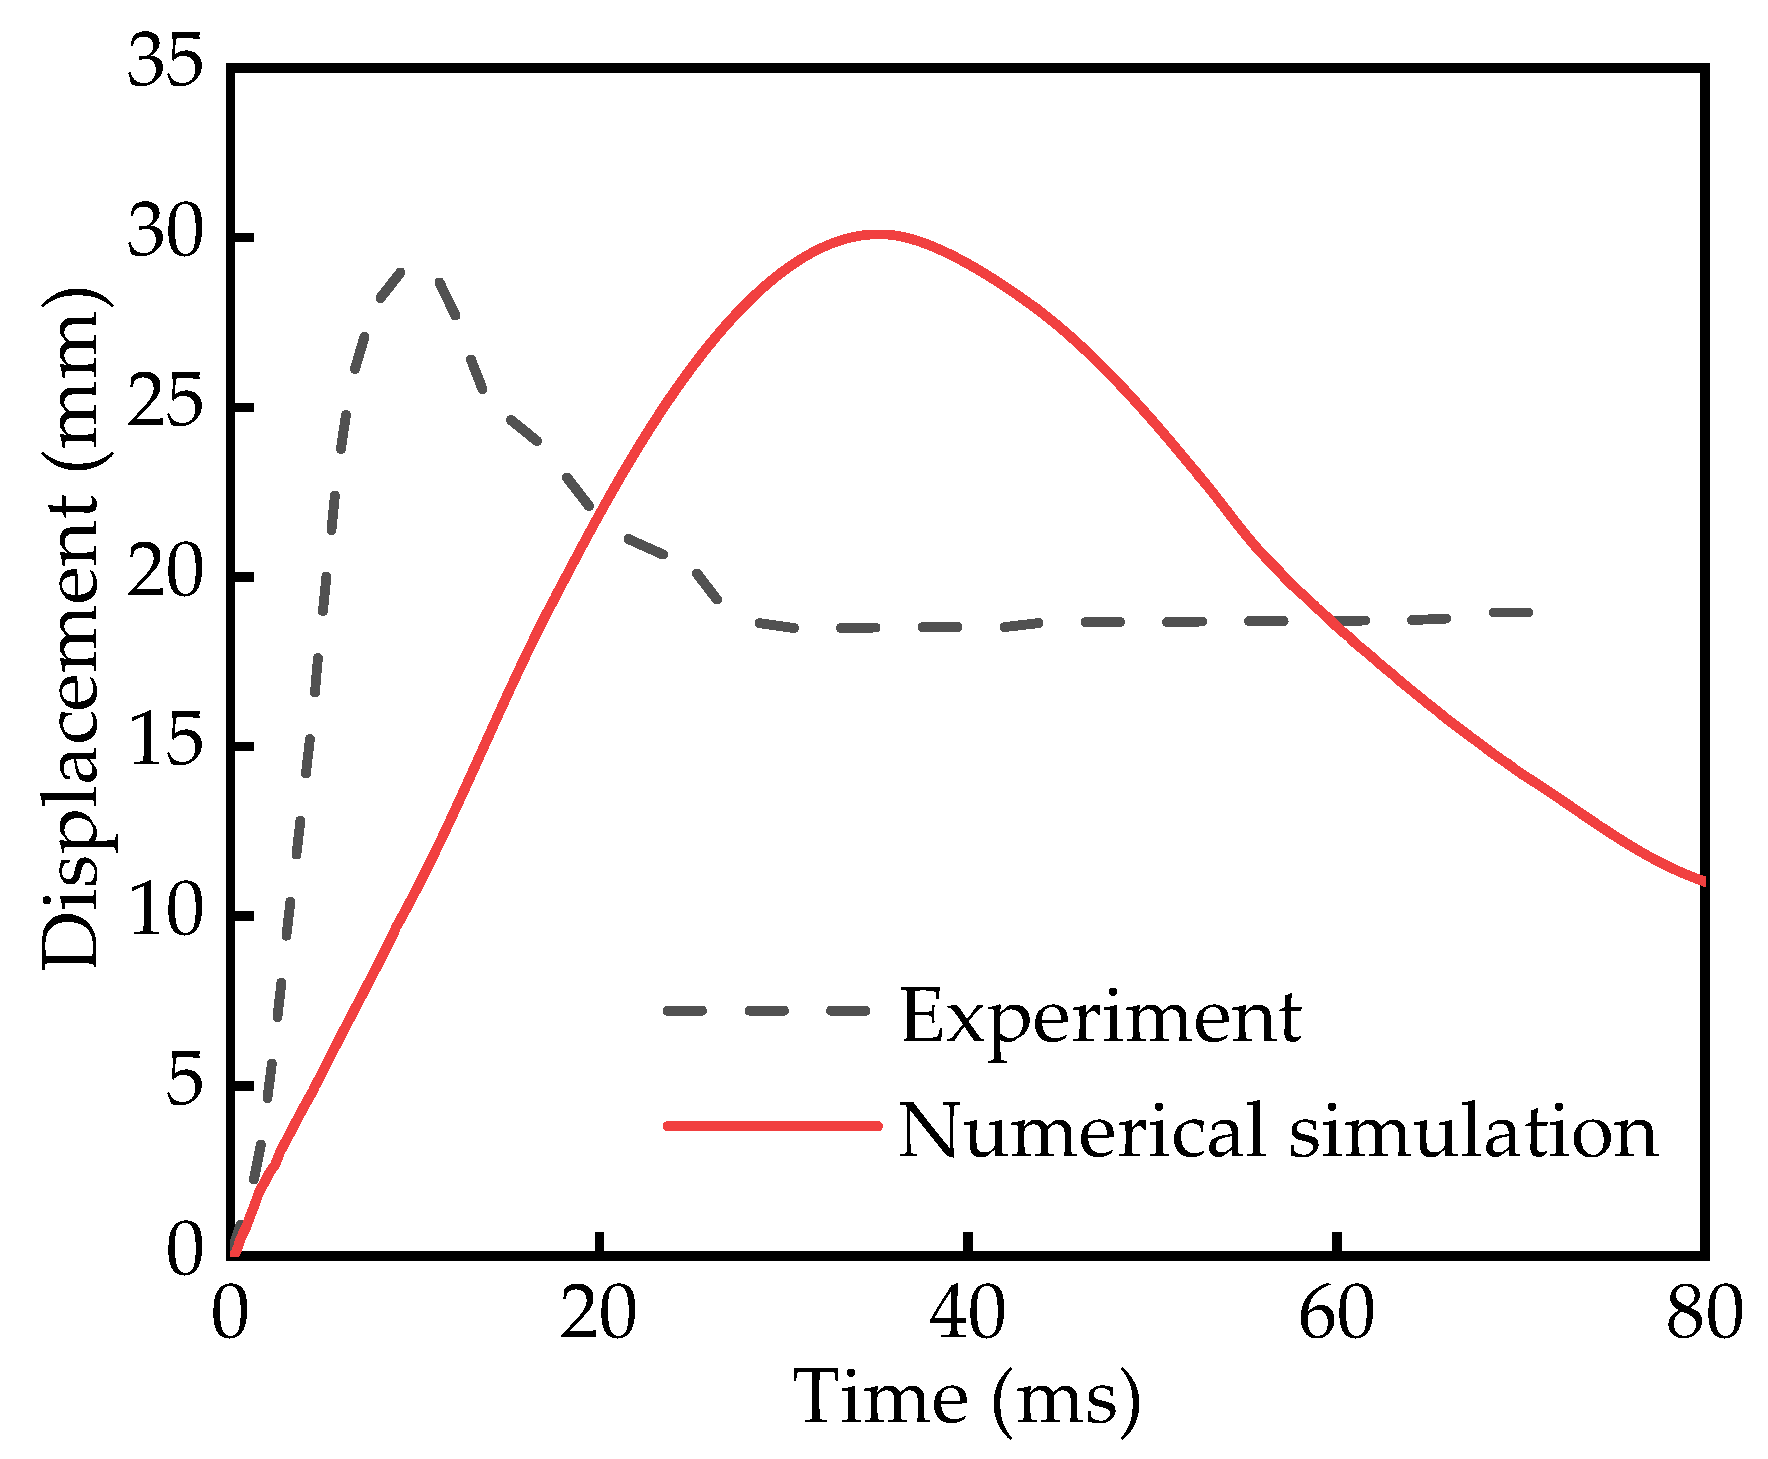
The comparison of experimental and numerical simulation failure characteristics of RC columns is shown in Figure 5. From Figure 5, it can be seen that both the experimental and simulated failure modes exhibit cracks at the mid-span position. The comparison between the experimental results and numerical simulation results of the displacement time–history curve at the mid-span of RC columns is shown in Figure 6. From Figure 6, it can be seen that the trend of the mid-span displacement time–history curve in the experiment and numerical simulation is consistent. The mid-span peak displacement in the experiment is 29.4 mm, while the mid-span peak displacement in the numerical simulation is 30.1 mm. From this, it can be concluded that the error between the numerical simulation result and the experimental result of the mid-span peak displacement is 2.38%. The numerical simulation result is in good agreement with the experimental result, and this numerical calculation model can be used for simulation.

3.4. Failure Types of RC Columns

Under the action of explosion load, RC columns mainly have three typical failure modes: bending failure, oblique shear failure, and direct shear failure. When the explosion load is small, the bending failure of the RC column occurs. As the explosion load further increases, the RC column will undergo oblique shear failure. When the explosion load is large, the RC column will undergo shear failure. In the process of design and use, we should try our best to avoid the occurrence of shear failure, because once the shear failure occurs, the RC column will fail instantly, which will cause great loss of life and property in the building. The failure modes involved in this paper are mainly bending failure and oblique shear failure.

4. Numerical Simulation of Dynamic Response of RC Columns under Blast Loading

4.1. Introduction of the Numerical Model

Adjust the numerical calculation model appropriately according to the experimental conditions to analyze the dynamic response law of RC columns under blast loads. Simulate the dynamic response of RC columns under blast loads by changing the reinforcement ratio, stirrup ratio, strength of longitudinal reinforcement, strength of concrete, and scale distance. The reinforcement ratio is changed in two ways: one keeps the number of longitudinal reinforcement unchanged, but the diameter of longitudinal reinforcement changes, and the other keeps the diameter of longitudinal reinforcement unchanged but the number of longitudinal reinforcement changes. The stirrup ratio is also changed in two ways, one is to keep the stirrup spacing unchanged, but the diameter of the stirrup changes, and the other is to keep the diameter of the stirrup unchanged, but the stirrup spacing changes. The standard group selected RC columns of the same size as the experiment, with four longitudinal reinforcements and ten stirrups arranged. The longitudinal reinforcement is HRB400 with a diameter of 12 mm, and the stirrup is HPB300 with a diameter of 6.5 mm. The strength grade of concrete is C30, and the uniaxial compressive strength of concrete is 30 MPa.

4.2. Working Conditions for Numerical Simulation

The concrete density used for reinforced concrete columns is 2400 kg·m−3; Poisson’s ratio is 0.2. The density of the steel bar is 7850 kg·m3, Young’s modulus is 207 GPa, Poisson’s ratio is 0.3, the strain rate parameter C is 40 s−1, the strain rate parameter P is 5, the effective plastic strain of the erosion element is 0.15, the tangent modulus is 2.06 GPa, and the yield strength of the stirrups is 300 MPa. The specific working conditions are shown in Table 3.

5. The Variation Law of Mid-Span Displacement

5.1. Reinforcement Ratio Diameter of Longitudinal Reinforcement

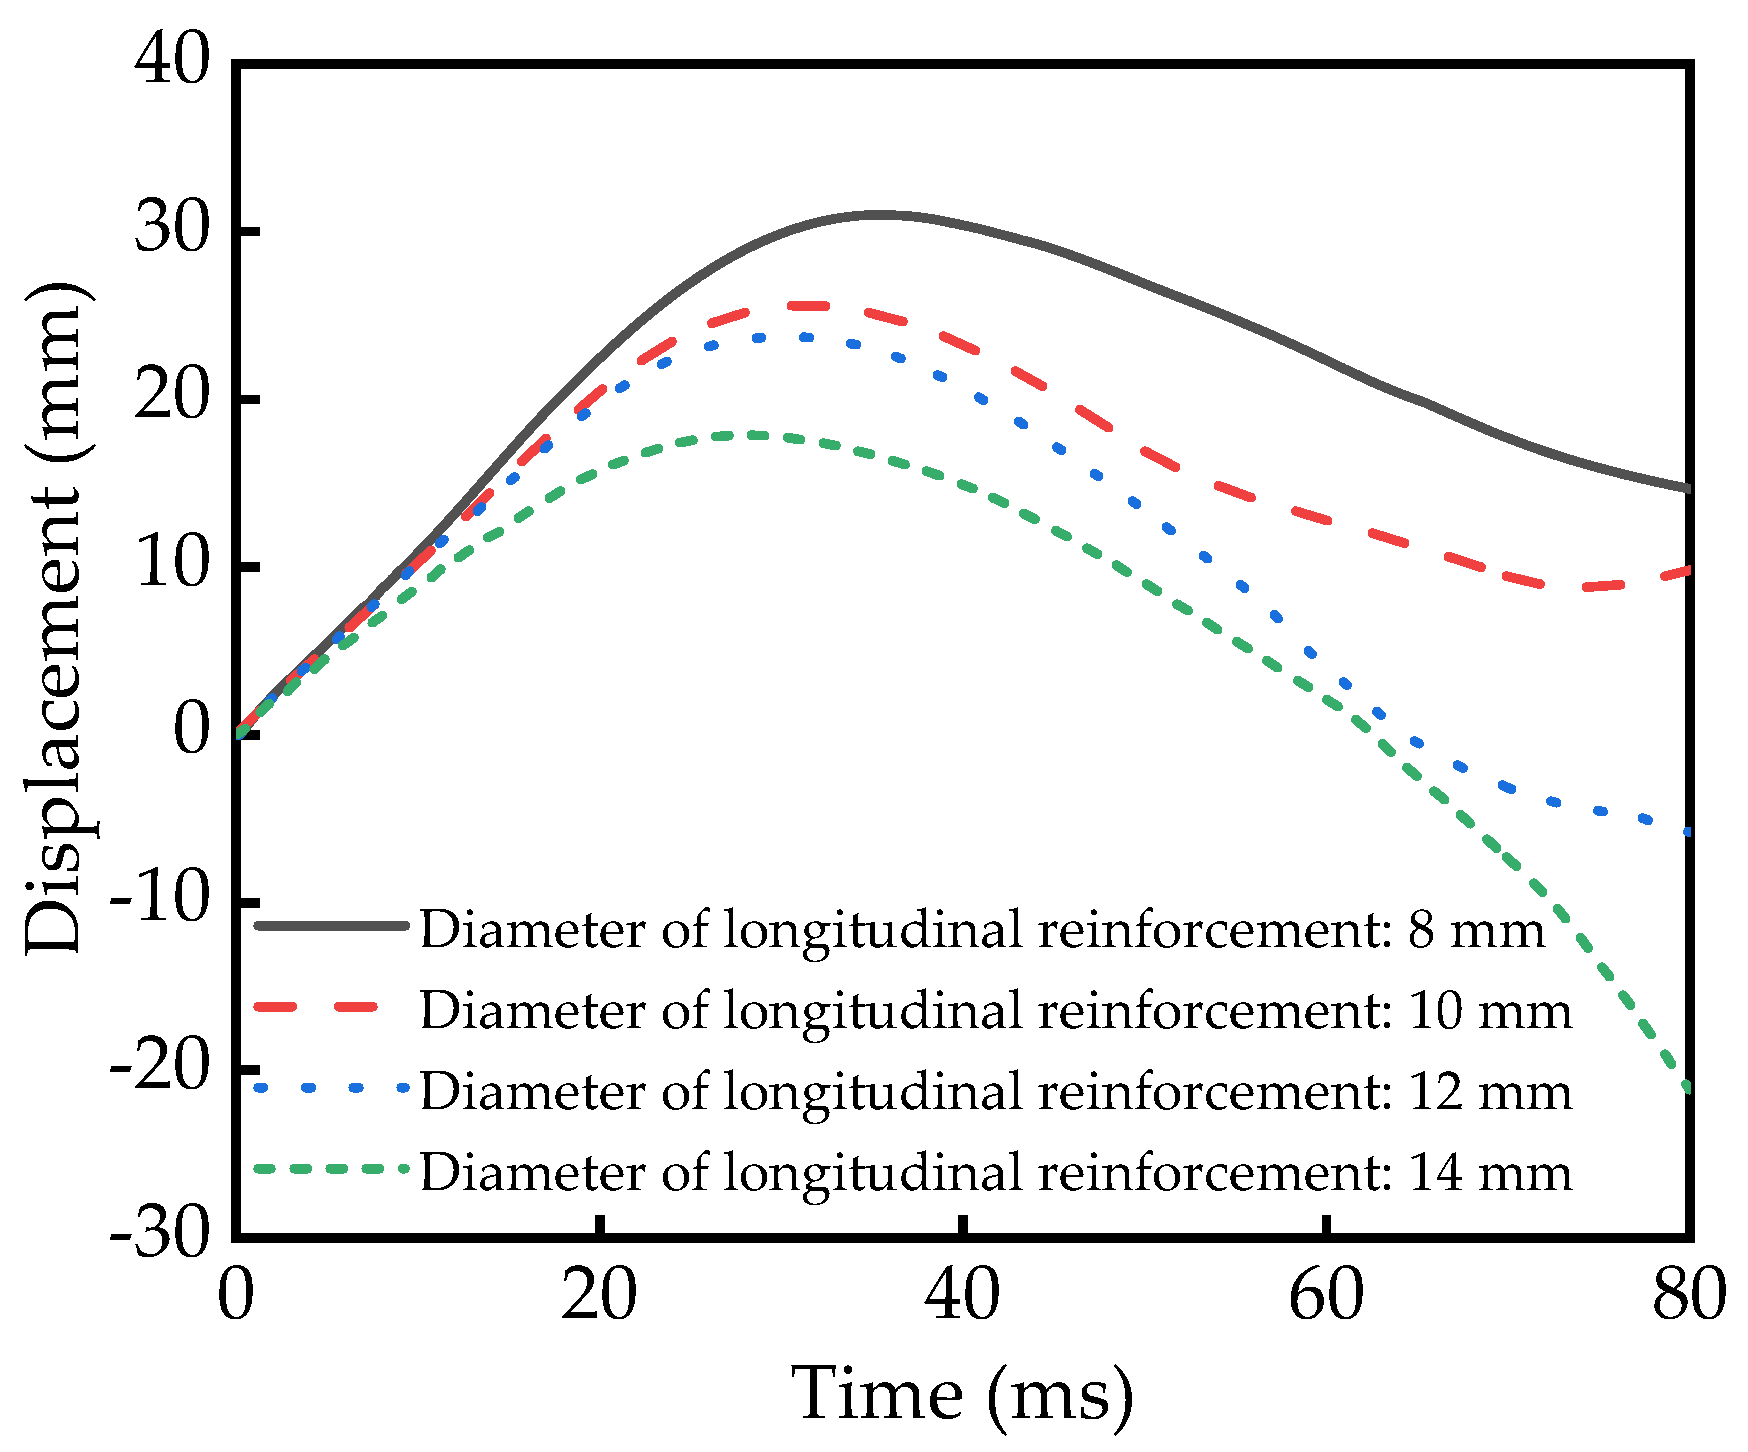
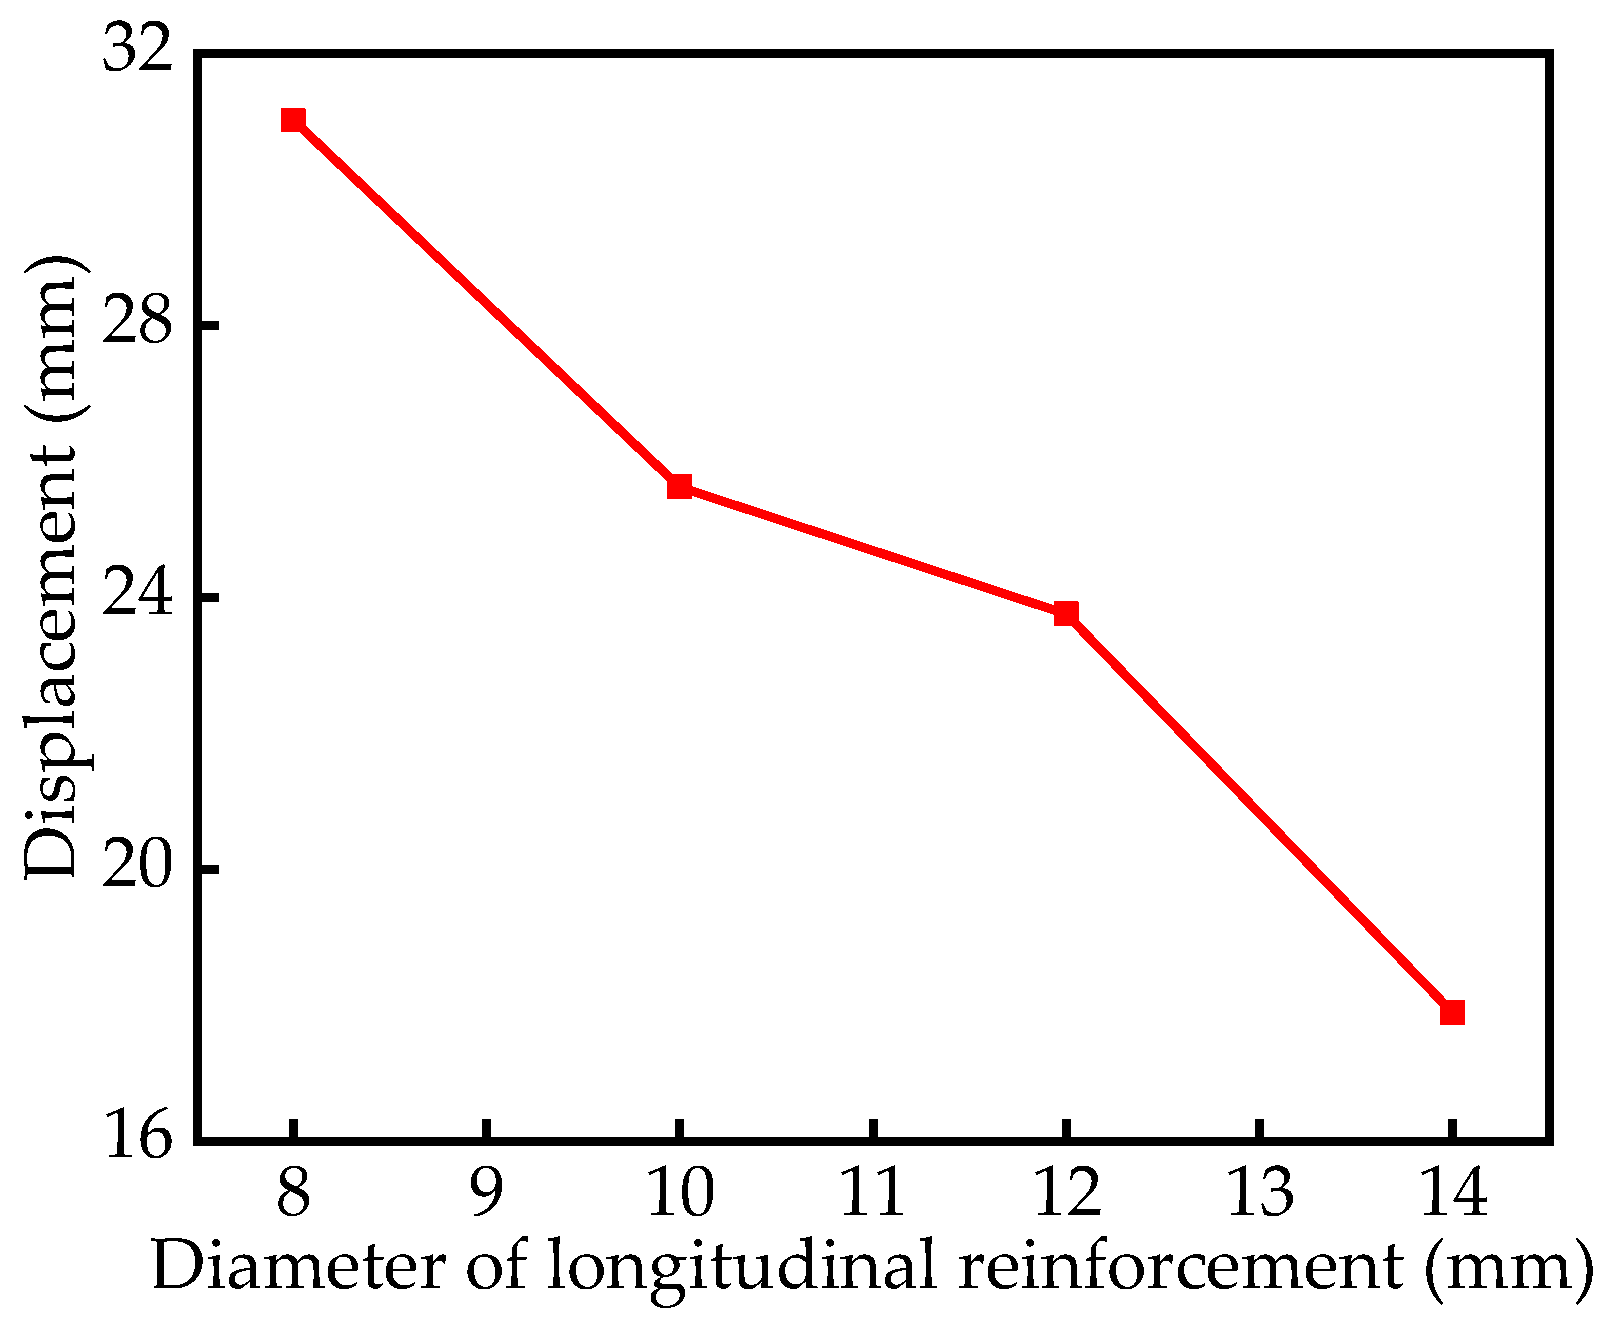
When the diameter of the longitudinal reinforcement changes, the variation law of the time–history curve of the mid-span displacement of the RC column is shown in Figure 7, the results of the mid-span peak displacement are shown in Table 4, and the variation law of the mid-span peak displacement is shown in Figure 8. When the diameters of longitudinal reinforcements are 8, 10, 12, and 14 mm, the reinforcement ratios are 0.89%, 1.40%, 2.01%, and 2.74%, respectively. The mid-span peak displacement of RC columns are 31.02, 25.63, 23.76, and 17.89 mm, respectively. The results show that the mid-span peak displacement of RC columns decreases with the increase of the diameter of longitudinal reinforcement. As the diameter of longitudinal reinforcement increases by 25%, 50%, and 75%, the corresponding mid-span peak displacement decreases by 17.40%, 23.43%, and 42.35%, respectively.

5.2. Reinforcement Ratio Number of Longitudinal Reinforcement

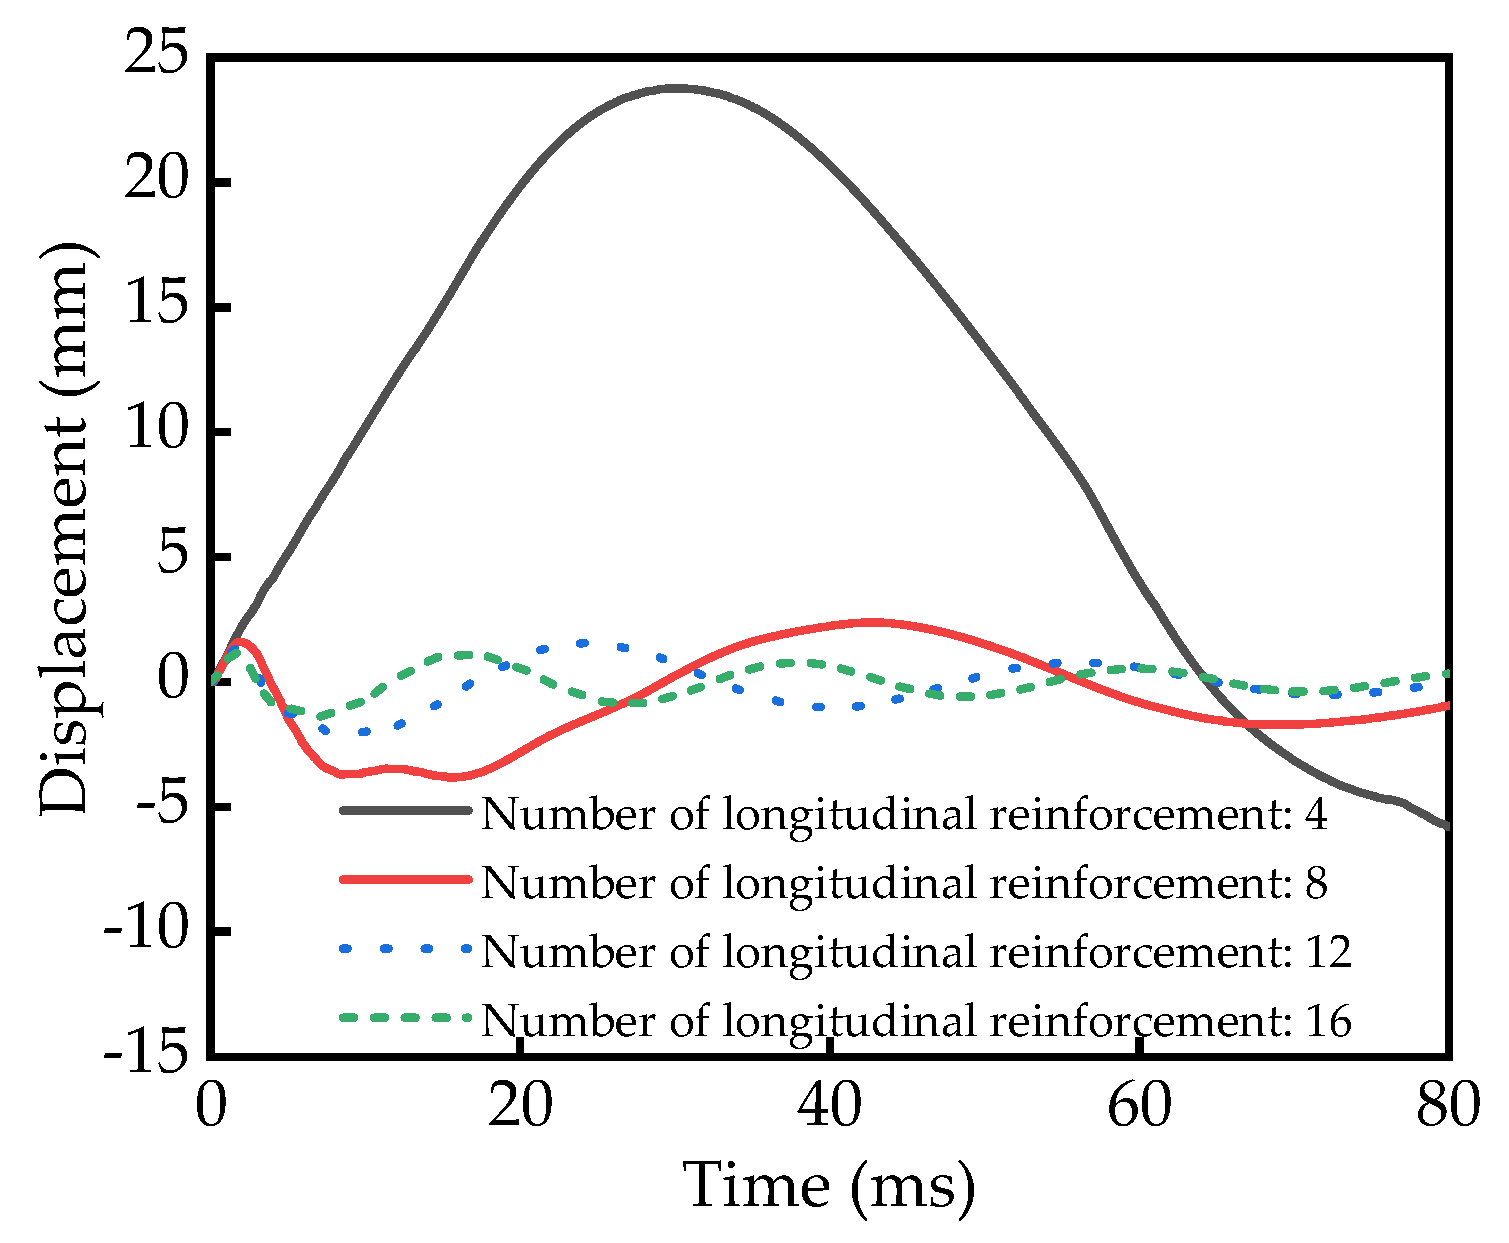
When the number of the longitudinal reinforcement changes, the variation law of the time history curve of the mid-span displacement of the RC column is shown in Figure 9, the results of the mid-span peak displacement are shown in Table 5, and the variation law of the mid-span peak displacement is shown in Figure 10. When the number of longitudinal reinforcements are 4, 8, 12 and 16, the reinforcement ratios are 2.01%, 4.02%, 6.03%, and 8.04%, respectively. The mid-span peak displacement of RC columns are 23.76, 1.62, 1.31, and 1.18 mm, respectively. The results show that the mid-span peak displacement of RC columns decreases with the increase of the diameter of longitudinal reinforcement. As the diameter of longitudinal reinforcement increases by 100%, 200%, and 300%, the corresponding mid-span peak displacement decreases by 93.18%, 94.49%, and 95.03%, respectively.

5.3. Stirrup Ratio Diameter of Stirrup

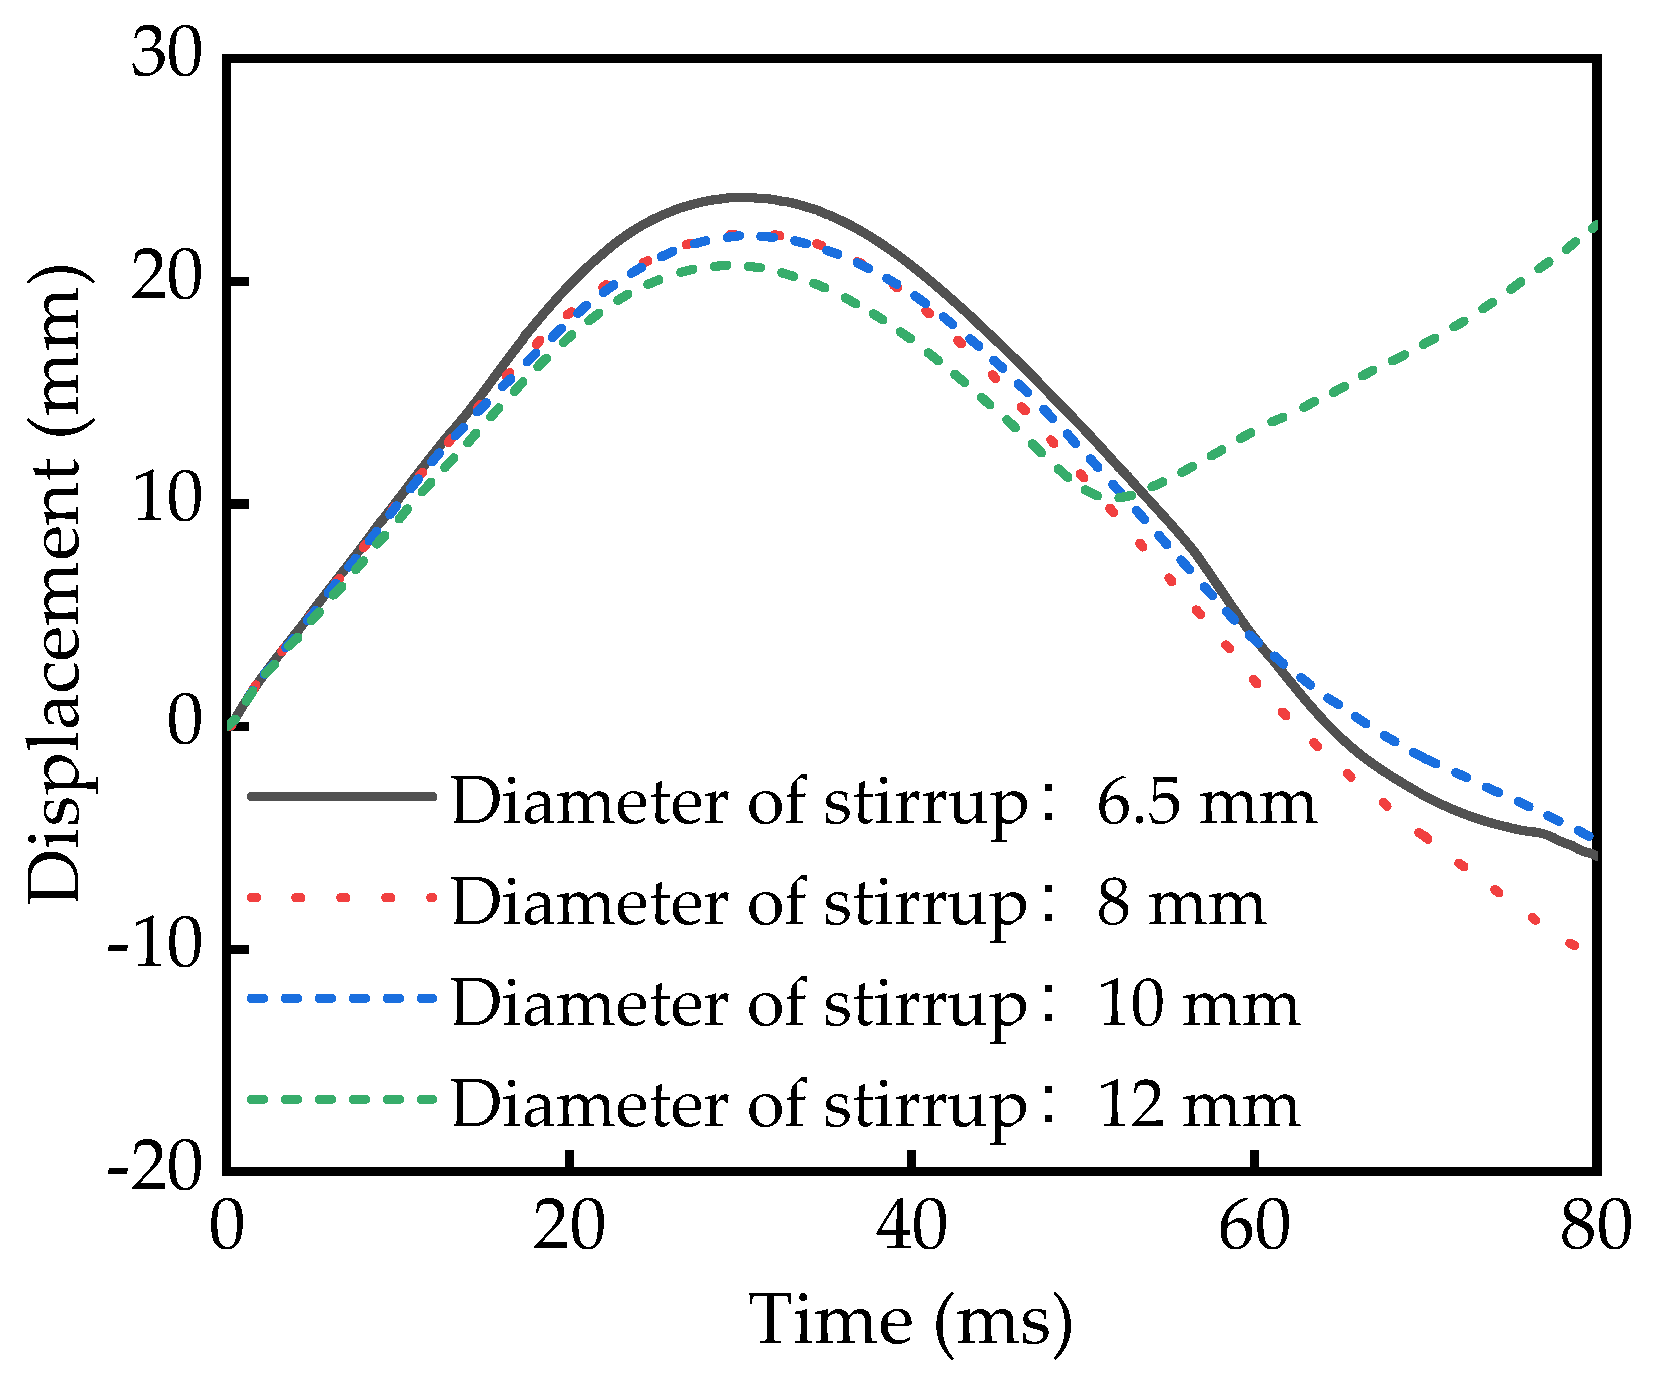
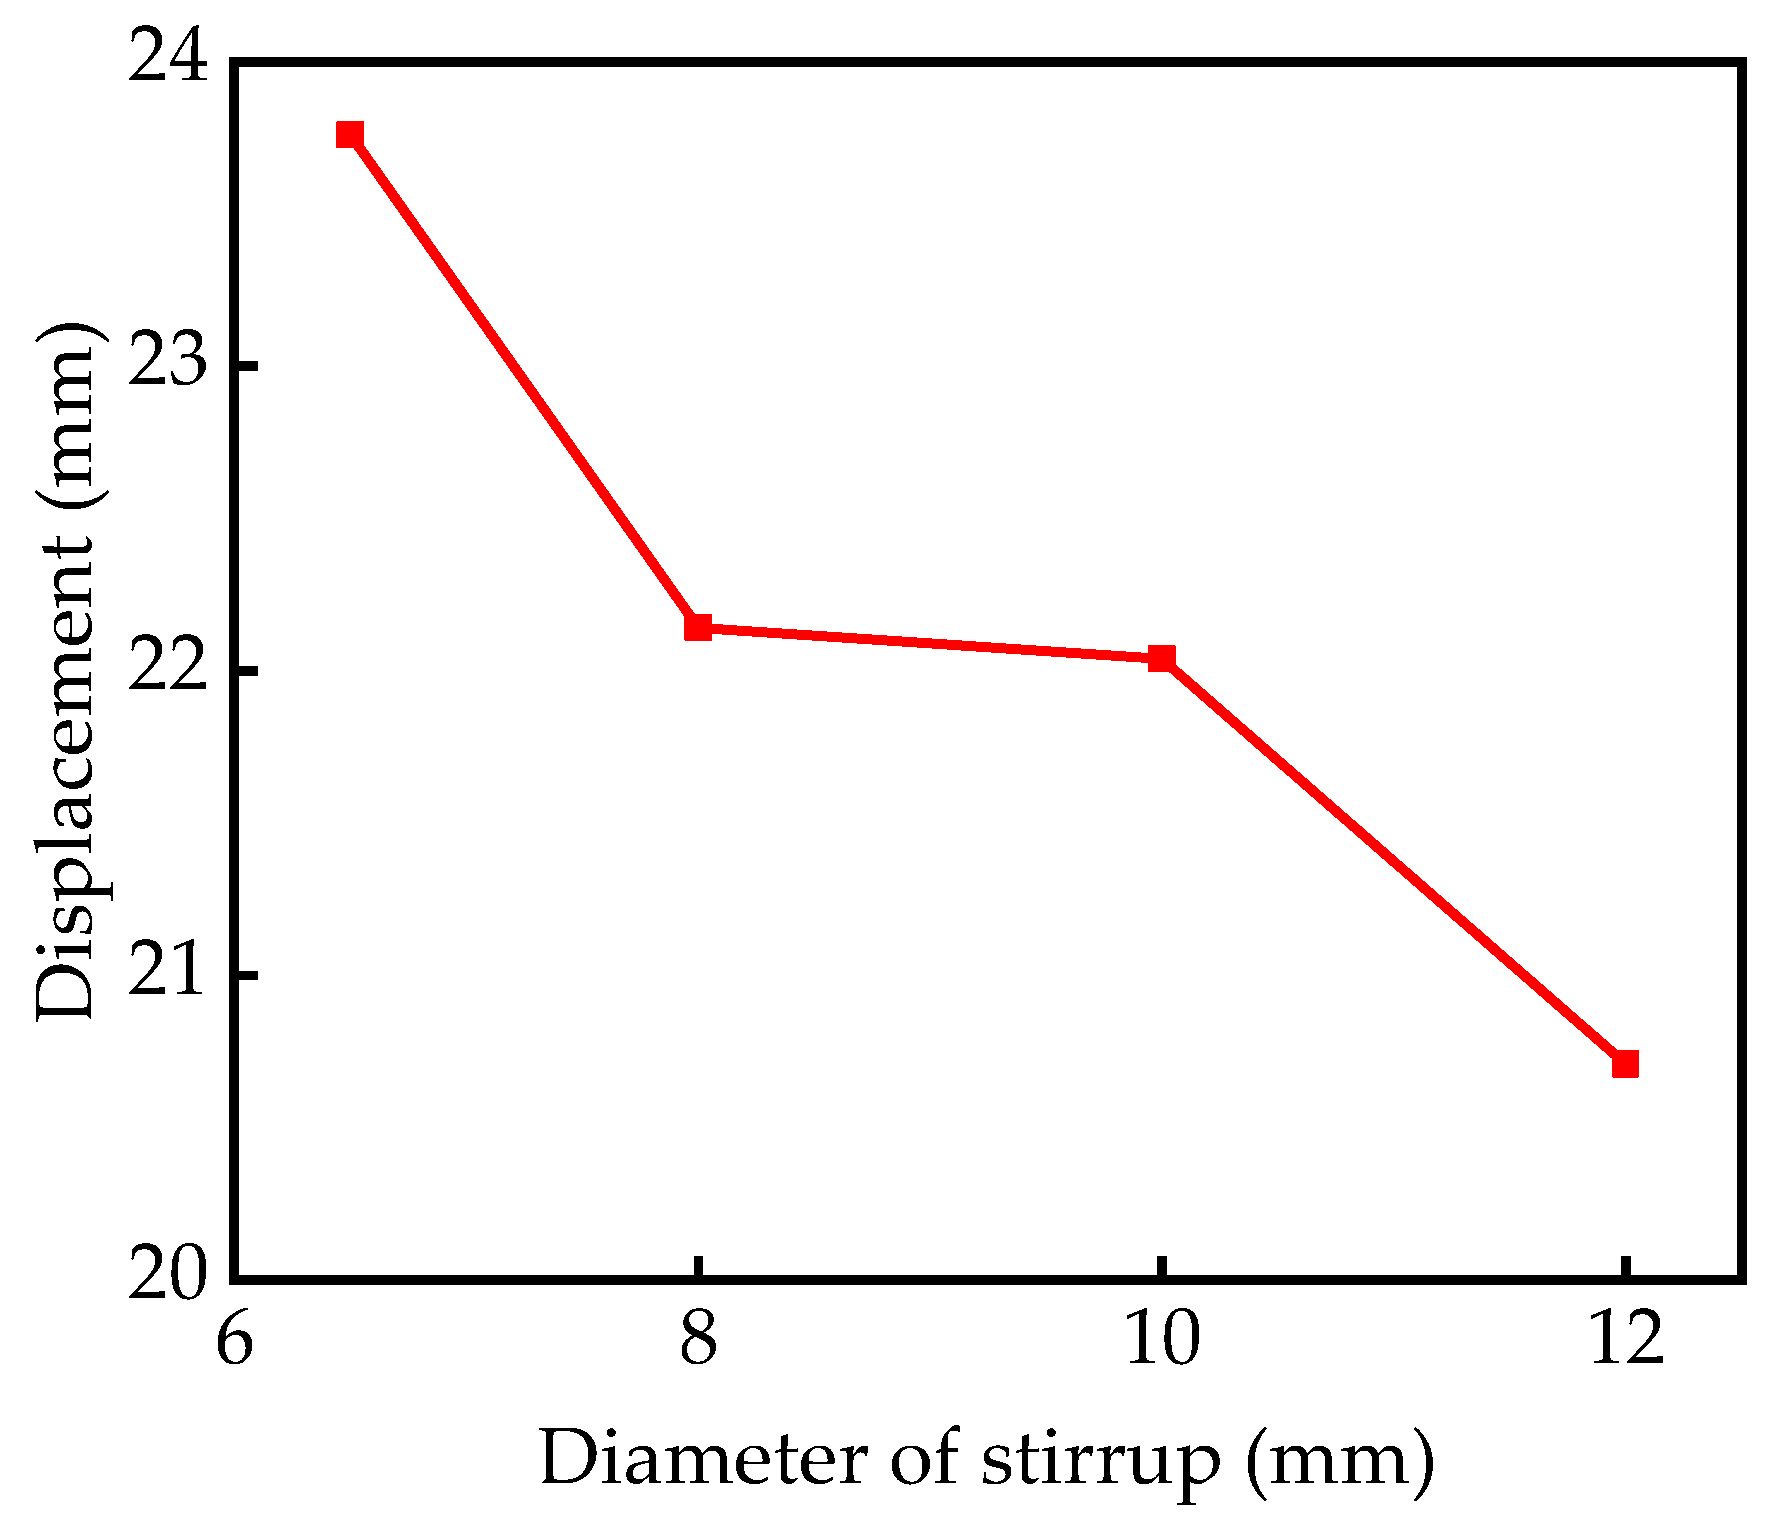
When the diameter of the stirrup changes, the variation law of the time history curve of the mid-span displacement of the RC column is shown in Figure 11, the results of the mid-span peak displacement are shown in Table 6, and the variation law of the mid-span peak displacement is shown in Figure 12. When the diameters of the stirrup are 6.5, 8, 10, and 12 mm, the stirrup ratios are 0.38%, 0.58%, 0.90%, and 1.30%, respectively. The mid-span peak displacement of RC columns are 23.76, 22.14, 22.04, and 20.71 mm, respectively. The results show that the mid-span peak displacement of RC columns decreases with the increase of the diameter of longitudinal reinforcement. As the diameter of the stirrup increases by 23.08%, 53.85%, and 84.62%, the corresponding mid-span peak displacement decreases by 6.82%, 7.24%, and 12.84%, respectively.

5.4. Stirrup Ratio–Stirrup Spacing

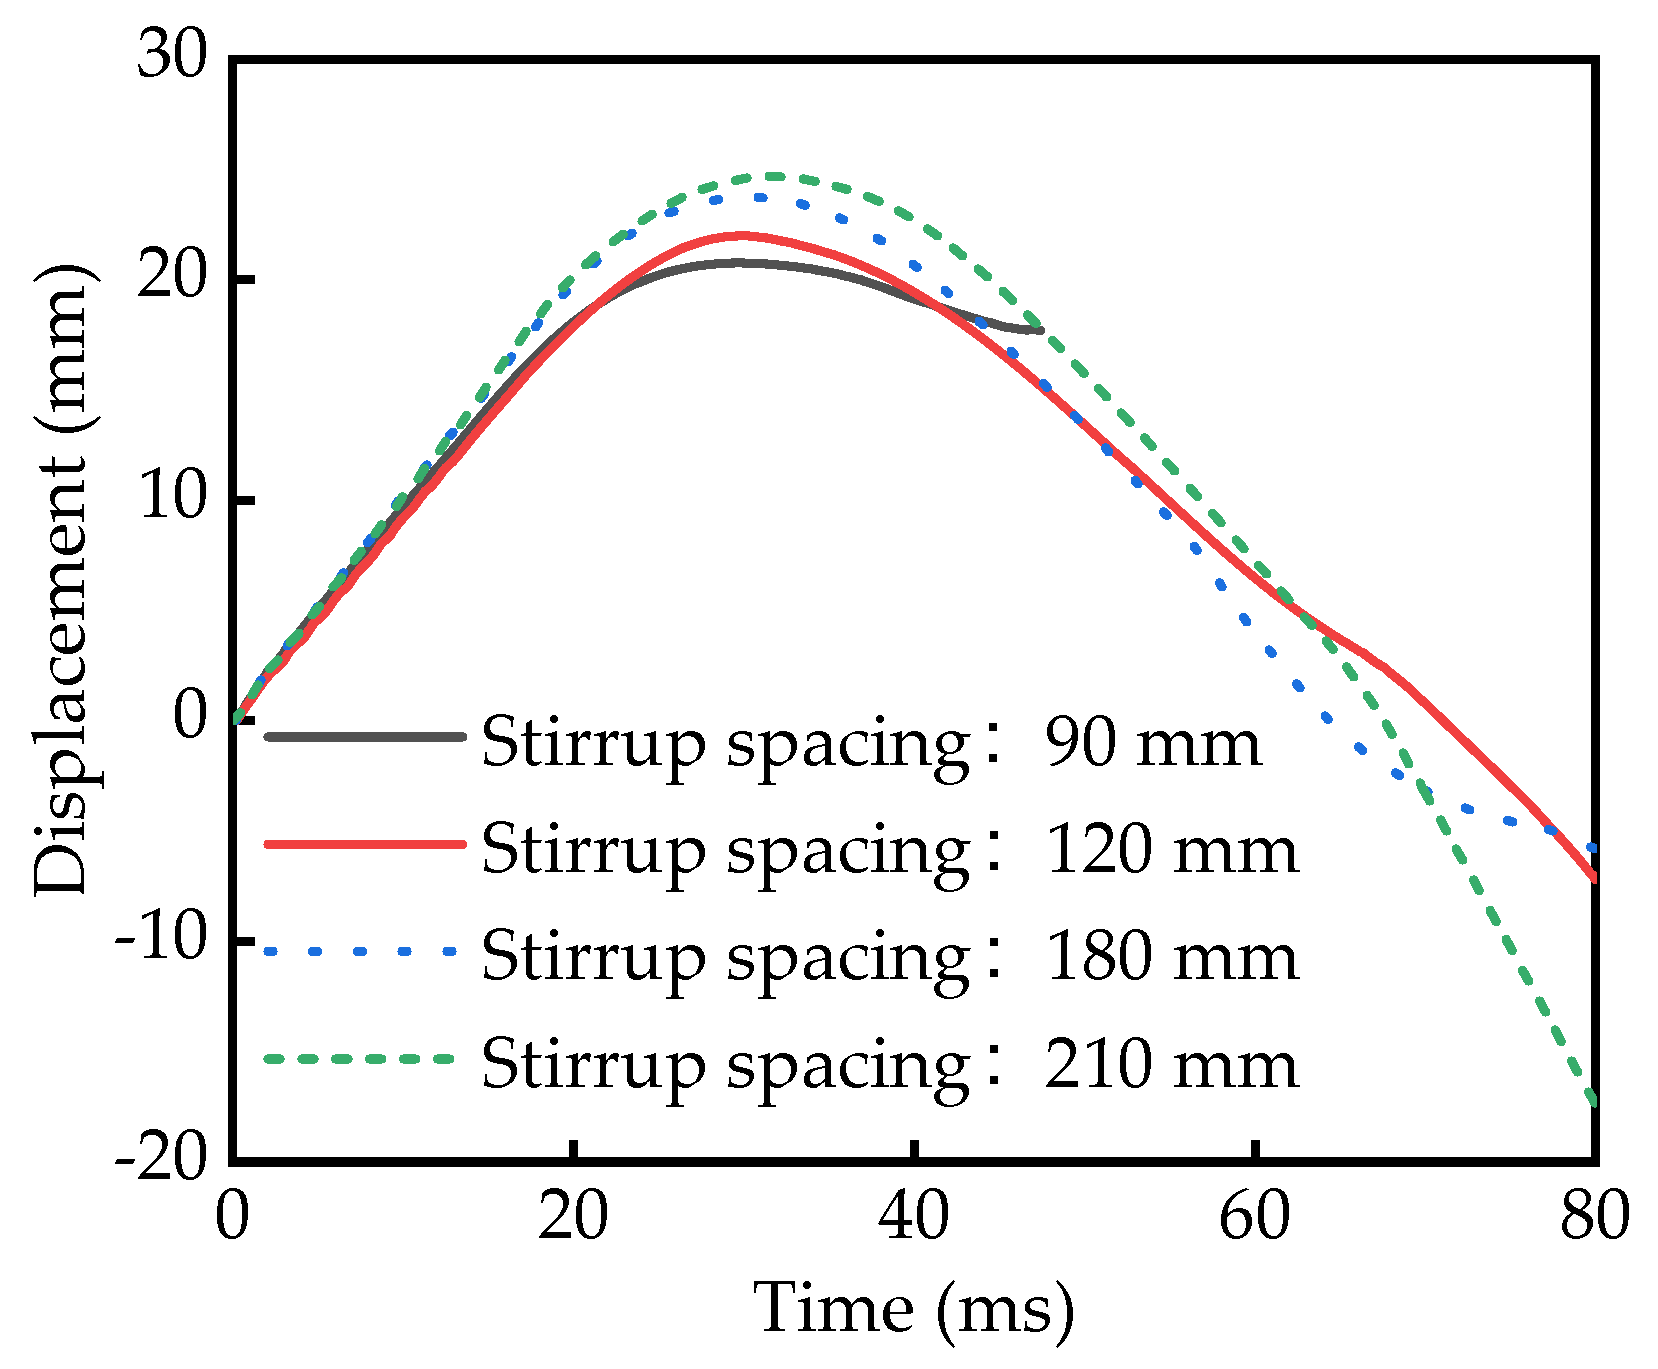
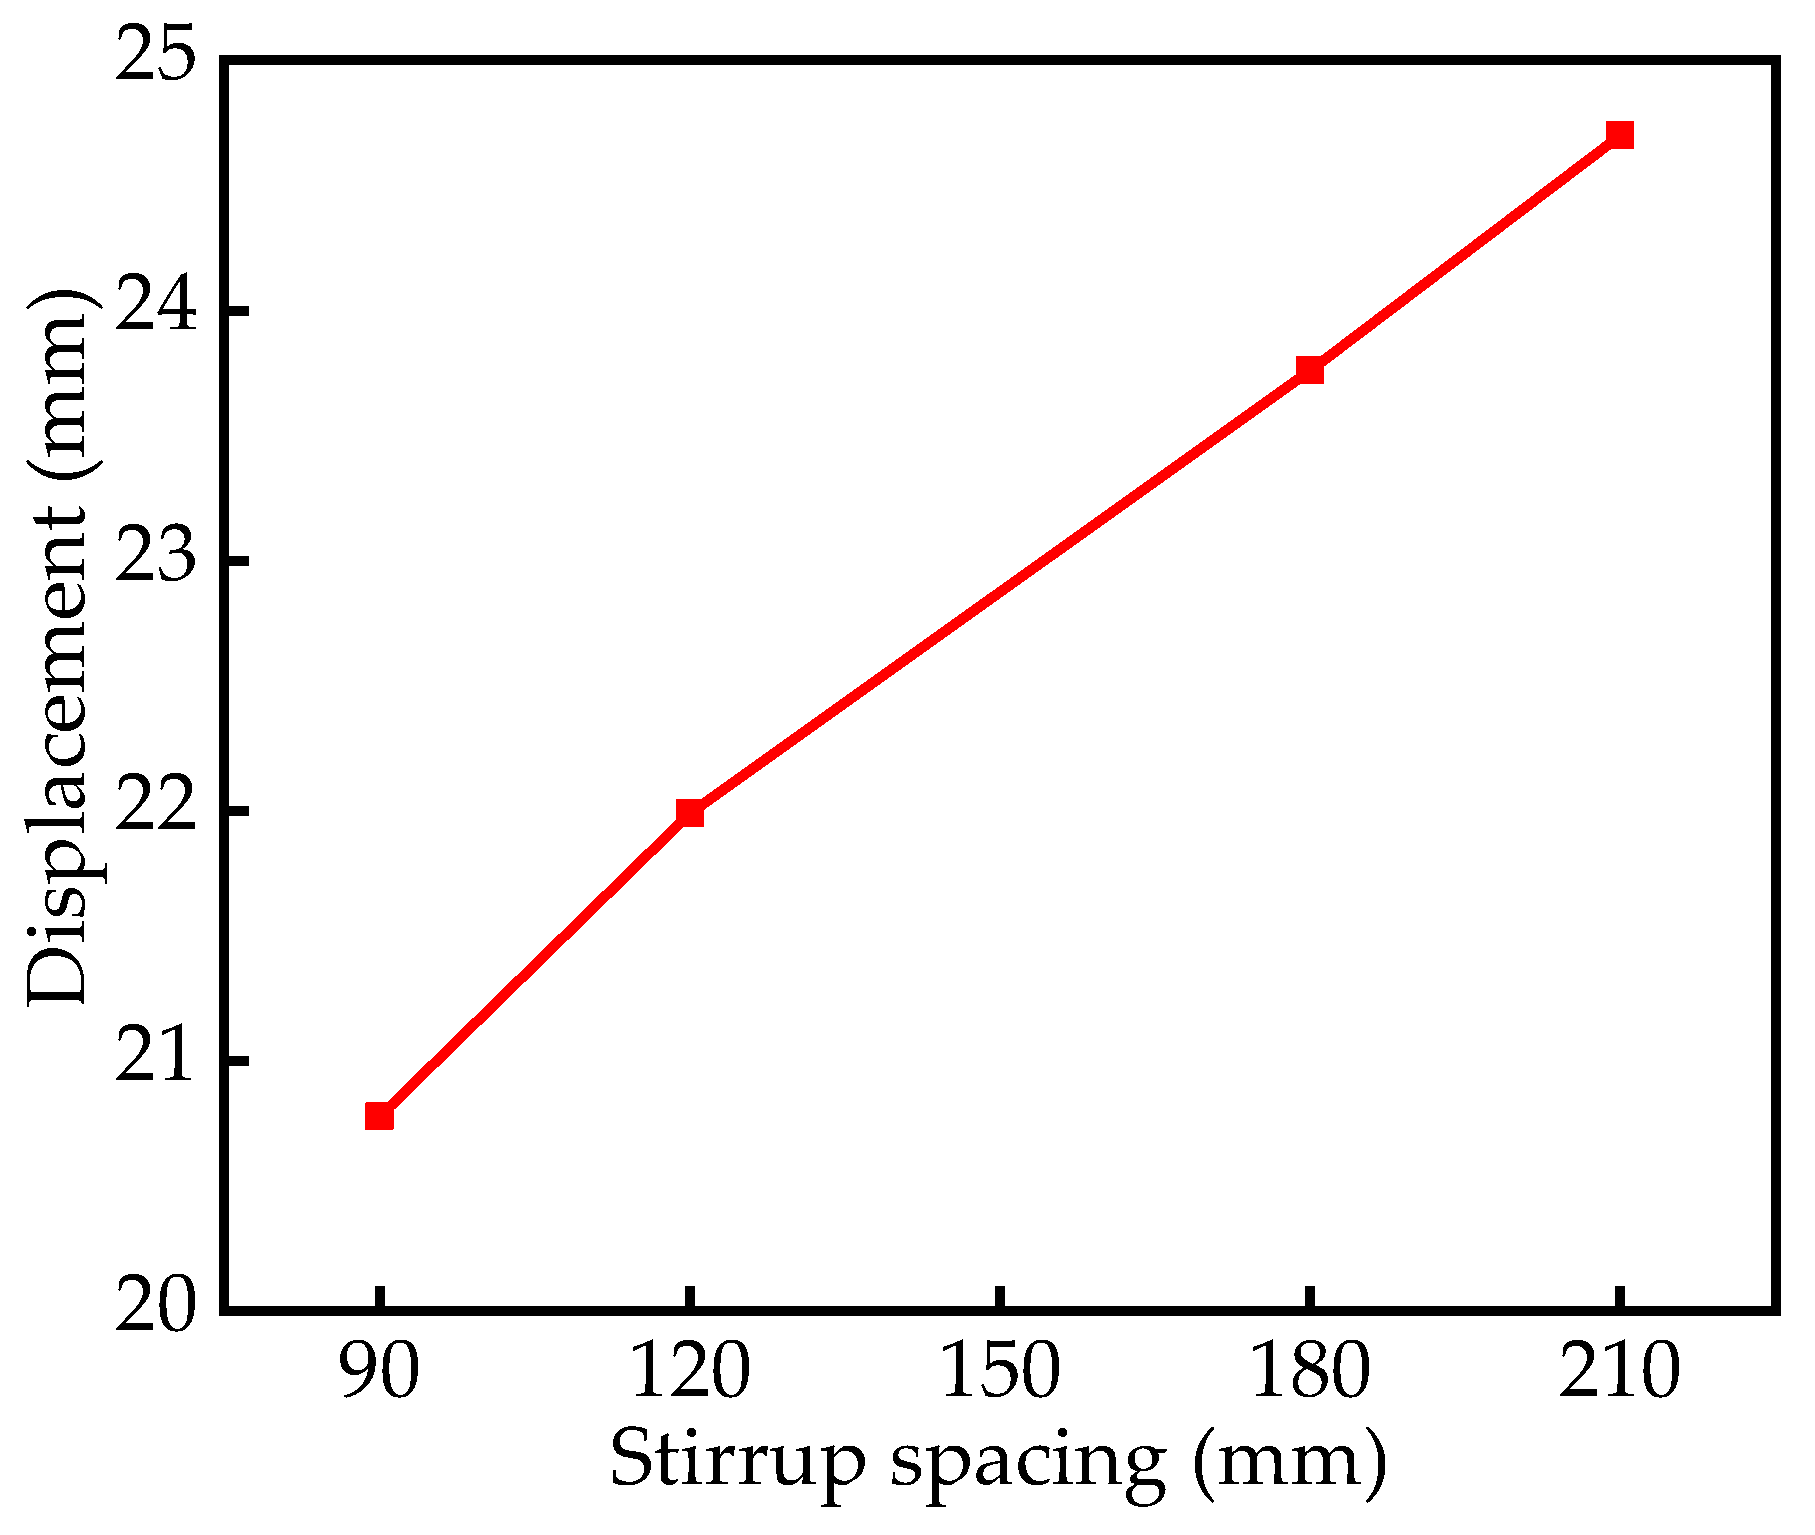
When the stirrup spacing changes, the variation law of the time history curve of the mid-span displacement of the RC column is shown in Figure 13, the results of the mid-span peak displacement are shown in Table 7, and the variation law of the mid-span peak displacement is shown in Figure 14. When the stirrup spacings are 90, 120, 180, and 210 mm, the stirrup ratios are 0.69%, 0.53%, 0.38%, and 0.31%, respectively. The mid-span peak displacement of RC columns are 20.78, 21.99, 23.76, and 24.70 mm, respectively. The results show that the mid-span peak displacement of RC columns increases with the increase of the stirrup spacing. As the stirrup spacing increases by 33.33%, 100%, and 133.33%, the corresponding mid-span peak displacement increases by 5.82%, 14.34%, and 18.86%, respectively.

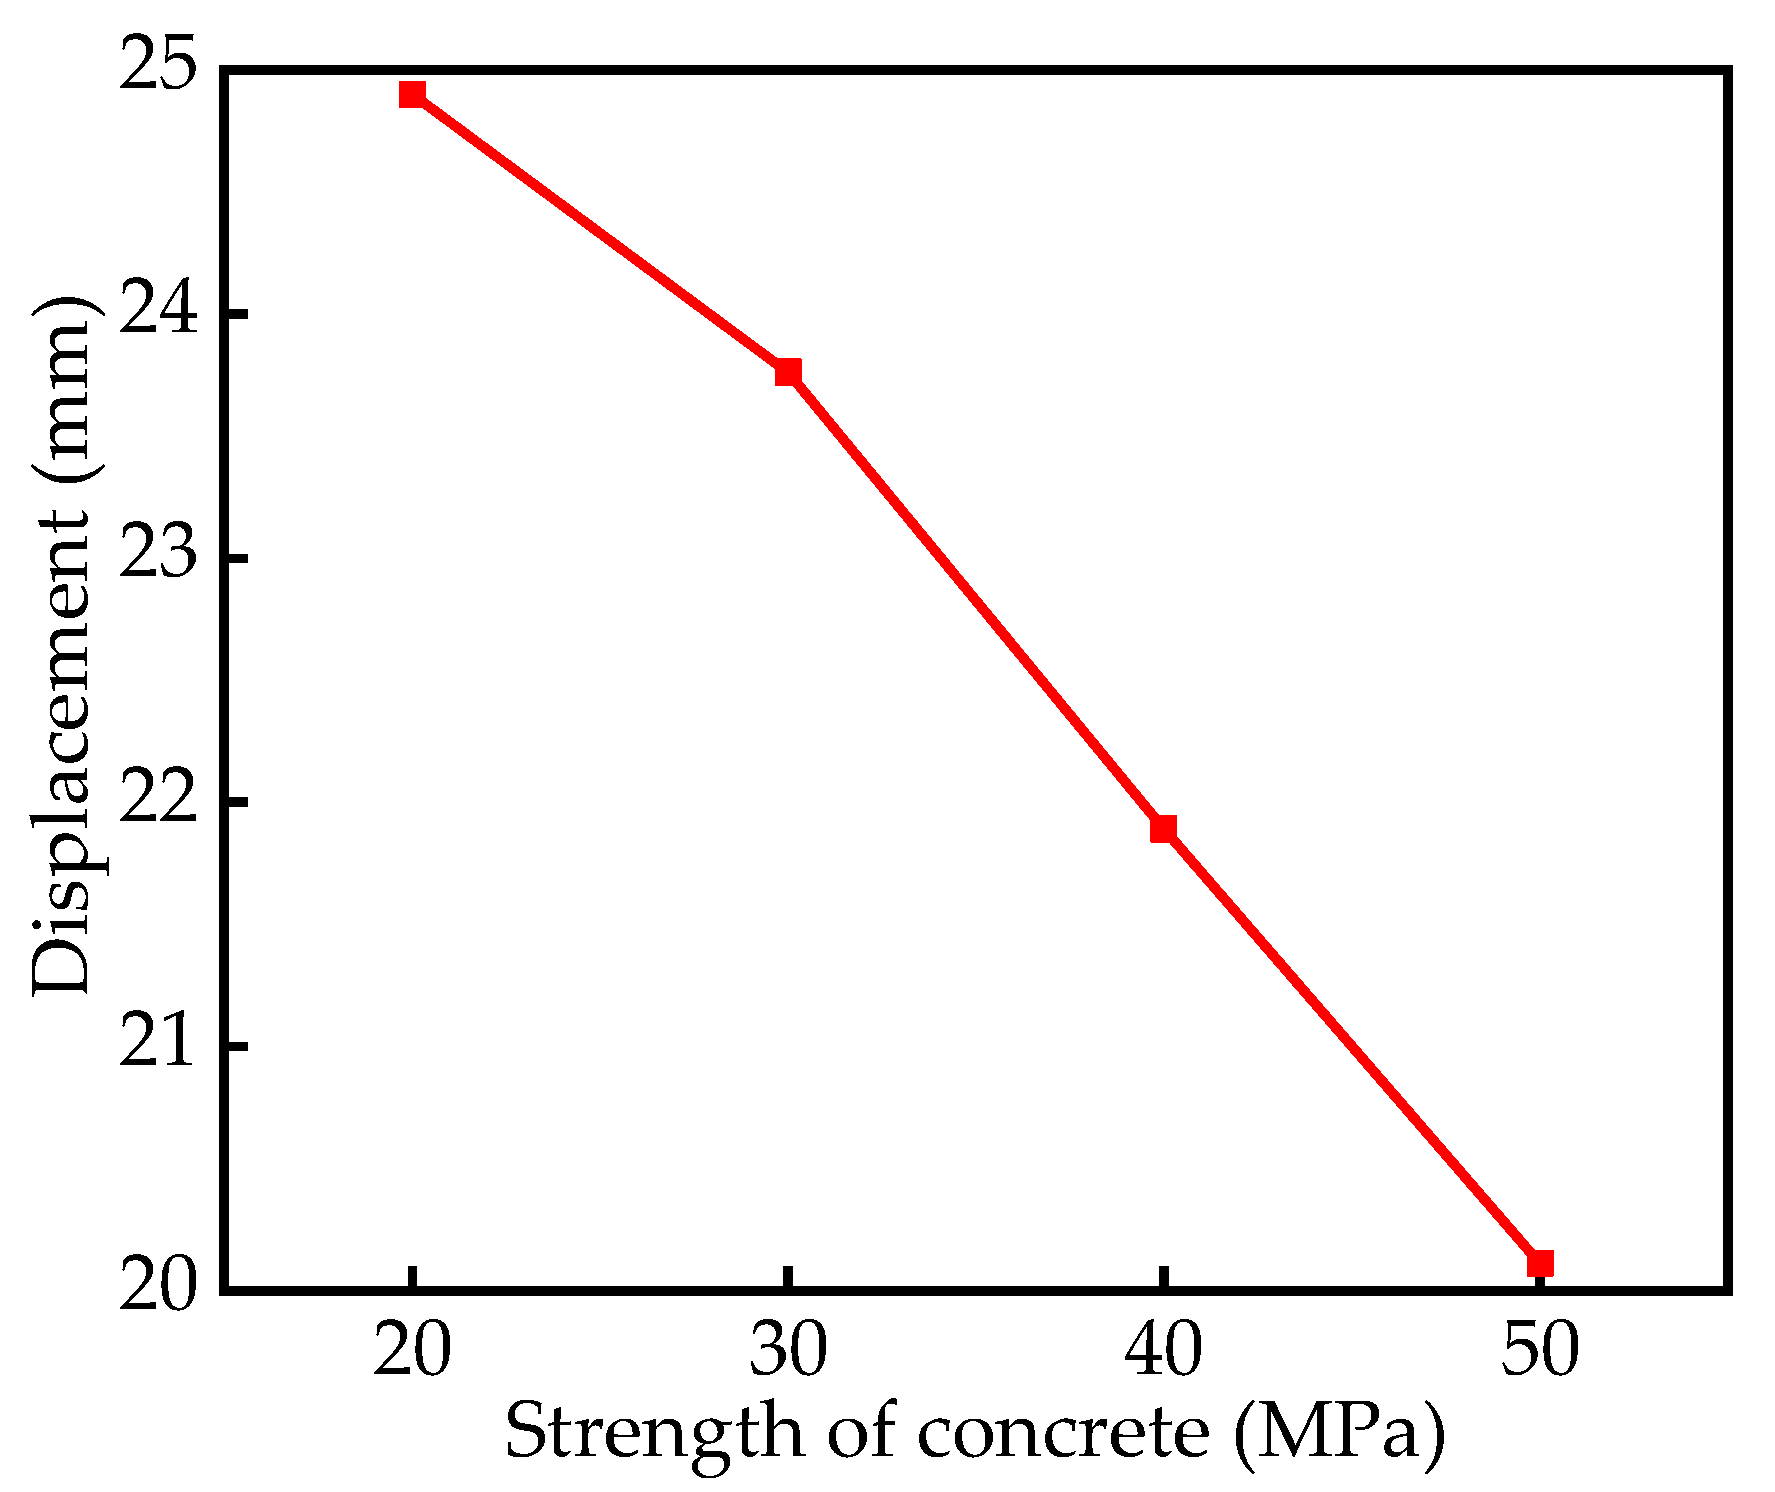
5.5. Strength of Concrete

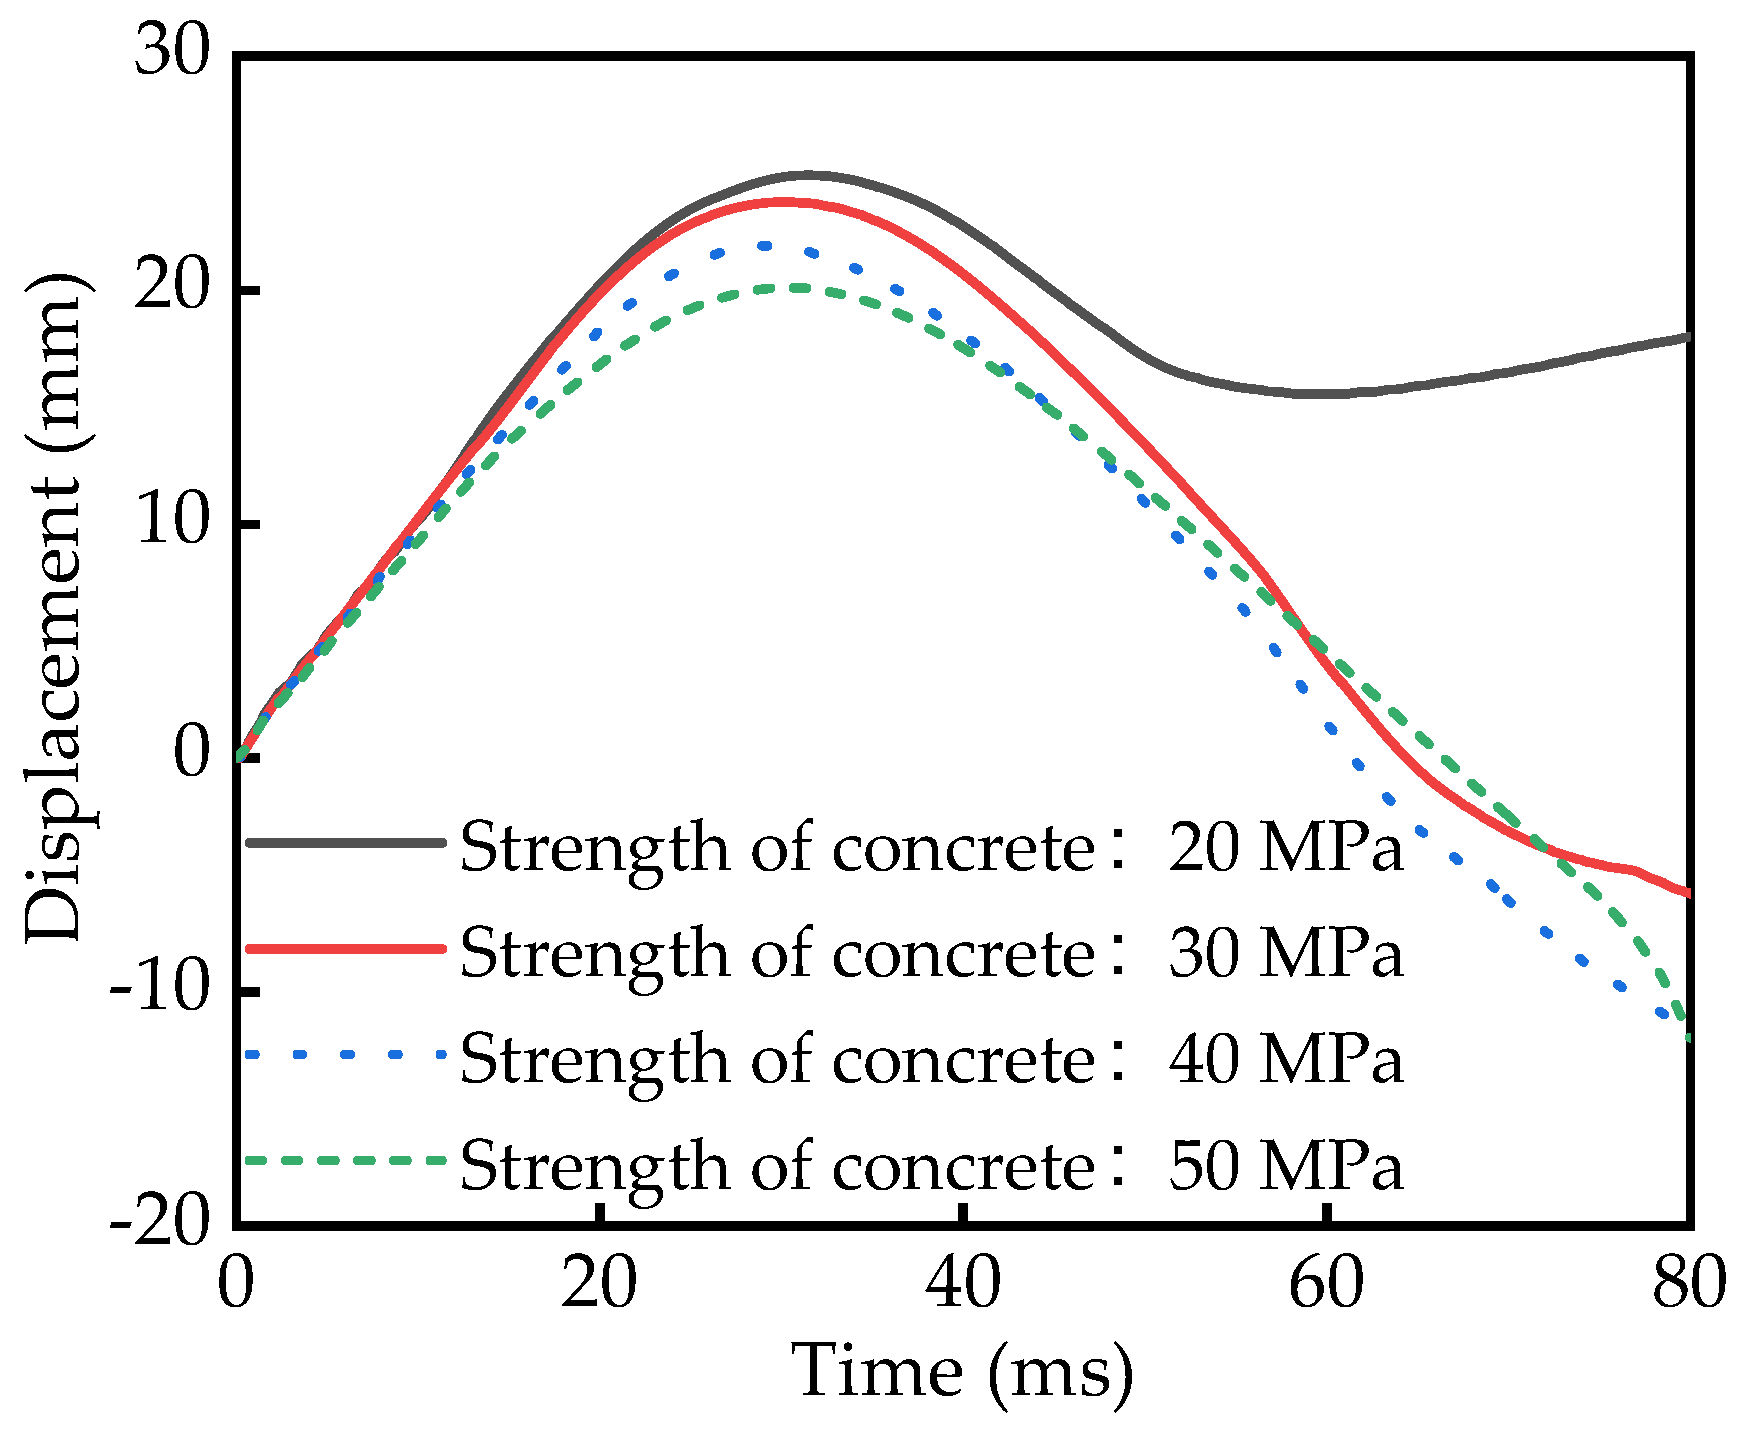
When the strength of concrete changes, the variation law of the time history curve of the mid-span displacement of the RC column is shown in Figure 15, the results of the mid-span peak displacement are shown in Table 8, and the variation law of the mid-span peak displacement is shown in Figure 16. When the strengths of concrete are 20, 30, 40, and 50 MPa, the mid-span peak displacement of RC columns are 24.90, 23.76, 21.89, and 20.11 mm, respectively. The results show that the mid-span peak displacement of RC columns decreases with the increase in the strength of concrete. As the strength of concrete increases by 50%, 100%, and 150%, the corresponding mid-span peak displacement decreases by 4.58%, 12.09%, and 19.24%, respectively.

5.6. Scale Distance

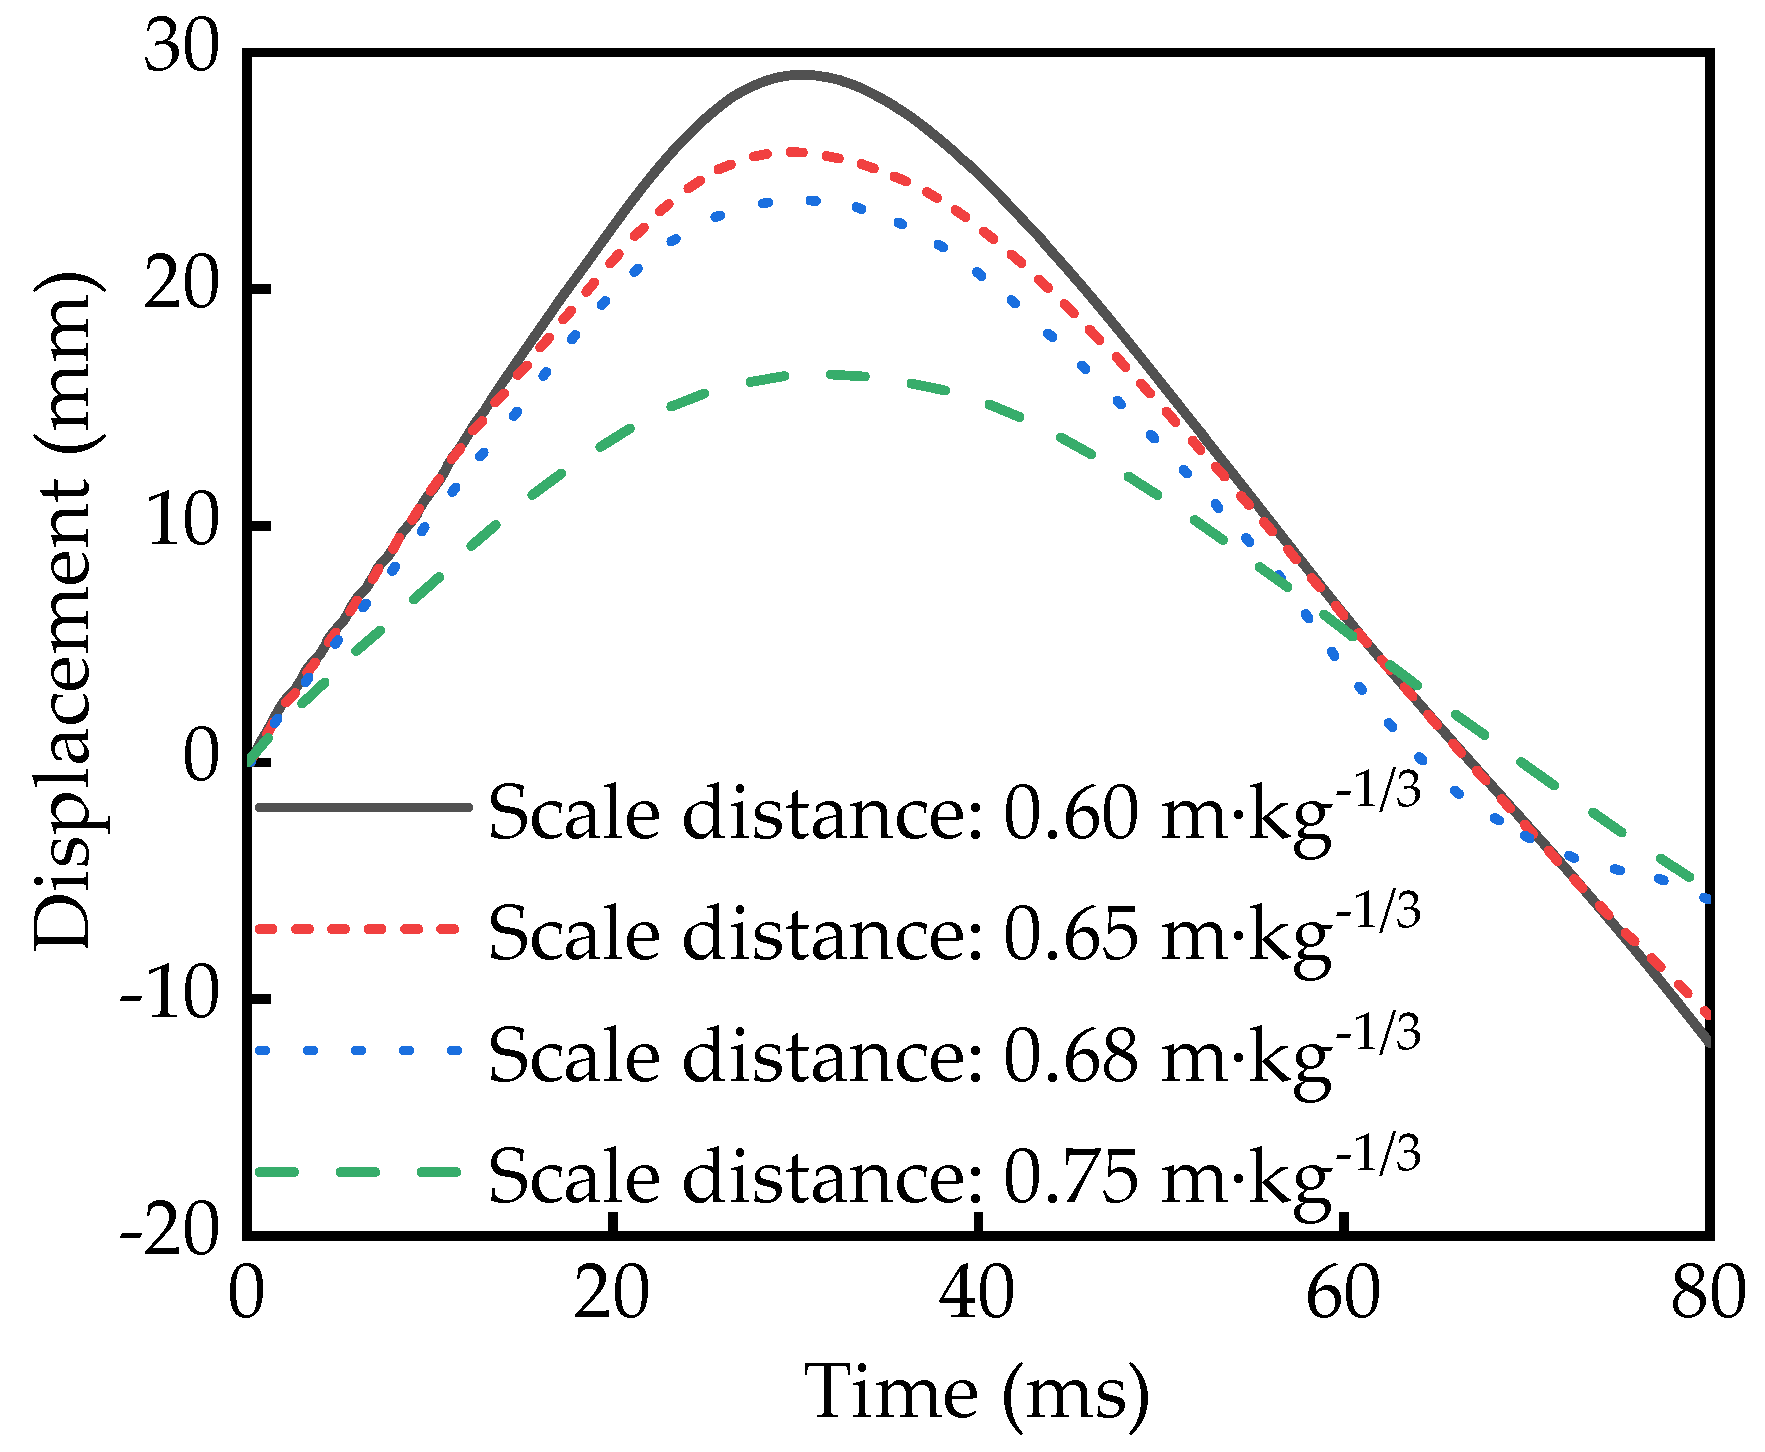
When the scale distance changes, the variation law of the time–history curve of the mid-span displacement of the RC column is shown in Figure 17, the results of the mid-span peak displacement are shown in Table 9, and the variation law of the mid-span peak displacement is shown in Figure 18. When the scale distances are 0.6, 0.65, 0.68, and 0.75 m·kg−1/3, the mid-span peak displacement of RC columns are 29.06, 25.80, 23.76, and 16.40 mm, respectively. The results show that the mid-span peak displacement of RC columns decreases with the increase of the scale distance. As the scale distance increases by 8.33%, 13.33%, and 25%, the corresponding mid-span peak displacement decreases by 11.22%, 18.24%, and 43.57%, respectively.

5.7. Strength of Longitudinal Reinforcement

When the strength of the longitudinal reinforcement changes, the variation law of the time–history curve of the mid-span displacement of the RC column is shown in Figure 19, and the results of the mid-span peak displacement are shown in Table 10. When the strength of longitudinal reinforcements are 300, 335, 400, and 500 MPa, the mid-span peak displacement of RC columns are 22.75, 22.75, 23.76, and 22.73 mm, respectively. The results indicate that the influence of the strength of longitudinal reinforcement on the mid-span peak displacement of RC columns is negligible and can be ignored. Li [59] also found that the strength of steel bars has a relatively small impact on the explosion resistance of concrete structures. As the yield strength of the steel bars increases, the brittleness of the steel bars under explosive impact loads also increases, which may lead to failure and fracture of the steel bars, resulting in damage to the RC structure and increasing the mid-span peak displacement. This will be offset by the advantages brought by the increase in strength, resulting in a small impact of the steel bar strength on the mid-span peak displacement of the RC structure.

6. Sensitivity Analysis of Influencing Factors

Based on the numerical simulation results in Section 5, the variation values of various influencing parameters are selected as the comparison data matrix X, and the displacement Y under corresponding conditions is used as the reference data matrix. The comparison data matrix and reference data matrix are established, respectively, and the grey relation degree of the influencing factors of the mid-span peak displacement of RC columns under blast load is calculated.
X = X 1 X 2 X 3 X 4 X 5 X 6 = 8 10 12 14 4 8 12 16 6.5 8 10 12 90 120 180 210 20 30 40 50 0.6 0.65 0.68 0.75
Y = Y 1 Y 2 Y 3 Y 4 Y 5 Y 6 = 31.02 25.63 23.76 17.89 23.76 1.62 1.31 1.18 23.76 22.14 22.04 20.71 20.78 21.99 23.76 24.70 24.90 23.76 21.89 20.11 29.06 25.80 23.76 16.40
According to Equations (5) and (6):
X = 0 0.3333 0.6667 1 0 0.3333 0.6667 1 0 0.2727 0.6364 1 0 0.25 0.75 1 0 0.3333 0.6667 1 0 0.3333 0.5333 1
Y = 1 0.5895 0.4471 0 1 0.0195 0.0058 0 1 0.4689 0.4361 0 0 0.3087 0.7602 1 1 0.7620 0.3716 0 1 0.7425 0.5814 0
The difference matrix Δ is obtained from Equation (7):
Δ = 1 0.2562 0.2196 1 1 0.3138 0.6609 1 1 0.1962 0.2003 1 0 0.0587 0.0102 1 1 0.4287 0.2951 1 1 0.4092 0.0481 1
where: Δmax = maxij) = 1; Δmin = minij) = 0, the resolution coefficient is generally taken ξ = 0.5.
The grey relation coefficient matrix γ is obtained from Equation (9):
γ = 0.3333 0.6612 0.6948 0.3333 0.3333 0.6144 0.6531 0.3333 0.3333 0.9996 0.9976 0.3333 1 0.7182 0.7140 0.3333 0.3333 0.5384 0.6289 0.3333 0.3333 0.5499 0.9122 0.3333
From Equation (10), the sequence of relation degrees can be obtained as:
A = 0.5057 , 0.4835 , 0.6660 , 0.6914 , 0.4585 , 0.5322 T
Finally, the grey relation degree ranking of the influencing factors on the mid-span peak displacement of RC columns is stirrup spacing > diameter of stirrup > scale distance > diameter of longitudinal reinforcement > number of longitudinal reinforcement > strength of concrete. The spacing and diameter of the stirrup have a significant impact on the mid-span peak displacement of RC columns, with relation degrees of 0.6914 and 0.6660, respectively.

7. Discussion

The damage to RC structures is related to their dynamic response. The dynamic response parameter analyzed in this paper is the dynamic response mid-span peak displacement. The maximum bearing rotation angle θ m a x can be calculated through the peak displacement. The maximum bearing rotation angle is a standard for evaluating the degree of damage to RC structures. The maximum bearing rotation angle can be calculated by Equation (24) [60]:
θ m a x = tan 1 x max L / 2
The larger the mid-span peak displacement, the greater the maximum bearing rotation angle, and the greater the degree of damage to the RC column.
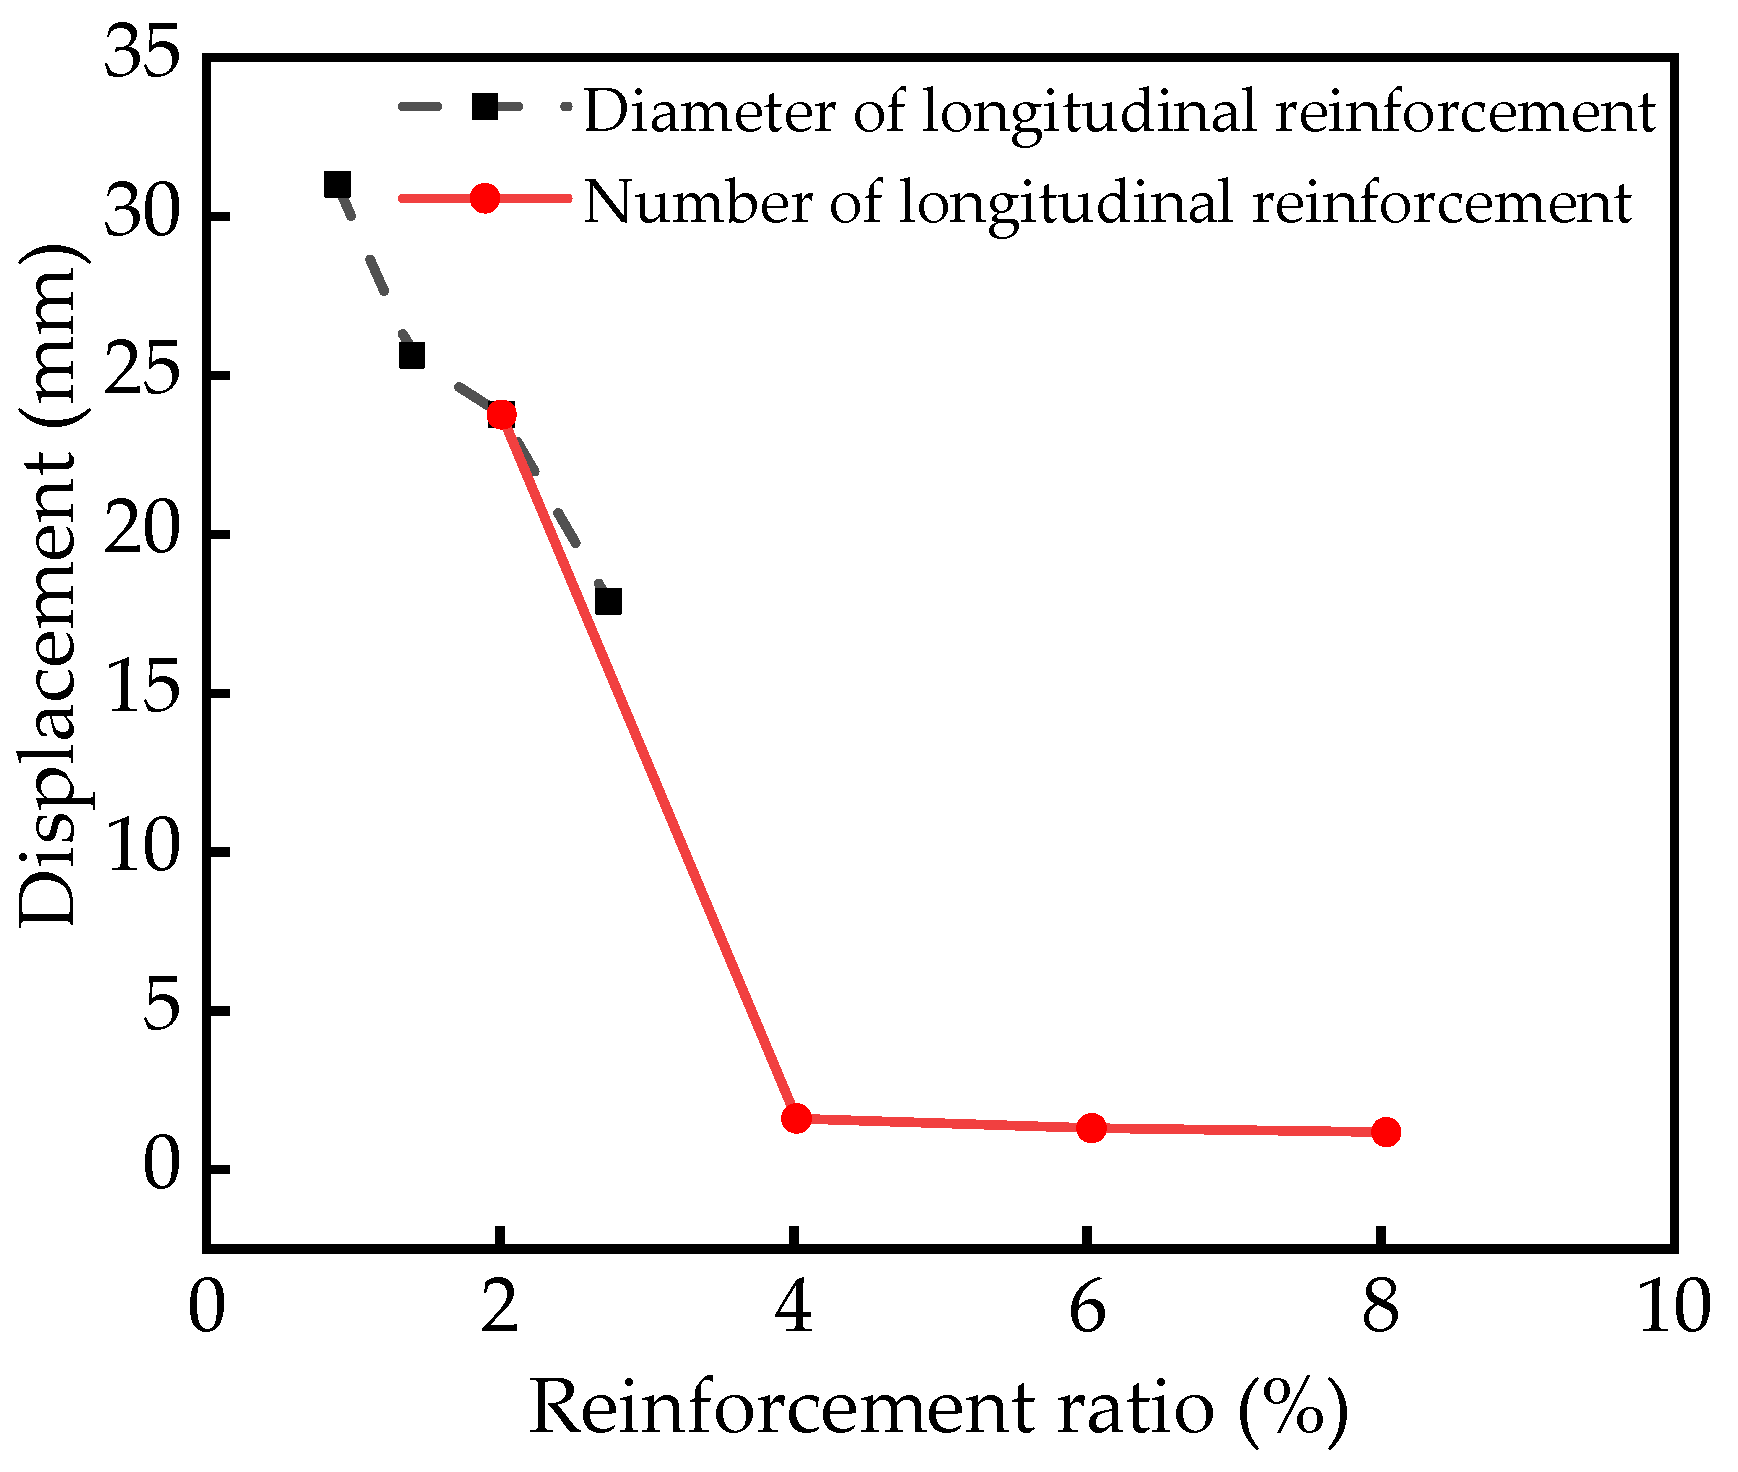
For the methods mentioned in Section 5.1 and Section 5.2 to change the reinforcement ratio, one is to keep the number of longitudinal reinforcements unchanged, but the diameter of longitudinal reinforcement changes, and the other is to keep the diameter of longitudinal reinforcement unchanged, but the number of longitudinal reinforcement changes. The peak displacement obtained by the two methods is compared with the reinforcement ratio relationship curve, as shown in Figure 20. From the curve trend in Figure 20, it can be seen that when the reinforcement ratio is the same, the peak displacement obtained by changing the number of longitudinal reinforcements is significantly smaller than that obtained by changing the diameter of longitudinal reinforcement. This means that changing the number of longitudinal reinforcements can improve the blast resistance of RC columns compared to changing the diameter of longitudinal reinforcement.
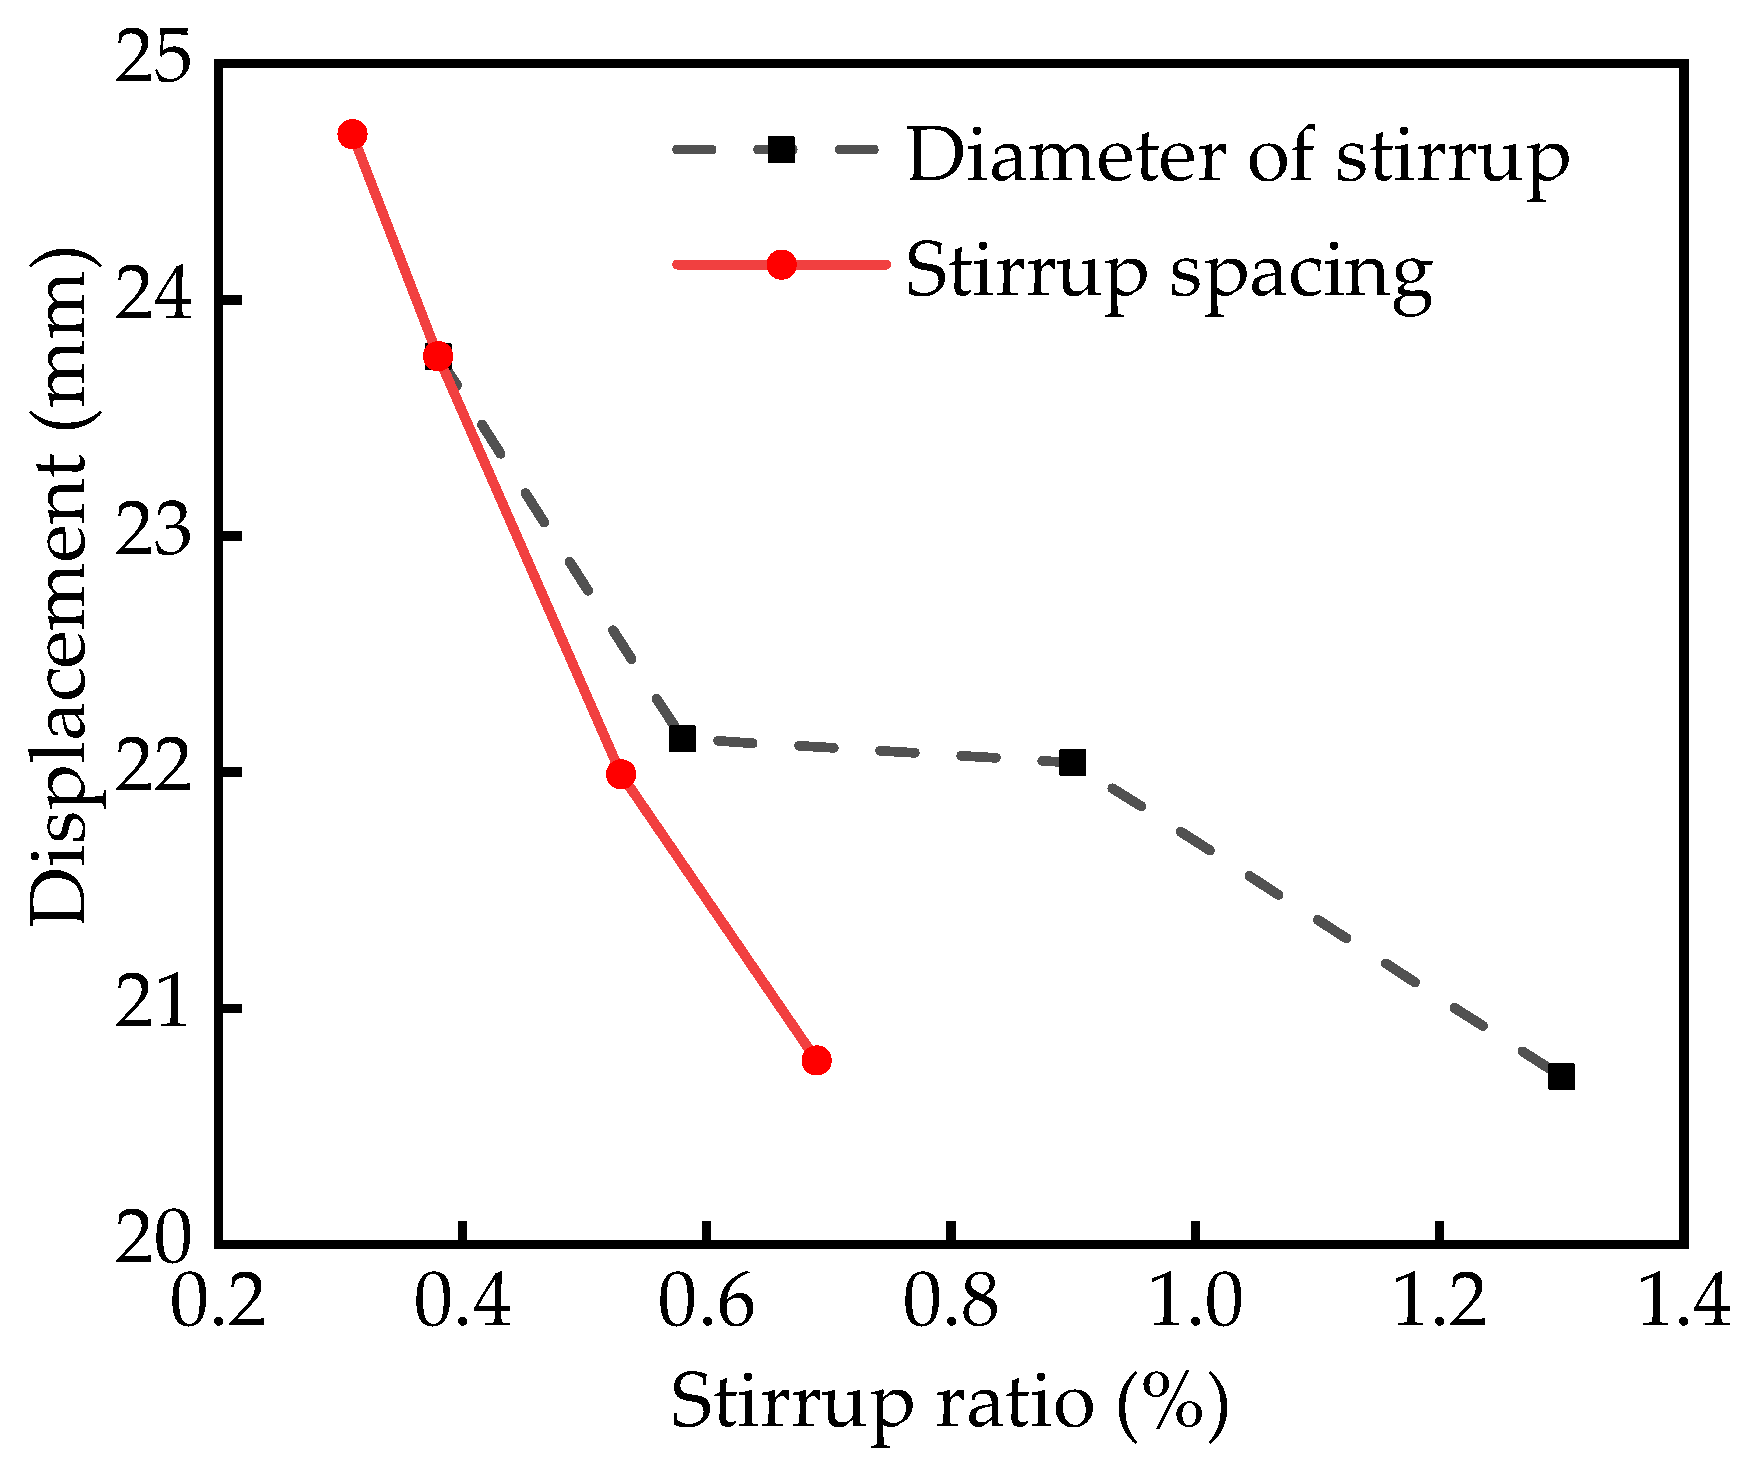
For the methods mentioned in Section 5.3 and Section 5.4 to change the stirrup ratio, one is to keep the stirrup spacing unchanged, but the diameter of the stirrup changes, and the other is to keep the diameter of the stirrup unchanged, but the stirrup spacing changes. The peak displacement values obtained by the two methods are compared with the stirrup ratio relationship curve, as shown in Figure 21. From the curve trend in Figure 21, it can be seen that when the stirrup ratio is the same, the peak displacement obtained by changing the stirrup spacing is significantly smaller than that obtained by changing the diameter of the stirrup. This means that changing the stirrup spacing can improve the blast resistance of RC columns.
From Section 5.7, it can be concluded that the influence of the strength of longitudinal reinforcement on the mid-span peak displacement of RC columns is minimal. From the grey relation analysis in Section 6, it can also be concluded that the relation between the strength of concrete and the mid-span peak displacement of RC columns is minimal. This indicates that within the commonly used range of reinforcement and concrete strength. The parameters of reinforcement and concrete have little effect on the peak displacement of RC columns at mid-span under blast loads.

8. Conclusions

Based on the common RC column components in the building structure, this paper verifies the numerical calculation model by using the field-measured data validation, uses LS-DYNA software to carry out numerical simulation calculations, and studies the influence of diameter of longitudinal reinforcement, the number of longitudinal reinforcement, the diameter of the stirrup, stirrup spacing, strength of concrete, scale distance and strength of longitudinal reinforcement on the dynamic response of RC columns under blast load through the grey relation sensitivity analysis method. The following conclusions are obtained:
  • By changing the diameter and number of longitudinal reinforcements, the reinforcement ratio can be changed. However, when the reinforcement ratio is the same, the mid-span peak displacement of the RC column obtained by changing the number of longitudinal reinforcements is smaller than that obtained by changing the diameter of longitudinal reinforcement. When designing and constructing RC structures, controlling the reinforcement ratio by changing the number of longitudinal reinforcements can make the RC structures have better blast resistance;
  • By changing the diameter and spacing of the stirrup, the stirrup ratio can be changed. However, when the stirrup ratio is the same, the mid-span peak displacement of the RC column obtained by changing the stirrup spacing is smaller than that obtained by changing the diameter of the stirrup. When designing and constructing RC structures, controlling the stirrup ratio by changing the stirrup spacing can improve the blast resistance of the RC structures;
  • The grey relation degree of the influencing factors on the mid-span peak displacement of RC columns are in descending order: stirrup spacing, the diameter of the stirrup, scale distance, diameter of longitudinal reinforcement, number of longitudinal reinforcement, and concrete strength. The spacing and diameter of the stirrup have a significant impact on the mid-span peak displacement of RC columns, with relation degrees of 0.6914 and 0.6660, respectively. By quantitatively expressing the strength of the correlation of influencing factors, more consideration should be given to changing the influencing factors of strong correlation in the design and construction of RC structures.

Author Contributions

Conceptualization, Q.X. and C.M.; methodology, Q.X.; software, Y.W.; validation, Q.X. and C.M.; formal analysis, Y.W.; investigation, Y.W.; resources, C.M.; data curation, Y.W.; writing—original draft preparation, Y.W.; writing—review and editing, Y.W.; visualization, Y.W.; supervision, C.M.; project administration, Q.X.; funding acquisition, C.M. All authors have read and agreed to the published version of the manuscript.

Funding

This research was funded by the State Key Laboratory of Precision Blasting and Hubei Key Laboratory of Blasting Engineering, Jianghan University (No. PBSKL2022B01).

Institutional Review Board Statement

Not applicable.

Informed Consent Statement

Not applicable.

Data Availability Statement

The data used to support the findings of this study are available from the corresponding author upon request.

Conflicts of Interest

The authors declare no conflict of interest.

References

  1. Yang, C.; Jia, X.; Huang, Z.; Zhao, L.; Shang, W. Damage of full-scale reinforced concrete beams under contact explosion. Int. J. Impact Eng. 2022, 163, 104180. [Google Scholar] [CrossRef]
  2. Andreotti, R.; Riganti, G.; Boniardi, M. Numerical simulation of a terrorist attack. Appl. Mech. Mater. 2011, 1381, 308–313. [Google Scholar] [CrossRef]
  3. Anas, S.; Alam, M.; Umair, M. Experimental and numerical investigations on performance of reinforced concrete slabs under explosive-induced air-blast loading: A state-of-the-art review. Structures 2021, 31, 428–461. [Google Scholar] [CrossRef]
  4. Zhang, X.; Zhou, F.; Zou, J. Numerical simulation of gas extraction in coal seam strengthened by static blasting. Sustainability 2022, 14, 12484. [Google Scholar] [CrossRef]
  5. Zhang, B.; Zhai, D.; Wang, W. Failure mode analysis and dynamic response of a coal mine refuge chamber with a gas explosion. Appl. Sci. 2016, 6, 145. [Google Scholar] [CrossRef] [Green Version]
  6. Pak, S.; Jung, S.; Roh, C.; Kang, C. Case Studies for Dangerous Dust Explosions in South Korea during Recent Years. Sustainability 2019, 11, 4888. [Google Scholar] [CrossRef] [Green Version]
  7. Xue, Y.; Chen, G.; Zhang, Q.; Xie, M.; Ma, J. Simulation of the dynamic response of an urban utility tunnel under a natural gas explosion. Tunn. Undergr. Space Technol. 2021, 108, 103713. [Google Scholar] [CrossRef]
  8. Cai, P.; Li, M.; Liu, Z.; Li, P.; Zhao, Y.; Zhou, Y. Experimental and numerical study of natural gas leakage and explosion characteristics. ACS Omega 2022, 7, 25278–25290. [Google Scholar] [CrossRef]
  9. Huang, L.; Pei, S.; Wang, Y.; Zhang, L.; Ren, S.; Zhang, Z.; Xiao, Y. Assessment of flammability and explosion risks of natural gas-air mixtures at high pressure and high temperature. Fuel 2019, 247, 47–56. [Google Scholar] [CrossRef]
  10. Yang, S.; Ning, J.; Xu, X. Fragment theoretical model of concrete blocks subjected to blast loads. Int. J. Impact Eng. 2023, 176, 104562. [Google Scholar] [CrossRef]
  11. Hu, Q.; Zhang, Q.; Yuan, M.; Qian, X.; Li, M.; Wu, H.; Shen, X.; Liang, Y. Traceability and failure consequences of natural gas explosion accidents based on key investigation technology. Eng. Fail. Anal. 2022, 139, 106448. [Google Scholar] [CrossRef]
  12. Eskew, E.; Jang, S. Damage assessment of a building subjected to a terrorist attack. Adv. Struct. Eng. 2014, 17, 1693–1704. [Google Scholar] [CrossRef]
  13. Codina, R.; Ambrosini, D.; Borbon, F. Alternatives to prevent progressive collapse protecting reinforced concrete columns subjected to near field blast loading. Procedia Eng. 2017, 199, 2445–2450. [Google Scholar] [CrossRef]
  14. Dua, A.; Braimah, A.; Kumar, M. Experimental and numerical investigation of rectangular reinforced concrete columns under contact explosion effects. Eng. Struct. 2020, 205, 109891. [Google Scholar] [CrossRef]
  15. Abedini, M.; Mutalib, A.; Raman, S.; Baharom, S.; Nouri, J. Prediction of residual axial load carrying capacity of reinforced concrete (RC) columns subjected to extreme dynamic loads. Am. J. Eng. Appl. Sci. 2017, 10, 431–448. [Google Scholar] [CrossRef]
  16. Yu, J.; Yu, X.; Tang, J.; Deng, Y. Local damage of precast concrete columns with grout sleeve connections under contact detonation. Eng. Struct. 2022, 265, 114499. [Google Scholar] [CrossRef]
  17. Yao, S.; Zhang, D.; Chen, X.; Lu, F.; Wang, W. Experimental and numerical study on the dynamic response of RC slabs under blast loading. Eng. Fail. Anal. 2016, 66, 120–129. [Google Scholar] [CrossRef]
  18. Yao, S.; Zhang, D.; Lu, F.; Wang, W.; Chen, X. Damage features and dynamic response of RC beams under blast. Eng. Fail. Anal. 2016, 62, 103–111. [Google Scholar] [CrossRef]
  19. Conrad, K.; Abass, B. Effects of transverse reinforcement spacing on the response of reinforced concrete columns subjected to blast loading. Eng. Struct. 2017, 142, 148–164. [Google Scholar]
  20. Hassan, A.; Frederic, P.; Russell, P.; Murat, S. Behavior of ultra-high performance fiber reinforced concrete columns under blast loading. Int. J. Impact Eng. 2015, 80, 185–202. [Google Scholar]
  21. Li, Z.; Zhang, X.; Shi, Y.; Wu, C.; Li, J. Predication of the residual axial load capacity of CFRP-strengthened RC column subjected to blast loading using artificial neural network. Eng. Struct. 2021, 242, 112519. [Google Scholar] [CrossRef]
  22. Ushapriya, B.; Kumar, A. Behaviour of raked column subjected to blast loading. J. Build. Pathol. Rehabil. 2023, 8, 19. [Google Scholar] [CrossRef]
  23. Park, J.; Kim, M.; Scanlon, A.; Choi, H.; Lee, Y. Residual strength of reinforced concrete columns subjected to blast loading. Mag. Concrete Res. 2014, 66, 60–71. [Google Scholar] [CrossRef]
  24. Wang, Y.; Chen, Q.; Zhao, Z.; Qiang, H.; Yang, K.; Wang, X. Design and performance evaluation framework for seismically isolated reinforcement concrete columns subjected to blast loads. Structures 2022, 45, 2239–2252. [Google Scholar] [CrossRef]
  25. Sinha, A.; Kanaujia, S.; Kumar, M.; Sachdeva, A.; Singh, S. Effect of positional eccentricity of blast source on beam–column joint response of framed systems. Innov. Infrastruct. Solut. 2022, 7, 178. [Google Scholar] [CrossRef]
  26. Abebe, S.; Getachew, S. Numerical study on effect of constant and variable axial loads on RC column subjected to blast load. Heliyon 2022, 8, e11681. [Google Scholar] [CrossRef] [PubMed]
  27. Shi, Y.; Hu, Y.; Chen, L.; Li, Z.; Xiang, H. Experimental investigation into the close-in blast performance of RC columns with axial loading. Eng. Struct. 2022, 268, 114688. [Google Scholar] [CrossRef]
  28. Rong, Q.; Zhao, Z.; Hou, X.; Jiang, Z. A P-I Diagram Approach for Predicting Dynamic Response and Damage Assessment of Reactive Power Concrete Columns Subjected to Blast Loading. Buildings 2022, 12, 462. [Google Scholar] [CrossRef]
  29. Ghasemi, M.; Zhang, C.; Khorshidi, H.; Sun, L. Development of P-I model for FRP composite retrofitted RC columns subjected to high strain rate loads using LBE function. Eng. Struct. 2022, 252, 113580. [Google Scholar]
  30. Ju, S.; Kwak, H. A FE model to evaluate the resisting capacity of RC beams and columns under blast loading based on P-I diagram. Int. J. Impact Eng. 2022, 161, 104113. [Google Scholar] [CrossRef]
  31. Li, M.; Xia, M.; Zong, Z.; Wu, G.; Zhang, X. Residual axial capacity of concrete-filled double-skin steel tube columns under close-in blast loading. J. Constr. Steel Res. 2023, 201, 107697. [Google Scholar] [CrossRef]
  32. Liu, Y.; Hao, H.; Hao, Y. Prediction of blast response of RC columns considering dynamic bond-slip between reinforcement and concrete. Eng. Struct. 2023, 283, 115921. [Google Scholar] [CrossRef]
  33. Li, Z.; Zhong, B.; Shi, Y.; Yan, J. Nonlocal formulation for numerical analysis of post-blast behavior of RC columns. Int. J. Concr. Struct. M. 2017, 11, 403–413. [Google Scholar] [CrossRef] [Green Version]
  34. Wang, W.; Zhang, D.; Lu, F.; Wang, S.; Tang, F. Experimental study and numerical simulation of the damage mode of a square reinforced concrete slab under close-in explosion. Eng. Fail. Anal. 2013, 27, 41–51. [Google Scholar] [CrossRef]
  35. Ma, L.; Wu, H.; Fang, Q. A unified performance-based blast-resistant design approach for RC beams/columns. Int. J. Impact Eng. 2023, 173, 104459. [Google Scholar]
  36. Welt, T.; Lehman, D.; Lowes, L.; Lafave, J. A constitutive model for confined concrete in slender rectangular RC sections incorporating compressive energy. Constr. Build. Mater. 2018, 193, 344–362. [Google Scholar] [CrossRef]
  37. Shi, Y.; Hu, Y.; Liu, S.; Cui, J.; Chen, L. Mitigation of the blast load on RC column by hanging granite slabs. Eng. Struct. 2023, 280, 115668. [Google Scholar] [CrossRef]
  38. Jiang, Z.; Rong, Q.; Hou, X.; Zhao, Z.; Yang, E. Methodology for Predicting the Structural Response of RPC-Filled Steel Tubular Columns under Blast Loading. Appl. Sci. 2022, 12, 9142. [Google Scholar] [CrossRef]
  39. Mohammed, T.; Abebe, S. Numerical investigation on CFRP strengthening and reinforcement bar detailing of RC columns to resist blast load. Heliyon 2022, 8, e10059. [Google Scholar] [CrossRef]
  40. Fang, C.; Linzell, D.; Yosef, T.; Rasmussen, J. Numerical modeling and performance assessment of bridge column strengthened by FRP and polyurea under combined collision and blast loading. J. Compos. Constr. 2022, 26, 04022002. [Google Scholar] [CrossRef]
  41. Fang, C.; Yosef, T.; Linzell, D.; Rasmussen, J. Computational modeling and dynamic response of highway bridge columns subjected to combined vehicle collision and air blast. Eng. Fail. Anal. 2021, 125, 105389. [Google Scholar] [CrossRef]
  42. Fang, C.; Yosef, T.; Linzell, D.; Rasmussen, J. Residual axial capacity estimates for bridge columns subjected to combined vehicle collision and air blast. J. Bridge Eng. 2021, 26, 04021035. [Google Scholar] [CrossRef]
  43. Shi, Y.; Sun, X.; Cui, J. Reliability analysis of reinforced concrete columns under combined seismic and blast loads. Sci. China Technol. Sc. 2023, 66, 363–377. [Google Scholar] [CrossRef]
  44. Lee, J.; Aoude, H.; Yoon, Y.; Mitchell, D. Impact and blast behavior of seismically-detailed RC and UHPFRC-Strengthened columns. Int. J. Impact Eng. 2020, 143, 103628. [Google Scholar] [CrossRef]
  45. Xu, Z.; Li, J.; Wu, C. A numerical study of blast resistance of fire damaged ultra-high performance concrete columns. Eng. Struct. 2023, 279, 115613. [Google Scholar] [CrossRef]
  46. Chen, W.; Zhou, Z.; Zou, H.; Guo, Z. Predictions of residual carrying-capacities for fire and near-field blast-damaged reactive powder concrete-filled steel tube columns. Int. J. Prot. Struct. 2018, 9, 525–553. [Google Scholar] [CrossRef]
  47. Guo, Z.; Chen, W.; Zhang, Y.; Zou, H. Post fire blast-resistances of RPC-FST columns using improved Grigorian model. Int. J. Impact Eng. 2017, 107, 80–95. [Google Scholar] [CrossRef]
  48. Li, H.; Li, L.; Ye, M.; Li, M.; Wu, Y. Blast fragility assessment of aging coastal RC columns exposed to non-uniform CIC attacks using LBE function. J. Build. Eng. 2023, 71, 106510. [Google Scholar] [CrossRef]
  49. Liu, Y.; Hao, H.; Hao, Y. Blast fragility analysis of RC columns considering chloride-induced corrosion of steel reinforcement. Struct. Saf. 2022, 96, 102200. [Google Scholar] [CrossRef]
  50. Deng, J. Grey Theory, 1st ed.; Huazhong University of Science and Technology Press: Wuhan, China, 2002; pp. 1–15. [Google Scholar]
  51. Liu, S.; Guo, T.; Dang, Y. Grey System Theory and Its Application, 2nd ed.; Science Press: Beijing, China, 1999; pp. 1–20. [Google Scholar]
  52. Wu, Y.; Mu, C.; Zhang, H.; Zhou, H. Sensitivity analysis of influencing factors of underground civil air defense construction vibration under vehicle load. Appl. Sci. 2022, 12, 12361. [Google Scholar] [CrossRef]
  53. Xie, L.; Wu, C.; Duan, M.; Lyu, N. Analysis of freeway safety influencing factors on driving workload and performance based on the gray correlation method. J. Adv. Transport. 2021, 2021, 6566207. [Google Scholar] [CrossRef]
  54. Hu, W.; Zhao, Q.; Liu, Y.; Li, Z.; Kong, X. Damage evaluation of the paving around manholes under vehicle dynamic load. Adv. Mater. Sci. Eng. 2020, 2020, 6510439. [Google Scholar] [CrossRef]
  55. Yan, J.; Liu, Y.; Li, Z.; Xu, Z.; Huang, F. Effects of transverse reinforcement ratio and axial load on the blast response of steel reinforced concrete columns. Acta Armamentarii 2020, 41, 35–43. [Google Scholar]
  56. Comite Euro-International du Beton. CEB-FIP Model Code 1990, 1st ed.; Thomas Telford: London, UK, 1990. [Google Scholar]
  57. Malvar, L.; Crawford, J. Dynamic increase factors for concrete. In Proceedings of the Twenty-Eighth DDESB Seminar, Orlando, FL, USA, 18–20 August 1998. [Google Scholar]
  58. Crawford, J.; Malver, L. User’s and Theoretical Manual for K&C Concrete Model; Technical Report TR-97-53.1; Karagozian & Case: Glendale, CA, USA, 1997. [Google Scholar]
  59. Li, T. Dynamic Response and Damage Assessment of Reinforced Concrete Slabs Subjected to Blast Loading. Ph.D. Thesis, Chang’an University, Xi’an, China, 2012. [Google Scholar]
  60. Wang, W. Study on Damage Effects and Assessments Method of Reinforced Concrete Structural Members under Blast Loading. Ph.D. Thesis, National University of Defense Technology, Changsha, China, 2012. [Google Scholar]
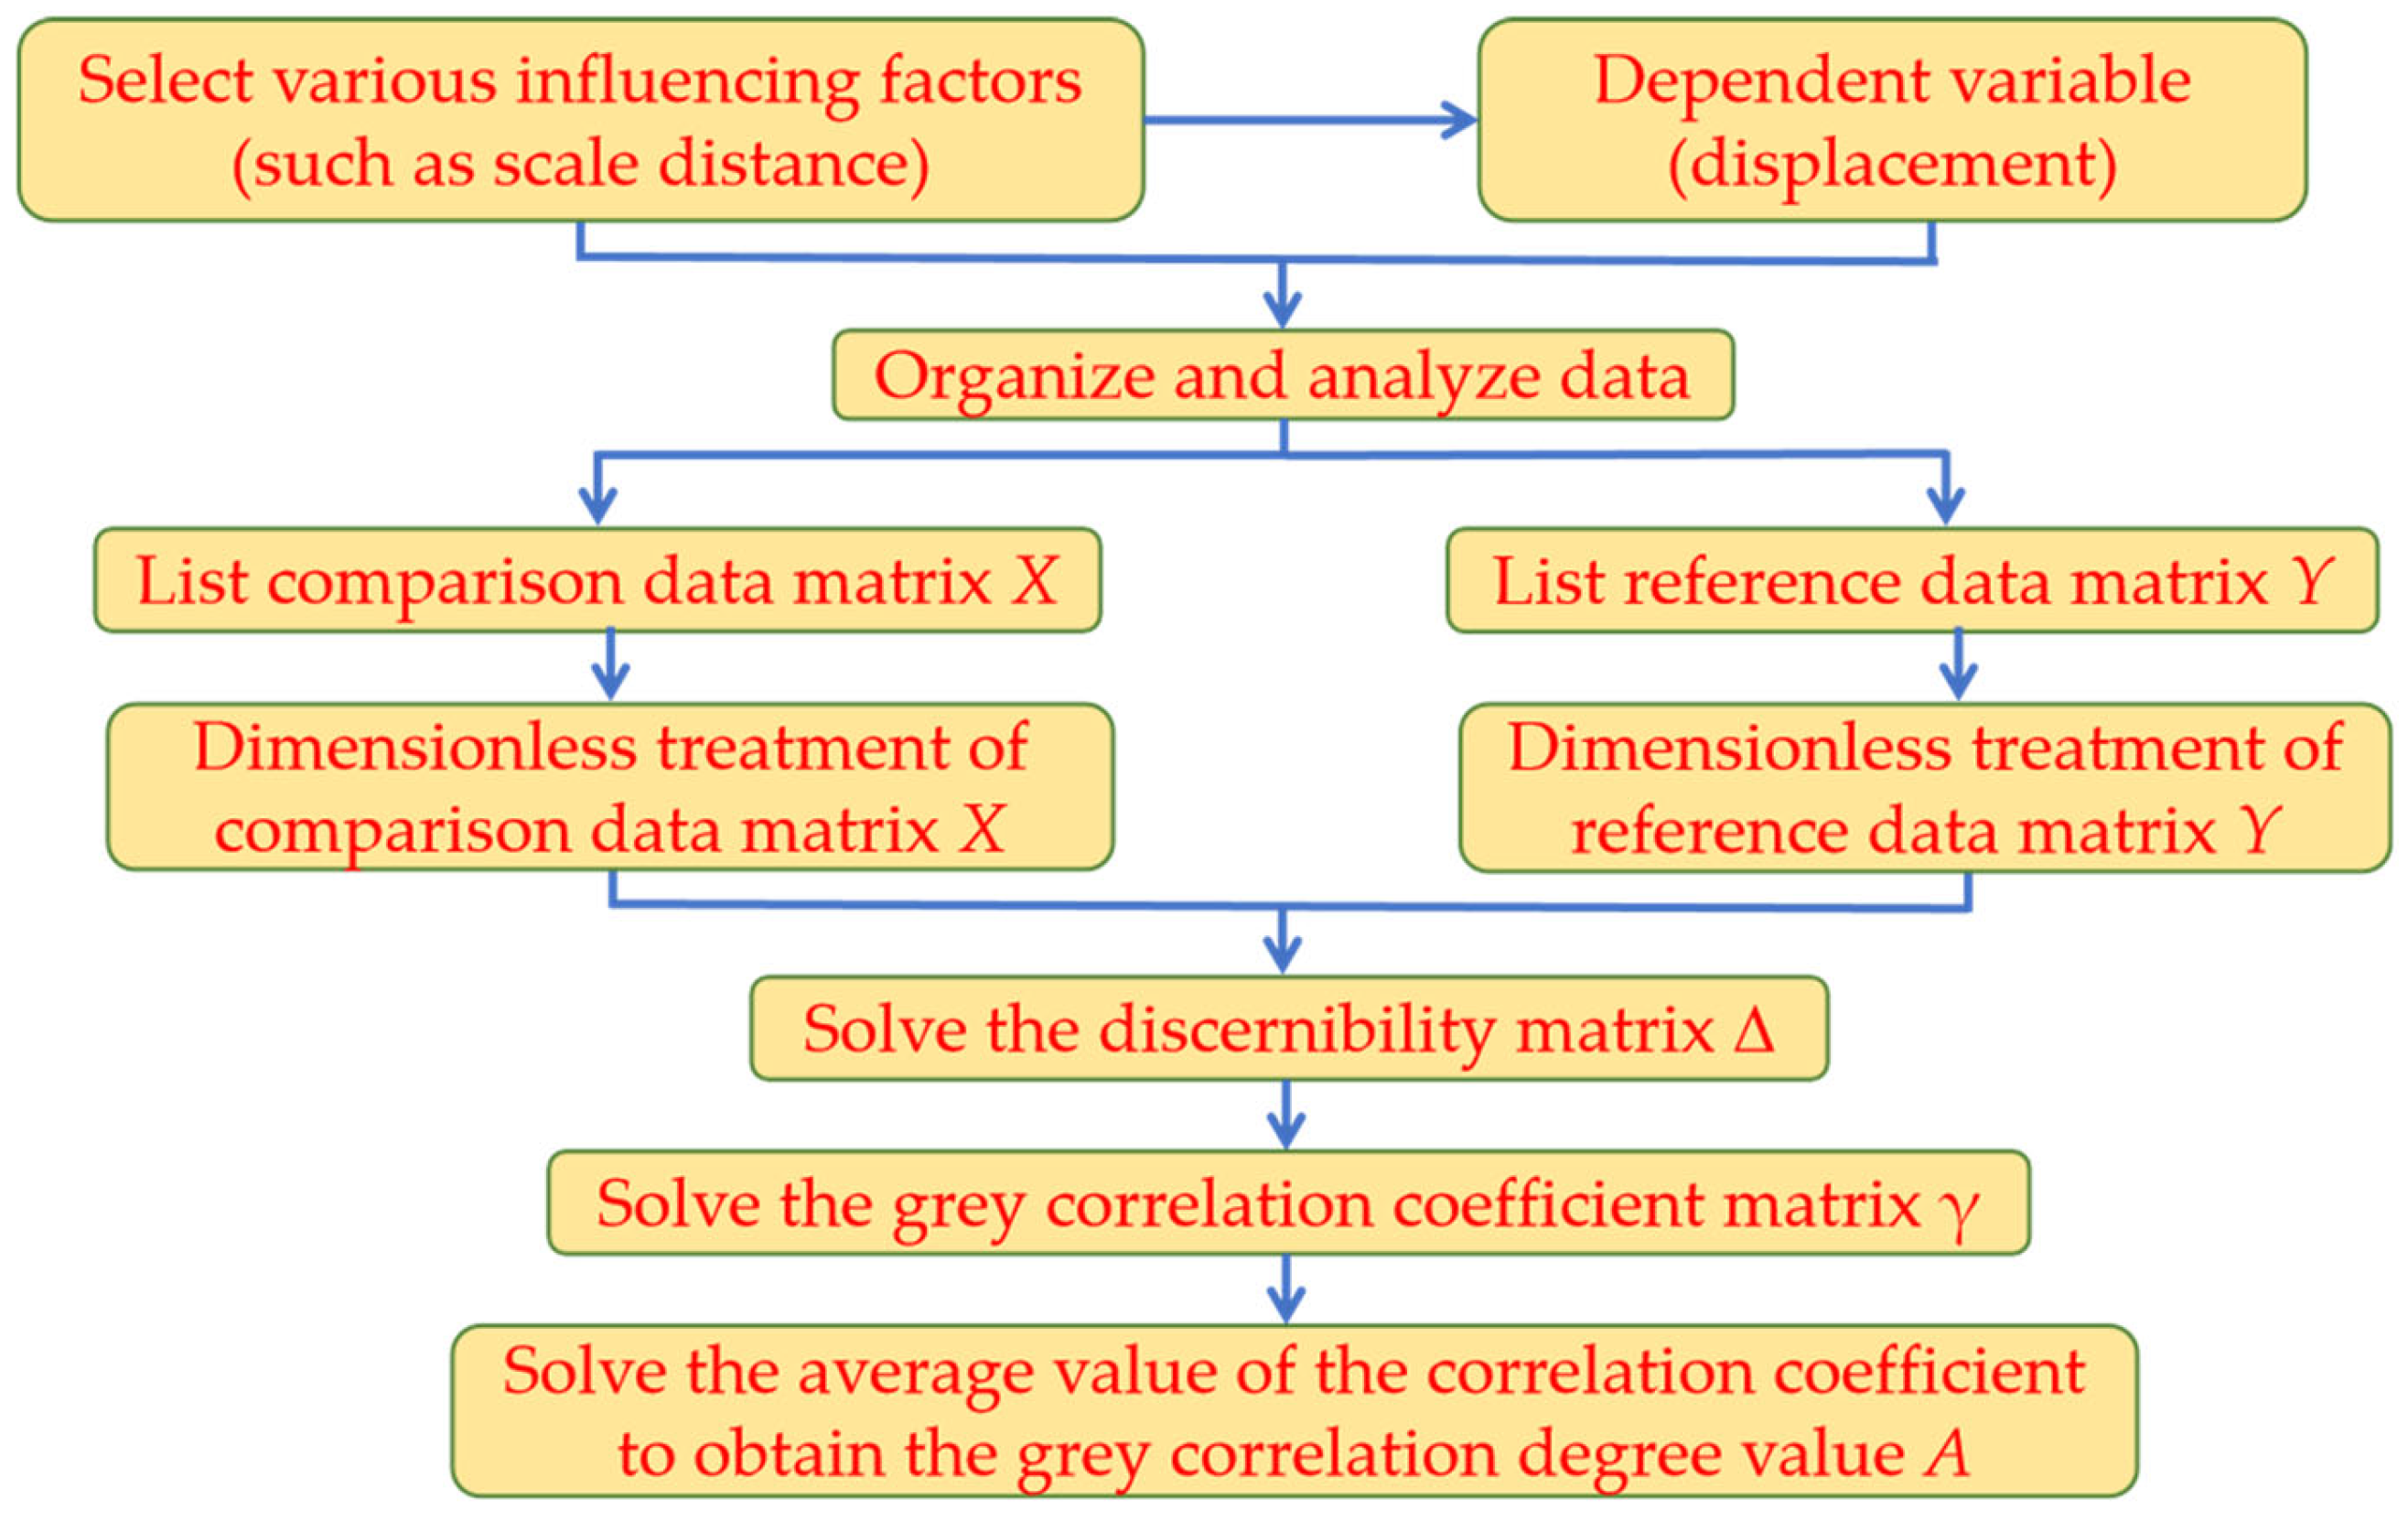
Figure 1. Flow chart for sensitivity analysis based on the grey correlation degree.
Sustainability 15 12285 g001
Figure 2. Sketch of reinforced concrete columns (unit: mm).
Sustainability 15 12285 g002
Figure 3. The overall layout. (a) Experiment [55]; (b) numerical simulation.
Sustainability 15 12285 g003
Figure 4. Dynamic increase factor curves of concrete.
Sustainability 15 12285 g004
Figure 5. Comparison of damage modes between experimental and numerical simulation of reinforced concrete columns. (a) Experiment [55]; (b) numerical simulation.
Sustainability 15 12285 g005
Figure 6. Comparison of experimental result and numerical simulation result of mid-span displacement time–history curves of RC columns [55].
Sustainability 15 12285 g006
Figure 7. The variation rule of time–history curve of mid-span displacement when the diameter of longitudinal reinforcement changes.
Sustainability 15 12285 g007
Figure 8. The law of mid-span peak displacement changes with the diameter of longitudinal reinforcement.
Sustainability 15 12285 g008
Figure 9. The variation rule of time–history curve of mid-span displacement when the number of longitudinal reinforcement changes.
Sustainability 15 12285 g009
Figure 10. The law of mid-span peak displacement changes with the number of longitudinal reinforcements.
Sustainability 15 12285 g010
Figure 11. The variation rule of time–history curve of mid-span displacement when the diameter of the stirrup changes.
Sustainability 15 12285 g011
Figure 12. The law of mid-span peak displacement changes with the diameter of the stirrup.
Sustainability 15 12285 g012
Figure 13. The variation rule of time–history curve of mid-span displacement when the stirrup spacing changes.
Sustainability 15 12285 g013
Figure 14. The law of mid-span peak displacement changes with the stirrup spacing.
Sustainability 15 12285 g014
Figure 15. The variation rule of time–history curve of mid-span displacement when the strength of concrete changes.
Sustainability 15 12285 g015
Figure 16. The law of mid-span peak displacement changes with the strength of concrete.
Sustainability 15 12285 g016
Figure 17. The variation rule of time–history curve of mid-span displacement when the scale distance changes.
Sustainability 15 12285 g017
Figure 18. The law of mid-span peak displacement changes with the scale distance.
Sustainability 15 12285 g018
Figure 19. The variation rule of time–history curve of mid-span displacement when the strength of longitudinal reinforcement changes.
Sustainability 15 12285 g019
Figure 20. Comparison of the relationship curve between peak displacement and reinforcement ratio.
Sustainability 15 12285 g020
Figure 21. Comparison of the relationship curve between peak displacement and stirrup ratio.
Sustainability 15 12285 g021
Table 1. Numerical simulation parameters.
Material TypeYoung’s Modulus (GPa)Poisson’s RatioYield Stress (MPa)Ultimate Strain
Longitudinal reinforcement2070.34000.22
Stirrup2070.35180.085
Table 2. Material parameters of concrete.
Density (kg·m−3)Poisson’s RatioStrength of Concrete (MPa)
24000.231.3
Table 3. Numerical simulation conditions.
Working ConditionsDiameter of
Longitudinal
Reinforcement (mm)
Number of
Longitudinal
Reinforcement
Diameter of Stirrup (mm)Stirrup Spacing (mm)Strength of Concrete (MPa)Scale Distance (m·kg−1/3)Strength of
Longitudinal
Reinforcement (MPa)
18/10/12/1446.5180300.68400
2124/8/12/166.5180300.68400
31246.5/8/10/12180300.68400
41246.590/120/180/210300.68400
51246.518020/30/40/500.68400
61246.5180300.6/0.65/0.68/0.75400
71246.5180300.68300/335/400/500
Table 4. Results of mid-span peak displacement when the diameter of longitudinal reinforcement changes.
Diameter of Longitudinal Reinforcement (mm)Reinforcement Ratio (%)Displacement (mm)
80.8931.02
101.4025.63
122.0123.76
142.7417.89
Table 5. Results of mid-span peak displacement when the number of longitudinal reinforcement changes.
Number of Longitudinal
Reinforcement (mm)
Reinforcement Ratio (%)Displacement (mm)
42.0123.76
84.021.62
126.031.31
168.041.18
Table 6. Results of mid-span peak displacement when the diameter of stirrup changes.
Diameter of Stirrup (mm)Stirrup Ratio (%)Displacement (mm)
6.50.3823.76
80.5822.14
100.9022.04
121.3020.71
Table 7. Results of mid-span peak displacement when the stirrup spacing changes.
Stirrup Spacing (mm)Reinforcement Ratio (%)Displacement (mm)
900.6920.78
1200.5321.99
1800.3823.76
2100.3124.70
Table 8. Results of mid-span peak displacement when the strength of concrete changes.
Strength of Concrete (MPa)Displacement (mm)
2024.90
3023.76
4021.89
5020.11
Table 9. Results of mid-span peak displacement when the scale distance changes.
Scale Distance (m·kg−1/3)Displacement (mm)
0.629.06
0.6525.80
0.6823.76
0.7516.40
Table 10. Results of mid-span peak displacement when the strength of longitudinal reinforcement changes.
Strength of Longitudinal Reinforcement (MPa)Displacement (mm)
30022.75
33522.75
40023.76
50022.73
Disclaimer/Publisher’s Note: The statements, opinions and data contained in all publications are solely those of the individual author(s) and contributor(s) and not of MDPI and/or the editor(s). MDPI and/or the editor(s) disclaim responsibility for any injury to people or property resulting from any ideas, methods, instructions or products referred to in the content.