Abstract
This paper proposes a methodology for reliability analysis of seismic slope stability that incorporates interactions among multiple sliding blocks. The primary sliding direction is first determined using the vector sum method and then the imbalance thrust force along the primary sliding direction is calculated using the slice-wise strategy and, finally, the double integration strategy is adopted to calculate the accumulated sliding displacement within the earthquake duration. The interactions among multiple sliding blocks are incorporated by checking the potential of occurrence for each of the multiple sliding modes. The proposed method is applied to a soil slope with two sliding surfaces. The comparative studies demonstrate that the mean and standard deviation of the sliding displacement considering the interaction of multiple sliding blocks are approximately three times larger than that of a single sliding mode, and the COV (mean value divided by standard deviation) of the two are slightly different. For the single sliding mode, the mean and standard deviation of the sliding displacement calculated using the proposed method are about 1/2 of the traditional Newmark sliding block model, and the failure probability obtained by the proposed method is lower than that from the traditional Newmark sliding block model owing to the difference in the sliding direction. The Peak Ground Acceleration (PGA) exhibits a significant effect on the statistics of 10,000 sliding displacements. The interactions among multiple sliding blocks and the PGA are required to be properly considered in seismic slope reliability analysis.
1. Introduction
Slope instability is well acknowledged to be a form of disaster that is caused by many natural factors, such as earthquakes, rainfall, etc. The evaluation of earthquake-induced slope stability is a major concern in geotechnical engineering. It is a common practice to evaluate seismic slope stability using methods including but not limited to the pseudo-static limit equilibrium method [1,2,3], the sliding block analysis method [4,5,6,7,8,9,10] and numerical stress deformation analysis [11]. The pseudo-static method is simple, easy to implement, but lacks a rational consideration of the earthquake frequency and duration. The stress deformation analysis method can accurately evaluate the seismic stability of the slope, but is complex and time-consuming.
The Newmark sliding block analysis [4] was proposed in 1965 and reached a good balance between the simplified pseudo-static method and complicated stress deformation analysis. The original Newmark sliding block analysis simplifies the seismic landslide as the movement of rigid blocks on the plane. When the seismic acceleration exceeds the yield acceleration of the sliding block, sliding occurs. The movement of the sliding block eventually ends with the relative velocity between the block and the plane being zero. The accumulated sliding displacement is used to assess the seismic slope stability. In view of the assumptions of the traditional Newmark sliding block analysis, such as the rigid block and sliding block along the plane, the modified models taking into account the dynamic response of the sliding body have been developed and they are categorized into decoupled and coupled methods.
The decoupled method was first developed by Makdisi and Seed [12], where the dynamic response of the soil mass is first determined and is subsequently adopted to conduct Newmark sliding block analysis. Zhang et al. [13] developed a method for the performance-based assessment of permanent slopes based on 2-D dynamic analysis based on the decoupled method. The coupled method was first proposed by Rathje and Bray [14], who developed a nonlinear fully coupled stick-slip deformable sliding mass model. Du et al. [15,16] quantitatively examined how the variabilities of the slope property parameters influence the seismic slope displacement using the fully coupled method. Ji et al. [17] established an improved model considering the nonlinear coupled response of the sliding block and the degradation of yield acceleration. Among them, although the improved decoupled and coupled analysis methods reasonably consider the relationship between the seismic response and sliding displacement of the slope, and make an important contribution to the evaluation of the seismic slope stability, it is inevitable that only the single critical sliding surface of the slope is considered. In fact, there may be multiple failure surfaces on the slope, especially under earthquake action.
To address these concerns, Song et al. [18] proposed a multi-block sliding method, which considers the interaction of sliding blocks to calculate the permanent displacement of the slope on the basis of rigid sliding blocks. In 2021, Song et al. [19] proposed a generalized seismic sliding model for slopes with the presence of multiple sliding blocks. However, considering that the instability of the sliding block along its shear plane and the instability of the slope depends on the yield acceleration of the slope, a Newmark sliding block model based on the unbalanced force of the sliding block along the primary sliding direction will be more conducive to multi-sliding blocks analysis [20,21,22].
This paper aims to propose a Newmark sliding block model along the primary sliding direction considering the interactions between multiple sliding blocks, based on which economical reinforcements can be designed to prevent seismic slope failure and, hence, to attain sustainable ecological development. This paper starts with the description of the Newmark sliding block model using the imbalance thrust force method in the primary sliding direction, followed by the determination of the primary sliding direction. Then, the proposed methodology for reliability analysis of seismic slopes is introduced in detail. The proposed method is applied to an example slope. The interaction between multiple sliding blocks is incorporated into the analysis, and the sliding displacement and failure probability are calculated. Finally, the discussions and conclusions are presented.
2. The Newmark Sliding Block Model Using the Imbalance Thrust Force Method in Primary Sliding Direction
The slope failures initiate along a specific sliding surface and propagate along a primary direction, to which the sliding displacements can be associated. To determine the primary direction, the vector sum method developed by Guo et al. [23,24] is adopted based on the assumption of the imbalance thrust force method. The fundamentals regarding the vector sum method and imbalance thrust force method are described briefly in the following section.
2.1. The Newmark Sliding Block Model Using the Imbalance Thrust Force Method
A circular sliding block is shown in Figure 1 and has a primary sliding direction of αm. The forces acting on the slice i are also illustrated in Figure 1. Where ah(t) is the horizontal seismic acceleration acting at the slice i center O; mi is the mass of the slice i; Wi is the self-weight acting at the slice i center O; Li is the left normal inter-slice force of the slice i; Ri is the right normal inter-slice force of the slice i; αi is the inclination angle of the slice i base (anti-clockwise rotation is positive). Following the assumption of the imbalance thrust force method, Li has the same inclination angle as the slice i base and Ri has the same inclination angle as the slice i + 1 base; Ni is the resultant normal force at the slice i base center; Ti is the resultant shear force at the slice i base.
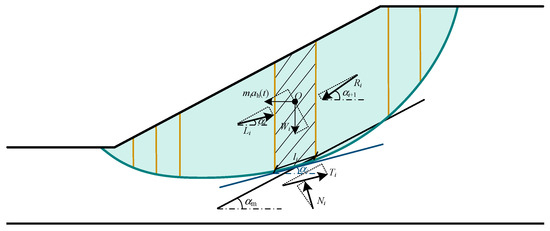
Figure 1.
Newmark sliding block model using the imbalance thrust force method.
The force equilibriums along the directions parallel to and perpendicular to the slice i base are considered, respectively [20,21,22]:
Equations (1) and (2) are reformulated as:
The shear force Ti is determined according to the Mohr-coulomb strength criteria:
where = the cohesion of the slice i base; = the internal friction angle of the slice i base; li = the length of the slice i bottom.
Substitute Equation (4) into (5), we obtain:
Substitute Equation (3) into Equation (6) to obtain the left normal inter-slice force Li,
Let Li(t) =Ai(t) +Bi Ri, where
The force of the soil slice i is projected to the primary sliding direction and the imbalance force Fi (t) along the primary sliding direction αm downward is:
Summing up the imbalance force Fi(t) for all of the slices eliminates the left and right normal inter-slice force, and the total imbalance force F(t) is:
For the ground acceleration history, when the total unbalanced force F(t) is greater than zero, the sliding block begins to slide, and the acceleration of the sliding block along the primary sliding direction can be determined as:
where M = Σmi. The sliding velocity and sliding displacement u(t) are calculated by integrating Equation (13) over the time t. The accumulated sliding displacement u = Σu(t).
2.2. Determination of the Primary Sliding Direction of the Sliding Block
The vector sum method proposed by Guo et al. [23,24] is used to determine the primary sliding direction of the sliding block. Referring to Figure 2, the considered sliding block is divided into a set of vertical slices.
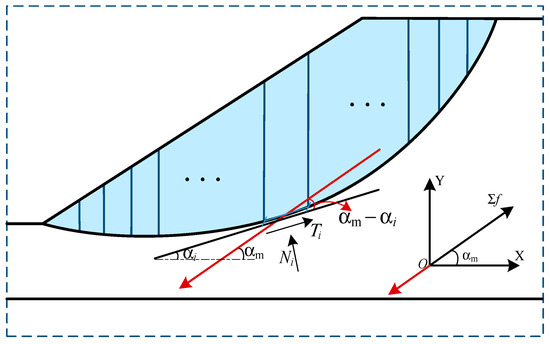
Figure 2.
Determination of the primary sliding direction.
The forces acting on the slice i base are Ti and Ni. When determining the primary sliding direction, only static forces are considered. In accordance with the friction theory, the sliding direction of slice i should be along the tangential direction of the slice base, i.e., along the downward αi. The mobilized Tis when the sliding block arrives at the limit equilibrium state are used to calculate the primary sliding direction using the following equation:
The primary sliding direction of the sliding block is along the downward αm.
3. Seismic Reliability Analysis of Slope Based on the Proposed Method
3.1. Synthesis of Artificial Seismic Acceleration
To consider the randomness and occasionality of seismic force, a seismic acceleration corresponding to the site type and earthquake intensity is artificially synthesized for the reliability analysis of seismic slopes [9,25,26,27,28,29]. Following the previous research [5,30], the synthesis of an artificial seismic acceleration record must be in good agreement with the target response spectrum, as shown in Figure 3a. Figure 3b shows the artificial seismic acceleration with PGA = 0.1 g. The seismic accelerations with PGA = 0.2, 0.3, 0.4 and 0.5 g are generated respectively based on the target response spectrum.
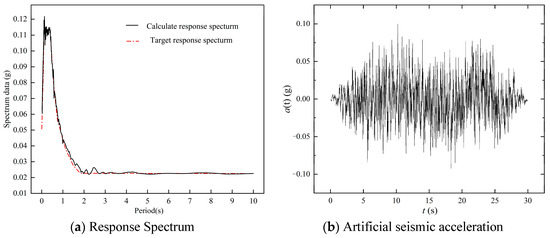
Figure 3.
Synthesis of artificial earthquakes.
3.2. Seismic Reliability Analysis of Slope Based on the Proposed Method
It is well recognized that uncertainties in the soil strength parameters of the slope significantly affect the stability of the slope [31,32,33,34,35,36,37,38,39]. To incorporate the uncertainties into the reliability analysis of a seismic slope, the soil strength parameters are regarded as random variables following specified distributions, and N random samples are generated for the reliability analysis of a slope using Monte Carlo simulation [40,41,42,43].
In Figure 4, the reliability analysis of the slope mainly includes three parts: (1) Determine the sliding mode of the slope; (2) The sliding displacement of the slope is calculated using the Newmark sliding block model using the imbalance thrust force method in the primary sliding direction; (3) MCS simulation. First, the potential sliding blocks and sliding modes of slope instability are determined. The single critical sliding surface (CSS) of the slope is defined as the single sliding mode, and the interaction between sliding blocks is incorporated when there are multiple representative sliding surfaces (RSS). The interaction of multiple sliding blocks is described in detail in 4.2.1. Then, for a specific sliding block, the primary sliding direction αm is determined using vector sum method, as presented in Section 2.2, and the imbalance thrust force method is used to analyze the force of the sliding block to determine the imbalance force F(t) projected to the primary sliding direction, and the sliding displacement of the slope is calculated using the double integration strategy, as shown in Section 2.1. Following the Monte Carlo simulation, a sufficiently large number of random samples are considered. For each sliding mode, the above steps are repeated to calculate the sliding displacements corresponding to N random samples and different PGA, and then the failure probability pf of the slope is calculated.
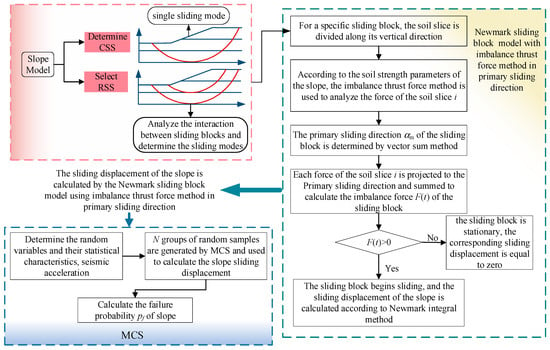
Figure 4.
Flowchart of seismic slope reliability analysis.
4. Illustrative Example
The proposed method is applied to a cohesive soil slope to investigate the effect of multiple sliding modes on the reliability of the seismic slope. A cohesive soil slope with a height of 6 m and a slope angle of 18.4°, corresponding to an inclination ratio of 1:3 (H:V), is shown in Figure 5. The considered slope has three soil layers with equal thickness of 4.5 m, denoted by soil layer-1, soil layer-2 and soil layer-3, respectively. The short-term shear strength of the cohesive soil is characterized by the undrained shear strength Su, and the saturated unit weight of the soil is γsat. Table 1 summarizes the statistics of the soil strength parameters. Su1, Su2 and Su3 are log-normally distributed random variables. The respective means and COV of Su1, Su2 and Su3 are 18 kPa and 0.3, 20 kPa and 0.2 and 25 kPa and 0.3. The γsat of the three soil layers are taken as a constant of 18 kN/m3 and defined as γsat1, γsat2, γsat3.
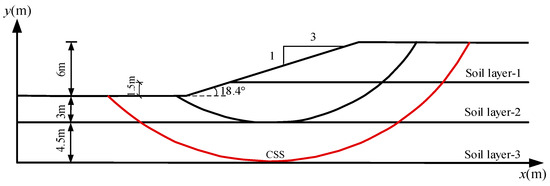
Figure 5.
Cohesive soil slope model.

Table 1.
Statistics of soil strength parameters.
4.1. Reliability Analysis of Soil Slope with CSS
4.1.1. Reliability Analysis Oil Slope with CSS Using the Proposed Method
The imbalance thrust force method is used to calculate the Factor of Safety (FS) for a candidate sliding surface. The CSS is determined to be the red sliding surface in Figure 5. The proposed method is used to calculate the failure probability, pf, of the seismic slope with the single sliding mode CSS. The randomness of seismic forces is simply represented using artificially generated ground motions with different PGAs. The Newmark sliding block model with the imbalance thrust force method in the primary sliding direction is used to calculate the sliding displacements corresponding to 10,000 random samples. The failure probability of the seismic slope is approximated by the ratio of the number of failure samples to 10,000. Based on the sensitivity studies, 10,000 random samples are sufficiently large to obtain a pf with fair accuracy.
Figure 6a plots the histogram of the 10,000 obtained displacements under different PGAs. The 10,000 displacements are categorized into five displacement-ranges, i.e., (0, 1], (1, 10], (10, 100], (100, 1000] and (1000, +] cm. The ratio of the number of displacements within a specific displacement-range to 10,000 is named the frequency related to the displacement-range. It is seen that the maximum frequency is 60%, 35%, 40%, 45% and 45% under PGA = 0.1, 0.2, 0.3, 0.4 and 0.5 g, respectively. The corresponding displacement-ranges are (0, 1], (1, 10], (10, 100], (10, 100] and (100, 1000] cm. The results indicate that as the PGA increases, the displacement-range with the maximum frequency moves rightward. Under PGA = 0.1 g, 0.2 g, 0.3 g, 0.4 g and 0.5 g, the means of the sliding displacements are 317.71, 351.89, 411.52, 495.86 and 602.78 cm, respectively. The respective standard deviations are 1234.65, 1231.07, 1228.88, 1230.46 and 1237.16 cm. Although the mean of the sliding displacements increases considerably with the increase in the PGA, the standard deviation varies slightly at 1230 cm, demonstrating that the coefficient of variation of the sliding displacements decreases as the PGA increases.
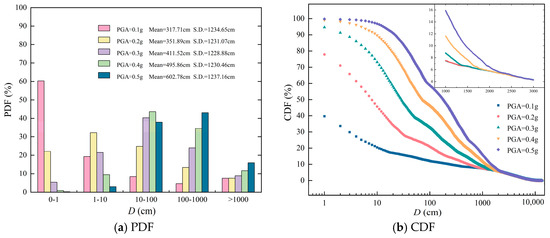
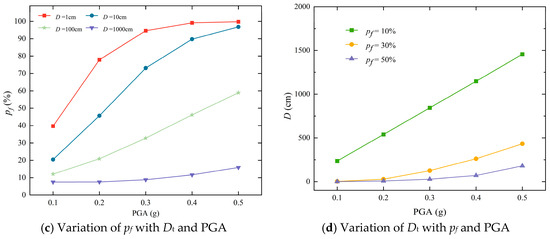
Figure 6.
Results with CSS from proposed method.
The cumulative distribution function (CDF) of the sliding displacement is shown in Figure 6b. If a displacement threshold Dt of the slope is defined, the sliding displacements larger than this threshold are regarded as an unsatisfactory response of the slope, i.e., slope failure occurs. The CDF is readily extended to calculate the failure probability if Dt is specified. Figure 6c shows the variation of the failure probability with Dt. Consider Dt = 10 cm, for example, the failure probability of the slope is 20.44% at PGA = 0.1 g, 45.69% at PGA = 0.2 g, 73.13% at PGA = 0.3 g, 89.74% at PGA = 0.4 g and 96.84% at PGA = 0.5 g, respectively. Similar trends have been observed for Dt = 1, 100, 1000 cm. It is noticed that the failure probability increases with the increase ofin PGA, and vice versa, under a given Dt. On the other hand, if the target failure probability is given, Dt can be determined based on the CDF. Figure 6d demonstrates the variation of Dt under different target failure probabilities. Consider target pf = 10%, as the PGA rises from 0.1 g to 0.5 g, the displacement threshold Dt of the slope increases linearly from 236 to1455.5 cm, respectively. It is noted that with the increase in the earthquake intensity, the displacement threshold required to maintain a target failure probability increases.
4.1.2. Comparison of pf between the Proposed Method and Traditional Newmark Sliding Block Model
The results calculated using the proposed method and the traditional Newmark sliding block model are compared and analyzed [44]. Figure 7a compares the means and standard deviations of 10,000 sliding displacements from the proposed method and traditional Newmark sliding block model. The means of the 10,000 sliding displacements calculated using the proposed method are 317.71, 351.89, 411.52, 495.86 and 602.78 cm, while the corresponding means calculated using the traditional Newmark sliding block model are 590.11, 624.22, 694.76, 881.85 and 993.27 cm, under PGA = 0.1 g, 0.2 g, 0.3 g, 0.4 g and 0.5 g, respectively. The standard deviations of the 10,000 sliding displacements calculated using the proposed method are 1234.65, 1231.07, 1228.88, 1230.46 and 1237.16, while the corresponding standard deviations calculated using the traditional Newmark sliding block model are 2293.25, 2287.44, 2278.89, 2288.37 and 2272.16 cm, under PGA = 0.1 g, 0.2 g, 0.3 g, 0.4 g and 0.5 g, respectively. It is evident that the mean and standard deviation obtained using the proposed method are significantly smaller than those from the traditional Newmark sliding block model. This is mainly due to the assumption of the sliding direction, which is assumed to be horizontal, whereas it is along a primary sliding direction derived using vector sum Equation (14).
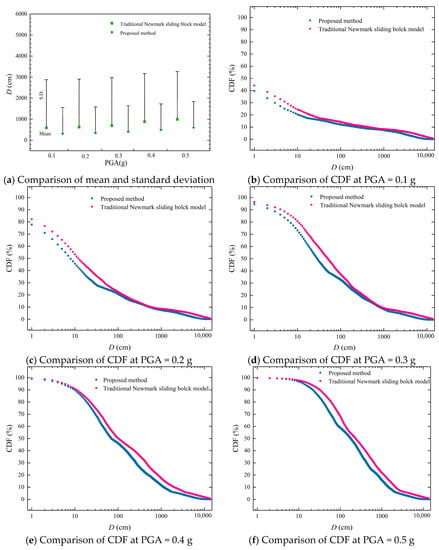
Figure 7.
Proposed method V.S. Traditional Newmark sliding block model.
Figure 7b–f compare the CDF of 10,000 sliding displacements under different PGAs, respectively. The slope pf calculated using the proposed method is lower than that in the traditional Newmark sliding block model under the same PGA and displacement threshold. When the PGA is small, such as PGA < 0.3 g, the pf calculated using the two methods has a large difference in the small displacement range [1, 100], while, when PGA > 0.3 g, the pf has a large discrepancy in the large displacement range [10, 1000]. For example, under PGA = 0.1 g and Dt = 10 cm, the slope pf calculated using the proposed method is 20%—that is, 80% of sliding displacement is less than 10 cm—and the slope pf calculated using the traditional Newmark sliding block model is 25%. In addition, 75% of the sliding displacement is less than 10 cm; otherwise, when PGA = 0.5 g, the slope pf calculated using the proposed method is 97%—that is, 3% of the sliding displacement is less than 10 cm—while the slope pf calculated using the traditional Newmark sliding block model is 98% and 2% of the sliding displacement is less than 10 cm.
4.2. Reliability Analysis of Seismic Soil Slope Considering Multiple Sliding Blocks with Interactions
Song et al. [18] proposed a multi-block sliding method for calculating the permanent displacement of a slope based on the concept of the original Newmark method, considering the complex interaction between rigid blocks. For a complex slope with multiple soil layers, as shown in Figure 5, the interaction between multiple sliding blocks is considered according to Song et al. [18]. The sliding displacement of the slope is calculated using the Newmark sliding block model using the imbalance thrust force method in the primary sliding direction, as will be demonstrated in the next section.
4.2.1. Determination of Multiple Sliding Modes
The multiple sliding surfaces for complex soil slopes have been identified by analyzing the correlations in the FS among a large number of potential sliding surfaces in the previous research [45,46,47]. Following the previous research method, two sliding surfaces are distinguished, and they are shown in Figure 5 (in the red and black line, respectively). Four sliding modes are pertinent if the slope fails along any of the two sliding surfaces. Figure 8b shows sliding mode1, where the shallow sliding block (encompassed by slope surface and shallow sliding surface) slides along the primary sliding direction . Figure 8c shows sliding mode2, where the deep sliding block (encompassed by slope surface and deep sliding surface) slides along the primary sliding direction . Figure 8d shows sliding mode3 and sliding mode4. In the case of sliding mode3, the shallow sliding block slides first along the primary sliding direction , and then the remaining sliding block (encompassed by shallow sliding surface and deep sliding surface) slides along the primary sliding direction . For sliding mode4, the deep sliding block first slides along the primary sliding direction , and then the shallow sliding block breaks away. Each of the four sliding modes is checked by comparing the imbalance force of the deep and shallow sliding block at each time step of seismic acceleration.
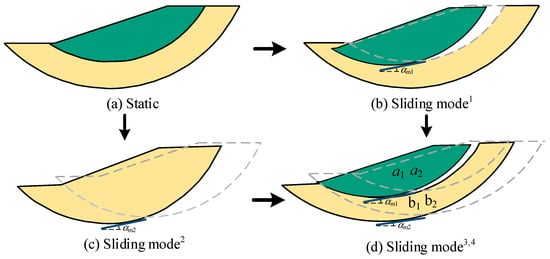
Figure 8.
Multiple sliding modes regarding two sliding blocks with interactions.
4.2.2. Comparison of Accumulated Sliding Displacement for Different Methods
The accumulated sliding displacements of the slope when the Sus are kept at their respective means are calculated using different methods and are compared in order to investigate the effect of interactions between multiple sliding blocks on the result. A total of five methods are adopted, and they are: (1) Method 1, where the CSS-based accumulated sliding displacement is calculated using the traditional Newmark sliding block model; (2) Method 2, where the CSS-based accumulated sliding displacement is calculated using the proposed method; (3) Method 3, where the RSS with minimum yield acceleration-based accumulated sliding displacement is calculated using the traditional Newmark sliding block model [44]; (4) Method 4, where the RSS without interactions-based accumulated sliding displacement is calculated using the proposed method; (5) Method 5, where the RSS with interactions (i.e., multiple sliding modes as shown in Figure 8 are considered)-based accumulated sliding displacement is calculated using the proposed method. Figure 9 shows the accumulated sliding displacements obtained from the five different methods. The variation of the accumulated sliding displacement from Method 5 with duration t is shown in the black solid line and the final value is 39.62 cm. The red solid line represents the variation of the accumulated sliding displacement from Method 4 with duration t, and the respective final value if 23.62 cm. Similarly, the final values from Methods 3, 2 and 1 are 29.42, 22.29 and 29.42 cm, and are shown in green, blue and purple lines, respectively. It is observed that the accumulated sliding displacement from Method 5 is the largest, owing to the consideration of the interactions between two sliding blocks. The second largest values are from Method 1 and Method 3. The identical value between Method 1 and Method 3 is due to the fact that the CSS and the RSS without interactions are actually the same sliding surface (i.e., the red line in Figure 5). Method 4 yields the third largest value, which is 23.62 cm, where either the sliding surface in the black line or that in the red line slides, neglecting the interactions between these two sliding blocks. The smallest value is from Method 2, where the CSS is considered and the proposed method is adopted.
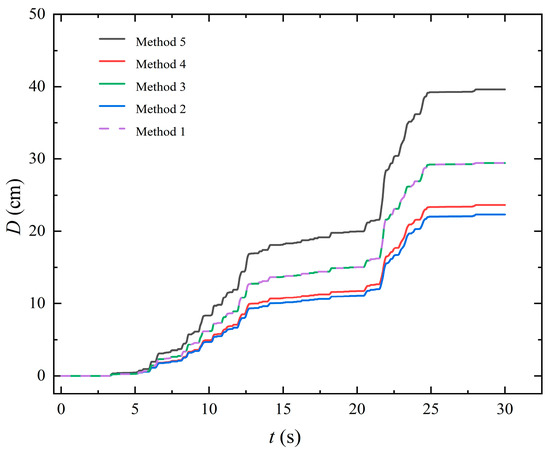
Figure 9.
Comparison of accumulated sliding displacements.
4.2.3. Reliability Analysis of Soil Slope Using Method 5
Method 5, which incorporates the interactions between two sliding blocks, is adopted to conduct reliability analysis of a soil slope. Figure 10 illustrates the sliding displacement distribution, means and standard deviations and pf of 10,000 sliding displacements using Method 5.
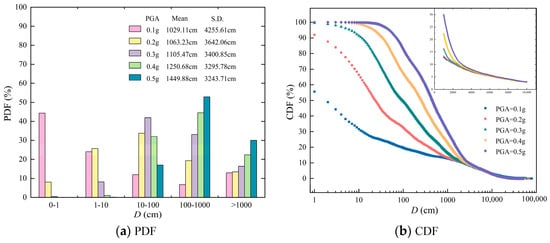
Figure 10.
Reliability analysis of soil slope from method 5.
Figure 10a plots the histogram of 10,000 obtained displacements under different PGAs. The 10,000 displacements are categorized into five displacement-ranges, i.e., (0, 1], (1, 10], (10, 100], (100, 1000] and (1000, +] cm. It is seen that the maximum frequency is 44%, 34%, 42%, 45% and 53% under PGA = 0.1, 0.2, 0.3, 0.4 and 0.5 g, respectively. The corresponding displacement-ranges are (0, 1], (10, 100], (10, 100], (100, 1000] and (100, 1000] cm. The results indicate that as the PGA increases, the displacement-range with the maximum frequency moves rightward. When PGA = 0.1, 0.2, 0.3, 0.4 and 0.5 g, the means of the 10,000 sliding displacements calculated using Method 5 are 1029.11, 1063.23, 1105.47, 1250.68 and 1449.88 cm, respectively. The corresponding standard deviations are 4255.61, 3642.06, 3400.85, 3295.78 and 3243.71 cm, respectively. The respective COVs (the mean is divided by standard deviation) are 4.14, 3.43, 3.08, 2.64 and 2.24. The mean of the 10,000 sliding displacements increases considerably and the standard deviation decreases gradually, and the coefficient of variation decreases with the increase in the PGA. The cumulative distribution function (CDF) of the sliding displacement is shown in Figure 10b. Under a given Dt, the slope failure probability increases with the increase in the PGA. Conversely, for a specific target failure probability, Dt increases with the increase in the PGA.
4.2.4. Comparison of Results from Method 5, Method 4, and Method 2
To investigate the effect of the sliding modes on the reliability results of the seismic soil slope, a comparison of the results calculated using Methods 5, 4, and 2 is made in this section. Figure 11a shows the respective means, standard deviations and COVs from Methods 5, 4 and 2 under PGA = 0.1, 0.2, 0.3, 0.4 and 0.5 g. When PGA = 0.1, 0.2, 0.3, 0.4 and 0.5 g, the means of the 10,000 sliding displacements calculated using Method 5 are 1029.11, 1063.23, 1105.47, 1250.68 and 1449.88 cm, and the corresponding standard deviations are 4255.61, 3642.06, 3400.85, 3295.78 and 3243.71 cm, respectively. The respective COVs (the mean is divided by standard deviation) are 4.14, 3.43, 3.08, 2.64 and 2.24. The means of the 10,000 sliding displacements calculated using Method 4 are 624.95, 677.93, 769.52, 898.09 and 1060.99 cm, and the standard deviations are 1903.34, 1897.35, 1892.21, 1890.72 and 1894.72 cm, respectively. Similarly, when PGA = 0.1, 0.2, 0.3, 0.4 and 0.5 g, the means of the 10,000 sliding displacements calculated using Method 2 are 317.71, 351.89, 411.52, 495.86 and 602.78 cm, and standard deviations are 1234.65, 1231.07, 1228.88, 1230.46 and 1237.16 cm, respectively. The respective COVs from Method 4 and 2 are 3.04, 2.80, 2.46, 2.11, 1.79 and 3.89, 3.50, 2.99, 2.48, 2.05.
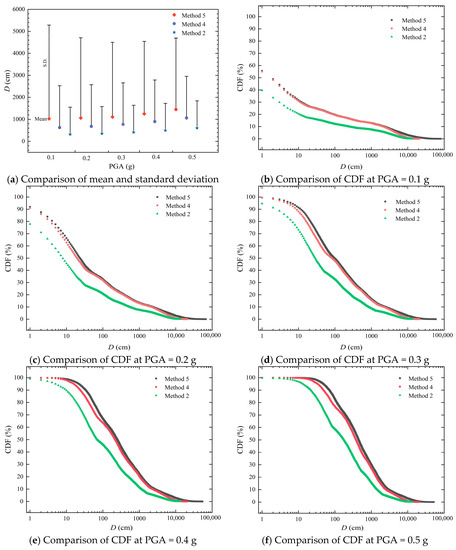
Figure 11.
Comparison of Methods 5, 4 and 2 from proposed method.
The comparison shows that under the same PGA, the slope sliding displacement calculated through considering the interaction between the sliding blocks in Method 5 is the largest, and its average and standard deviation are about triple that calculated using Method 2 with a single sliding mode, and twice that calculated using Method 4 without considering the sliding body interaction. By comparing the COV of the three methods, it can be noted that Method 5 has the highest dispersion. The above results show that considering the interaction between sliding blocks can significantly increase the sliding displacement of the slope. The single sliding mode and the lack of interaction between sliding blocks lead to more conservative results.
Figure 11b compares the CDFs calculated using Methods 5, 4 and 2 with PGA = 0.1 g. Under Dt = 10 cm, the slope pf calculated using Method 2 is 20.44%, 30.90% in Method 4, and 31.61% using Method 5. When PGA is 0.2, 0.3, 0.4 and 0.5 g, the CDFs calculated using methods 5, 4 and 2 are plotted in Figure 11c–f, respectively. Under the same PGA and Dt, the slope pf calculated using Method 5 is the maximum, the slope pf calculated using Method 2 is the minimum, and the pf calculated using Method 4 is slightly lower than that calculated using Method 5. The interactions between two sliding blocks lead to more potential sliding modes, which contribute to the accumulated sliding displacements.
5. Discussions
During an actual earthquake, slope instability sliding is a complicated and changeable process. Although this paper presents a new Newmark slider analysis model along the main sliding direction, it is still based on some assumptions. The three assumptions of the proposed method are: (1) the slope failure surface is circular; (2) The sliding block is a rigid block; (3) The imbalance thrust force method is used to analyze the force of the soil slice. Despite these potential limitations, there are some improvements in the proposed method. The advanced feature of the proposed method compared with the traditional Newmark sliding block model is that the interaction between the sliding bodies is considered, and the addition of multiple sliding modes will be more in line with the instability characteristics of slope engineering. In addition, a new model for calculating the slope sliding displacement is proposed by considering the primary sliding direction of the slide block and the unbalanced force along the primary sliding direction, which is different from the calculation of the yield acceleration along the shear sliding surface proposed by Song et al. [18]. It provides a different perspective for the study of the seismic performance of soil slopes in the future. The subsequent research will focus on complex slopes, where the proposed method can be extended to three or more sliding blocks.
6. Conclusions
The traditional Newmark sliding block model assumes the horizontal sliding direction, which is not always true in geotechnical engineering. To properly address the sliding direction issue, the vector sum method is adopted to determine the primary sliding direction and it is associated with the sliding displacement. The imbalance thrust force method is used to calculate the imbalance force F along the primary sliding direction of the sliding block at each time step within seismic acceleration. The interactions between two sliding blocks are incorporated by checking the potential of sliding along different sliding modes. The proposed method is validated against a complicated soil slope containing three soil layers, and the obtained results are compared with the traditional Newmark sliding block model. The comparative studies demonstrate the following insights:
- (1)
- For a single sliding mode of CSS, the mean and standard deviation of the sliding displacement calculated using the proposed method are about 1/2 of the traditional Newmark slider model. The CDF calculated using the proposed method is lower than that obtained using the traditional Newmark sliding block model. This mainly depends on the assumptions of the slide direction.
- (2)
- If the interactions between two sliding blocks are considered, a total of four sliding modes are incorporated into the accumulated sliding displacement. The traditional Newmark sliding block model cannot properly consider the interactions between multiple sliding blocks. The proposed method, by considering these interactions, leads to a larger mean, standard deviation and COV of the 10,000 sliding displacements compared with the single sliding mode.
- (3)
- The mean of the 10,000 sliding displacements increases considerably, the standard deviation decreases gradually and the coefficient of variation decreases with the increase in the PGA.
Author Contributions
Methodology, C.L.; software, G.Y.; investigation, Y.F.; resources, H.Y.; writing—review & editing, L.L.; supervision, Z.X.; funding acquisition, J.L. All authors have read and agreed to the published version of the manuscript.
Funding
This research was funded by National Natural Science Foundation of China grant number 52171264.
Institutional Review Board Statement
Not applicable.
Informed Consent Statement
Not applicable.
Data Availability Statement
Readers can obtain data supporting reported results from the author via e-mail address li1728506042@163.com.
Acknowledgments
The work described in the paper was supported by the National Natural Science Foundation of China (Grant No. 52171264), this financial support is gratefully acknowledged. The authors also thank the anonymous reviewers and editor for their valuable comments, which improved the quality of the manuscript.
Conflicts of Interest
The authors declare no conflict of interest.
References
- Bray, J.D.; Travasarou, T. Pseudostatic coefficient for use in simplified seismic slope stability evaluation. J. Geotech. Geoenviron. Eng. 2009, 135, 1336–1340. [Google Scholar] [CrossRef]
- Deng, D.; Li, L.; Zhao, L. Research on quasi-static method of slope stability analysis during earthquake. J. Cent. South Univ. (Sci. Technol.) 2014, 45, 3578–3588. (In Chinese) [Google Scholar]
- Li, L.; Chu, X.; Pang, F.; Li, R. Discussion on suitability of pseudo-static method in seismic slope stability analysis. World Earthq. Eng. 2012, 28, 57–63. (In Chinese) [Google Scholar]
- Newmark, N.M. Effect of earthquake on dams and embankments. Geotechnique 1965, 15, 139–159. [Google Scholar] [CrossRef]
- Gao, S.F.; Feng, Y.F. Simplified analysis method of bank slope seismic stability based on Newmark’s sliding block method. Port Waterw. Eng. 2022, 6, 40–48. (In Chinese) [Google Scholar] [CrossRef]
- Ji, J.; Liao, H.J.; Low, B.K. Modeling 2-D spatial variation in slope reliability analysis using interpolated autocorrelations. Comput. Geotech. 2012, 40, 135–146. [Google Scholar] [CrossRef]
- Jiang, S.H.; Li, D.Q.; Zhang, L.M.; Zhou, C.B. Slope reliability analysis considering spatially variable shear strength parameters using a non-intrusive stochastic finite element method. Eng. Geol. 2014, 168, 120–128. [Google Scholar] [CrossRef]
- Liu, A.; Cui, Y.; Liu, T. A prediction model for permanent displacement of seismic slopes condering dynamic critical acceleration. China Earthq. Eng. J. 2012, 43, 445–452. (In Chinese) [Google Scholar]
- Yang, T.; Huang, L.; Feng, J.; Wu, H.; Qi, Z. Dynamic stability analysis of landslide based on earthquake propagation process. Rock Soil Mech. 2017, 38, 2708–2712. (In Chinese) [Google Scholar]
- Veylon, G.; Luu, L.H.; Merckle, S.; Bard, P.Y.; Delvallée, A.; Carvajal, C.; Frigo, B. A simplified method for estimating Newmark displacements of mountain reservoirs. Soil Dyn. Earthq. Eng. 2017, 100, 518–528. [Google Scholar] [CrossRef]
- Fredlund, D.G.; Krahn, J. Comparison of slope stability methods of analysis. Canad. Geotech. J. 1977, 14, 429–439. [Google Scholar] [CrossRef]
- Makdisi, F.I.; Seed, H.B. Simplified procedure for estimation dam and embankment earthquake induced deformations. J. Geotech. Eng. Div. 1978, 104, 849–868. [Google Scholar] [CrossRef]
- Zhang, J.; Xian, J.T.; Wu, C.G.; Zheng, W.T.; Zheng, J.G. Performance-based assessment of permanent displacement of soil slopes using two-dimensional dynamic analysis. Georisk Assess. Manag. Risk Eng. Syst. Geohazards 2022, 16, 178–195. [Google Scholar] [CrossRef]
- Rathje, E.M.; Bray, J.D. Nonlinear coupled seismic sliding analysis of earth structures. J. Geotech. Geoenviron. Eng. 2000, 126, 1002–1014. [Google Scholar] [CrossRef]
- Du, W.; Wang, G.; Huang, D. Influence of slope property variabilities on seismic sliding displacement analysis. Eng. Geol. 2018, 242, 121–129. [Google Scholar] [CrossRef]
- Du, W.; Wang, G.; Huang, D. Evaluation of seismic slope displacements based on fully coupled sliding mass analysis and NGA-West2 database. J. Geotech. Geoenviron. Eng. 2018, 144, 06018006. [Google Scholar] [CrossRef]
- Ji, J.; Wang, C.W.; Cui, H.Z.; Li, X.; Song, J.; Gao, Y. A simplified nonlinear coupled Newmark displacement model with degrading yield acceleration for seismic slope stability analysis. Int. J. Numer. Anal. Methods Geomech. 2021, 45, 1303–1322. [Google Scholar] [CrossRef]
- Song, J.; Fan, Q.; Feng, T.; Chen, Z.; Chen, J.; Gao, Y. A multi-block sliding approach to calculate the permanent seismic displacement of slopes. Eng. Geol. 2019, 255, 48–58. [Google Scholar] [CrossRef]
- Song, J.; Rodriguez-Marek, A.; Feng, T.; Ji, J. A generalized seismic sliding model of slopes with multiple slip surfaces. Earthq. Eng. Struct. Dyn. 2021, 50, 2595–2612. [Google Scholar] [CrossRef]
- Yamin, M.; Liang, R.Y. Limiting equilibrium method for slope/drilled shaft system. Int. J. Numer. Anal. Methods Geomech. 2010, 34, 1063–1075. [Google Scholar] [CrossRef]
- Li, L.; Liang, R.Y. Limit equilibrium based design approach for slope stabilization using multiple rows of drilled shafts. Comput. Geotech. 2014, 59, 67–74. [Google Scholar] [CrossRef]
- San, P.Z.; Robert, L. Stability analysis of drilled shafts reinforced slope. Soils Found. 2002, 42, 93–102. [Google Scholar] [CrossRef]
- Guo, M.; Ge, X.; Wang, S.; Wang, H. Dynamic stability analysis of slope based on vector sum analysis method. Chin. J. Rock Mech. Eng. 2011, 30, 572–579. (In Chinese) [Google Scholar]
- Guo, M.; Ge, X.; Li, C.; Wang, S.; Liu, Y. Study on potential sliding direction in slope stability analysis based on vector sum method. Chin. J. Geotech. Eng. 2009, 31, 577–583. (In Chinese) [Google Scholar]
- Li, F.P.; Wu, H.; Yang, T.; Zhong, F. Study on seismic coefficient calculation method of slope seismic stability analysis. Shock Vib. 2021, 2021, 9986509. [Google Scholar] [CrossRef]
- Etedali, S.; Zamani, A.A. Semi-active control of nonlinear smart base-isolated structures using MR damper: Sensitivity and reliability analyses. Smart Mater. Struct. 2022, 31, 065021. [Google Scholar] [CrossRef]
- Zamani, A.A.; Etedali, S. Robust output feedback-based neuro-fuzzy controller for seismically excited tall buildings with ATMD accounting for variations in the type of supporting soil. Soil Dyn. Earthq. Eng. 2023, 164, 107614. [Google Scholar] [CrossRef]
- Zamani, A.A.; Etedali, S. Seismic structural control using magneto-rheological dampers: A decentralized interval type-2 fractional-order fuzzy PID controller optimized based on energy concepts. ISA Trans. 2023, 137, 288–302. [Google Scholar] [CrossRef]
- Zamani, A.A.; Etedali, S. New formulas for optimal design of TMD using genetic programming method and their application to control of seismic-excited structures. J. Struct. Constr. Eng. 2023, 10, 67–86. [Google Scholar] [CrossRef]
- Zhang, K.X.; Ling, X.Z. Geotechnical Earthquake Engineering and Engineering Vibration; Science Press: Beijing, China, 2016; Volume 9. (In Chinese) [Google Scholar]
- Alamanis, N.; Dakoulas, P. Effects of spatial variability of soil properties and ground motion characteristics on permanent displacements of slopes. Soil Dyn. Earthq. Eng. 2022, 161, 107386. [Google Scholar] [CrossRef]
- Au, S.K.; Cao, Z.J.; Wang, Y. Implementing advanced Monte Carlo simulation under spreadsheet environment. Struct. Saf. 2010, 32, 281–292. [Google Scholar] [CrossRef]
- Baecher, G.B.; Christian, J.T. Reliability and Statistics in Geotechnical Engineering; John Wiley, Sons: Hoboken, NJ, USA, 2005. [Google Scholar]
- El-Ramly, H.; Morgenstern, N.R.; Cruden, D. Probabilistic slope stability analysis for practice. Can. Geotech. J. 2002, 39, 665–683. [Google Scholar] [CrossRef]
- Yeznabad, A.F.; Molnar, S.; El Naggar, M.H. Probabilistic solution for the seismic sliding displacement of slopes in Greater Vancouver. Soil Dyn. Earthq. Eng. 2021, 140, 106393. [Google Scholar] [CrossRef]
- Zeng, P.; Wang, S.; Sun, X.; Fan, X.; Li, T.; Wang, D.; Feng, B.; Zhu, X. Probabilistic hazard assessment of landslide-induced river damming. Eng. Geol. 2022, 304, 106678. [Google Scholar] [CrossRef]
- Meng, K.; Yu, G.; Li, L.; Xu, Z.; Lei, J.; Fan, Y.; Yu, H.; Xu, L. Deformation-based basal heave reliability analysis and selection on monitoring points for general braced excavations. Sustainability 2023, 15, 8985. [Google Scholar] [CrossRef]
- Bahootoroody, F.; Khalaj, S.; Leoni, L.; De Carlo, F.; Di Bona, G.; Forcina, A. Reliability Estimation of Reinforced Slopes to Prioritize Maintenance Actions. Int. J. Environ. Res. Public Health 2021, 18, 373. [Google Scholar] [CrossRef]
- Di Bona, G.; Falcone, D.; Forcina, A. AHP-TOPSIS model to evaluate maintenance strategy using RAMS and production parameters. Int. J. Oper. Quant. Manag. 2019, 25, 175–201. [Google Scholar]
- Wang, Y.; Cao, Z.; Au, S.K. Practical reliability analysis of slope stability by advanced Monte Carlo simulations in a spreadsheet. Can. Geotech. J. 2011, 48, 162–172. [Google Scholar] [CrossRef]
- Wang, Y. Uncertain parameter sensitivity in Monte Carlo simulation by sample reassembling. Comput. Geotech. 2012, 46, 39–47. [Google Scholar] [CrossRef]
- Wang, Y.; Cao, Z. Expanded reliability-based design of piles in spatially variable soil using efficient Monte Carlo simulations. Soils Found. 2013, 53, 820–834. [Google Scholar] [CrossRef]
- Zhang, L.B.; Guo, J.; Liu, X. Comparative study of methodologies between response surface methods and Monte Carlo methods in slope reliability analysis. Eng. J. Wuhan Univ. 2016, 49, 779–786. (In Chinese) [Google Scholar]
- Yu, G.; Li, C.; Li, L.; Yu, H. Seismic reliability analysis of soil slope based on Newmark sliding block model with representative slip surfaces and response surfaces. Eng. Rep. 2023, e12713. [Google Scholar] [CrossRef]
- Li, L.; Chu, X. Multiple response surfaces for slope reliability analysis. Int. J. Numer. Anal. Methods Geomech. 2015, 39, 175–192. [Google Scholar] [CrossRef]
- Li, L.; Wang, Y.; Cao, Z.; Chu, X. Risk de-aggregation and system reliability analysis of slope stability using representative slip surfaces. Comput. Geotech. 2013, 53, 95–105. [Google Scholar] [CrossRef]
- Zhang, J.; Zhang, L.M.; Tang, W.H. New methods for system reliability analysis of soil slopes. Can. Geotech. J. 2011, 48, 1138–1148. [Google Scholar] [CrossRef]
Disclaimer/Publisher’s Note: The statements, opinions and data contained in all publications are solely those of the individual author(s) and contributor(s) and not of MDPI and/or the editor(s). MDPI and/or the editor(s) disclaim responsibility for any injury to people or property resulting from any ideas, methods, instructions or products referred to in the content. |
© 2023 by the authors. Licensee MDPI, Basel, Switzerland. This article is an open access article distributed under the terms and conditions of the Creative Commons Attribution (CC BY) license (https://creativecommons.org/licenses/by/4.0/).