Abstract
The current study investigates a cogeneration system based on a gas turbine, integrated with a Rankine cycle and an absorption refrigeration cycle, considering energy and exergy perspectives. The fuel used in the gas turbine’s combustion chamber is obtained through biomass gasification, specifically using wood as the biomass fuel. To enhance the system’s performance, solar energy is utilized to preheat the working fluid in the Rankine cycle, reducing the energy required in the heat recovery steam generator. Additionally, an absorption refrigeration cycle is incorporated to recover waste heat from exhaust gases and improve the plant’s exergy efficiency. A two-objective optimization is conducted to determine the optimal operating conditions of the proposed system, considering exergy efficiency and carbon dioxide emission index as criteria. The case study reveals that the gasifier and combustion chamber contribute the most to system irreversibility, accounting for 46.7% and 22.9% of the total exergy destruction rate, respectively. A parametric study is performed to assess the impact of compression ratio, turbine bleed steam pressure, gas turbine inlet temperature, and solar share (the ratio of energy received by solar collectors to biomass fuel input energy) on system performance. The findings demonstrate that maximum energy and exergy efficiencies of the power generation system are achieved at a pressure ratio of 10. Furthermore, a 1% reduction in the gas turbine’s compression pressure ratio can be compensated by a 9.3% increase in the solar share within the steam Rankine cycle.
1. Introduction
Recently, the need for energy resources has risen because of growth in the economies of countries and the global population. Nowadays, the main energy source used to produce electric power in the world is fossil fuels, which cause harmful environmental effects. The increase in carbon dioxide emissions from industrial units and vehicles and the consequent global warming have driven countries to search for suitable alternative energy sources [1]. Wind, solar, biomass, and geothermal energies constitute the most significant renewable sources of energy, which are increasingly becoming priorities for exploitation in the future [2]. According to the Renewable Global Status Report [3], renewable power capacity grew by more than 256 GW during the COVID-19 pandemic.
Biomass is a biological substance obtained from plants and animals and contains large amounts of carbon along with small quantities of oxygen, nitrogen, hydrogen, and heavy metals [4,5]. Wood, alcohol fuels, and solid wastes are the main resources used to produce biomass [4,5]. Biomass takes carbon from the environment during its formation and returns it to the environment when it burns. Meanwhile, fossil fuels produce carbon dioxide during their combustion and increase environmental pollution [6]. Biomass is a promising energy source for producing transportation fuels [7]. One way to use biomass energy is to convert it to syngas via gasification. By using thermal or chemical processes, biomass can be converted to biofuel. Among the conversion processes, gasification has been considered important due to its high effectiveness compared with combustion, thermal decomposition, and liquefaction [8,9]. Biomass can be used in biodiesel fuel production as well as methanol and hydrogen production, and in gas turbine cycles with internal and external combustion chambers. By utilizing the thermal recovery of biomass resources in high-efficiency cycles, overall system efficiency can be significantly enhanced.
In recent decades, decreases in fossil fuel reserves and, as a result, increases in the prices of these resources, as well as increases in pollution caused by their usage, along with the problems in utilizing compression refrigeration cycles, have led to switching to absorption refrigeration systems. The primary benefit of absorption refrigeration systems is their potential for using waste energy from energy conversion cycles (fuel cells, engines, etc.) and renewable energy sources (biomass, geothermal, etc.). Also, the working fluids for these cycles are non-toxic and non-destructive. In this study, a lithium bromide–water solution is employed, mainly because absorption refrigeration cycles operating with this modification have better coefficients of performance than the systems operating with a water–ammonia solution.
Appropriate integration of thermal systems for waste energy recovery and simultaneous production of useful products can significantly increase system efficiency from energy and exergy perspectives. Ahmadi et al. [10] investigated a multi-generation plant using biomass for generating several useful outputs: hydrogen, electricity, fresh water, as well as hot and cold water. The exhaust gases from the biomass combustion chamber were used to provide heat to a domestic hot water generator and the evaporator of an ORC. The second law efficiency was reported as 33% and the overall cost rate as 400 $/h through the multi-objective optimization. Khanmohammadi et al. [11] carried out a thermo-economic assessment of a cogeneration system for electricity and heat. Electricity was supplied using a gas turbine system and an ORC cycle, while heat was supplied with a domestic hot water generator. The combustion process was carried out with the fuel obtained from the biomass gasification procedure. The maximum second law efficiency of the proposed system was calculated at 17.9% via multi-objective optimization. Liu et al. [12] evaluated thermodynamically a hybrid biomass–solar power generation system incorporating a gas turbine for on- and off-design conditions. To provide the heat required for the gas turbine cycle in the hybrid system, two methods were used. Biomass gasification was employed with solar energy for electricity generation purposes in the first case, while the compressed air of the gas turbine cycle received its required heat directly from solar energy in the second case. The overall energy efficiency was determined to be 29.4% in the first case and 28.0% in the second case.
Solar-assisted power plants have been recently considered as a promising option for dealing with climate change and pollution. Bai et al. [13] examined a gas turbine-based electricity generation system with two-stage gasification. In this setup, two types of solar collectors, including line-focus solar collectors and point-focus solar collectors, utilized the thermal power of pyrolysis and gasification processes. Case study results determined an overall energy efficiency of 27.9% for the system. Furthermore, the system’s heat source provided the heat required for biomass gasification in a more appropriate way based on its operating conditions. Amongst other renewable energy resources, solar energy has been extensively studied and applied for the clean production of heat and electricity. Photovoltaic (PV) systems are used for the production of electrical power from the sun. For the generation of solar thermal power, it is common to employ surface solar absorption collectors of different types [14]. Concentrating solar power (CSP) is an important technological option to gradually increase the share of energy produced by renewable energy sources. Central power towers and parabolic trough collectors currently show the most growth as these technologies are installed globally [15]. Khalid et al. [16] thermo-economically investigated a multi-generation system based on solar–biomass resources. The investigated system consisted of two ORCs using solar heating of the evaporator, a biomass-driven GT subsystem, and an absorption refrigeration system. The GT combustion products were utilized to run the absorption refrigeration system. They reported efficiency values of 91.0% and 34.9%, considering energy and exergy as criteria, respectively. Based on the multi-generation system optimization, the electric power net cost was found to be $2,700,000 and the levelized cost of electricity was 0.117 $/kWh. Sarkis et al. [17] evaluated two new system configurations for electricity generation using biomass and solar energy from the perspectives of thermodynamics, economics, and the environment. These configurations comprised gas turbine cycles with a regenerator and biomass fuel and a steam Rankine cycle. In the first configuration, the heat exchanger was placed before the open feed water heater (OFWH) and absorbed solar energy through the Therminol VP-1 interstitial fluid. Therminol VP-1 is a high-performance heat transfer fluid commonly used in various industrial applications, including solar power plants. It has a wide operating temperature range, typically from −40 °C to 400 °C (−40 °F to 752 °F). This makes it suitable for both low-temperature and high-temperature applications in power plants. Therminol VP-1 is known for its excellent thermal stability and compatibility with the operating temperatures of solar power plants, ensuring efficient and reliable heat transfer throughout the system. In the second configuration, the working fluid from the OFWH directly received the solar heat through the concentrating solar power system and entered the gas turbine. According to the economic and environmental analyses for the first and second configurations, levelized electricity cost values were obtained as 79.9 and 74.9 $/MWh, respectively, and carbon dioxide emission indexes were calculated as 0.77 and 0.62 t/MWh, respectively.
Cao et al. [18] evaluated and parametrically studied a multi-generation plant using a solar gas turbine with biomass fuel from four perspectives. Combustion products from the gas turbine passed through an SCO2 cycle heater followed by a heat recovery steam generator; then, they were discharged to the atmosphere. The analyses demonstrated that, although it did little to reduce environmental emissions, using solar energy significantly enhanced the performance of the system. Increasing the number of mirrors in the solar tower boosted the system’s total cost rate while decreasing its net power and exergy efficiency. Also, the pressure ratio of the gas turbine cycle’s compressor had a direct relation with efficiency, cost rate, and unit cost of product. Nazari et al. [19] thermo-economically assessed and optimized a trigeneration system consisting of an ORC, a gas turbine cycle with external combustion, and an absorption refrigeration cycle. The gas turbine cycle preheated the air entering the turbine in a heat exchanger using solar energy. Based on the case study results, the system’s first and second law efficiencies were reported as 55.5% and 20.3%. Moreover, the exergy efficiency was improved by 9% using multi-objective, multi-verse optimization, while the overall cost rate was reduced by 6%. Diyoke et al. [20] assessed two configurations of multi-generation systems in Nigeria. The combustion products exiting the gas turbine subsystem were used for the first configuration to heat water and for the second configuration to supply directly the heat required for the absorption refrigeration system generator. The overall energy efficiencies for both configurations were found to be about 60%, almost equal to the energy efficiency of the standard recuperated cogeneration system, while both configurations emitted 30% less carbon dioxide than the conventional cogeneration system.
Photovoltaic thermal (PVT) systems can significantly increase the efficiency of power plants by generating both electricity and heat simultaneously. By combining PV and thermal collectors, PVT systems can capture more of the sun’s energy and convert it into usable forms. The heat produced by the thermal collectors can be used to generate steam, which can then be used to drive turbines and generate electricity. This process increases the overall efficiency of the power plant, as it allows for more energy to be extracted from the same amount of sunlight. Additionally, PVT systems can help reduce the operating temperature of PV panels, which can improve their performance and extend their lifespan. By integrating PVT systems into power plants, operators can increase their energy output while reducing their environmental impact. A combined heating, cooling, and power generation system using an absorption chiller, a micro-gas turbine, and a low-concentration photovoltaic/thermal heat pump was analyzed by Chu et al. [21], considering thermodynamic, energy-saving, economic, and environmental perspectives. A low-concentration photovoltaic/thermal heat source was utilized for the heat pump for several reasons. The system COP was affected by the electric load, and the COP of the first heat pump was 22.7% and the COP of the second heat pump was 4.75% higher than the COP for the following electric load (FEL) mode, relative to the rated unit. Further, the total annual cost and CO2 emissions per unit building area in the FEL mode were more beneficial. The system exergy and energy efficiencies, respectively, for FEL mode were obtained in summer as 20.0% and 41.9% and in winter as 25.1% and 59.4%. Incorporating biomass with fossil fuel plants presents viable options for addressing environmental and energy issues. Ren et al. [22] analyzed a gas turbine-based power and cooling generation system utilizing natural gas and biomass from energy, economic, and environmental perspectives. The highest exergy destruction rate was observed in the combustor, while the system energy and exergy efficiencies were seen to rise with both the pressure at the ORC turbine inlet and the temperature at the GT inlet. The proposed system exhibited lower environmental impact and was found to provide an efficient, cost-effective, and environmentally friendly option for simultaneous electricity generation and cooling. Cameretti et al. [23] proposed a hybrid distributed energy plant with reduced environmental impacts. To boost power generation efficiency, the proposed system integrates solar energy with an MGT system. The system’s solar component included a parabolic trough collector that heated a heat transfer fluid used to preheat the compressed air prior to its entry into the combustor of the MGT system. The total reflective area of parabolic toughs was 358.3 m2, and the solar field efficiency was 47.2% at the vernal equinox, 12-00 h, and 40.83° latitude. In addition, the system incorporated a humid-air or steam injection option to improve its performance. The novel cogeneration system allowed flexibility in producing heat and/or electricity. Several organic fluids for the bottoming ORC were examined, and a thermodynamic analysis was performed. Results revealed that, by using the solar field and the ORC plant, the system exhibits enhanced efficiency and power output. Dabwan et al. [24] assessed and developed a gas turbine system with intercooling applicable to power utilities that incorporated solar preheating to improve efficiency and reduce greenhouse gas and other emissions. Evaluating system performance with thermodynamic simulation and analysis demonstrated that the energy and exergy efficiencies of the system exceed those for a conventional gas turbine system. The intercooling and solar preheating components improved the system performance and reduced greenhouse gas emissions. In a study by Hai et al. [25], a waste-to-energy system utilizing a biomass-combined energy approach was developed and investigated. The system was designed for electricity generation, cooling, and freshwater production. It incorporated multiple cycles, including a biomass waste integrated gasifier–gas turbine cycle, a high-temperature fuel cell, a Rankine cycle, an absorption refrigeration system, and a flash distillation system for seawater desalination. The study used EES software (version 10.561) for preliminary analysis and then transferred the data to MATLAB for optimization and evaluating operational factors with the assistance of artificial intelligence. Increasing the fuel flow rate from 4 to 6.5 kg/s resulted in a 51% reduction in cost and a 6.5% increase in energy efficiency. The highest improvement in exergetic efficiency occurred when the gas turbine’s inlet temperature increased. Regardless of the type of biomass used, changes in fuel discharge and gas turbine inlet temperature had a similar impact on system performance.
The comparison of the most important systems mentioned above is represented in Table 1. As mentioned above, the appropriate integration of thermal components in cogeneration and multigeneration systems can enhance their energy, exergy, and environmental performances. So, a state-of-the-art configuration for a cogeneration system, which consists of a gas turbine, solar-assisted steam Rankine, and absorption refrigeration cycles, is introduced and analyzed thermodynamically and environmentally in the present work. The idea is to supply some of the required energy of the Rankine cycle from solar energy as a renewable energy source to reduce the heat load of HRSG and incorporate an absorption refrigeration cycle in the system to recover the waste heat of exhaust gases and raise the efficiency of the entire system. Considering that the cogeneration products are of different energy types (electricity and cooling), exergy efficiency is considered a performance criterion. Carbon dioxide emissions, another criterion for environmental pollution, are also quantified under various system operating conditions. Finally, a two-objective optimization is performed to identify the optimal operating conditions for the cogeneration system, considering the following criteria: CO2 emission index and exergy efficiency.

Table 1.
Comparison of the most important cogeneration and multigeneration systems investigated in the present work.
2. System Layout Description
The present research analyzes a gas turbine-based cogeneration system integrated with a Rankine cycle as well as an absorption refrigeration cycle from energy and exergy viewpoints. The fuel consumed in the combustion chamber of the gas turbine is supplied through a biomass gasification process, in which the biomass fuel is assumed to be wood. The proposed cogeneration system’s configuration is represented in Figure 1.
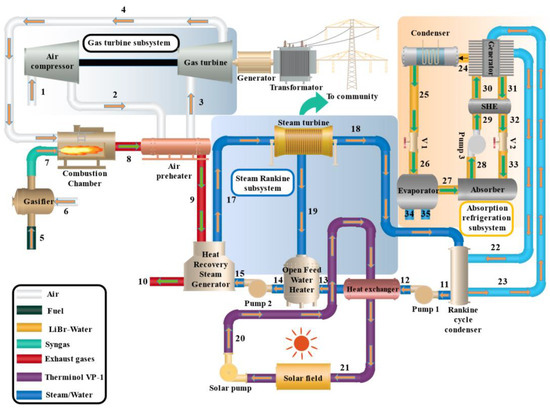
Figure 1.
Cogeneration system considered.
The upstream system is a gas turbine system whose required heat is supplied through biomass combustion. The thermal energy of the exhaust gases is used to provide the energy requirement for the Rankine cycle, and finally, the energy of the Rankine cycle condenser is used to run the lithium bromide-water refrigeration system. Also, for the investigated system, solar energy provides preheating of the Rankine cycle working fluid.
According to Figure 1, air from the atmosphere enters the compressor and, following compression, flows to the preheater. After receiving heat and increasing in temperature, the air passes through the GT to produce electrical power. Then, air is input into the combustion chamber for combustion, while biomass fuel is conveyed to the gasifier, and the gasifier products enter the combustor. After the chemical process occurrs in the chamber, high-temperature combustion products are exhausted at state 8. These combustion products first enter the air preheater to provide energy for preheating and then flow to the HRSG of the Rankine cycle. Finally, after heat transfer and energy reduction, the exhaust gases leave the overall system. The downstream cycle includes a steam Rankine cycle. Its working fluid, by receiving heat from the combustion products, turns into steam and flows to the turbine. Some of the steam flows to the OFWH after being bled from the turbine. The remaining steam expands at low pressure in the turbine and produces electricity. Water cools the fluid exiting the Rankine cycle condenser. The cooling water, by passing towards the absorption refrigeration cycle generator, loses its heat to the cycle working fluid and then returns to the condenser. After completing the cooling process, the Rankine cycle fluid passes through a heat exchanger to receive energy before entering the OFWH. Heat supply in this heat exchanger is provided via Therminol VP-1 fluid, and this fluid’s required energy is supplied via solar thermal energy. Finally, the output streams from the steam turbine and the heat exchanger are combined in the OFWH and stream 14 exits. Chilling is also provided via the single-effect absorption refrigeration system using a lithium bromide–water pair, and, as mentioned above, the heat provided via the cooling water exiting the steam Rankine cycle condenser is utilized in the ARS generator.
The system proposed is simulated, and the effects of such parameters as compression ratio, pressure of bleed steam from the turbine, and gas turbine inlet temperature are investigated on the output power, efficiencies, refrigeration capacity, and carbon dioxide EI.
3. Methodology
3.1. System Modelling
3.1.1. Gasification Process Modelling
For gasification, all reactions are assumed to reach the chemical equilibrium condition, and the pyrolysis products are taken to reach chemical equilibrium before leaving the gasifier. The general reaction is as follows [6]:
where represents the biomass fuel, and w denotes the quantity of moisture in the biomass fuel (on a molar basis). The moisture per kilomole of biomass fuel is expressed as follows:
where denotes the biomass fuel molecular weight, and MC is the mass of moisture available [26].
The number of moles of the products of the reaction, n1 to n6 and n, can be obtained with a molar balance for the elements and considering chemical equilibrium and energy balance equations. The reactions that are carried out through the gasification process include the following water–gas shift and methane generation reactions [27,28]:
For these equations, the constant values for chemical equilibrium are stated as follows [29]:
where Pref denotes the standard atmospheric pressure, and is the pressure of the gasification process. The equilibrium constants K1 and K2 can be expressed using Gibbs energy changes as follows [30]:
Assuming that the gasifier is adiabatic, the first law of thermodynamics for gasification can be represented at the specified temperature as follows:
3.1.2. Combustion Chamber Modelling
Presuming that complete combustion occurs for the syngas in reaction with air, the relevant chemical reaction is as follows [31]:
where n′ indicates the amount of air entering the combustion chamber (CC), and n7 to n9 are the kilomoles of exhaust gases. Assuming that the combustion chamber is adiabatic, its energy balance can be expressed as follows:
3.1.3. Solar System Modelling
The heat absorption rate for the solar system proposed in the current research, which is of the type of parabolic collector, can be expressed as follows [32]:
Part of the heat absorbed by the solar collectors is wasted, and the rest is transferred to the thermal fluid that is considered in this research, Therminol VP-1. The useful heat transfer to the thermal fluid can be determined as follows [32]:
Here, is the efficiency of the solar collectors, which can be calculated using the following equation [30,33]:
where the parameters , respectively, represent the cosine effect efficiency, shading and blocking efficiency, interception efficiency, atmospheric attenuation efficiency, and reflectivity of the heliostats [30,33].
3.2. Thermodynamic Modelling of the Proposed System
So as to balance the energy rates for the cogeneration system components, energy rate balances are applied. Also, the mass or molar flow rates of various flows of working fluids are determined using the continuity law. For an open system undertaking a steady process, the governing equations considering mass and energy read as the following:
Here, index i denotes inputs, and index e denotes exits of the control volumes, while and denote, respectively, the heat transfer rate and the power generated or consumed within the CV.
Exergy rate balances are employed to evaluate the inefficiencies of each cogeneration system component. The exergy rate balance can be written for a CV operating at steady-state conditions as follows:
Here, the term represents the exergy transfer rate associated with heat, and is the heat transfer temperature, while is the internal irreversibility rate of the process and is always a positive quantity. The total exergy flow rate, , comprises thermomechanical and chemical exergy flow rates:
The thermomechanical exergy flow rate can be written as follows:
where the quantities and denote specific enthalpy and specific entropy at the restricted dead state of the working fluid.
The chemical exergy flow rate can be written as follows:
where denotes molar fraction of component i in the mixture.
For the components of the considered system, rate balances for mass, energy, and exergy are presented in Table 2, along with other relevant relations.
Table 2.
Mass, energy, and exergy rate balances for the components of the cogeneration system considered.
3.3. General Performance
Efficiencies of energy and exergy for the electricity generation system and the entire cogeneration system can be written as follows [30]:
Table 3 depicts the parameters used as inputs in this study for modelling.
Table 3.
Assumed input parameter values for simulating and analyzing the considered system [17].
3.4. Two-Objective Optimization
A two-objective optimization is performed to determine the best solution for the cogeneration system and to determine its optimal design parameters. The optimization algorithm is a genetic algorithm based on natural biological evolution. For this purpose, a random set of individuals is initially selected to form the initial population. The selection of individuals within each population is based on their level of compliance with the objective functions [34]. Entities exhibiting high malleability are selected for reproduction to generate the next generation. Crossover and mutation operators affect, notably, multi-objective optimization. The crossover operator has a key role in solution convergence to the optimum value. The multi-objective optimization flowchart for the genetic algorithm is illustrated in Figure 2. In this research, the “Gamultiobj” function and genetic algorithm are employed to determine the PARETO frontier via MATLAB software (version 2018). Table 4 presents the tuning parameters utilized in the optimization. Also, decision variables’ lower and upper bounds are given in Table 5 for the present optimization. Carbon dioxide EI and exergy efficiency are chosen as the criteria for optimization.
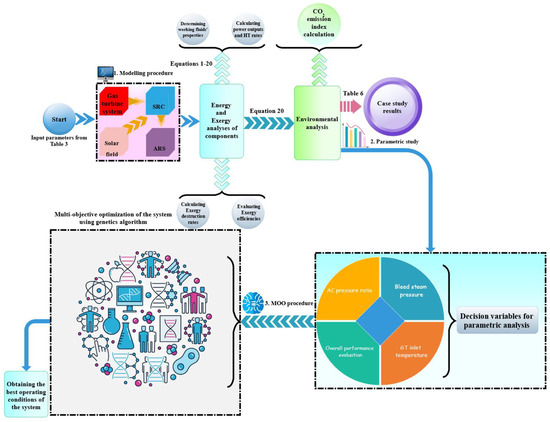
Figure 2.
Schematic of two-objective optimization using genetic algorithm.
Table 4.
Tuning variables utilized in the optimization [34].
Table 5.
Bounds for decision variables in the optimization.
In a genetic algorithm generation system, crossover and mutation operators are physically translated as follows:
- Crossover Operator: This operator involves combining genetic information from two parent individuals to create one or more offspring individuals. It is typically implemented by selecting a crossover point in the parent chromosomes and exchanging genetic material beyond that point. This process mimics the biological process of genetic recombination;
- Mutation Operator: This operator introduces random changes in the genetic material of an individual. It is implemented by randomly altering specific genes or chromosomes within an individual’s genome. This introduces diversity into the population and helps explore new regions of the solution space.
Both crossover and mutation operators play crucial roles in the exploration and exploitation phases of a genetic algorithm, enabling the generation of new individuals with potentially improved fitness compared to their parents.
4. Results and Discussion
4.1. Validation
To ensure proper modelling of the cogeneration system for the initial data provided in Table 3, a validation was performed with results contrasted with those of reference [17]. Table 6 presents important key parameters of the cogeneration system and contrasts them with results from reference [17]. The results from modelling the power production system using biomass and solar energy are seen to agree well, suggesting the simulation presented in this research is reliable.
Table 6.
Important thermodynamic parameters of the proposed system using solar energy and biomass and comparison with independent results of reference [17].
4.2. Case Study
A flowchart is shown in Figure 3 for modelling the cogeneration system for input parameter values given in Table 3.
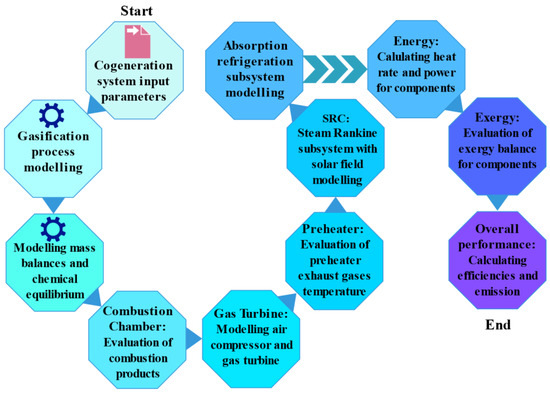
Figure 3.
Flowchart for cogeneration system thermodynamic modelling.
According to the input parameters and the modelling flowchart, as well as the equations in Table 2, the cogeneration system modelling was assessed using EES software. Results are listed in Table A1 at various states of the system, including flow rates of mass and exergy and working fluid thermodynamic characteristics.
In Table A2, values for system components under the stated operating conditions are given, including heat transfer rate, production or consumption of power, and destruction rate of exergy. It is observed that the combustor and gasifier exhibit the greatest system irreversibility rates, at about 2270 kW and 4630 kW, respectively.
In Figure 4, a Grossman diagram is presented for the cogeneration system, showing component exergy destruction and flow rates.
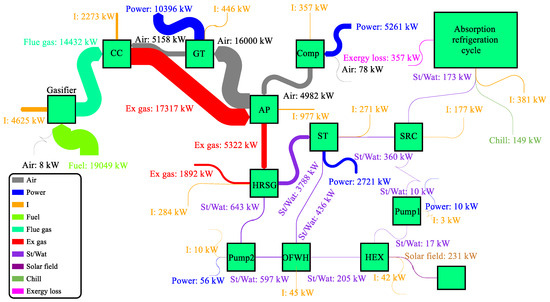
Figure 4.
Grossman diagram with exergy flow and exergy destruction rates for the cogeneration system components.
For the assumptions and thermodynamic modelling relations employed, the cogeneration system first and second law efficiencies are calculated as 63.1% and 38.8%, respectively. The carbon dioxide EI is 0.76 ton/MWh. Also, the respective energy and exergy efficiencies of the electricity generation system, including the gas turbine and steam turbine (Rankine cycle) subsystems, are determined to be 44.0% and 38.0%.
4.3. Effects of Influencing Parameters
The effects of gas turbine inlet temperature and bleed pressure from steam turbines, as well as the compression ratio, on the net exit power, first and second law efficiencies, refrigeration capacity, carbon dioxide EI, and solar share, are investigated.
4.3.1. Influence of Compression Ratio
Figure 5 demonstrates the influence of compression ratio on the net-produced power values for the steam and gas turbines and the overall system. It can be seen that the generated power with the gas turbine decreases as the compression ratio rises. As a consequence of the rise in pressure ratio, the power consumption of the air compressor increases and overcomes the gas turbine’s generated power, leading to a decline in the net-produced power of the gas turbine. Furthermore, the Rankine cycle’s output power is not impacted by the compression ratio. Thus, the total net power output decreases following an increase in compression ratio, similar to the trend for gas turbine net-produced power.
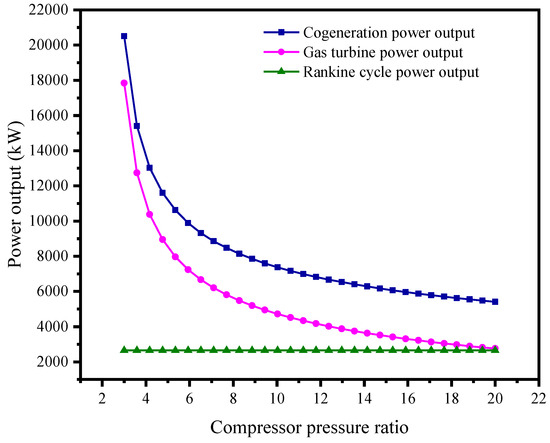
Figure 5.
Influence of compression ratio on the net-produced power of steam turbines, gas turbines, and cogeneration systems.
The effect of raising the compression ratio on the energy and exergy efficiencies of the cogeneration system and the upstream (power generation) cycle is shown in Figure 6. At a pressure ratio of 10, the power generation system’s energy and exergy efficiencies reach their maximum values. This factor trend is influenced by raising the pressure ratio from 3 to 10, during which the lowering of fuel consumption in the cycle overcomes the decrease in net-produced power of the system. Similarly, by raising the pressure ratio from 10 to 20, the rate of reduction in generated power increases, and as a consequence, the efficiency of the system decreases. The figure also shows that the total first law efficiency increases continuously as the pressure ratio increases, while the exergy efficiency also increases but with a gentle slope and then decreases.
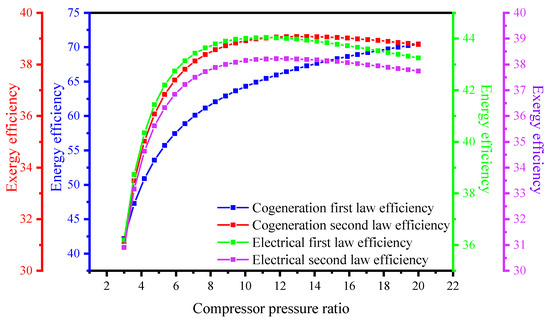
Figure 6.
Influence of pressure ratio on the energy and exergy efficiencies of power generation and cogeneration systems.
The variation of carbon dioxide emission for one unit of generated electrical energy is shown in Figure 7, as is the contribution of solar energy to biomass fuel energy to provide the required heat. As the compression ratio increases, it is seen that the carbon dioxide EI decreases due to the decline in the exhaust gas mass flow rate. In addition, the solar share in supplying the required heat for the cogeneration system climbs with increasing compression ratios. In order to compensate for the reduced heat received in the HRSG to produce steam, solar energy provides a greater share.
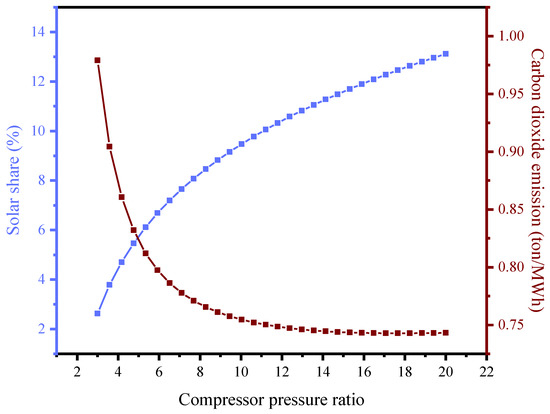
Figure 7.
Influence of compression ratio on the carbon dioxide EI and the contribution of solar energy to biomass fuel energy.
4.3.2. Influence of Bleed Steam Pressure of Turbine
The effects of the bleed steam pressure on refrigeration capacity and net electric power generated with the gas turbine and steam turbines are shown in Figure 8. The bleed steam pressure from the turbine is seen to relate directly to the net power produced and refrigeration capacity. This trend is caused by the rise in waste heat in the Rankine cycle, which is received as input energy by the refrigeration cycle’s generator. However, as Figure 9 indicates, the efficiencies decrease for the power generation and cogeneration systems because of the increase in fuel consumption.
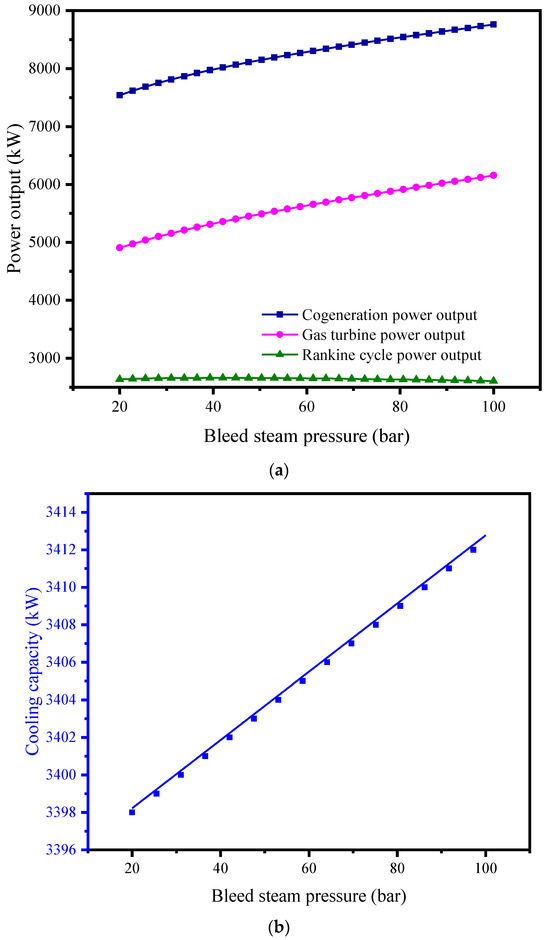
Figure 8.
(a) Influence of the bleed steam pressure from the turbine on power produced with the turbines and the net-generated power; (b) influence of the bleed steam pressure from the turbine on refrigeration capacity.
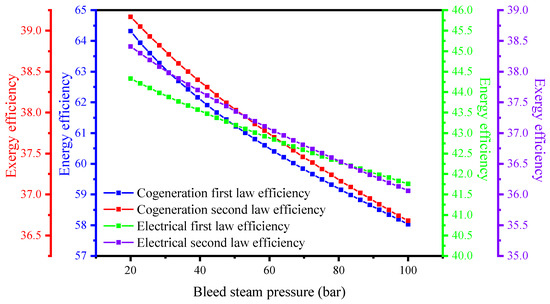
Figure 9.
Influence of the bleed steam pressure from turbines on the first and second law efficiencies of power generation and cogeneration systems.
The influence of changes in carbon dioxide emissions per unit produced electrical energy and the solar share with the steam turbine bleed pressure are presented in Figure 10. The carbon dioxide EI is observed to rise with steam turbine bleed pressure. As observed in this figure, the consumption of fuel and, consequently, the exhaust gases from the system also increase with the bleed pressure. Thus, the carbon dioxide flow rate increases. Furthermore, according to the figure, with the increase in bleed pressure, the share of solar energy trends downward, and the water heater again contributes more to the process of preheating the working fluid before it enters the steam generator. Hence, the solar energy share reduces. Further, a higher biomass fuel corresponds to a lower ratio of solar energy to biomass fuel energy.
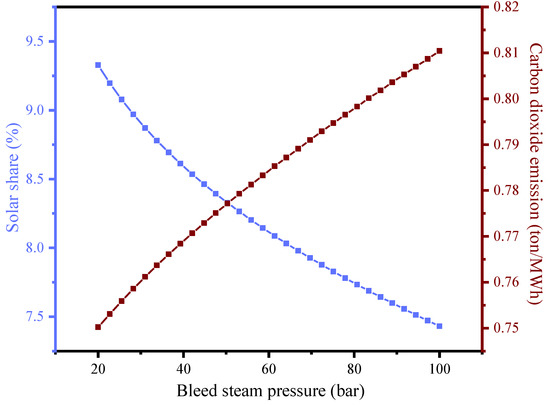
Figure 10.
Influence of bleed steam pressure from turbines on carbon dioxide EI and contribution of solar energy to biomass fuel energy.
4.3.3. Gas Turbine Inlet Temperature Impact
Figure 11 depicts the impacts of changes in steam turbine (Rankine cycle), gas turbine, and cogeneration system net output powers versus the temperature at the entry of the gas turbine. Higher values of gas turbine and overall net-produced electricity are achieved with a higher gas turbine entrance temperature, according to the equations in Table 2. Therefore, the cogeneration system first and second law efficiencies increase (see Figure 12).
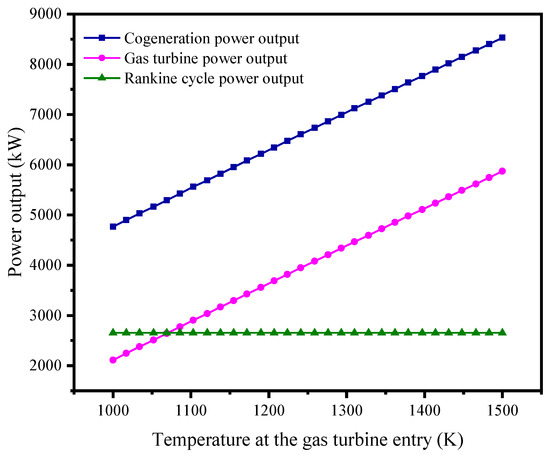
Figure 11.
Influence of temperature at the gas turbine inlet on steam turbines, gas turbines, and net power outputs.
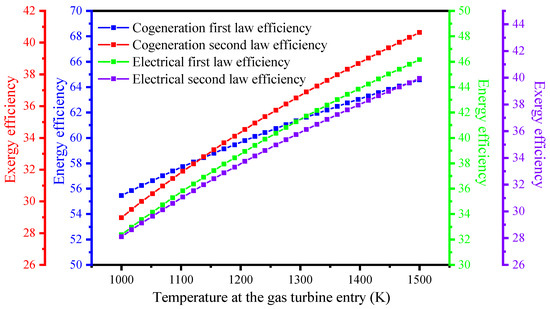
Figure 12.
Effects of temperature at the gas turbine inlet on the efficiencies of power generation and cogeneration systems.
Figure 13 presents changes in carbon dioxide EI and the solar share for variations in the inlet temperature of the gas turbine. As the temperature at the inlet of a gas turbine rises, the carbon dioxide emission (based on the generated electrical energy) is seen to decrease. This leads to a rise in the system’s net output power, which, according to Equation (20j), results in a reduction in carbon dioxide emissions. Also, according to Figure 13, the solar energy contribution to biomass fuel energy is reduced as the temperature at the entry of the gas turbine rises. The variation is justified by noting that as the temperature at the gas turbine entry increases, biomass fuel consumption increases. This corresponds to a lower share of solar energy, according to Equation (20k).
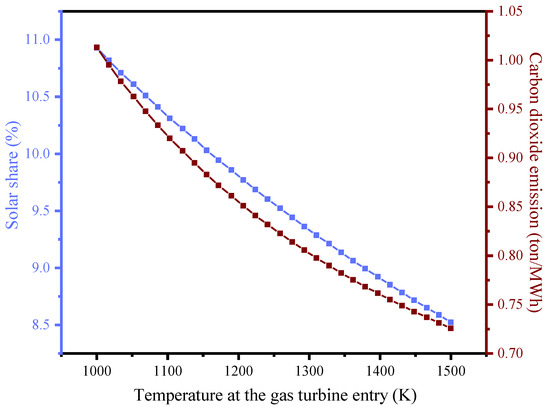
Figure 13.
Influence of temperature at the gas turbine inlet on the carbon dioxide EI and contribution of solar energy to biomass fuel energy.
4.4. Two-Objective Optimization
Based on the decision variables listed in Table 4 and Table 5, two objective functions, and tuning parameters employed in the genetic algorithm, the optimization was performed using EES software and MATLAB software. The resulting PARETO frontier is shown in Figure 14.
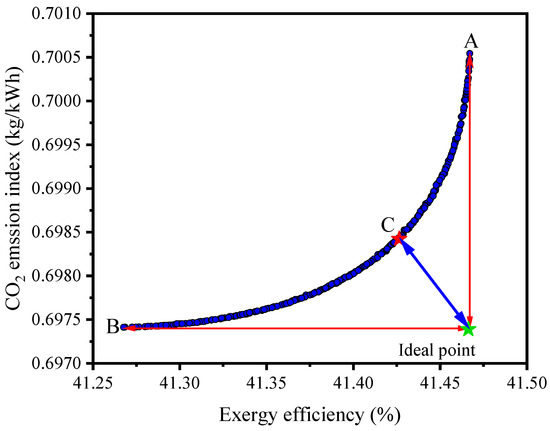
Figure 14.
PARETO frontier for double-criteria optimization for the overall system.
The highest cogeneration system second law efficiency is obtained at design point A (41.5%) from the PARETO frontier, with the highest carbon dioxide EI being 0.70 kg/kWh. In addition, the second law efficiency of the cogeneration system is minimized at a value of 41.3% at design point B, while the lowest carbon dioxide EI of 0.69 kg/kWh is acquired. So, the maximum exergy efficiency (ideal point) and minimum carbon dioxide EI are 41.47% and 0.6974 kg/kWh, respectively. Any PARETO frontier point in Figure 14 can be chosen as the optimal, but the best solution of the MOO is often the nearest value to the ideal point in the frontier, which is depicted as point C in the figure. The values for the best minimum carbon dioxide EI and maximum exergy efficiency for the cogeneration system are 0.69 kg/kWh and 41.4%, respectively.
Scatter distribution plots for decision variables using lower and upper bounds described in Table 5 are presented in Figure 15a–c. According to these figures, the acceptable operating range for the compression pressure ratio as the decision variable in the multi-objective optimization procedure is from 14 to 20, and the best values for the bleed steam pressure and GT inlet temperature in which the system has optimal operation are calculated as about 20 bar and 1500 K, respectively.
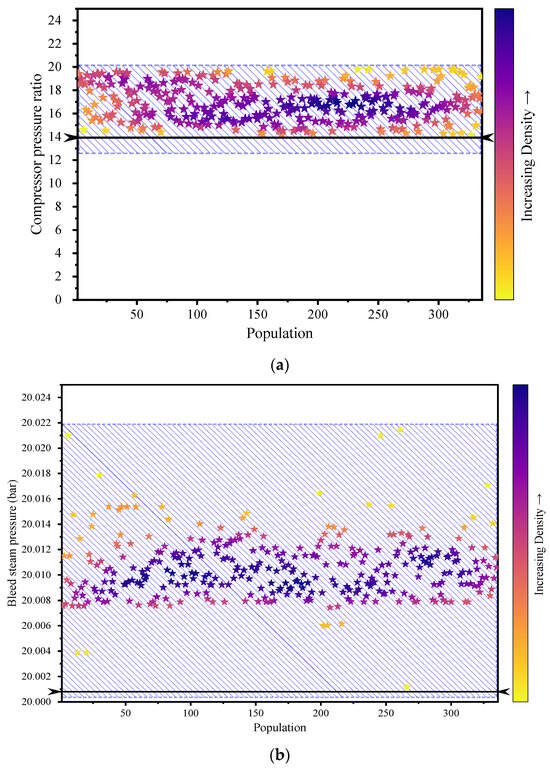
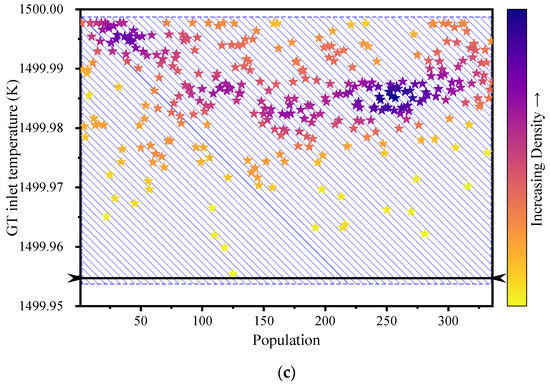
Figure 15.
(a) Scattered distribution chart for the air compression ratio; (b) scattered distribution chart for the bleed steam pressure; and (c) scattered distribution chart for GT inlet temperature.
5. Conclusions
Based on biomass and solar energy, a novel combined cogeneration system was assessed using the first and second laws of thermodynamics. Also, a double-criteria optimization was accomplished to find the best system operational conditions. The primary findings from the parametric study and optimization and the resulting conclusions are as follows:
- At lower compression ratio values, higher values of net-produced power are achieved for the proposed cogeneration system;
- An optimized value is achieved for the compression ratio with which the power generation system efficiencies are maximized;
- Raising the compression ratio reduces the carbon dioxide emission per unit of electrical energy generated;
- As the steam bleed pressure for the steam turbine is increased, the system efficiencies are reduced despite the increase in net-generated power;
- A higher steam turbine bleed pressure corresponds to a higher refrigeration capacity as well as a higher amount of carbon dioxide emission per unit of electrical energy generated;
- Better system performance is linked with a higher temperature at the gas turbine entry, since a rise in this parameter enhances the efficiencies of the power generation and cogeneration systems, system net output power, gas turbine generated power, and cooling capacity. Raising the temperature at the gas turbine inlet also reduces the carbon dioxide EI;
- A reduction of 1% of the gas turbine compression ratio can be compensated by an increase of 9.3% of the solar share in the steam Rankine cycle;
- The best operating conditions for the cogeneration system are shown via two-objective optimization to lead to a maximum second law efficiency of 41.4% and a minimum carbon dioxide EI of 0.69 kg/kWh.
Finally, combined power and chill cogeneration systems based on solar and biomass energies—composed of a gas turbine system, a Rankine cycle, and an absorption refrigeration cycle—have several challenges, limitations, and merits:
Challenges:
- Integration Complexity: integrating multiple energy conversion cycles and technologies can be complex, requiring careful design and coordination to ensure optimal performance and efficiency;
- System Sizing and Optimization: determining the appropriate size and capacity of each component in the system can be challenging, considering the variable nature of solar and biomass energy sources;
- Operational Flexibility: balancing the power and cooling demands while considering the intermittent nature of solar energy and varying biomass availability can be a challenge.
Limitations:
- Space and Infrastructure Requirements: these systems may require significant space for installation, including solar collectors, biomass storage facilities, and additional equipment for the absorption refrigeration cycle;
- Cost: the initial capital cost of implementing such complex systems can be high, which may limit their widespread adoption.
Merits:
- Energy Efficiency: cogeneration systems can achieve higher overall energy efficiency by utilizing waste heat from the gas turbine system for the Rankine cycle and absorption refrigeration cycle;
- Renewable Energy Integration: the use of solar and biomass energies promotes the utilization of renewable resources, reducing reliance on fossil fuels and minimizing the environmental impact;
- Energy Independence: combined power and chill cogeneration systems based on solar and biomass energies offer the potential for increased energy independence by utilizing locally available renewable resources.
Overall, while combined power and chill cogeneration systems based on solar and biomass energies have challenges and limitations, their merits include improved energy efficiency, renewable energy integration, and the potential for energy independence.
Author Contributions
Conceptualization, M.S.; Methodology, A.J., S.G. and M.S.; Software, A.J., S.G. and M.S.; Validation, A.J., S.G. and M.S.; Formal analysis, A.J.; Investigation, A.J.; Resources, S.G.; Writing—original draft, A.J. and S.G.; Writing—review & editing, S.G., S.M.S.M., M.A.R. and M.S.; Supervision, S.M.S.M. and M.A.R.; Project administration, S.M.S.M., M.A.R. and M.S.; Funding acquisition, M.A.R. All authors have read and agreed to the published version of the manuscript.
Funding
This research received no external funding.
Institutional Review Board Statement
Not applicable.
Informed Consent Statement
Not applicable.
Data Availability Statement
The data presented in this study are available on request from the corresponding author.
Conflicts of Interest
The authors declare no conflict of interest.
Nomenclature
| ARS | Absorption refrigeration system |
| CC | Combustion chamber |
| CSP | Concentrated solar power |
| COP | Coefficient of performance |
| DNI | Direct normal irradiation |
| EI | Emission index |
| Standard chemical exergy | |
| Exergy flow rate | |
| FEL | Following electric load |
| G | Gibbs function |
| h | Specific enthalpy |
| Specific molar enthalpy | |
| HP | Heat pump |
| HRSG | Heat recovery steam generator |
| Exergy destruction rate | |
| Equilibrium constant | |
| Molar mass | |
| Moisture content | |
| MGT | Micro gas turbine |
| Multi-objective optimization | |
| Mass flow rate | |
| Molar air/fuel ratio (kilomoles of air per kilomole of fuel) | |
| Molar flow rate | |
| Open feed water heater | |
| Organic Rankine cycle | |
| Pressure | |
| Heat transfer rate | |
| Specific entropy | |
| Temperature | |
| Produced/consumed power | |
| Moisture in biomass fuel | |
| Mole fraction | |
| Weight fraction | |
| Subscripts | |
| ch | Chemical |
| coll | Collector |
| cv | Control volume |
| e | Exit |
| g | Gasifier |
| f | Formation |
| i | Inlet |
| ref | Refrigeration |
| th | Thermo-mechanical |
| tot | Total |
| 0 | Restricted dead state |
| Greek letters | |
| Efficiency | |
| Emission index for carbon dioxide | |
| β | Chemical exergy coefficient |
Appendix A
Table A1.
Thermodynamic properties and quantities for cogeneration system working fluids.
Table A1.
Thermodynamic properties and quantities for cogeneration system working fluids.
| State No. | Working Fluid | P (bar) | T (K) | h (kJ/kg) | s (kJ/kg K) | (kg/s) | (kW) |
|---|---|---|---|---|---|---|---|
| Gas turbine subsystem | |||||||
| 1 | Air | 1.013 | 298.2 | 0 | 6.884 | 17.48 | 77.87 |
| 2 | Air | 9.117 | 590.2 | 300.9 | 6.953 | 17.48 | 4982 |
| 3 | Air | 8.843 | 1400 | 1225 | 7.937 | 17.48 | 16,000 |
| 4 | Air | 1.059 | 891.6 | 630 | 8.023 | 17.48 | 5158 |
| 5 | Biomass | 1.013 | 298.2 | −7069 | N/A | 1.122 | 19,049 |
| 6 | Air | 1.013 | 298.2 | 0 | 6.884 | 1.782 | 7.939 |
| 7 | Flue gas | 1.013 | 1073 | −2731 | 10.09 | 2.905 | 14,432 |
| 8 | Exhaust gas | 1.028 | 1525 | 151.1 | 8.227 | 20.39 | 17,317 |
| 9 | Exhaust gas | 1.013 | 835.2 | −641 | 7.543 | 20.39 | 5322 |
| 10 | Exhaust gas | 1.013 | 551.2 | −939 | 7.108 | 20.39 | 1892 |
| Rankine cycle | |||||||
| 11 | Water/steam | 0.13 | 324.2 | 213.7 | 0.7172 | 2.235 | 9.839 |
| 12 | Water/steam | 30 | 324.6 | 218 | 0.7212 | 2.235 | 16.83 |
| 13 | Water/steam | 30 | 424.6 | 640 | 1.854 | 2.235 | 205.3 |
| 14 | Water/steam | 30 | 507 | 1008 | 2.645 | 2.663 | 596.8 |
| 15 | Water/steam | 150 | 511 | 1029 | 2.658 | 2.663 | 642.5 |
| 16 | Water/steam | 150 | 615.3 | 2611 | 5.311 | 2.663 | 2748 |
| 17 | Water/steam | 150 | 773.2 | 3311 | 6.348 | 2.663 | 3788 |
| 18 | Water/steam | 0.13 | 324.2 | 2166 | 6.74 | 2.235 | 360.2 |
| 19 | Water/steam | 30 | 548.6 | 2930 | 6.426 | 0.4283 | 436.2 |
| 20 | Therminol VP-1 | 65 | 454.6 | 305.9 | 0.814 | 4.272 | 271.3 |
| 21 | Therminol VP-1 | 65 | 334.6 | 85.15 | 0.2546 | 4.272 | 40.78 |
| 22 | Water | 1.013 | 298.2 | 104.9 | 0.3672 | 41.75 | 0 |
| 23 | Water | 1.013 | 323.2 | 209.4 | 0.7038 | 41.75 | 173.3 |
| Absorption refrigeration cycle | |||||||
| 24 | LiBr–Water | 0.0317 | 323.2 | 2594 | 8.709 | 1.414 | 2.507 |
| 25 | LiBr–Water | 0.0317 | 298.2 | 104.8 | 0.3672 | 1.414 | −0.1391 |
| 26 | LiBr–Water | 0.008725 | 278.1 | 104.8 | 0.3776 | 1.414 | −4.497 |
| 27 | LiBr–Water | 0.008725 | 278.2 | 2510 | 9.025 | 1.414 | −249 |
| 28 | LiBr–Water | 0.008725 | 298.2 | 50.12 | 0.1808 | 46.97 | 0 |
| 29 | LiBr–Water | 0.0317 | 298.2 | 50.13 | 0.1808 | 46.97 | 0.1011 |
| 30 | LiBr–Water | 0.0317 | 315.7 | 88.11 | 0.3047 | 46.97 | 49.47 |
| 31 | LiBr–Water | 0.0317 | 323.2 | 106.1 | 0.3419 | 45.56 | 94.67 |
| 32 | LiBr–Water | 0.0317 | 305.1 | 67.44 | 0.2186 | 45.56 | 6.615 |
| 33 | LiBr–Water | 0.008725 | 305.1 | 67.44 | 0.2186 | 45.56 | 6.615 |
| 34 | Water | 0.01706 | 288.2 | 62.98 | 0.2245 | 162.2 | 100.3 |
| 35 | Water | 0.01706 | 283.2 | 42.02 | 0.1511 | 162.2 | 249.1 |
Table A2.
Values of heat transfer rate, production or consumption of power, and exergy destruction rate of system components.
Table A2.
Values of heat transfer rate, production or consumption of power, and exergy destruction rate of system components.
| Component | Power/Heat Transfer Rate (kW) | Exergy Destruction Rate (kW) |
|---|---|---|
| Gas turbine subsystem | ||
| Air compressor | 5261 | 357 |
| Air preheater | 16,150 | 977 |
| Gas turbine | 10,396 | 446 |
| Gasifier | - | 4625 |
| Combustion chamber | - | 2273 |
| HRSG | 6076 | 284 |
| Rankine cycle subsystem | ||
| Steam turbine | 2721 | 271 |
| OFWH | - | 44.7 |
| Pump 1 | 9.7 | 2.7 |
| Heat exchanger | 943 | 42.1 |
| Pump 2 | 55.6 | 9.8 |
| Steam condenser | 4363 | 177 |
| Absorption refrigeration subsystem | ||
| Generator | 4363 | 126 |
| Condenser | 3519 | 2.7 |
| SHE | 822 | 38.7 |
| Pump 3 | 0.1 | ~0 |
| Absorber | 4266 | 114 |
| Evaporator | 3400 | 95.7 |
| Valve 1 | - | 4.4 |
| Valve 2 | - | ~0 |
References
- Adefarati, T.; Bansal, R.C. Economic and Environmental Analysis of a Co-Generation Power System with the Incorporation of Renewable Energy Resources. Energy Procedia 2019, 158, 803–808. [Google Scholar] [CrossRef]
- Milcarek, R.J.; DeBiase, V.P.; Ahn, J. Investigation of Startup, Performance and Cycling of a Residential Furnace Integrated with Micro-Tubular Flame-Assisted Fuel Cells for Micro-Combined Heat and Power. Energy 2020, 196, 117148. [Google Scholar] [CrossRef]
- Murdock, H.E.; Gibb, D.; André, T.; Sawin, J.L.; Brown, A.; Ranalder, L. Renewables 2021-Global Status Report. Available online: https://www.academia.edu/50656883/Renewables_2021_Global_Status_Report (accessed on 27 March 2023).
- Darvell, L.I.; Jones, J.M.; Gudka, B.; Baxter, X.C.; Saddawi, A.; Williams, A.; Malmgren, A. Combustion Properties of Some Power Station Biomass Fuels. Fuel 2010, 89, 2881–2890. [Google Scholar] [CrossRef]
- Behzadi, A.; Arabkoohsar, A.; Gholamian, E. Multi-criteria optimization of a biomass-fired proton exchange membrane fuel cell integrated with organic rankine cycle/thermoelectric generator using different gasification agents. Energy 2020, 201, 117640. [Google Scholar] [CrossRef]
- Datta, A.; Ganguly, R.; Sarkar, L. Energy and Exergy Analyses of an Externally Fired Gas Turbine (EFGT) Cycle Integrated with Biomass Gasifier for Distributed Power Generation. Energy 2010, 35, 341–350. [Google Scholar] [CrossRef]
- Huber, G.W.; Iborra, S.; Corma, A. Synthesis of Transportation Fuels from Biomass: Chemistry, Catalysts, and Engineering. Chem. Rev. 2006, 106, 4044–4098. [Google Scholar] [CrossRef]
- Bridgwater, A.V. Renewable Fuels and Chemicals by Thermal Processing of Biomass. Chem. Eng. J. 2003, 91, 87–102. [Google Scholar] [CrossRef]
- Demirbas, A. Combustion Characteristics of Different Biomass Fuels. Prog. Energy Combust. Sci. 2004, 30, 219–230. [Google Scholar] [CrossRef]
- Ahmadi, P.; Dincer, I.; Rosen, M.A. Thermoeconomic Multi-Objective Optimization of a Novel Biomass-Based Integrated Energy System. Energy 2014, 68, 958–970. [Google Scholar] [CrossRef]
- Khanmohammadi, S.; Atashkari, K.; Kouhikamali, R. Exergoeconomic Multi-Objective Optimization of an Externally Fired Gas Turbine Integrated with a Biomass Gasifier. Appl. Therm. Eng. 2015, 91, 848–859. [Google Scholar] [CrossRef]
- Liu, Q.; Bai, Z.; Wang, X.; Lei, J.; Jin, H. Investigation of Thermodynamic Performances for Two Solar-Biomass Hybrid Combined Cycle Power Generation Systems. Energy Convers. Manag. 2016, 122, 252–262. [Google Scholar] [CrossRef]
- Bai, Z.; Liu, Q.; Lei, J.; Hong, H.; Jin, H. New Solar-Biomass Power Generation System Integrated a Two-Stage Gasifier. Appl. Energy 2017, 194, 310–319. [Google Scholar] [CrossRef]
- Oyekale, J.; Heberle, F.; Petrollese, M.; Brüggemann, D.; Cau, G. Biomass Retrofit for Existing Solar Organic Rankine Cycle Power Plants: Conceptual Hybridization Strategy and Techno-Economic Assessment. Energy Convers. Manag. 2019, 196, 831–845. [Google Scholar] [CrossRef]
- Arnaoutakis, G.E.; Katsaprakakis, D.A.; Christakis, D.G. Dynamic Modeling of Combined Concentrating Solar Tower and Parabolic Trough for Increased Day-to-Day Performance. Appl. Energy 2022, 323, 119450. [Google Scholar] [CrossRef]
- Khalid, F.; Dincer, I.; Rosen, M.A. Thermoeconomic Analysis of a Solar-Biomass Integrated Multigeneration System for a Community. Appl. Therm. Eng. 2017, 120, 645–653. [Google Scholar] [CrossRef]
- Bet Sarkis, R.; Zare, V. Proposal and Analysis of Two Novel Integrated Configurations for Hybrid Solar-Biomass Power Generation Systems: Thermodynamic and Economic Evaluation. Energy Convers. Manag. 2018, 160, 411–425. [Google Scholar] [CrossRef]
- Cao, Y.; Habibi, H.; Zoghi, M.; Raise, A. Waste Heat Recovery of a Combined Regenerative Gas Turbine—Recompression Supercritical CO2 Brayton Cycle Driven by a Hybrid Solar-Biomass Heat Source for Multi-Generation Purpose: 4E Analysis and Parametric Study. Energy 2021, 236, 121432. [Google Scholar] [CrossRef]
- Nazari, N.; Mousavi, S.; Mirjalili, S. Exergo-Economic Analysis and Multi-Objective Multi-Verse Optimization of a Solar/Biomass-Based Trigeneration System Using Externally-Fired Gas Turbine, Organic Rankine Cycle and Absorption Refrigeration Cycle. Appl. Therm. Eng. 2021, 191, 116889. [Google Scholar] [CrossRef]
- Diyoke, C.; Ngwaka, U.; Onah, T.O. Comparative Assessment of a Hybrid of Gas Turbine and Biomass Power System for Sustainable Multi-Generation in Nigeria. Sci. Afr. 2021, 13, e00899. [Google Scholar] [CrossRef]
- Chu, S.; Zhang, H.; Chen, H. Energy, Exergy, Energy-Saving, Economic and Environmental Analysis of a Micro-Gas Turbine-PV/T Combined Cooling, Heating and Power (CCHP) System under Different Operation Strategies: Transient Simulation. Energy Convers. Manag. 2023, 276, 116557. [Google Scholar] [CrossRef]
- Ren, J.; Qian, Z.; Fei, C.; Lu, D.; Zou, Y.; Xu, C.; Liu, L. Thermodynamic, Exergoeconomic, and Exergoenvironmental Analysis of a Combined Cooling and Power System for Natural Gas-Biomass Dual Fuel Gas Turbine Waste Heat Recovery. Energy 2023, 269, 126676. [Google Scholar] [CrossRef]
- Cameretti, M.C.; Cappiello, A.; De Robbio, R.; Tuccillo, R. Solar-Assisted Micro Gas Turbine with Humid Air or Steam-Injected Option. Energy 2023, 270, 126783. [Google Scholar] [CrossRef]
- Dabwan, Y.N.; Pei, G.; Hu, T.; Zhang, H.; Zhao, B. Development and Assessment of a Low-Emissions Gas Turbine System for Power Utilities Incorporating Intercooling and Solar Preheating. Appl. Therm. Eng. 2023, 218, 119335. [Google Scholar] [CrossRef]
- Hai, T.; Ma, X.; Singh Chauhan, B.; Mahmoud, S.; Al-Kouz, W.; Tong, J.; Salah, B. Techno-Economic Optimization of a New Waste-to-Energy Plant for Electricity, Cooling, and Desalinated Water Using Various Biomass for Emission Reduction. Chemosphere 2023, 338, 139398. [Google Scholar] [CrossRef] [PubMed]
- Zare, V. Performance improvement of biomass-fueled closed cycle gas turbine via compressor inlet cooling using absorption refrigeration; thermoeconomic analysis and multi-objective optimization. Energy Convers. Manag. 2020, 215, 112946. [Google Scholar] [CrossRef]
- Bhattacharya, A.; Manna, D.; Paul, B.; Datta, A. Biomass Integrated Gasification Combined Cycle Power Generation with Supplementary Biomass Firing: Energy and Exergy Based Performance Analysis. Energy 2011, 36, 2599–2610. [Google Scholar] [CrossRef]
- Basu, P. Biomass Gasification and Pyrolysis: Practical Design and Theory; Academic Press: Cambridge, MA, USA, 2010. [Google Scholar]
- Pramanik, S.; Ravikrishna, R.V. A Novel Syngas-Fired Hybrid Heating Source for Solar-Thermal Applications: Energy and Exergy Analysis. Appl. Therm. Eng. 2016, 109, 1011–1022. [Google Scholar] [CrossRef]
- Shayan, E.; Zare, V.; Mirzaee, I. On the use of different gasification agents in a biomass fueled SOFC by integrated gasifier: A comparative exergo-economic evaluation and optimization. Energy. 2019, 171, 1126–1138. [Google Scholar] [CrossRef]
- Soltani, S.; Mahmoudi, S.M.S.; Yari, M.; Rosen, M.A. Thermodynamic Analyses of an Externally Fired Gas Turbine Combined Cycle Integrated with a Biomass Gasification Plant. Energy Convers. Manag. 2013, 70, 107–115. [Google Scholar] [CrossRef]
- Bai, Z.; Liu, Q.; Lei, J.; Wang, X.; Sun, J.; Jin, H. Thermodynamic Evaluation of a Novel Solar-Biomass Hybrid Power Generation System. Energy Convers. Manag. 2017, 142, 296–306. [Google Scholar] [CrossRef]
- Anvari, S.; Khalilarya, S.; Zare, V. Exergoeconomic and Environmental Analysis of a Novel Configuration of Solar-Biomass Hybrid Power Generation System. Energy 2018, 165, 776–789. [Google Scholar] [CrossRef]
- Besarati, S.M.; Atashkari, K.; Jamali, A.; Hajiloo, A.; Narimanzadeh, N. Multi-objective thermodynamic optimization of combined Brayton and inverse Brayton cycles using genetic algorithms. Energy Convers. Manag. 2010, 51, 212–217. [Google Scholar] [CrossRef]
Disclaimer/Publisher’s Note: The statements, opinions and data contained in all publications are solely those of the individual author(s) and contributor(s) and not of MDPI and/or the editor(s). MDPI and/or the editor(s) disclaim responsibility for any injury to people or property resulting from any ideas, methods, instructions or products referred to in the content. |
© 2023 by the authors. Licensee MDPI, Basel, Switzerland. This article is an open access article distributed under the terms and conditions of the Creative Commons Attribution (CC BY) license (https://creativecommons.org/licenses/by/4.0/).