Article

Understanding the Visual Relationship between Function and Facade in Historic Buildings Using Deep Learning—A Case Study of the Chinese Eastern Railway

1
School of Architecture, Harbin Institute of Technology, Harbin 150006, China
2
Key Laboratory of Cold Region Urban and Rural Human Settlement Environment Science and Technology, Ministry of Industry and Information Technology, Harbin 150006, China
3
Key Laboratory of National Territory Spatial Planning and Ecological Restoration in Cold Regions, Ministry of Natural Resources, Harbin 150006, China
4
College of Design and Engineering, National University of Singapore, Singapore 117575, Singapore
5
School of Architecture and Urban Planning, Suzhou University of Science and Technology, Suzhou 215009, China
*
Authors to whom correspondence should be addressed.
Sustainability 2023, 15(22), 15857; https://doi.org/10.3390/su152215857
Submission received: 3 September 2023 / Revised: 30 October 2023 / Accepted: 8 November 2023 / Published: 11 November 2023
(This article belongs to the Special Issue Sustainable Conservation of Urban and Cultural Heritage)

Abstract

:
Although functional identifiability represents a key aspect for promoting visual connotation and sustainable usability in historic building groups, there is still no consensus on how to quantitatively describe its identification basis at a large scale. The recent emergence of the potentiality of deep learning and computer vision has provided an alternative to traditional empirical-based judgment, which is limited by its subjective bias and high traversal costs. To address these challenges, this study aims to build a workflow for a visual analysis of function and facade to extract the different contributions that facade elements provide to functional expression. The approach is demonstrated with an experiment on a section of the Chinese Eastern Railway (CER) where large-scale historical buildings images were categorized to identify functions using deep learning, together with activation and substance for visual calculations. First, the dataset aggregated with images of historic buildings along the CER was used to identify functional categories using SE-DenseNet merging channel attention. The results of the model visualized using t-SNE and Grad-CAM were then used to analyze the relationships of facade features across functional categories and differences in elemental feature representation across functional prototypes. The results show the following: (1) SE-Densenet can more efficiently identify building functions from the closely linked facade images of historic building groups, with the average accuracy reaching 85.84%. (2) Urban–rural differences exist not only in the count of spatial distributions among the CER’s historic building groups, but also in a significant visual divergence between functions related to urban life and those involved in the military, industry, and railways. (3) Windows and walls occupy areas with more characteristics, but their decorative elements have a higher intensity of features. The findings could enhance the objective understanding and deeper characteristics of the historical building group system, contributing to integrated conservation and characteristic sustainability.

1. Introduction

Railway architectural heritage, as an essential component of historic building groups, records the footprint of human development. The routes of historic buildings have systematic functional classifications, reflecting the historical communication and collaboration of the military, industry, religion, technology, and trade [1,2]. An understanding and the cognition of historic building groups are usually established by visual observation (such as through images, films, and visiting the complex) [3]. Due to historic building groups being designed to survive for a long time, the effective preservation of visually meaningful attributes is essential for sustainability and conservation, and these should not suffer damage or degradation [4,5]. However, the conservation of railway heritage has been challenged by rapid urbanization and abandonment, causing a deviation in the visual relationship between function and facade, leading to confusion in functional identification and disorder in collective memory. There is a growing imbalance in the historic functional structure and the deformation of the facade texture, damaging the traditional character and identifiability to varying degrees [6]. In addition, it is difficult to cover all aspects with the existing integral and classified conservation for scattered buildings along a railway, and the implementation process still requires precise direction for the interpretation of each building and its own facade elements [7,8]. In this case, the visual representation of historical functions reflected on facades is regarded as an essential impressionistic label, which is the starting point for establishing recognition and linking history [9]. Therefore, maximizing the perpetuation of the visual relationship between historical functions and facades among historic building groups has become a fundamental concern for researchers, managers, and engineers.
The visual relationship between the function and facade of historic buildings has been studied previously [10]. This relationship helps to understand historic buildings’ generation, usage, and reconstruction [11]. Early urban and architectural designers believed in the principle that form follows function [12], and this was also the concept implemented during the initial construction of railway buildings [13]. The functional description was characterized by visual features that convey an essential framework of cognition and perception [14]. Multiple functions were linked into a complex system of historic building groups and created abundant forms and values [15]. In addition, the facade, as one of the essential elements of the building form, contributes to the diversity of the built environment and thus becomes an element affecting sustainability [16]. The facade elements that convey values that positively impact the characteristics of historic building groups should be identified [17]. Due to the differences in styles, materials, colors, and elements among facades [18,19], the complex and numerous types of historic building facades are always fragmented or incomplete [20,21]. In this case, verifying the universal values by a manual traversal procedure is an intricate and difficult process, especially when the building’s facades are similar and only possess minor differences. In order to reduce the complexity and find distinguishable differences between functional categories [22], the selection of “prototypes” with universal value as typological representatives for interpretation has become the main research approach [23]. Although an exhaustive statistical investigation into each facade element can reveal considerable information, it also has disadvantages, such as potential subjective bias and limited sample size [24]. Therefore, the objective understanding and identification of historic building groups remain underexplored, and clarifying the visual mapping relationship between function and facade remains challenging.
With the rapid development of deep learning and computer vision, image classification techniques have shown great potential in the urban and architectural fields. Recent research has shown that building function can be predicted from the salience of architectural form and historical identifiable descriptions [14], mining facade characteristics [25], and rating places to mimic people’s perceptions [26]. Many studies use image recognition to study interiors [27], exteriors [28], roofs [29], footprints [30], facades [31], colors [32], and symbolic components [33]. These images are widely sourced from satellites [34], drones [35], street views [36], media websites [37], and open-source datasets [38]. In contrast to applications dedicated to extensive generalizations or accurate identification, at resent, more attention is being paid to the learning of non-linear relationships to mine the inherent characteristics of instances in the architectural heritage field [39]. Research on historical buildings using image classification focus on predicting architectural styles [19], religious symbols [40], tourist patterns [41], architectural masterpieces [9], Chinese cultural heritage [42], and stones [43]. Facing the nuances of individual buildings among historical building groups remains challenging, specifically identifying historical functions with similar styles, materials, colors, and components. We follow the trend of model refinement to classify the original functions among historical building groups along the railway, not only guaranteeing authenticity but also focusing on deep learning to discover qualitative patterns [44].
Considering the urgency of conservation, the meaning of the relationship between function and facade, and the advantages in computer vision, research that combines the three is needed and timely. In this study, we aim to build a workflow for the visual analysis of function and facade to extract the contributions that different facade elements provide to its functional expression. We believe that the model trained by deep learning that could be used as a “detector” replacing human eyes to more accurately identify functions from large-scale architectural images. The model also provides pixel-level areas that serve as the major determinants of functional judgment. The study applies deep learning techniques to establish a cognitive framework for historical building groups from visual characteristics, analyzes the inherent relationship between historical function and facades, and mines their expression characteristics and key contributing elements to regenerate historic buildings. First, the visual characteristic differences of functional categories were trained and evaluated using the improved SE-DenseNet model, which merges the channel attention mechanism and DenseNet to enhance the ability to focus on facade features. The model’s results were then visualized to analyze the characteristic relationships of visual identification among historical function categories, and the deep characteristic areas of the model were extracted from the selected prototypes to analyze the different expression of facade elements. We used the Chinese Eastern Railway (CER) historic building groups as the research object to explore the multidimensional vector characteristics of 16 functions of historic buildings and the visual mapping relationships between functions and facades. The results of this study provide an overall and subdivisional understanding of the characteristics along the CER to improve the historic building groups’ systemic perception and support their integral conservation, sustainable development, and regenerating criteria.

2. Materials and Methods

2.1. Study Area

This study used the historical building groups along the CER as the research object. The CER was an important transportation route built jointly by Russia and China in the late 19th and 20th centuries, and the areas where the stations were located became increasingly urbanized, which led to the rise and prosperity of many towns along the route. Figure 1 shows that these historic buildings are located in the Heilongjiang (HLJ) and Nei Mongol (NM) provinces, including the cities of Qiqihar, Daqing, Suihua, Harbin, Mudanjiang, Jixi, Suifenhe, Manchuria, Hailar, Yakeshi, and Zalantun. There are two reasons for choosing these historic buildings. On the one hand, the historical buildings along the CER were built in one specific era, characterized by a unified architectural style, various architectural functions, and connection among functions [45]. The functional identification of the historic building groups along the Heilongjiang section has become challenging by its large number and rich functions. On the other hand, the conservation of historical building groups along the railway is under more significant pressure from natural and constructive factors, such as erosion by wind and rain, frost boils, renewal and renovation, and the upgrading of the high-speed railway, leading to a certain deviation from the original relationship between function and facade. In addition, the historic buildings of the NM section along the CER route were also adopted to test our model’s generalizability and transferability. Compared to the HLJ line, although there are fewer historic buildings on the NM line, they were all constructed to serve one railroad during the same period, and the small gaps in the test sample could have a positive effect on the robustness of the model.

2.2. Data Sources

In this study, we organized several field surveys of historic buildings along the CER, including the collection of images, locations, and basic information. The field survey was conducted by four teams with two people each; half teams conducted surveys at the points of built-up stations, and the other teams conducted surveys in line with the wilderness along the CER. Despite the harsh field environment and even unpredictable dangers of this process, it is worth noting that the existing official documentation was updated by our field surveys, including the addition of new discoveries, corrections of existing information, and the removal of lack of information.

2.2.1. Building Function Data

The data used in the study were mainly the original functional categories of historic buildings along the CER. We collected data for 1366 historic buildings distributed along the CER, including 1208 buildings in HLJ and 158 in NM. The data originated from the Third National Cultural Relics Survey registered by the National Cultural Heritage Administration, successive lists of cultural heritage protection sites and historical buildings, conservation planning project reports, and the first-hand data verified by our survey along the CER [46]. Our fieldwork added 224 buildings to the original archive, even though they were not registered as protected buildings. Table 1 shows a sample of the building function data, including the building ID, official document number, original function, current function, and coordinates.

2.2.2. Building Facade Images

Facade image data were used to explore the functional identification and characteristic representation of facades. They were obtained from images obtained manually using handheld cameras, existing official documentation, and open-source websites. Although most of the images collected were manually aggregated, occlusions by cars, trees, wire poles, and tall buildings remained. We selected intact and available building facade images to ensure the complete expression of the facade elements. In line with the images and text documents investigated along the CER, Figure 2 shows our image database of historical buildings in the Heilongjiang section along the CER according to building ID. In order to enhance the efficiency of text–image linkage, the database consists of display front-end and management back-end, where the front-end performs a better human–computer interaction by the UI design, and the back-end uses tree-structured data to be used by WebGIS and API offline maps.

2.3. Research Methods

2.3.1. Dataset Building

The function of historic buildings was used as the classification task. Table 2 shows examples and the numbers of images for each architectural heritage category, combined with heritage history and survey results [47]. We categorized them into 16 historical function types, as follows: train station, train garage, water tower, assistant, work area, military camp, pillbox, police, leisure, office, school, religion, business, hospital, mansion, and residence. Due to the large variation in preserved historical buildings along the CER, we performed data enhancement on the dataset to reduce the model prediction bias caused by the imbalanced category sample size [48]. Data enhancement was achieved by horizontal flipping, rotation, grayscale conversion, and increasing luminance for the small sample size categories, while random selection was used for large sample size categories. Our dataset consisted of 1366 historic buildings with a total of 7070 images. The dataset of the HLJ section was divided into two parts, 80% for training and 20% for validation and evaluation. In addition, we used 623 images of 158 historic buildings in the NM section of the CER as a test set to test the generalizability and transferability of our model.

2.3.2. Image Classification with Deep Learning Techniques

The self-built dataset was fed to DenseNet as the backbone for deep learning. As an advanced deep learning network, DenseNet is good at identifying and classifying characteristics at different scales [49]. Due to DenseNet directly connecting all the network layers to ensure a maximum information flow, its dense connection enhances the propagation and recurrence of features across the network [50]. It retains the original information of feed features and gradients in the network as much as possible, alleviating the phenomenon of gradient disappearance, which can easily occur in deep networks. Thus, this network framework can extract more global and essential features and be trained more accurately and efficiently. The pre-trained weight was used to transfer learning to reduce false positives and improve the model’s accuracy [51,52]. In the classification scene for historical functions, some complex background disturbances and common information were distributed on the channels of the feature map, affecting the feature extraction and detection accuracy. In order to improve the model to focus on more valid features based on DenseNet’s feature extraction capability in the spatial domain, we added an attention mechanism to assign different weights to each channel of the feature map in two stages: “squeeze” and “excitation” [53]. Figure 3 shows the structure of our attention-infused SE-DenseNet network with the added squeeze-and-excitation module (SE-Module) on the original network.
In the squeeze stage, the input feature was compressed into one-dimensional values in the channel dimension by compressing the feature tensor [54]. The input feature U size was H × W × C, the spatial domain size was H × W, and the number of channels was C. The global average pooling was used to compress each spatial domain H × W into a single value, and the output was 1 × 1 × C. The calculation formula of output z c is as follows:
z c = F sq ( u c ) = 1 W × H i = 1 W j = 1 H u c ( i , j )
The excitation stage merges the information between different channels through two fully connected layers to learn the nonlinear relationship [50]. Firstly, W1 of the first fully connected layer is multiplied by the input value z . The value-merged channel information is made nonlinear through a ReLU function. Then, the result is multiplied with the W2 of the second fully connected layer, which is a step that uplifts the previously merged information. Finally, the s c value of each feature is output through Sigmoid function. The calculation formula of the output is as follows:
s c = F ex ( z , W ) = σ ( g ( z , W ) ) = σ ( W 2 δ ( W 1 z ) )
where σ is the Sigmoid function, δ is the ReLU function, and W1 and W2 are the parameters of the C layers. Then, each feature channel is assigned a corresponding weight.

2.3.3. Metrics for Model Evaluation

In order to evaluate the performance of the model, we used the accuracy, precision, recall, F1 score, and kappa as the performance metrics. The counts of true positives (TP), false positives (FP), true negatives (TN), and false negatives (FN) for the predicted results were determined using the type confidence. Accuracy indicates the percentage of the total samples that had correct prediction results. Precision indicates the proportion of all the samples predicted by the model that were correctly predicted. Recall indicates the proportion of all the true samples in the dataset that were correctly predicted. The F1-score is the harmonic mean of the precision and recall, which measures the performance of the model with the same weight for both. The value of kappa is calculated from the results of the confusion matrix for consistency testing and can also be used to measure the classification accuracy. The model evaluation formula is as follows:
Accuracy = TP + TN TP + TN + FP + FN
Precision = TP TP + FP
Recall = TP TP + FN
F 1 = 2   ×   Precision   ×   Recall Precision + Recall
Kappa = P o   -   P e 1   -   P e
where P0 represents the consistency of the prediction, P o = i = 1 C T i n ; Pe represents the accidental consistency, P e = i = 1 C a i b i n 2 ; n is the total number of samples; C is the total number of categories; Ti is the number of samples correctly classified in each category; ai is the number of true samples in each category; and bi is the number of samples predicted in each category.

2.3.4. Overall Feature and Prototype Extraction

Deep features in model prediction results are extracted and widely used to track the features of instances and scenes in images [55]. The overall features of the historical building groups were mapped into a 2D scatter plot using t-SNE feature vectors extracted from the images, which showed the deeper semantic features of the category in the penultimate layer in the network [56]. The scattered location distribution of the t-SNE reflected the cluster characteristics, and all the locations were regarded as network nodes in order to judge the category characteristics to track general trends and detect abnormal patterns [57,58]. The position of the feature vectors assigned by dimensionality reduction reflected the overall dispersion between categories, and close data points reflect similar features of the facade images. The t-SNE scatter analysis using our model mined the shared and individual features among the function categories without manual matching one by one, reducing the impact of subjective preferences and fuzzy generalizations. In order to describe the characteristic relationships of each category, the scatter distribution of the t-SNE was further described using each intra-cluster compactness (CP) and each inter-cluster separation (SP) [59,60]. CP shows the clusters’ average homogeneity, while SP shows the clusters’ separation from other clusters. A higher SP means more independent clusters, and a lower CP means generalized homogeneity [41]. The calculation formula is as follows:
CP = 1 | C k | x i C k x i - μ k
SP = 2 K ( K - 1 ) 1 p < k K μ k - μ p
where the Euclidean distance is used to calculate the CP and SP; μ k and μ p are the cluster centroids of C k and C p , respectively; and x i are all the data points within cluster C k .
Appropriate images were chosen to represent the typological paradigm of the historic groups, which is an essential carrier for cognition establishment and image dissemination [61]. Kernel density analysis is a method of mining the sample’s own characteristics to extract the core of each category [62]. In the t-SNE scatter plot, the location points closer to the cluster core reflect samples with general characteristics within the cluster, rather than their individuality. The calculation formula is as follows:
f ( s ) = i = 1 n 1 h 2 k ( s - s i h )
where f ( s ) is the kernel density estimate of scatter point s after t-SNE dimensionality reduction; h is the distance decay threshold; k is the weight function; and n is the number of scatter points whose distance from position s is less than or equal to h.

2.3.5. Facade Element Characteristic Areas

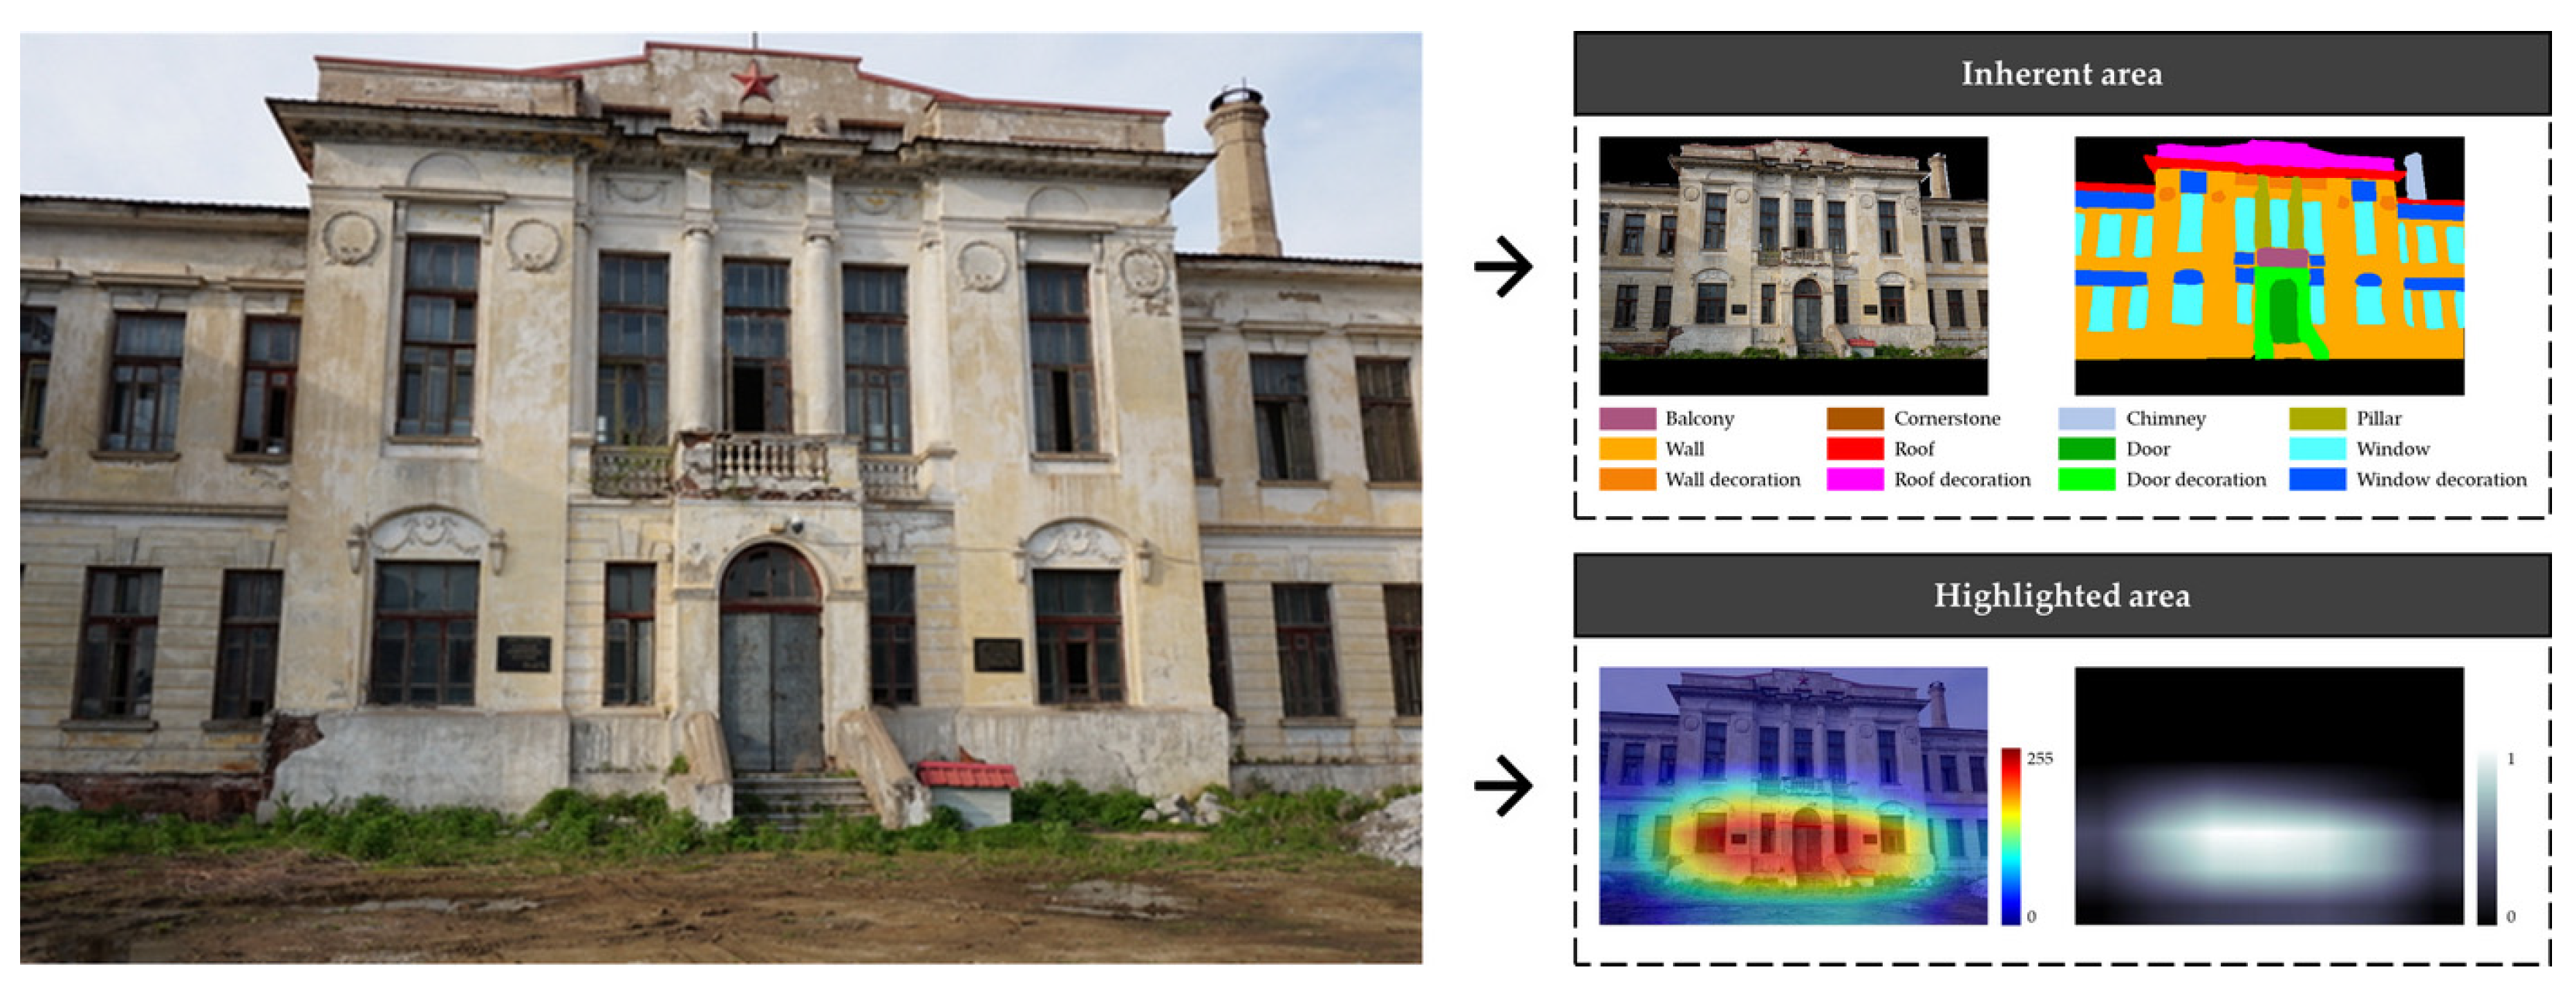
The areas of the facade elements in the image represent the semantic characteristics of the facade that are used to segment to reflect the characteristic details. Figure 4 shows our segmentation of the historic building facade into inherent areas and highlighted areas. Among them, the facade-fixed area was divided using EISeg, which is based on the semi-automatic interactive annotation tool developed by PaddlePaddle [63]. Combining the characteristics of historic building facades and the classification of existing facade datasets along the railway [64,65], we finally identified 12 categories to represent the inherent regional semantics of facade elements. The facade elements of each historic building were divided into wall, wall decoration, roof, roof decoration, door, door decoration, window, window decoration, cornerstone, balcony, chimney, and pillar. The highlighted facade areas were used to extract the characteristic areas predicted by the model through Grad-CAM, providing a visual interpretation for deep learning networks [66]. Grad-CAM uses network layers to generate a rough localization map to highlight areas with solid features in the process of historic building function identification and superimposes a gradient plot to distinguish the feature strength and location on the original image.

2.3.6. Metrics for Differential Expression

In order to clarify the differences among historical building functions in the expression of facade elements, we calculated the average weight (AW) and weighted area (WA) of each facade element expression based on the pixel distribution from the Grad-CAM visualization results. The pixel characteristic values of the facade elements were averaged by AE to identify the intensity of each element’s expression in the image. The WA was calculated based on the proportion of the weighted pixel area of each element in the highlighted area, helping with the further interpretation of the characterization of the highlighted area of Grad-CAM. The calculation formula is as follows:
AE = 1 n e i = 1 n e w ie
WA = i = 1 n e w ie e = 1 E i = 1 n e w ie
where w i is the pixel weight of the facade element e, n e is the number of pixels of element e, and E is the number of categories of the facade element.

2.4. Research Framework

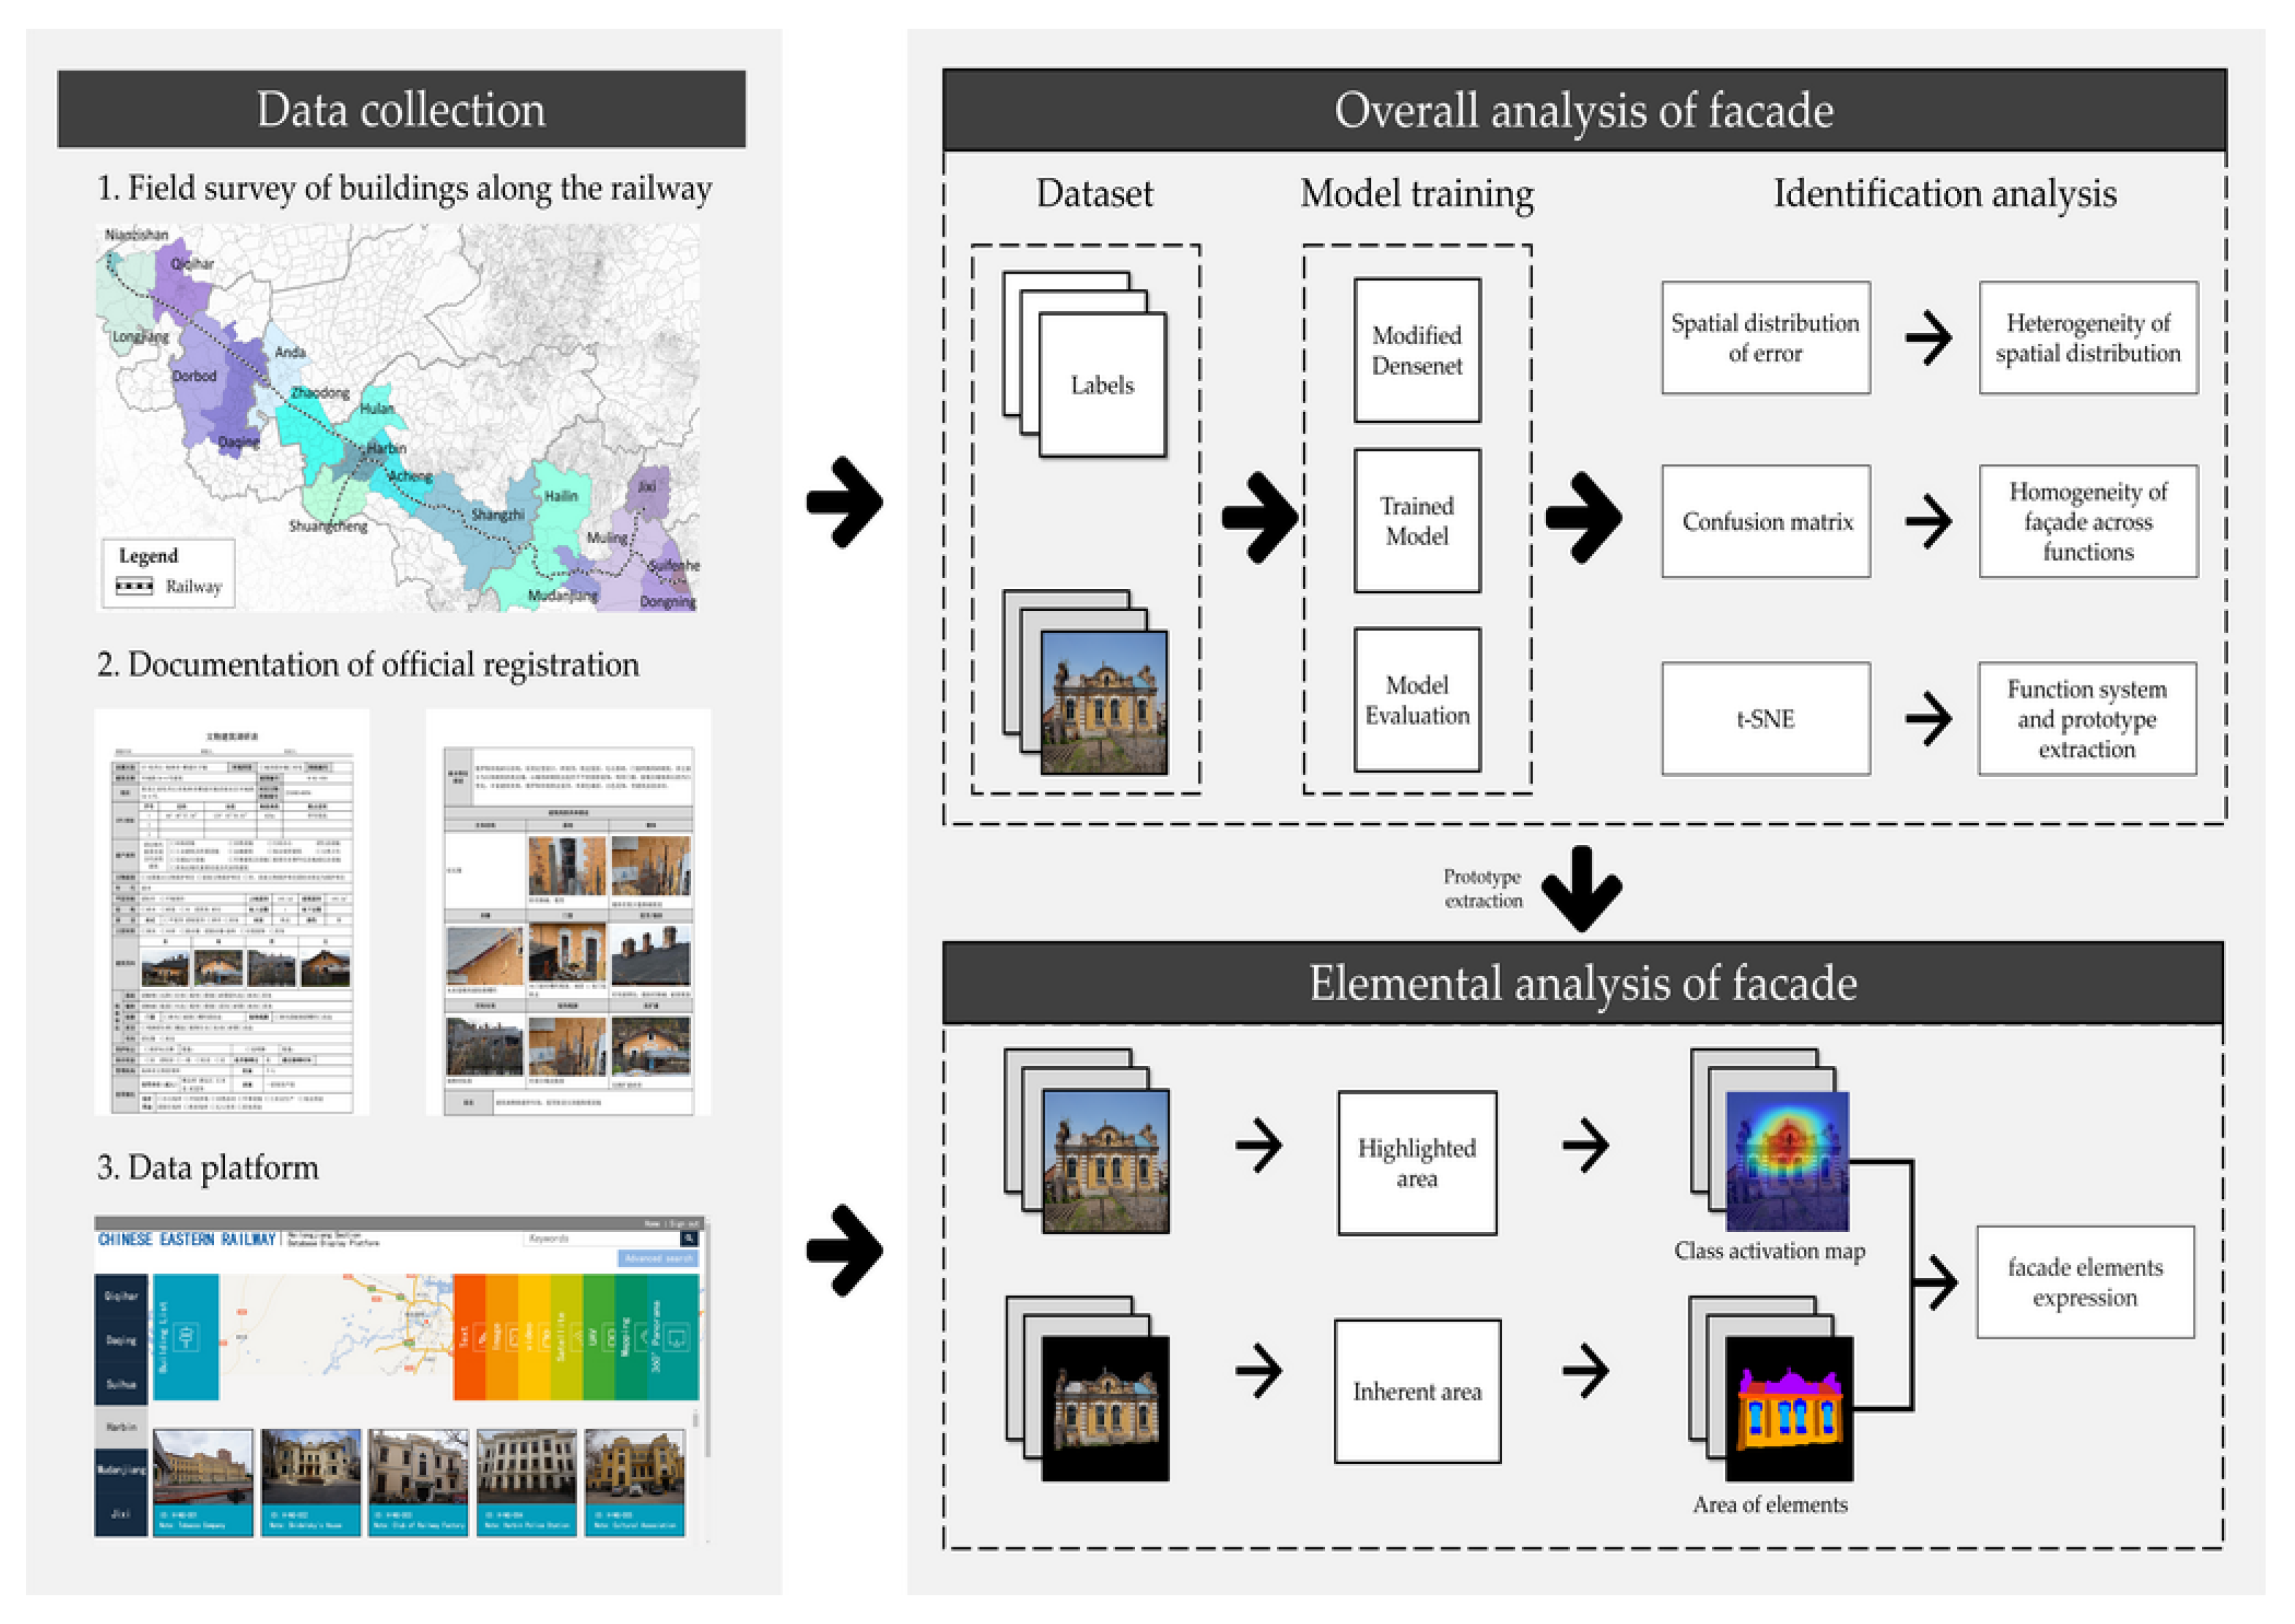
Figure 5 shows the technical framework of our research. First, we aggregated the basic information and original sample data of historical building groups along the CER, unifying the IDs of heterogeneous data to concatenate the data attributes. Second, the overall facade analysis determined the identification features in terms of spatial distribution, homogeneous confusion, and feature vectors, which were trained and predicted by using the processed dataset in the improved SE-DenseNet structure. Finally, the prototype samples predicted by the model were used as new inputs for facade element analysis and divided into highlighted and inherent areas by semantic segmentation and CAM visualization to explore the expression differences between the functions and facades among the historic building groups.

3. Results

3.1. Model Performance

3.1.1. Experimental Procedure

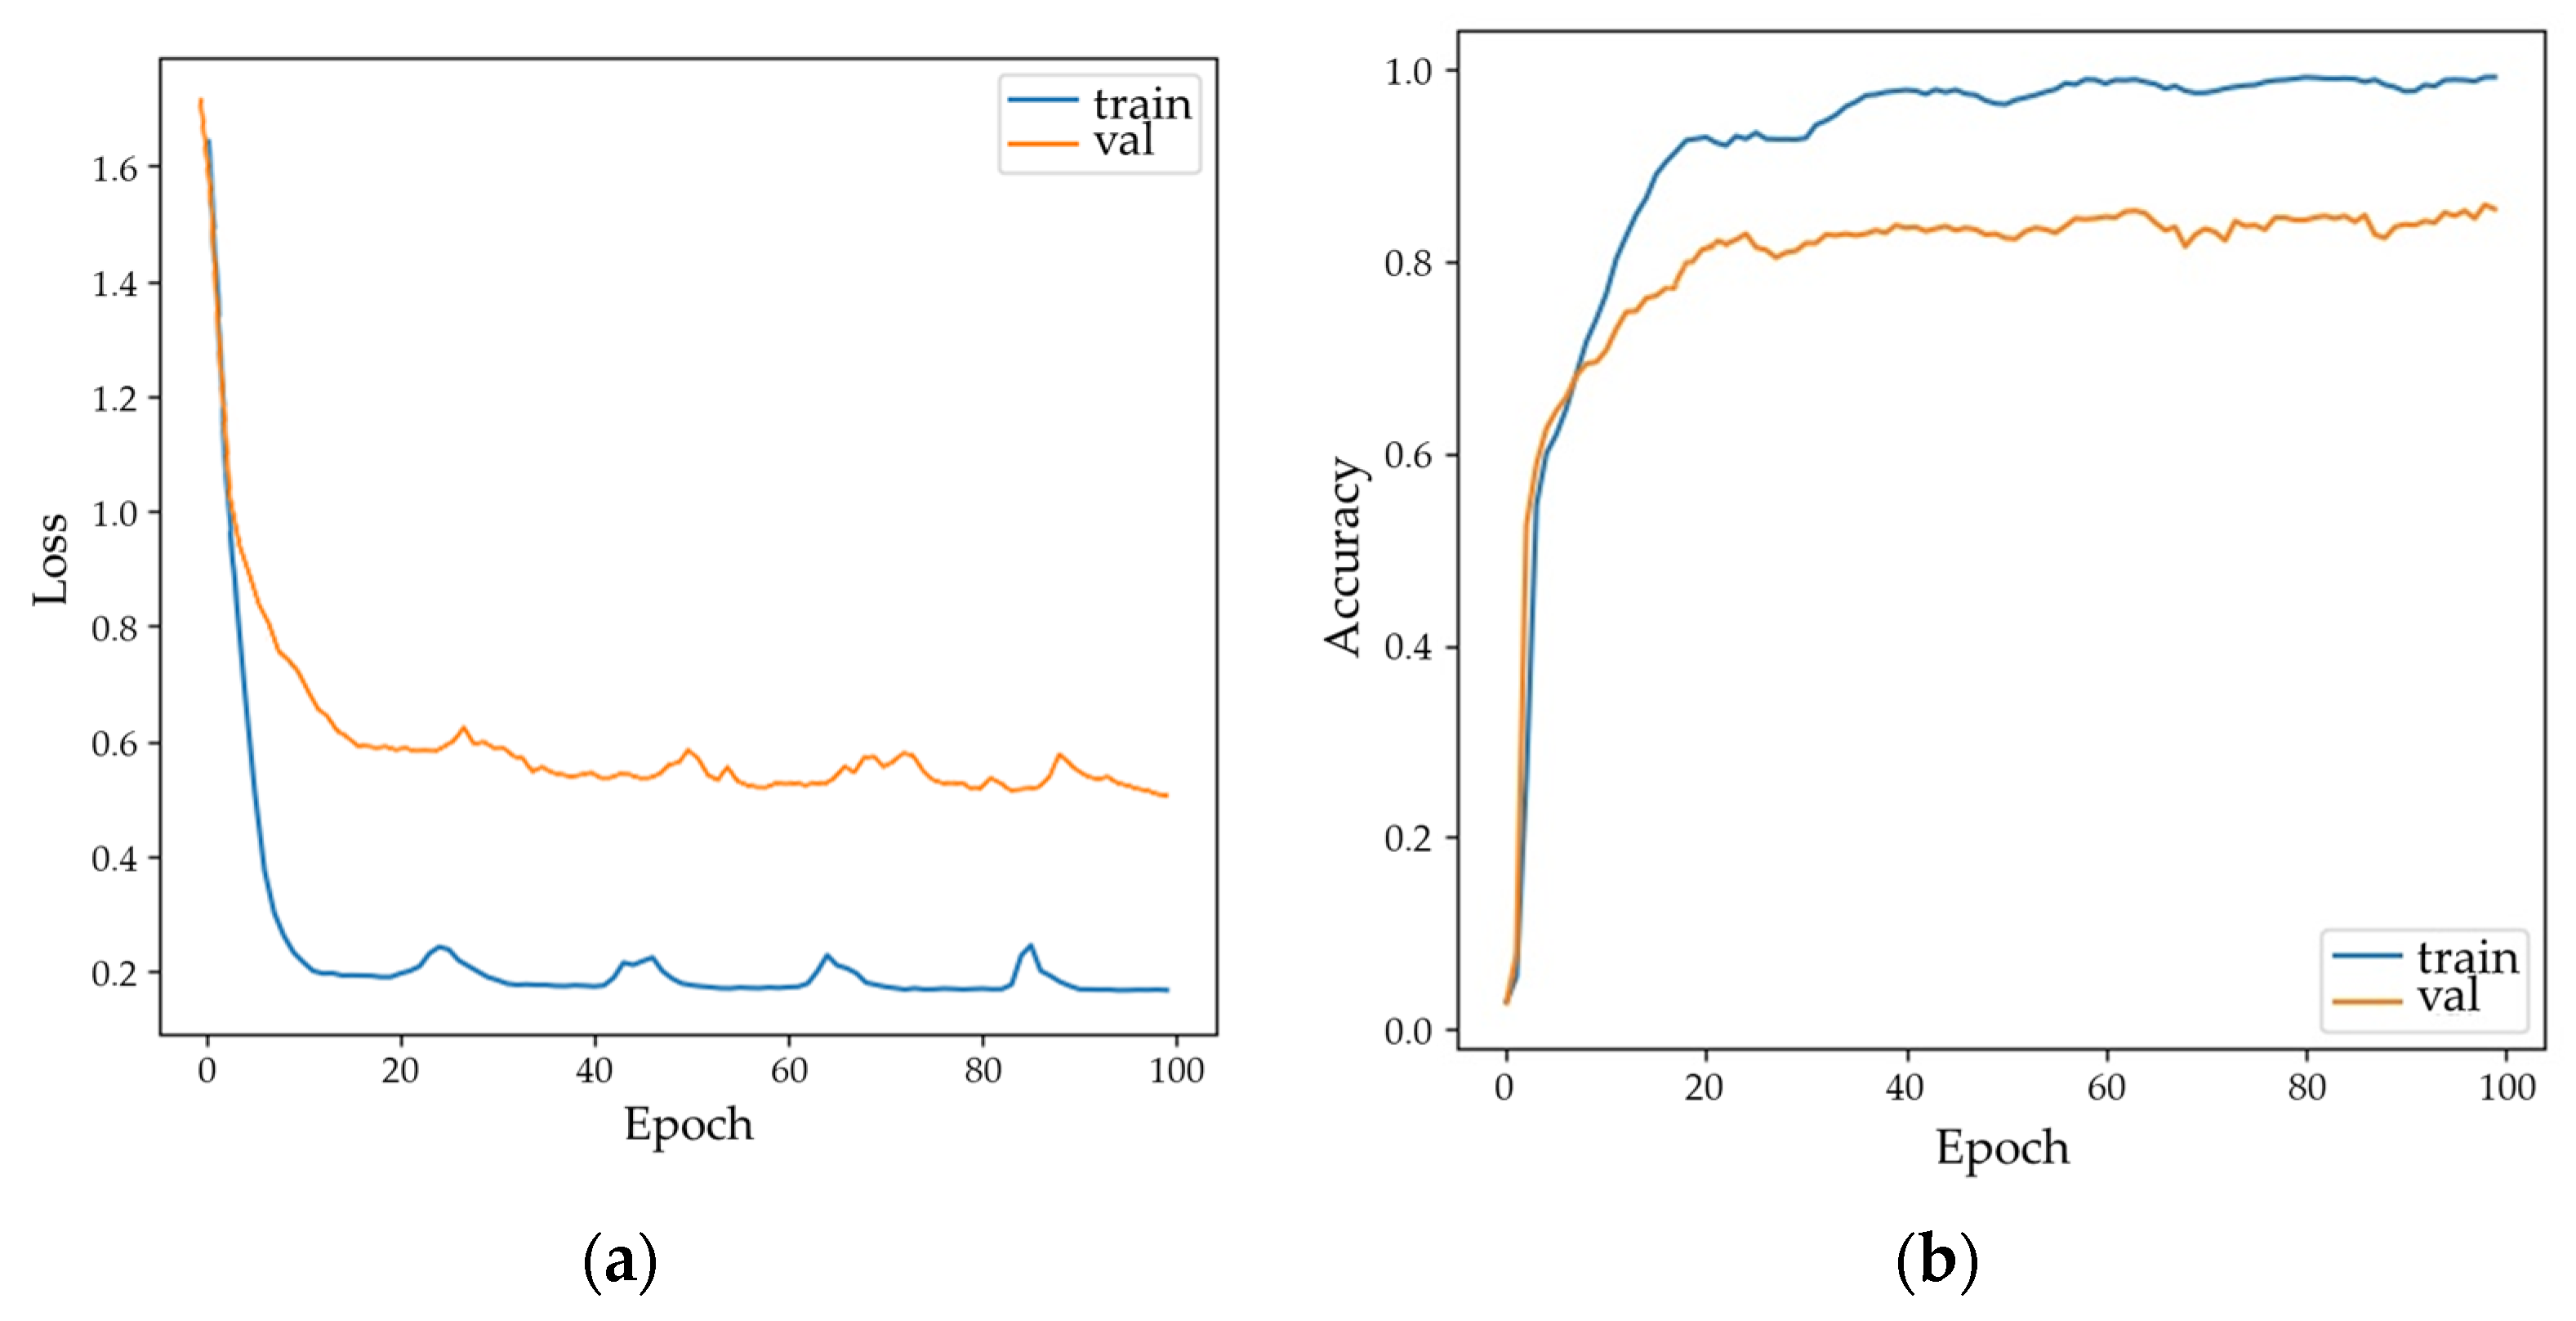
The experimental environment was implemented using Python 3.8 and PyTorch 1.12 with two GeForce RTX 3060-12G GPUs for calculations. The classification training process used mixed precision training, set 100 epochs with 0.0001 as the initial learning rate, and used Cosine Annealing with Warmup to adjust the learning rate dynamically. A batch size of 64 was used for training, testing, and validation, and Polyloss and AdamW were selected as the loss function types of the model with the optimizer [67,68]. Our classification model reached a total accuracy of 85.84% with the validation set for the 20% HLJ section and a total accuracy of 72.36% in the test set for the NM section. Figure 6 shows the details of the process by which the model was trained to reach convergence at roughly 40 epochs.

3.1.2. Classification Accuracy by Class

We compared the more popular image classification networks to identify the original functional classification of historic building groups. According to the configuration described in Section 3.1.1, training and validation were performed on the CER dataset. Table 3 shows the classification results and performance of each model. Compared with other popular networks, DenseNet, with its dense connectivity mechanism, performs better in the function classification of realistic historical buildings, making the model deeper and extracting more comprehensive features. It was observed that, upon adopting the self-attention mechanism to assign weights to different features, the more informative features were effectively utilized, improving the feature extraction capability of the network and improving the generalization ability.

3.2. Overall Differences in Facades among Functions

3.2.1. Spatial Distribution

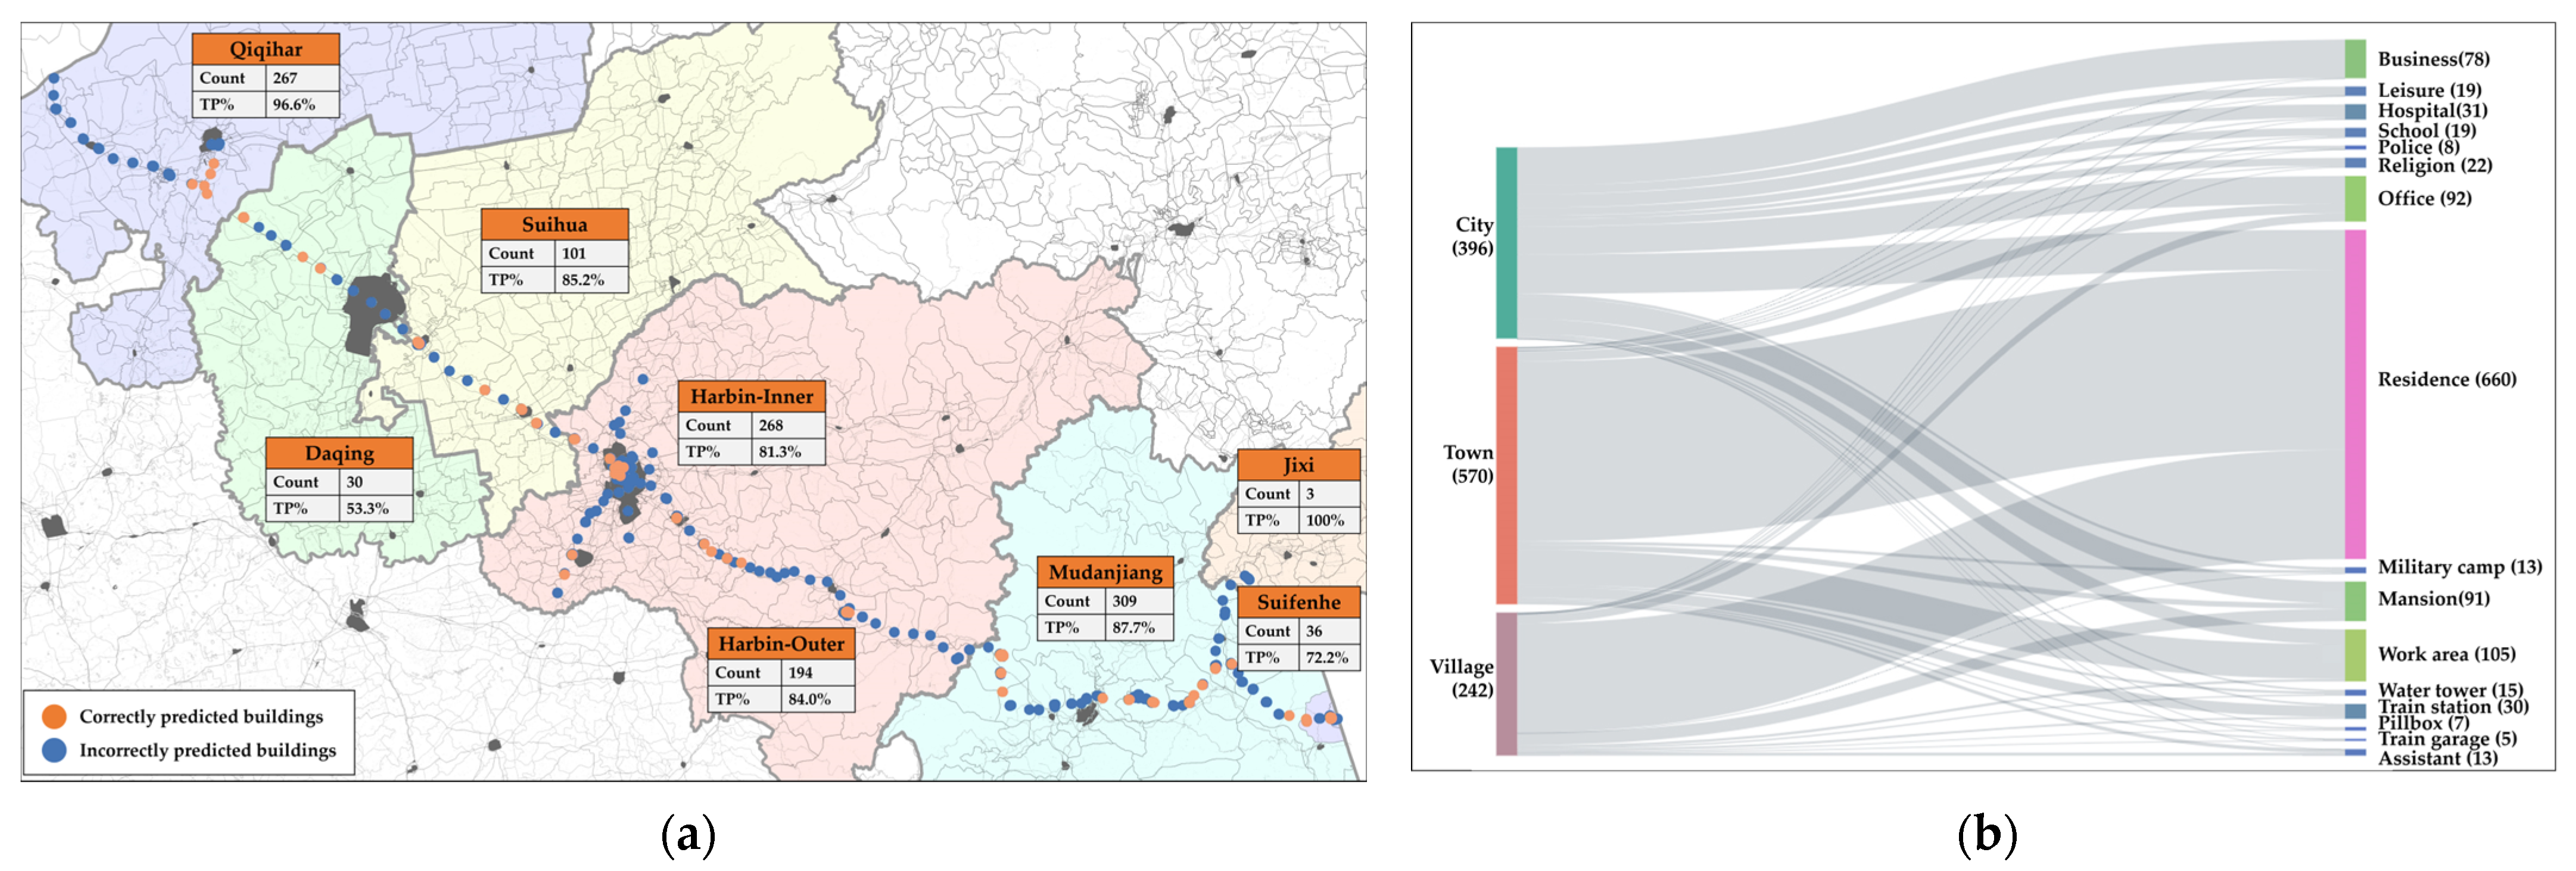
We analyzed the spatial and error distributions of historical building groups along the CER. Figure 7a shows the amount and accuracy of the historical buildings in each area, with blue indicating the correctly predicted buildings and orange indicating the incorrectly predicted buildings. The TP%s in the city and suburbs of Harbin were 81.34% and 84.02%, respectively. The major errors occurred in cities with building functions, such as business, hospitals, and schools, while the errors in suburbs mainly occurred in the working and military areas along Daqing, Suihua, and Suifenhe. Figure 7b shows the urban–rural count differences in the spatial distribution of building functions. The majority of the confusion was found in Harbin, and the diachrony may cause style merging and renovation deviations. In order to facilitate the expansion and support of immigrant settlements, Harbin’s early urban construction was developed by supplementing functions from the railway backbone, leading to rich and varied styles of public buildings [19]. In addition, the concept of early renovations emphasized the facade’s shape rather than its authentic conservation [69].

3.2.2. Classification Features

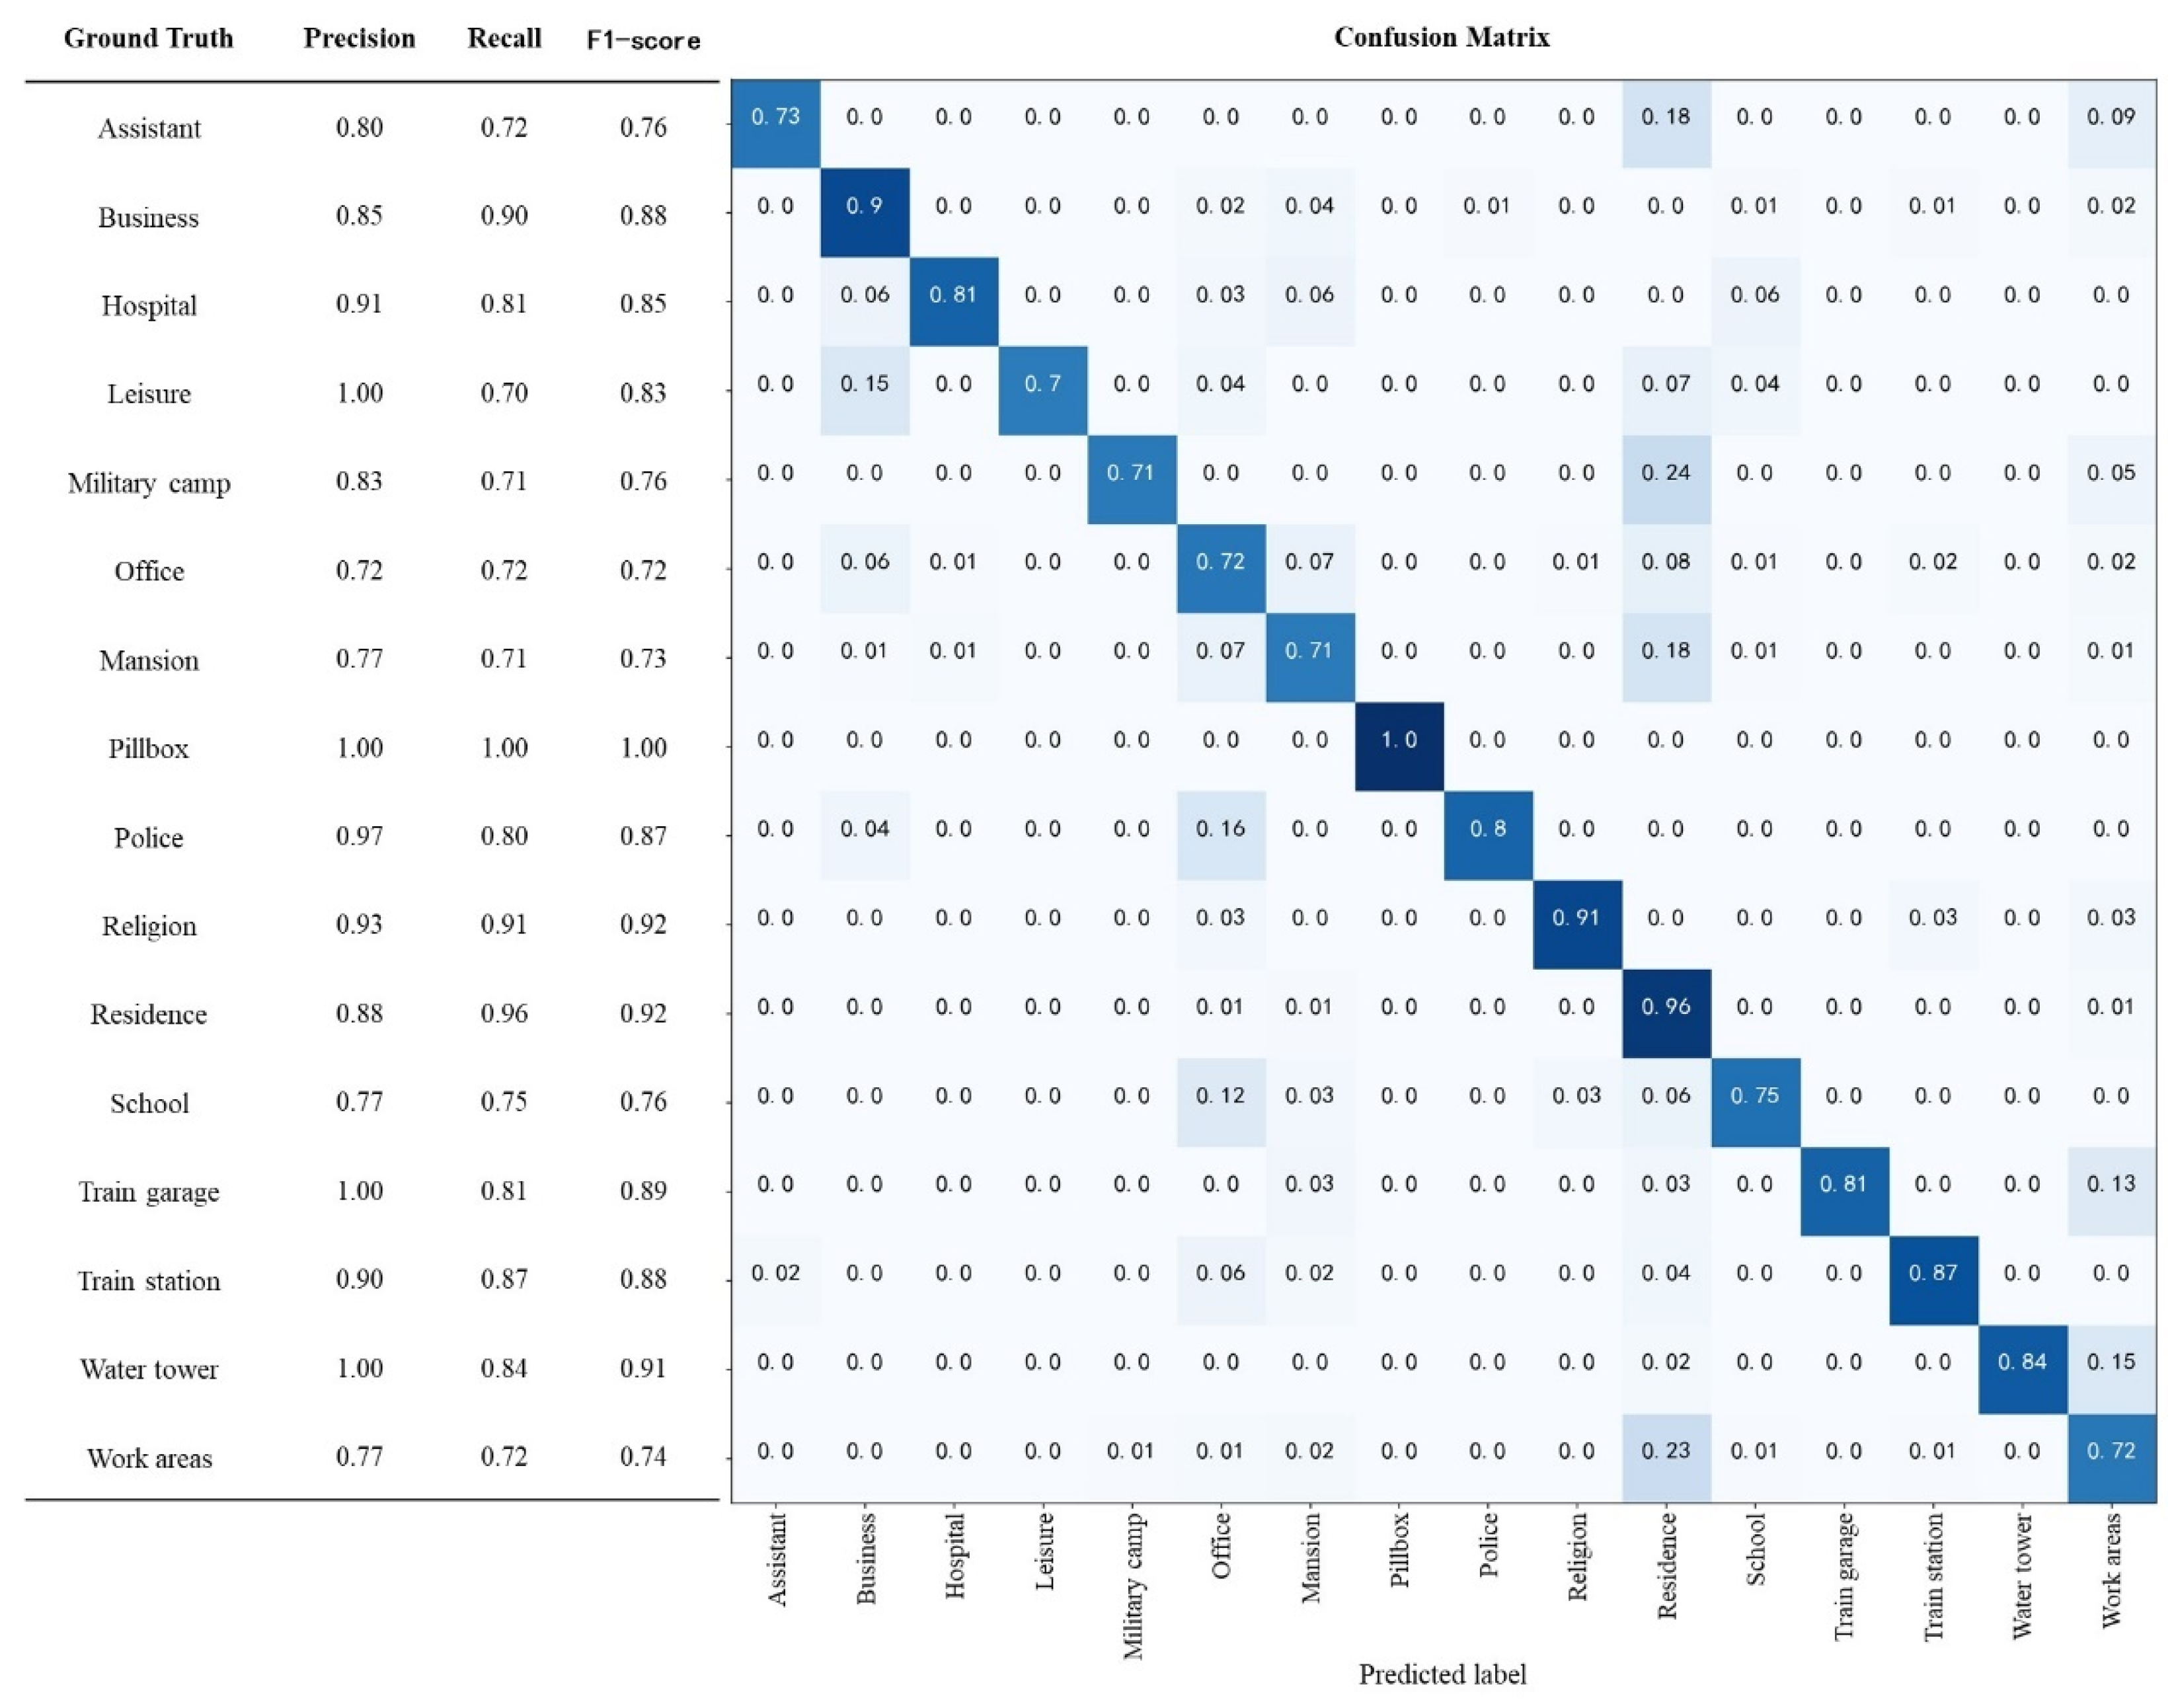
In order to evaluate the visual relationships between each function type of the historic buildings, we computed the confusion matrix of the model using the validation set. Figure 8 shows the confusion matrix, which compares the predicted and ground truth labels, including the precision, recall, and F1-score for each function type. Overall, most of the historic buildings along the CER can be basically identified as the correct category, with the accuracy of the identification results being above 0.72, recall above 0.70, and F1-score above 0.73. Proportionally, 18% of assistant buildings, 24% of military camps, 18% of mansions, and 23% of work areas were misidentified as employment residences. Assistant buildings, train garages, and water towers were misidentified as work areas with error rates of 9%, 13%, and 15%, respectively. Compared to the historic buildings often seen in towns and villages, 16% of police stations and 12% of schools were misclassified as office buildings, and 15% of leisure buildings were misclassified as business buildings. Considering the militarization, colonization, and industrialization of the CER repair process, the embryonic forms of towns along the railway were closely related to the military administration and employment–residence buildings close to railway projects [47], reflecting a certain similarity in architectural forms and potential homogeneity among functional clusters.
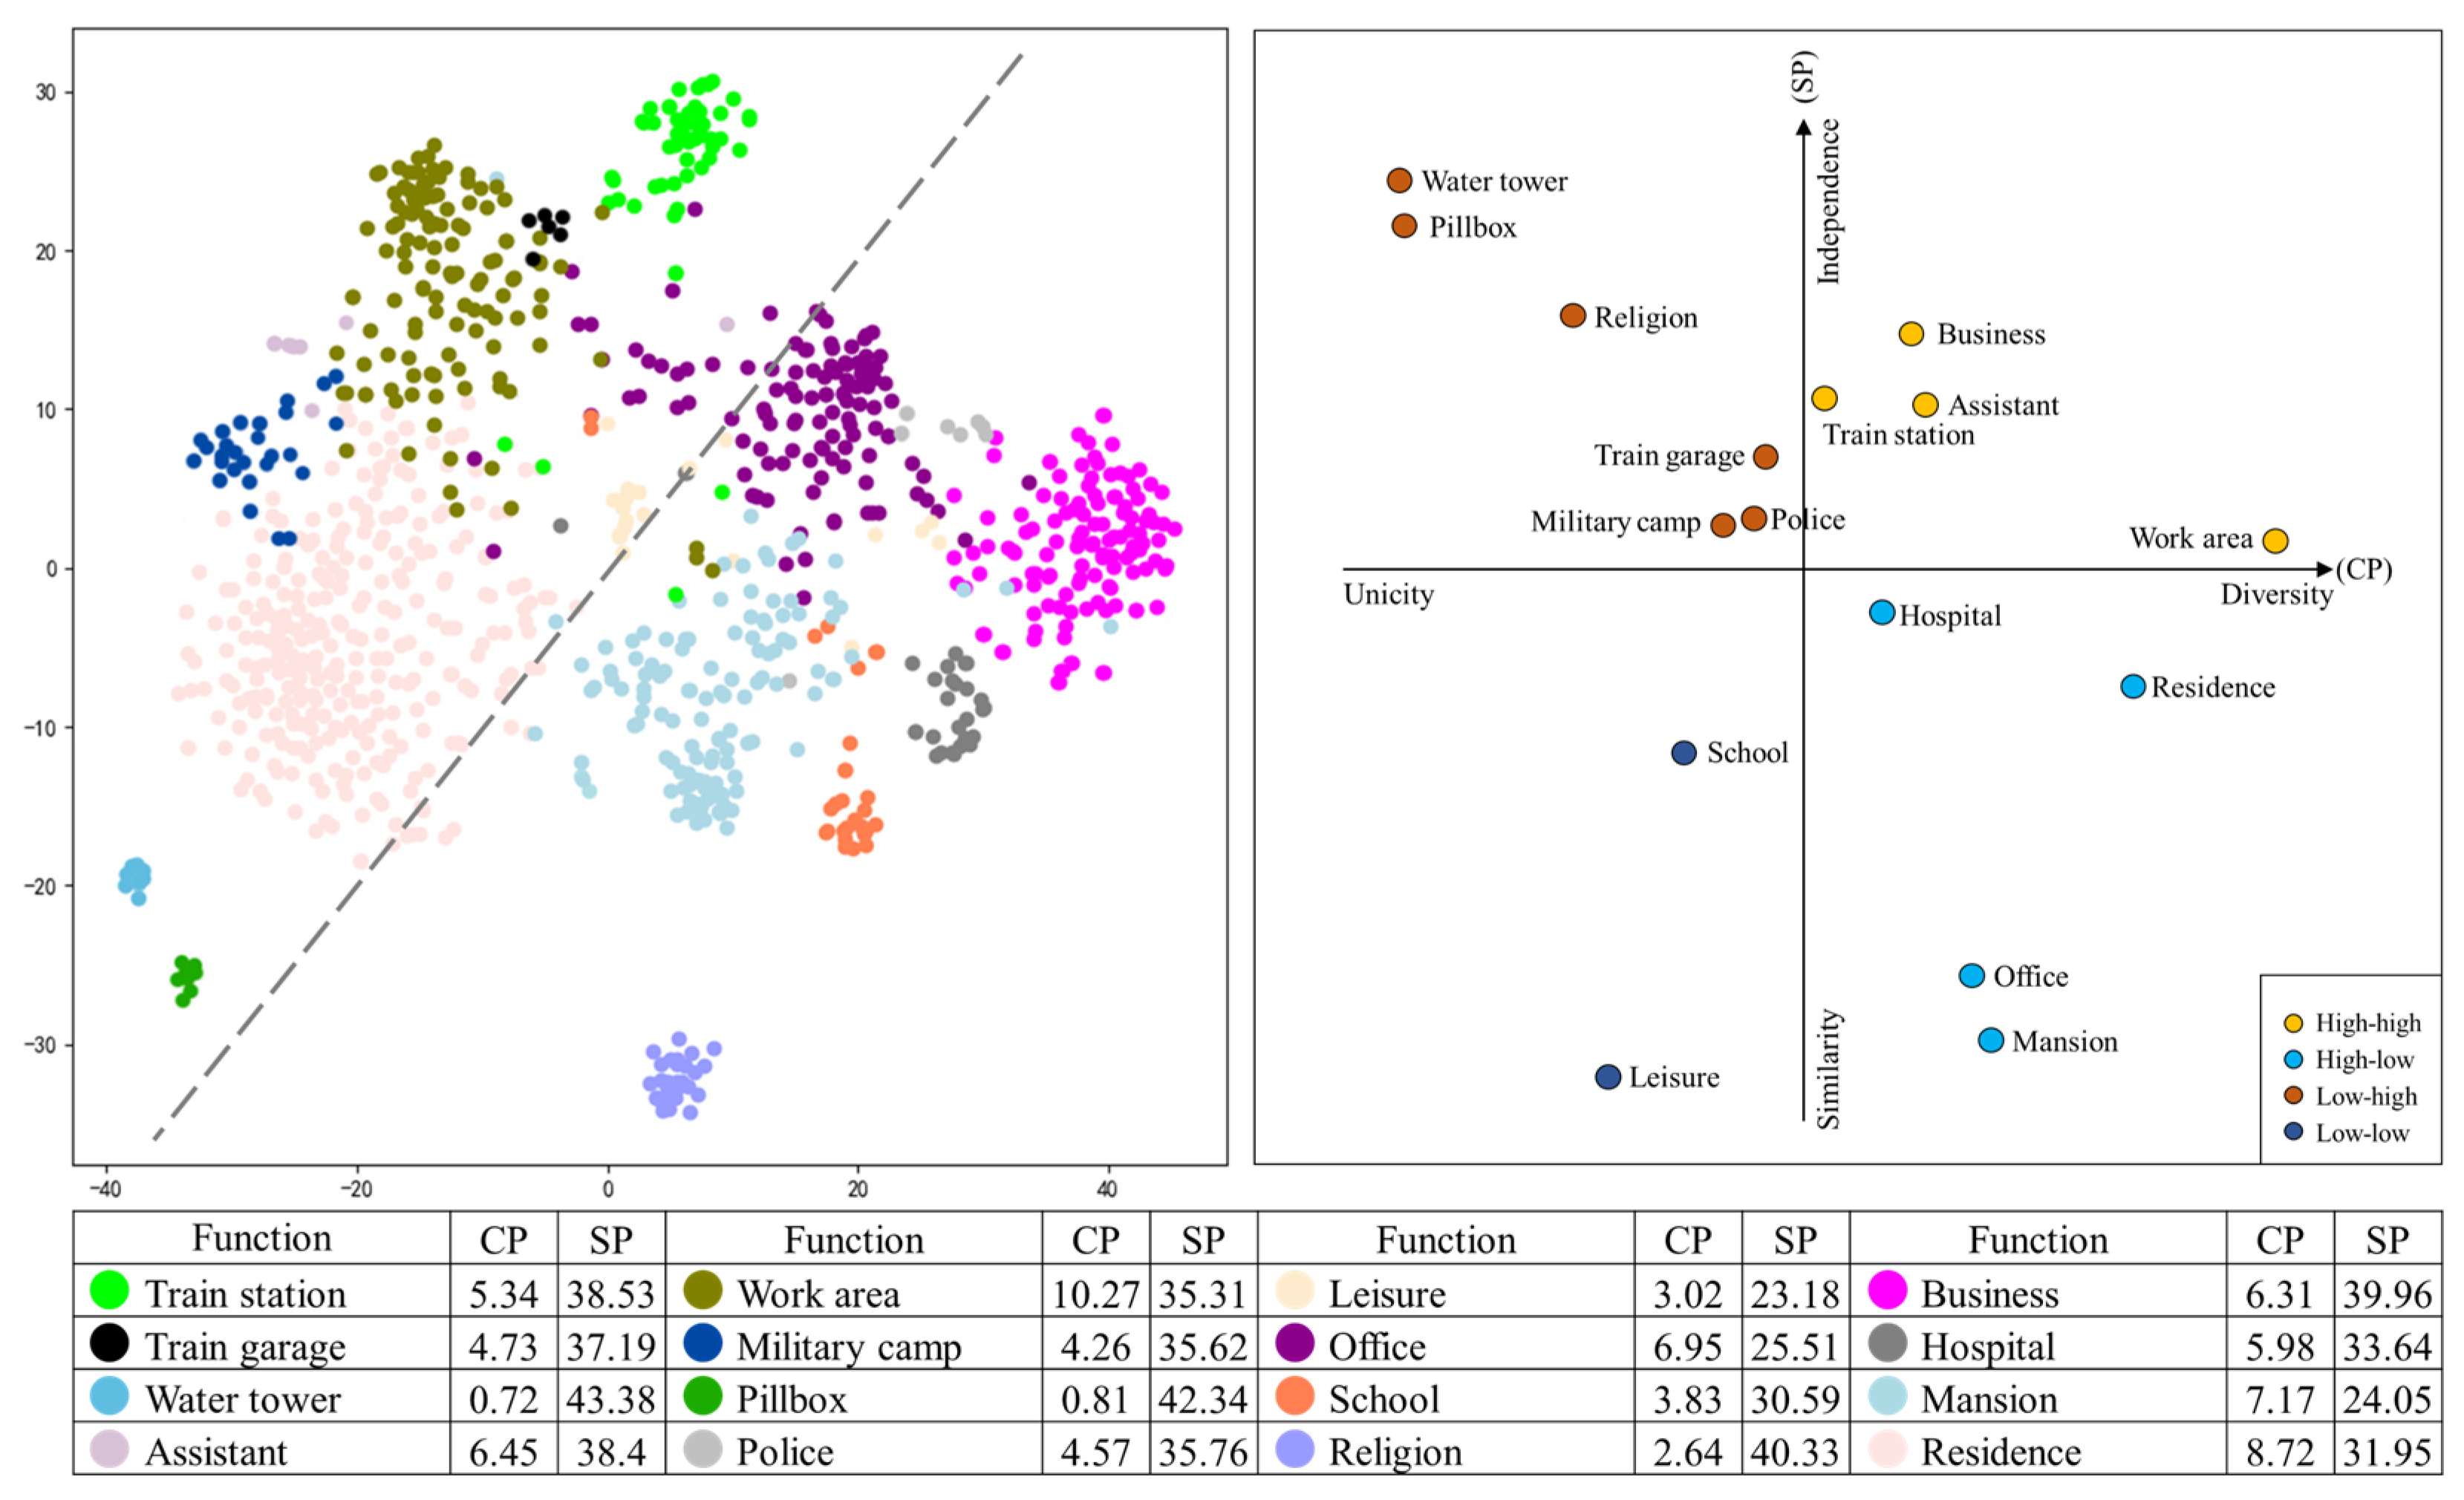
The t-SNE facilitates the recognition and understanding of anomalies and relationships between the functional systems of the historic building groups by visualizing the in-depth features from each type of sample cluster in the validation set. In order to understand the functional systems and visual connections of the CER building groups from a holistic perspective, Figure 9 shows our t-SNE two-dimensional mapping plot of the 16 classes of historic buildings in the test set. It also includes quantitative CP and SP descriptions of the clusters. According to the distribution structure of the t-SNE, military, industrial, railway, and employment residences are usually distributed in towns and villages, demonstrating a clear separation from the function categories commonly found in cities. The leisure building cluster is at the system’s center, connected with other clusters around it and becoming the more critical visual image representative type of the entire building group. The compact and isolated clusters of pillboxes, water towers, and religious structures show a certain degree of visual heterogeneity.
The relationships between inner and outer clusters were calculated using the CP and SP in complementary fashion. Figure 9 (right) depicts the features of each cluster, which were divided into four visual features using 2D vectors—high–high, low–low, high–low, and low–high—using the mean CP and mean SP of all the clusters as the coordinate origins. High–high indicates diversity within a cluster and independence between clusters, and this type of building is widely used to serve operation and trade for a railway. This may be due to the different hierarchies of stations along the CER [70], with levels matching and independent of the functional system. Conversely, low–low indicates intra-cluster unicity and inter-cluster similarity. As important public service buildings, leisure buildings and schools formed their own characteristic focus under the urban construction led by the Tsarist government. Low–high historic buildings are independently identifiable by the serious or exclusive function that no diverse facades are represented along the route. The high–low historic building facades are diverse and interconnected, with a large number of buildings attached to different consulates and residents, and their self-governance may promote a close integration among the cluster facades.

3.2.3. Classification Extraction Prototype

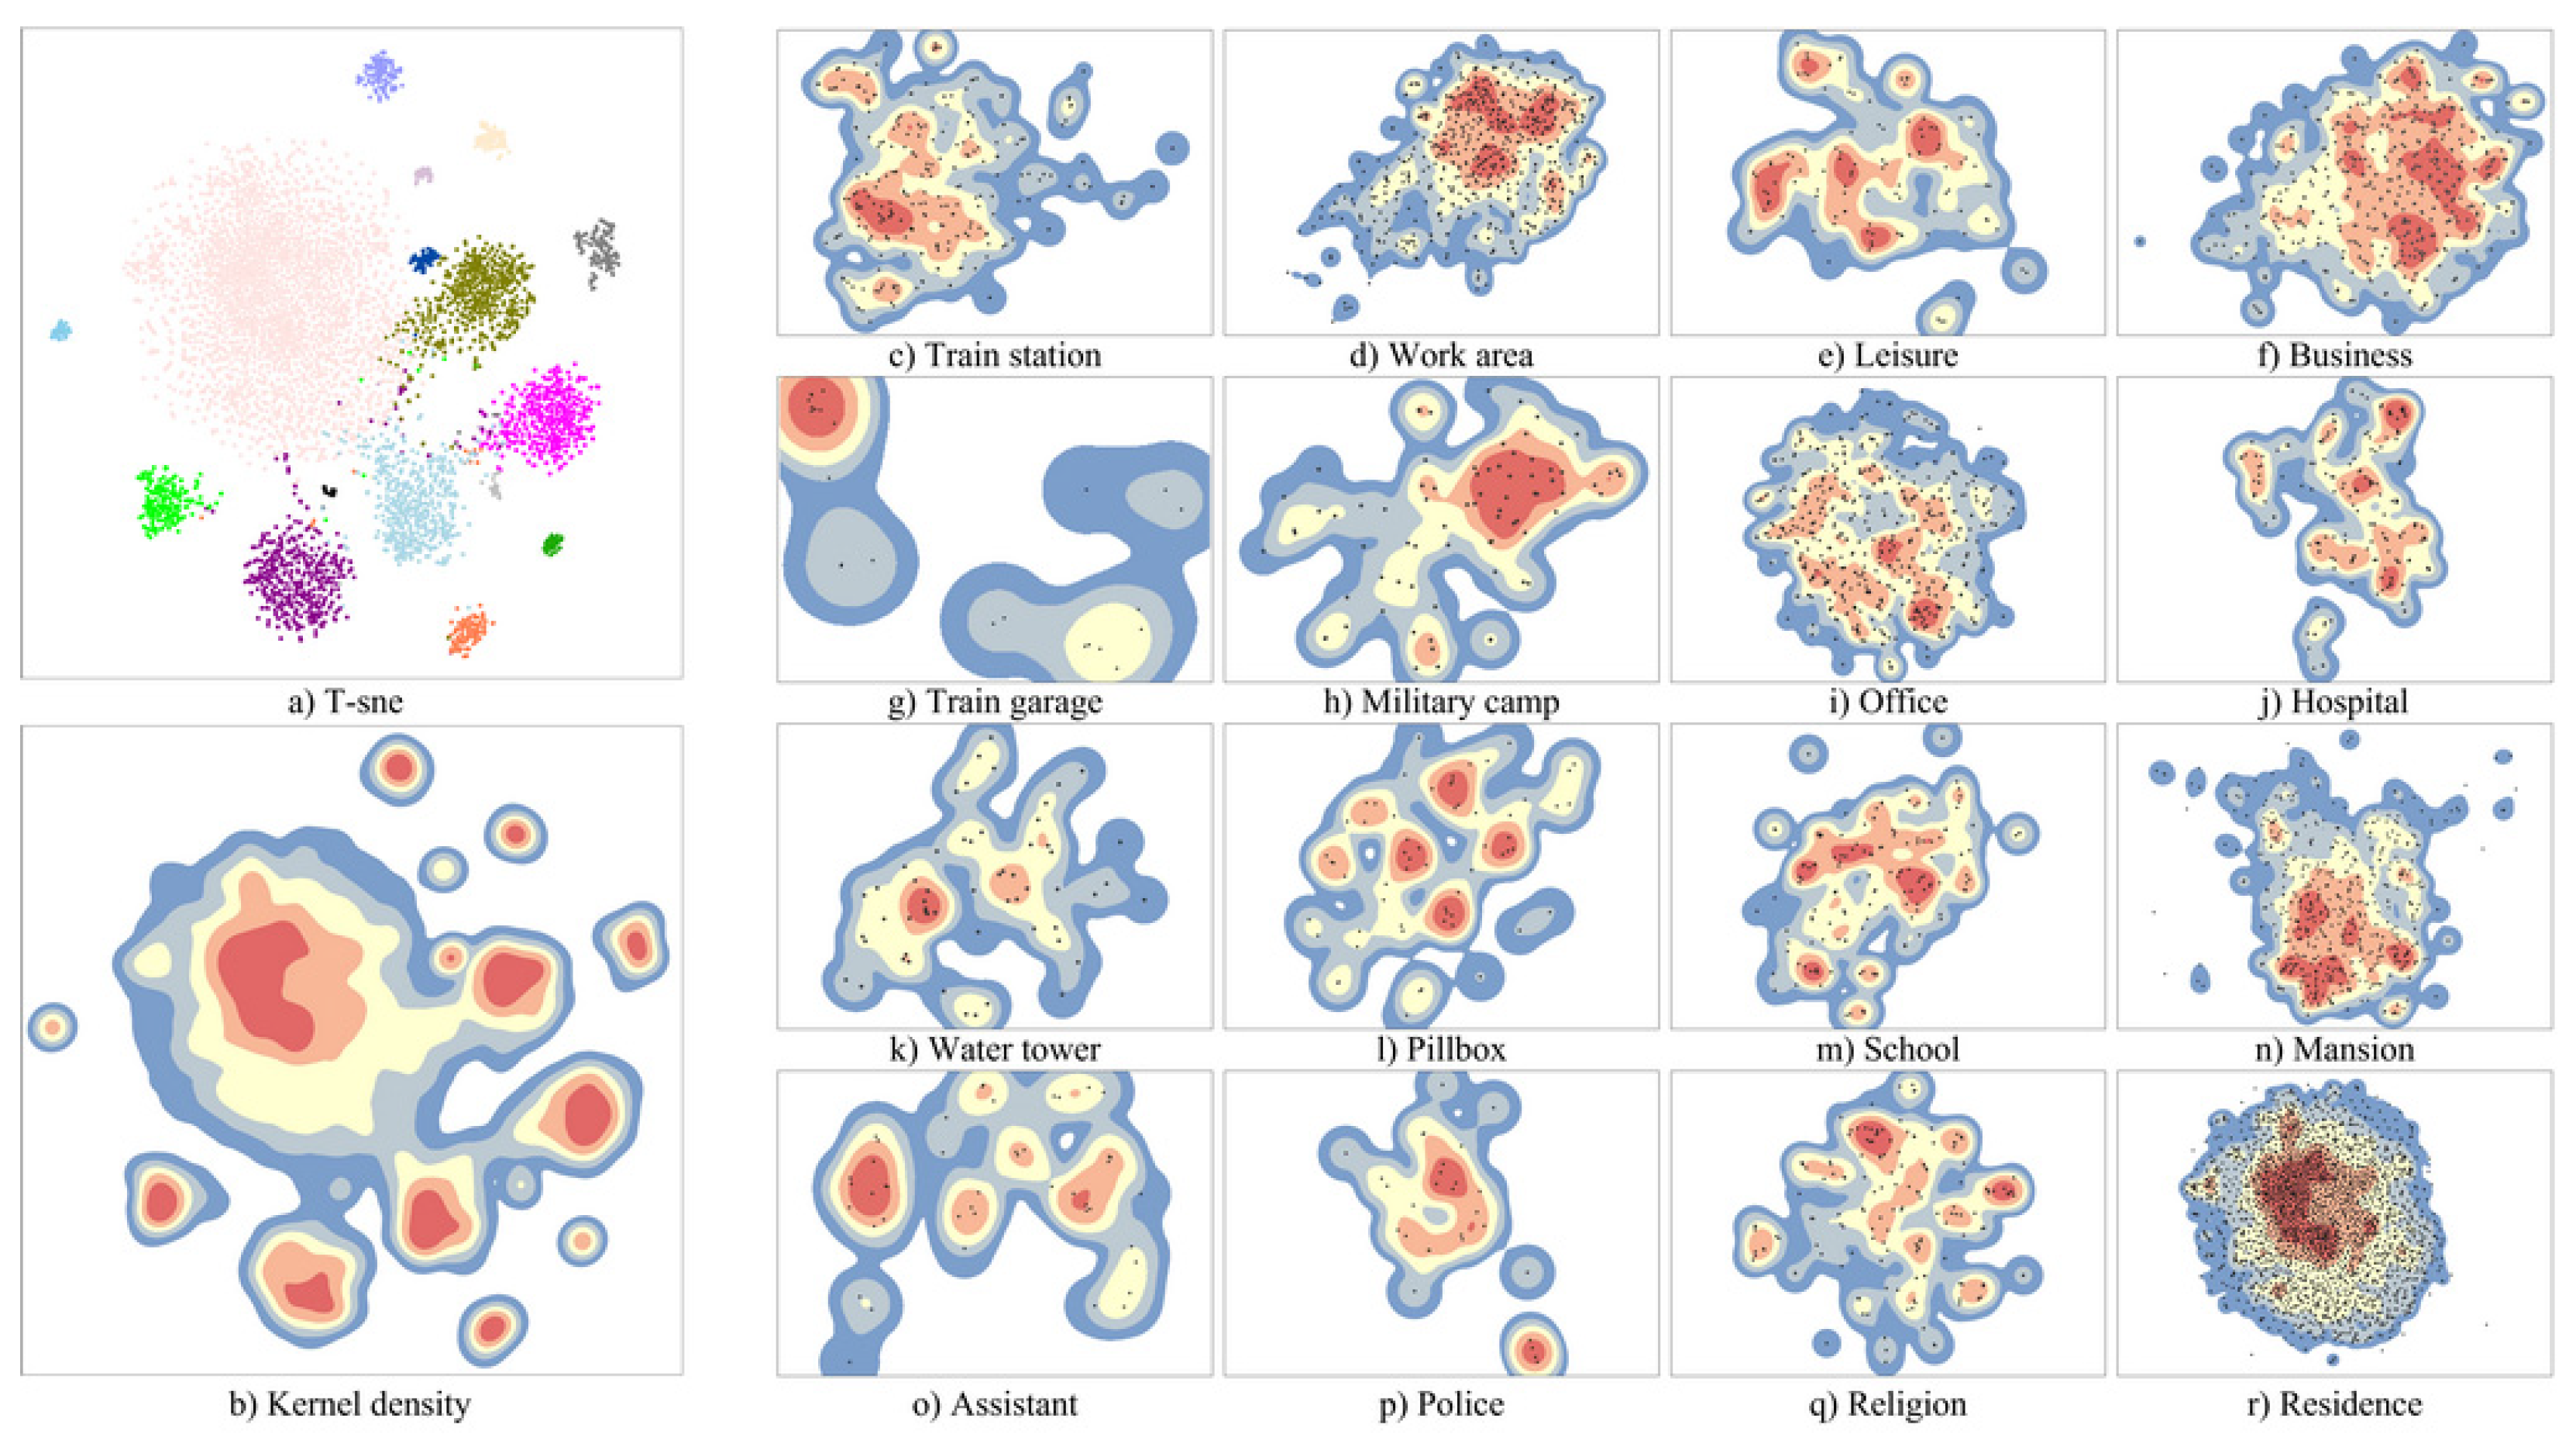
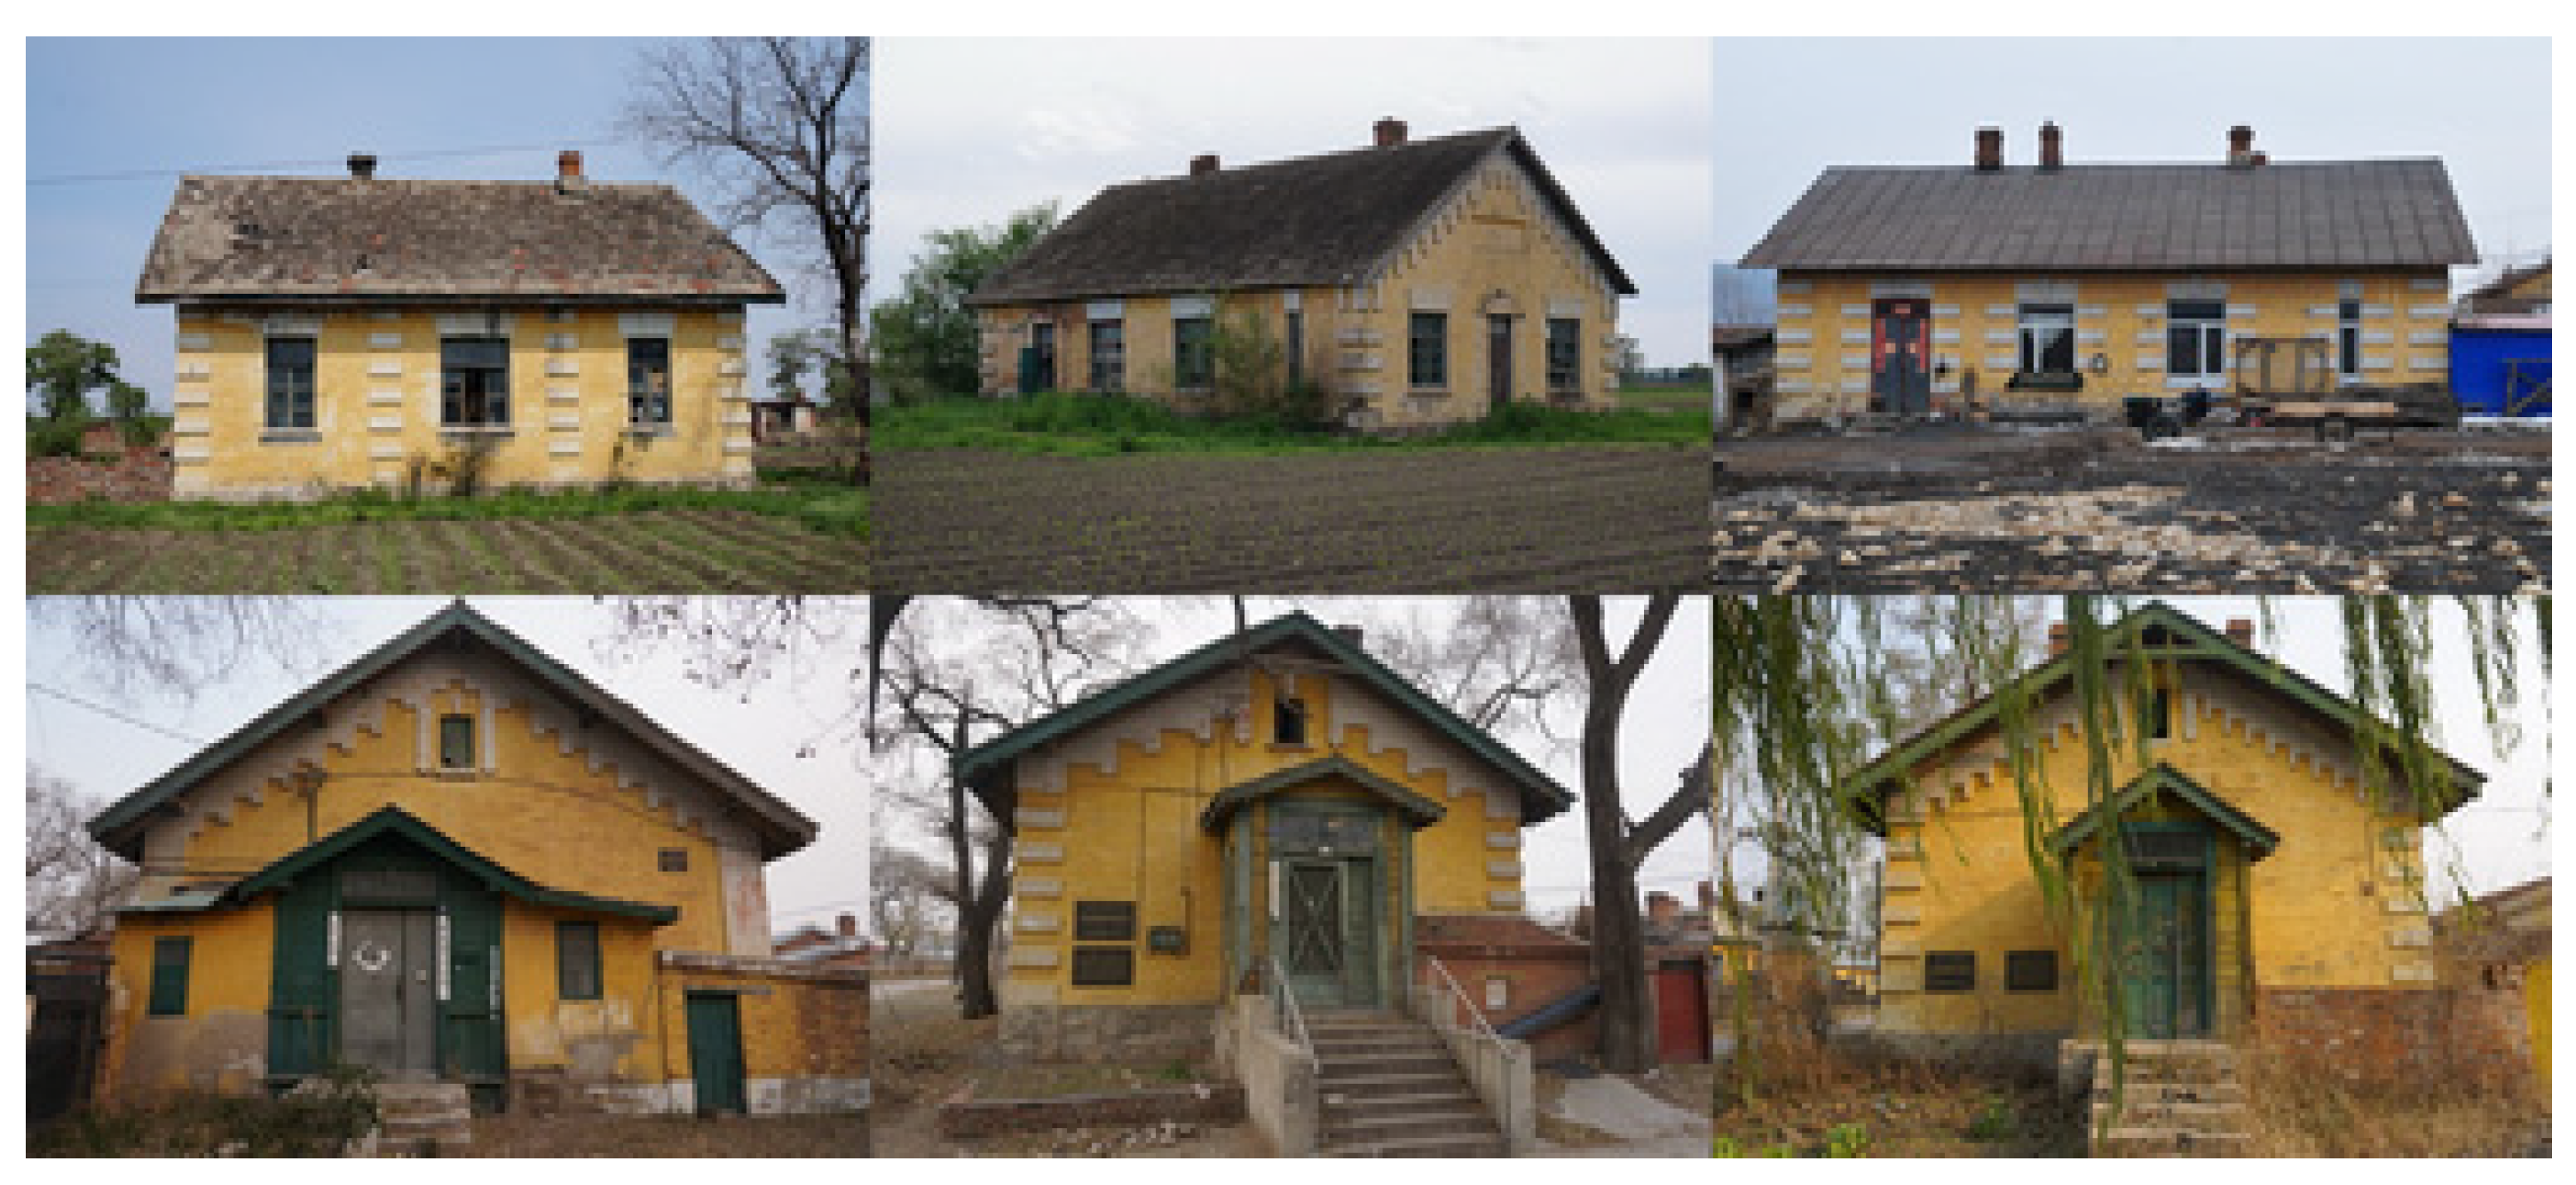
In order to extract the prototypes for each type of historic building, a kernel density calculation was applied to each cluster visualized by the t-SNE across the entire dataset, and the densest sample in each cluster was selected as the “representative” type using Jenks. Figure 10a,b shows our density visualization for the entire samples in each cluster, and the samples within the red core areas in each cluster, which were selected as representatives of the cluster’s prototype, are shown in the figures on the right. Although our extraction process did not judge the heritage value, the extraction results show that the prototype extraction after the traversal process of the global features was consistent with the conventional sense under the general patterns, which are essential and integral universal features. Figure 11 shows examples of the extracted prototypes, which represent most of the features across residential buildings.

3.3. Elemental Differences in Facades among Functions

3.3.1. Elemental Areas of the Facade Features

The features of the global average pooling layer in the model were extracted using Grad-CAM to generate a positioning map to highlight the category’s feature areas. Using the prototypes of the building groups extracted above, the combination of Grad-CAM with fixed semantics could reflect more meaningful elemental features. Table 4 shows the samples of categories with fixed semantic elements overlaid with Grad-CAM feature weights, and in parentheses are the numbers of prototype images for each category. Our model was not influenced by the first floor, which came from the modern facade renovation, store signage, and pedestrian vehicles, especially in the commercial building identification. The feature areas are primarily focused around windows, which also play an important role in the identification of historic buildings along the CER [71].

3.3.2. Elemental Expression of Facade Features

Describing the expression of the facade elements allows us to understand the relationship between the functional characteristics and the facade elements in the building group. Figure 12 shows the differences in our representation of the façade elements of the historic buildings along the CER, in which the area size indicates the mean area of the featured facade elements, and the color represents the mean weight of the featured intensity. Walls, windows, and their decorations are the main parameters that identify the function category. Although the main feature areas of windows and walls are generally higher than those of their decorative elements, their feature strengths are significantly lower than those of their decorative elements. The results show that combining Grad-CAM with the fixed semantics of the facade elements helps to mine the facade features of building groups.

4. Discussion

4.1. Visual Measurement of Historic Building Groups

It is widely known that the identification of historic building groups is an important field of heritage conservation; due to the limitations of technology and data, information on the buildings’ visual characteristics often depends on a manual traversal process and the subjective experience of experts. This study explored an objective and efficient traversal analysis methodology using deep learning techniques to identify the features of historical building groups. The model SE-DenseNet was deliberately designed with a channel attention mechanism to improve the accuracy of historical building identification, which could enhance the effective features for learning and extraction. Although the addition of squeeze excitation to the model increases the parameters, training time, and computational resources, it is worthwhile in terms of the training effect and more significant features. The preset application scenario did not require responses in real time, instead acting as a visual inspector of the traversal analysis of the numbers of building groups; therefore, it does not impact the model’s usability in real applications.

4.2. Visual Relationship between Function and Facade

With the rapid development of deep learning techniques, image data reflecting conservation values provide new paths for describing and understanding historic building groups. The potential connections among the building groups were the primary contributions in our dataset, with the buildings having similar colors, styles, and symbols, and being built during the same period of construction. Although their scattering along the railroad produced a blind spot that was challenging to be covered by the street view images that are widely used at present, it is more important to understand the typological analysis supported by this methodology for historic building groups. The identification results for 16 historic building functions further explain the details of the multi-vector features among the building groups in terms of geographic distribution, typological relationships, and element expressions. These findings provide a feature reference for historical research and visual perpetuation in the CER and will help to promote the authenticity and integrity of the historical building groups.
We observed in both qualitative and quantitative explorations that the features explained by the model equally reflect instances of more valuable information and patterns, such as the complexity of deep descriptions, multi-scale similarity observations, and overall understanding, which often require long-term tracking and investigation [72]. We also found that the characteristic differences in diversity and specialization, whether demonstrated using the binary structure of the t-SNE with clusters or not, largely conform to the existing conventional sense regarding the CER, further confirming the findings of a previous investigation [69]. The expression of facade elements could provide an effective interpretation of the multi-dimensional vector features among the historic building group. Our methodology provides an important reference point for the identification and classification process by extracting the typological paradigm and tracing the elements’ position in the historic building group. Similarly to studies on the classification of architectural styles, windows are the most essential element, and their diverse decoration is the primary point of reference for distinguishing the classification [55,73], as well as the criterion for regeneration in the future. In addition, this process should recognize the inherent value of historic buildings, and the spatial and temporal evolution of heritage value elements should be integrated into the conservation framework [74].

4.3. Limitations and Future Work

There are limitations that could be addressed in future studies. Since empirical applications were selected from historical building groups along the CER, dismantling the group features formed by industrial expansion was the focus of this study, which had a unified construction background. The context of historic buildings in the study was not absolutely comprehensive, and there may be other missing buildings that still lack preservation attention. Continuous surveys will be needed in future work to maintain the integrity of the CER historic buildings for conservation. During the data collection phase, a portion of the historic building facades were found to be in disrepair, renovated, and remodeled. This irreversible change may have induced some deviation in the experimental results, which could have also been influenced by the fact that the images were shot manually, thus affecting their quality. In future work, preset, unified shooting devices and multi-source image data could be considered through different wavelength ranges to distinguish such alterations (e.g., mold, deterioration, and stain) and to enhance the capabilities in prediction and interpretability [75]. In addition, the study initially defaulted to equal values in historic buildings without considering the individual differences supporting the typological contribution. Future research could combine heritage value assessments to further support the typological representation.

5. Conclusions

This research applied computer vision and image classification to establish the cognitive structure of the visual features of historic building groups, analyzed the inherent relationship between function and facade in historic building groups, and excavated their expressive features as well as crucial elements to provide criteria for their regeneration, preservation, and inheritance.
Our methodology was applied to the functional categories of 1208 historical buildings along the Heilongjiang section of the CER, and 158 buildings were tested through the Inner Mongolia section of the CER. The results show that our method had a satisfactory accuracy, with a precision of 85.84%. Compared with previous methods, the interpretation of the model further explored the depth features in historical building groups, which could assist traditional studies that employ the manual traversal process. At the same time, we found that the building distribution along the CER is characterized by an urban–rural dichotomy and a clear differentiation between military, industrial, and railroad functions, with buildings being commonly found in cities and towns. In addition, the elements that influence the facade features along the CER are the decorative parts of the elements, instead of the fundamental parts.
A systematic understanding of historic building groups promotes value transfer and renovation for conservation. Exploring the functional logic and systemic vein within the historical building groups, both comprehensive and segmented, will provide a new path for integrated conservation and stable inheritance.

Author Contributions

Conceptualization, P.L. and Z.Z.; methodology, P.L. and Z.Z.; software, P.L. and Y.C.; validation, P.L. and Y.C.; formal analysis, P.L. and B.Z.; investigation, P.L. and J.X.; resources, P.L. and Z.Z.; data curation, P.L. and Y.C.; writing—original draft preparation, P.L. and J.X.; writing—review and editing, Z.Z. and B.Z.; visualization, P.L. and B.Z.; supervision, Z.Z.; project administration, Z.Z. and B.Z.; funding acquisition, Z.Z. and B.Z. All authors have read and agreed to the published version of the manuscript.

Funding

This research was funded by the National Natural Science Foundation of China (grant no. T2261139560 and no. 52278055), Heilongjiang Province Philosophy and Social Science Research Planning Project (grant no. 22KGC292), the Fundamental Research Funds for the Central Universities (grant no. HIT.DZJJ.2023081), and China Scholarship Council (grant no. 202106120247).

Institutional Review Board Statement

Not applicable.

Informed Consent Statement

Not applicable.

Data Availability Statement

Data are contained within the article.

Acknowledgments

We would like to thank the editors and anonymous reviewers for their constructive suggestions and comments, which helped to improve this paper’s quality.

Conflicts of Interest

The authors declare no conflict of interest.

References

  1. Jiang, P.; Shao, L.; Baas, C. Interpretation of Value Advantage and Sustainable Tourism Development for Railway Heritage in China Based on the Analytic Hierarchy Process. Sustainability 2019, 11, 6492. [Google Scholar] [CrossRef]
  2. Orbaşli, A.; Woodward, S. A Railway ‘Route’ as a Linear Heritage Attraction: The Hijaz Railway in the Kingdom of Saudi Arabia. J. Herit. Tour. 2008, 3, 159–175. [Google Scholar] [CrossRef]
  3. Motevalian, N.; Yeganeh, M. Visually Meaningful Sustainability in National Monuments as an International Heritage. Sustain. Cities Soc. 2020, 60, 102207. [Google Scholar] [CrossRef]
  4. De Kock, P. The Meaning in Seeing: Visual Sustainability in the Built Environment; AMPS, Stevens Institute of Technology: Hoboken, NJ, USA, 2019. [Google Scholar]
  5. Motevallian, N.; Yeganeh, M. Analysis of the Influence of Time Dimension on the National Symbol and Its Immediate Field. Urban Des. Discourse A Rev. Contemp. Litreatures Theor. 2020, 1, 55–67. [Google Scholar]
  6. Li, Y.; Ren, S.; Geng, H. Integrated Preservation of Ethnic Cultural Heritage from the Perspective of “Cultural Gene Inheritance”. Urban Dev. Stud. 2021, 28, 74–82. [Google Scholar]
  7. Zhang, B. Historic Urban and Rural Settlements: A New Category towards Regional and Integral Conservation of Cultural Heritage. Urban Plan. Forum 2015, 6, 5–11. [Google Scholar] [CrossRef]
  8. Xiao, J. Study on the Classification and Conservation of Asian Heritage from the Perspective of Cultural Landscape. Archit. J. 2011, S2, 5–11. [Google Scholar]
  9. Yoshimura, Y.; Cai, B.; Wang, Z.; Ratti, C. Deep Learning Architect: Classification for Architectural Design through the Eye of Artificial Intelligence. In Computational Urban Planning and Management for Smart Cities; Geertman, S., Zhan, Q., Allan, A., Pettit, C., Eds.; Lecture Notes in Geoinformation and Cartography; Springer International Publishing: Cham, Switzerland, 2019; pp. 249–265. ISBN 978-3-030-19424-6. [Google Scholar]
  10. Ashrafi, B.; Kloos, M.; Neugebauer, C. Heritage Impact Assessment, beyond an Assessment Tool: A Comparative Analysis of Urban Development Impact on Visual Integrity in Four UNESCO World Heritage Properties. J. Cult. Herit. 2021, 47, 199–207. [Google Scholar] [CrossRef]
  11. Ranjazmayazari, M.; Ansari, M. Comparative Study of Facade Ornament, a Factor in Understanding of Scale, Function and Structural Expression; (Case Study: Modern and Postmodern Era). Hoviatshahr 2021, 15, 33–44. [Google Scholar] [CrossRef]
  12. Sullivan, L.H. The Tall Office Building Artistically Considered. Lippincott’s Magazine 1896, 57, 403–409. [Google Scholar]
  13. Burman, P.; Stratton, M. Conserving the Railway Heritage; Taylor & Francis: London, UK, 1997; ISBN 978-0-419-21280-5. [Google Scholar]
  14. Xie, X.; Liu, Y.; Xu, Y.; He, Z.; Chen, X.; Zheng, X.; Xie, Z. Building Function Recognition Using the Semi-Supervised Classification. Appl. Sci. 2022, 12, 9900. [Google Scholar] [CrossRef]
  15. Mendes Zancheti, S.; Piccolo Loretto, R. Dynamic Integrity: A Concept to Historic Urban Landscape. J. Cult. Herit. Manag. Sustain. Dev. 2015, 5, 82–94. [Google Scholar] [CrossRef]
  16. De Leão Dornelles, L.; Gandolfi, F.; Mercader-Moyano, P.; Mosquera-Adell, E. Place and Memory Indicator: Methodology for the Formulation of a Qualitative Indicator, Named Place and Memory, with the Intent of Contributing to Previous Works of Intervention and Restoration of Heritage Spaces and Buildings, in the Aspect of Sustainability. Sustain. Cities Soc. 2020, 54, 101985. [Google Scholar] [CrossRef]
  17. Seyedashrafi, B.; Ravankhah, M.; Weidner, S.; Schmidt, M. Applying Heritage Impact Assessment to Urban Development: World Heritage Property of Masjed-e Jame of Isfahan in Iran. Sustain. Cities Soc. 2017, 31, 213–224. [Google Scholar] [CrossRef]
  18. Roth, L.M. Understanding Architecture: Its Elements, History, and Meaning; Routledge: London, UK, 2018; ISBN 0-429-49558-7. [Google Scholar]
  19. Shan, L.; Zhang, L. Application of Intelligent Technology in Facade Style Recognition of Harbin Modern Architecture. Sustainability 2022, 14, 7073. [Google Scholar] [CrossRef]
  20. Khalaf, R.W. The Implementation of the UNESCO World Heritage Convention: Continuity and Compatibility as Qualifying Conditions of Integrity. Heritage 2020, 3, 384–401. [Google Scholar] [CrossRef]
  21. Yeganeh, M. Conceptual and Theoretical Model of Integrity between Buildings and City. Sustain. Cities Soc. 2020, 59, 102205. [Google Scholar] [CrossRef]
  22. Yi, Y.K.; Zhang, Y.; Myung, J. House Style Recognition Using Deep Convolutional Neural Network. Autom. Constr. 2020, 118, 103307. [Google Scholar] [CrossRef]
  23. Tang, P.; Li, H.; Wang, X.; Ludger, H. Generative Design on Conservation and Inheritance of Traditional Architecture and Settlement Based on Machine Learning: A Case Study on the Urban Renewal Design of Roma Termini Railway Station. Architecture 2019, 1, 100–105. [Google Scholar]
  24. Kiruthiga, K.; Thirumaran, K. Visual Perception on the Architectural Elements of the Built Heritage of a Historic Temple Town: A Case Study of Kumbakonam, India. Front. Archit. Res. 2017, 6, 96–107. [Google Scholar] [CrossRef]
  25. Lamas, A.; Tabik, S.; Cruz, P.; Montes, R.; Martínez-Sevilla, Á.; Cruz, T.; Herrera, F. MonuMAI: Dataset, Deep Learning Pipeline and Citizen Science Based App for Monumental Heritage Taxonomy and Classification. Neurocomputing 2021, 420, 266–280. [Google Scholar] [CrossRef]
  26. Zhang, F.; Zhou, B.; Liu, L.; Liu, Y.; Fung, H.H.; Lin, H.; Ratti, C. Measuring Human Perceptions of a Large-Scale Urban Region Using Machine Learning. Landsc. Urban Plan. 2018, 180, 148–160. [Google Scholar] [CrossRef]
  27. Chen, J.; Stouffs, R.; Biljecki, F. Hierarchical (Multi-Label) Architectural Image Recognition and Classification. In Proceedings of the 26th International Conference of the Association for Computer-Aided Architectural Design Research in Asia (CAADRIA) 2021, Hong Kong, China, 29 March–1 April 2021; pp. 161–170. [Google Scholar]
  28. Dai, M.; Ward, W.O.C.; Meyers, G.; Densley Tingley, D.; Mayfield, M. Residential Building Facade Segmentation in the Urban Environment. Build. Environ. 2021, 199, 107921. [Google Scholar] [CrossRef]
  29. Monna, F.; Rolland, T.; Denaire, A.; Navarro, N.; Granjon, L.; Barbé, R.; Chateau-Smith, C. Deep Learning to Detect Built Cultural Heritage from Satellite Imagery—Spatial Distribution and Size of Vernacular Houses in Sumba, Indonesia. J. Cult. Herit. 2021, 52, 171–183. [Google Scholar] [CrossRef]
  30. Cohen, J.P.; Ding, W.; Kuhlman, C.; Chen, A.; Di, L. Rapid Building Detection Using Machine Learning. Appl. Intell. 2016, 45, 443–457. [Google Scholar] [CrossRef]
  31. Sun, C.; Zhou, Y.; Han, Y. Automatic Generation of Architecture Facade for Historical Urban Renovation Using Generative Adversarial Network. Build. Environ. 2022, 212, 108781. [Google Scholar] [CrossRef]
  32. Zhang, J.; Fukuda, T.; Yabuki, N. Development of a City-Scale Approach for Façade Color Measurement with Building Functional Classification Using Deep Learning and Street View Images. ISPRS Int. J. Geo-Inf. 2021, 10, 551. [Google Scholar] [CrossRef]
  33. Zhang, L.; Song, M.; Liu, X.; Sun, L.; Chen, C.; Bu, J. Recognizing Architecture Styles by Hierarchical Sparse Coding of Blocklets. Inf. Sci. 2014, 254, 141–154. [Google Scholar] [CrossRef]
  34. Hoffmann, E.J.; Wang, Y.; Werner, M.; Kang, J.; Zhu, X.X. Model Fusion for Building Type Classification from Aerial and Street View Images. Remote Sens. 2019, 11, 1259. [Google Scholar] [CrossRef]
  35. Luo, J.; Zhao, T.; Cao, L.; Biljecki, F. Semantic Riverscapes: Perception and Evaluation of Linear Landscapes from Oblique Imagery Using Computer Vision. Landsc. Urban Plan. 2022, 228, 104569. [Google Scholar] [CrossRef]
  36. Kang, J.; Körner, M.; Wang, Y.; Taubenböck, H.; Zhu, X.X. Building Instance Classification Using Street View Images. ISPRS J. Photogramm. Remote Sens. 2018, 145, 44–59. [Google Scholar] [CrossRef]
  37. Kumar, P.; Ofli, F.; Imran, M.; Castillo, C. Detection of Disaster-Affected Cultural Heritage Sites from Social Media Images Using Deep Learning Techniques. J. Comput. Cult. Herit. 2020, 13, 1–31. [Google Scholar] [CrossRef]
  38. Llamas, J.; Lerones, P.M.; Zalama, E.; Gómez-García-Bermejo, J. Applying Deep Learning Techniques to Cultural Heritage Images within the INCEPTION Project. In Proceedings of the Digital Heritage. Progress in Cultural Heritage: Documentation, Preservation, and Protection, Nicosia, Cyprus, 31 October–5 November 2016; Springer International Publishing: Cham, Switzerland, 2016; pp. 25–32. [Google Scholar]
  39. Fiorucci, M.; Khoroshiltseva, M.; Pontil, M.; Traviglia, A.; Del Bue, A.; James, S. Machine Learning for Cultural Heritage: A Survey. Pattern Recognit. Lett. 2020, 133, 102–108. [Google Scholar] [CrossRef]
  40. Llamas, J.; Lerones, P.M.; Medina, R.; Zalama, E.; Gómez-García-Bermejo, J. Classification of Architectural Heritage Images Using Deep Learning Techniques. Appl. Sci. 2017, 7, 992. [Google Scholar] [CrossRef]
  41. Payntar, N.D.; Hsiao, W.-L.; Covey, R.A.; Grauman, K. Learning Patterns of Tourist Movement and Photography from Geotagged Photos at Archaeological Heritage Sites in Cuzco, Peru. Tour. Manag. 2021, 82, 104165. [Google Scholar] [CrossRef]
  42. Ma, K.; Wang, B.; Li, Y.; Zhang, J. Image Retrieval for Local Architectural Heritage Recommendation Based on Deep Hashing. Buildings 2022, 12, 809. [Google Scholar] [CrossRef]
  43. Ergün Hatir, M.; İnce, İ. Lithology Mapping of Stone Heritage via State-of-the-Art Computer Vision. J. Build. Eng. 2021, 34, 101921. [Google Scholar] [CrossRef]
  44. Dang, A.; Liang, Y.; Chen, M.; Wu, G. Research Progress and Trend of Information Technology Methods for the Conservation of Historic Cities. China Anc. City 2021, 35, 33–37. [Google Scholar] [CrossRef]
  45. Cui, W.; Hu, Y.; Wang, Z. Typology and Geographic Distribution Characteristics of Chinese Eastern Railway Heritages. Econ. Geogr. 2016, 36, 173–180. [Google Scholar] [CrossRef]
  46. Wang, F.; Zhao, Z.; Tao, G. Research on Survey Methods and Strategies of the Chinese Eastern Railway Groups: Case Study of the Comprehensive Conservation Plan of the Chinese Eastern Railway (Heilongjiang Section). In Proceedings of the Annual National Planning Conference 2018, Huangzhou, China, 24–26 November 2018; pp. 906–915. [Google Scholar]
  47. Liu, D.; Bian, B.; Li, Q. Architectural Cultural Heritage of Chinese Eastern Railway; Harbin Institute of Technology Press: Harbin, China, 2020; ISBN 978-7-5603-8520-4. [Google Scholar]
  48. Japkowicz, N.; Stephen, S. The Class Imbalance Problem: A Systematic Study. Intell. Data Anal. 2002, 6, 429–449. [Google Scholar] [CrossRef]
  49. Huang, G.; Liu, Z.; van der Maaten, L.; Weinberger, K.Q. Densely Connected Convolutional Networks. In Proceedings of the IEEE Conference on Computer Vision and Pattern Recognition 2017, Honolulu, HI, USA, 21–26 July 2017; pp. 4700–4708. [Google Scholar]
  50. Tao, Y.; Xu, M.; Lu, Z.; Zhong, Y. DenseNet-Based Depth-Width Double Reinforced Deep Learning Neural Network for High-Resolution Remote Sensing Image Per-Pixel Classification. Remote Sens. 2018, 10, 779. [Google Scholar] [CrossRef]
  51. Shi, Z.; Hao, H.; Zhao, M.; Feng, Y.; He, L.; Wang, Y.; Suzuki, K. A Deep CNN Based Transfer Learning Method for False Positive Reduction. Multimed. Tools Appl. 2019, 78, 1017–1033. [Google Scholar] [CrossRef]
  52. Hussain, M.; Bird, J.J.; Faria, D.R. A Study on CNN Transfer Learning for Image Classification. In Proceedings of the Advances in Computational Intelligence Systems, Savannah, GA, USA; Springer International Publishing: Cham, Switzerland, 2019; pp. 191–202. [Google Scholar]
  53. Hu, J.; Shen, L.; Sun, G. Squeeze-and-Excitation Networks. In Proceedings of the IEEE Conference on Computer Vision and Pattern Recognition 2018, Salt Lake City, UT, USA, 18–23 June 2018; pp. 7132–7141. [Google Scholar]
  54. Tong, W.; Chen, W.; Han, W.; Li, X.; Wang, L. Channel-Attention-Based DenseNet Network for Remote Sensing Image Scene Classification. IEEE J. Sel. Top. Appl. Earth Obs. Remote Sens. 2020, 13, 4121–4132. [Google Scholar] [CrossRef]
  55. Sun, M.; Zhang, F.; Duarte, F.; Ratti, C. Understanding Architecture Age and Style through Deep Learning. Cities 2022, 128, 103787. [Google Scholar] [CrossRef]
  56. Van der Maaten, L.; Hinton, G. Visualizing Data Using T-SNE. J. Mach. Learn. Res. 2008, 9, 2579–2605. [Google Scholar]
  57. Frey, B.J.; Dueck, D. Clustering by Passing Messages between Data Points. Science 2007, 315, 972–976. [Google Scholar] [CrossRef]
  58. Oliveira, M.; Gama, J. A framework to monitor clusters evolution applied to economy and finance problems. Intell. Data Anal. 2012, 16, 93–111. [Google Scholar] [CrossRef]
  59. Cardoso, M.G.M.S.; de Carvalho, A.P. de L.F. Quality indices for (practical) clustering evaluation. Intell. Data Anal. 2009, 13, 725–740. [Google Scholar] [CrossRef]
  60. Li, K.; Cao, X.; Ge, X.; Wang, F.; Lu, X.; Shi, M.; Yin, R.; Mi, Z.; Chang, S. Meta-Heuristic Optimization-Based Two-Stage Residential Load Pattern Clustering Approach Considering Intra-Cluster Compactness and Inter-Cluster Separation. IEEE Trans. Ind. Appl. 2020, 56, 3375–3384. [Google Scholar] [CrossRef]
  61. Deng, N.; Li, X. (Robert) Feeling a Destination through the “Right” Photos: A Machine Learning Model for DMOs’ Photo Selection. Tour. Manag. 2018, 65, 267–278. [Google Scholar] [CrossRef]
  62. Wang, H.; Zheng, X.; Yuan, T. Overview of Researches Based on DMSP/OLS Nighttime Light Data. Prog. Geogr. 2012, 31, 11–19. [Google Scholar]
  63. Xian, M.; Xu, F.; Cheng, H.D.; Zhang, Y.; Ding, J. EISeg: Effective Interactive Segmentation. In Proceedings of the 2016 23rd International Conference on Pattern Recognition (ICPR), Cancun, Mexico, 4–8 December 2016; pp. 1982–1987. [Google Scholar]
  64. Gadde, R.; Marlet, R.; Paragios, N. Learning Grammars for Architecture-Specific Facade Parsing. Int. J. Comput. Vis. 2016, 117, 290–316. [Google Scholar] [CrossRef]
  65. LIU, H.; ZHANG, J.; ZHU, J.; HOI, S.C.H. Deepfacade: A Deep Learning Approach to Facade Parsing. In Proceedings of the 26th International Joint Conference on Artificial Intelligence, IJCAI 2017, Melbourne, Australia, 19–25 August 2017; pp. 2301–2307. [Google Scholar] [CrossRef]
  66. Selvaraju, R.R.; Cogswell, M.; Das, A.; Vedantam, R.; Parikh, D.; Batra, D. Grad-CAM: Visual Explanations from Deep Networks via Gradient-Based Localization. In Proceedings of the IEEE International Conference on Computer Vision, Cambridge, MA, USA, 22–29 October 2017; pp. 618–626. [Google Scholar]
  67. Leng, Z.; Tan, M.; Liu, C.; Cubuk, E.D.; Shi, X.; Cheng, S.; Anguelov, D. PolyLoss: A Polynomial Expansion Perspective of Classification Loss Functions. arXiv 2022, arXiv:2204.12511. [Google Scholar]
  68. Llugsi, R.; Yacoubi, S.E.; Fontaine, A.; Lupera, P. Comparison between Adam, AdaMax and Adam W Optimizers to Implement a Weather Forecast Based on Neural Networks for the Andean City of Quito. In Proceedings of the 2021 IEEE Fifth Ecuador Technical Chapters Meeting (ETCM), Cuenca, Ecuador, 12–15 October 2021; pp. 1–6. [Google Scholar]
  69. Zhang, L.; Zhao, Z. Study on Characteristics of Typical Units of Middle East Railway Complex in Harbin (Jurisdictions), Heilongjiang Province, in Perspective of Type Differentiation. Urban. Archit. 2018, 32, 13–20. [Google Scholar] [CrossRef]
  70. Zhang, B.; Zhao, Z.; Li, P.; Wang, Q.; Zhang, X. Study on the Earlier Town’s Planning under the Application of Spatial Syntax: Taking the Secondary Station-Located Towns as an Example. Urban Dev. Stud. 2018, 25, 128–133. [Google Scholar]
  71. Lee, S.; Maisonneuve, N.; Crandall, D.; Efros, A.A.; Sivic, J. Linking Past to Present: Discovering Style in Two Centuries of Architecture. In Proceedings of the IEEE International Conference on Computational Photography, Houston, TX, USA, 24 April 2015. [Google Scholar]
  72. Glatolenkova, E.V. Railway Architecture Along the Chinese Eastern Railway at the Beginning of the 20th Century. In Proceedings of the IOP Conference Series: Materials Science and Engineering, Russky Island, Russia, 6–9 October 2020; IOP Publishing: Bristol, UK, 2021; Volume 1079, p. 042003. [Google Scholar]
  73. Xu, Z.; Tao, D.; Zhang, Y.; Wu, J.; Tsoi, A.C. Architectural Style Classification Using Multinomial Latent Logistic Regression. In Proceedings of the Computer Vision—ECCV 2014, Zurich, Switzerland, 6–12 September 2014; Springer International Publishing: Cham, Switzerland, 2014; pp. 600–615. [Google Scholar]
  74. Zhang, H.; Zhao, Z. Collaborative Conservation Framework of Historic Urban Landscape for Territorial Resources Total Elements and Total Space-Time Governance—Taking Mudanjiang, a Town along the Chinese Eastern Railway, as an Example. Chin. Landsc. Archit. 2022, 38, 68–73. [Google Scholar] [CrossRef]
  75. Perez, H.; Tah, J.H.M.; Mosavi, A. Deep Learning for Detecting Building Defects Using Convolutional Neural Networks. Sensors 2019, 19, 3556. [Google Scholar] [CrossRef] [PubMed]
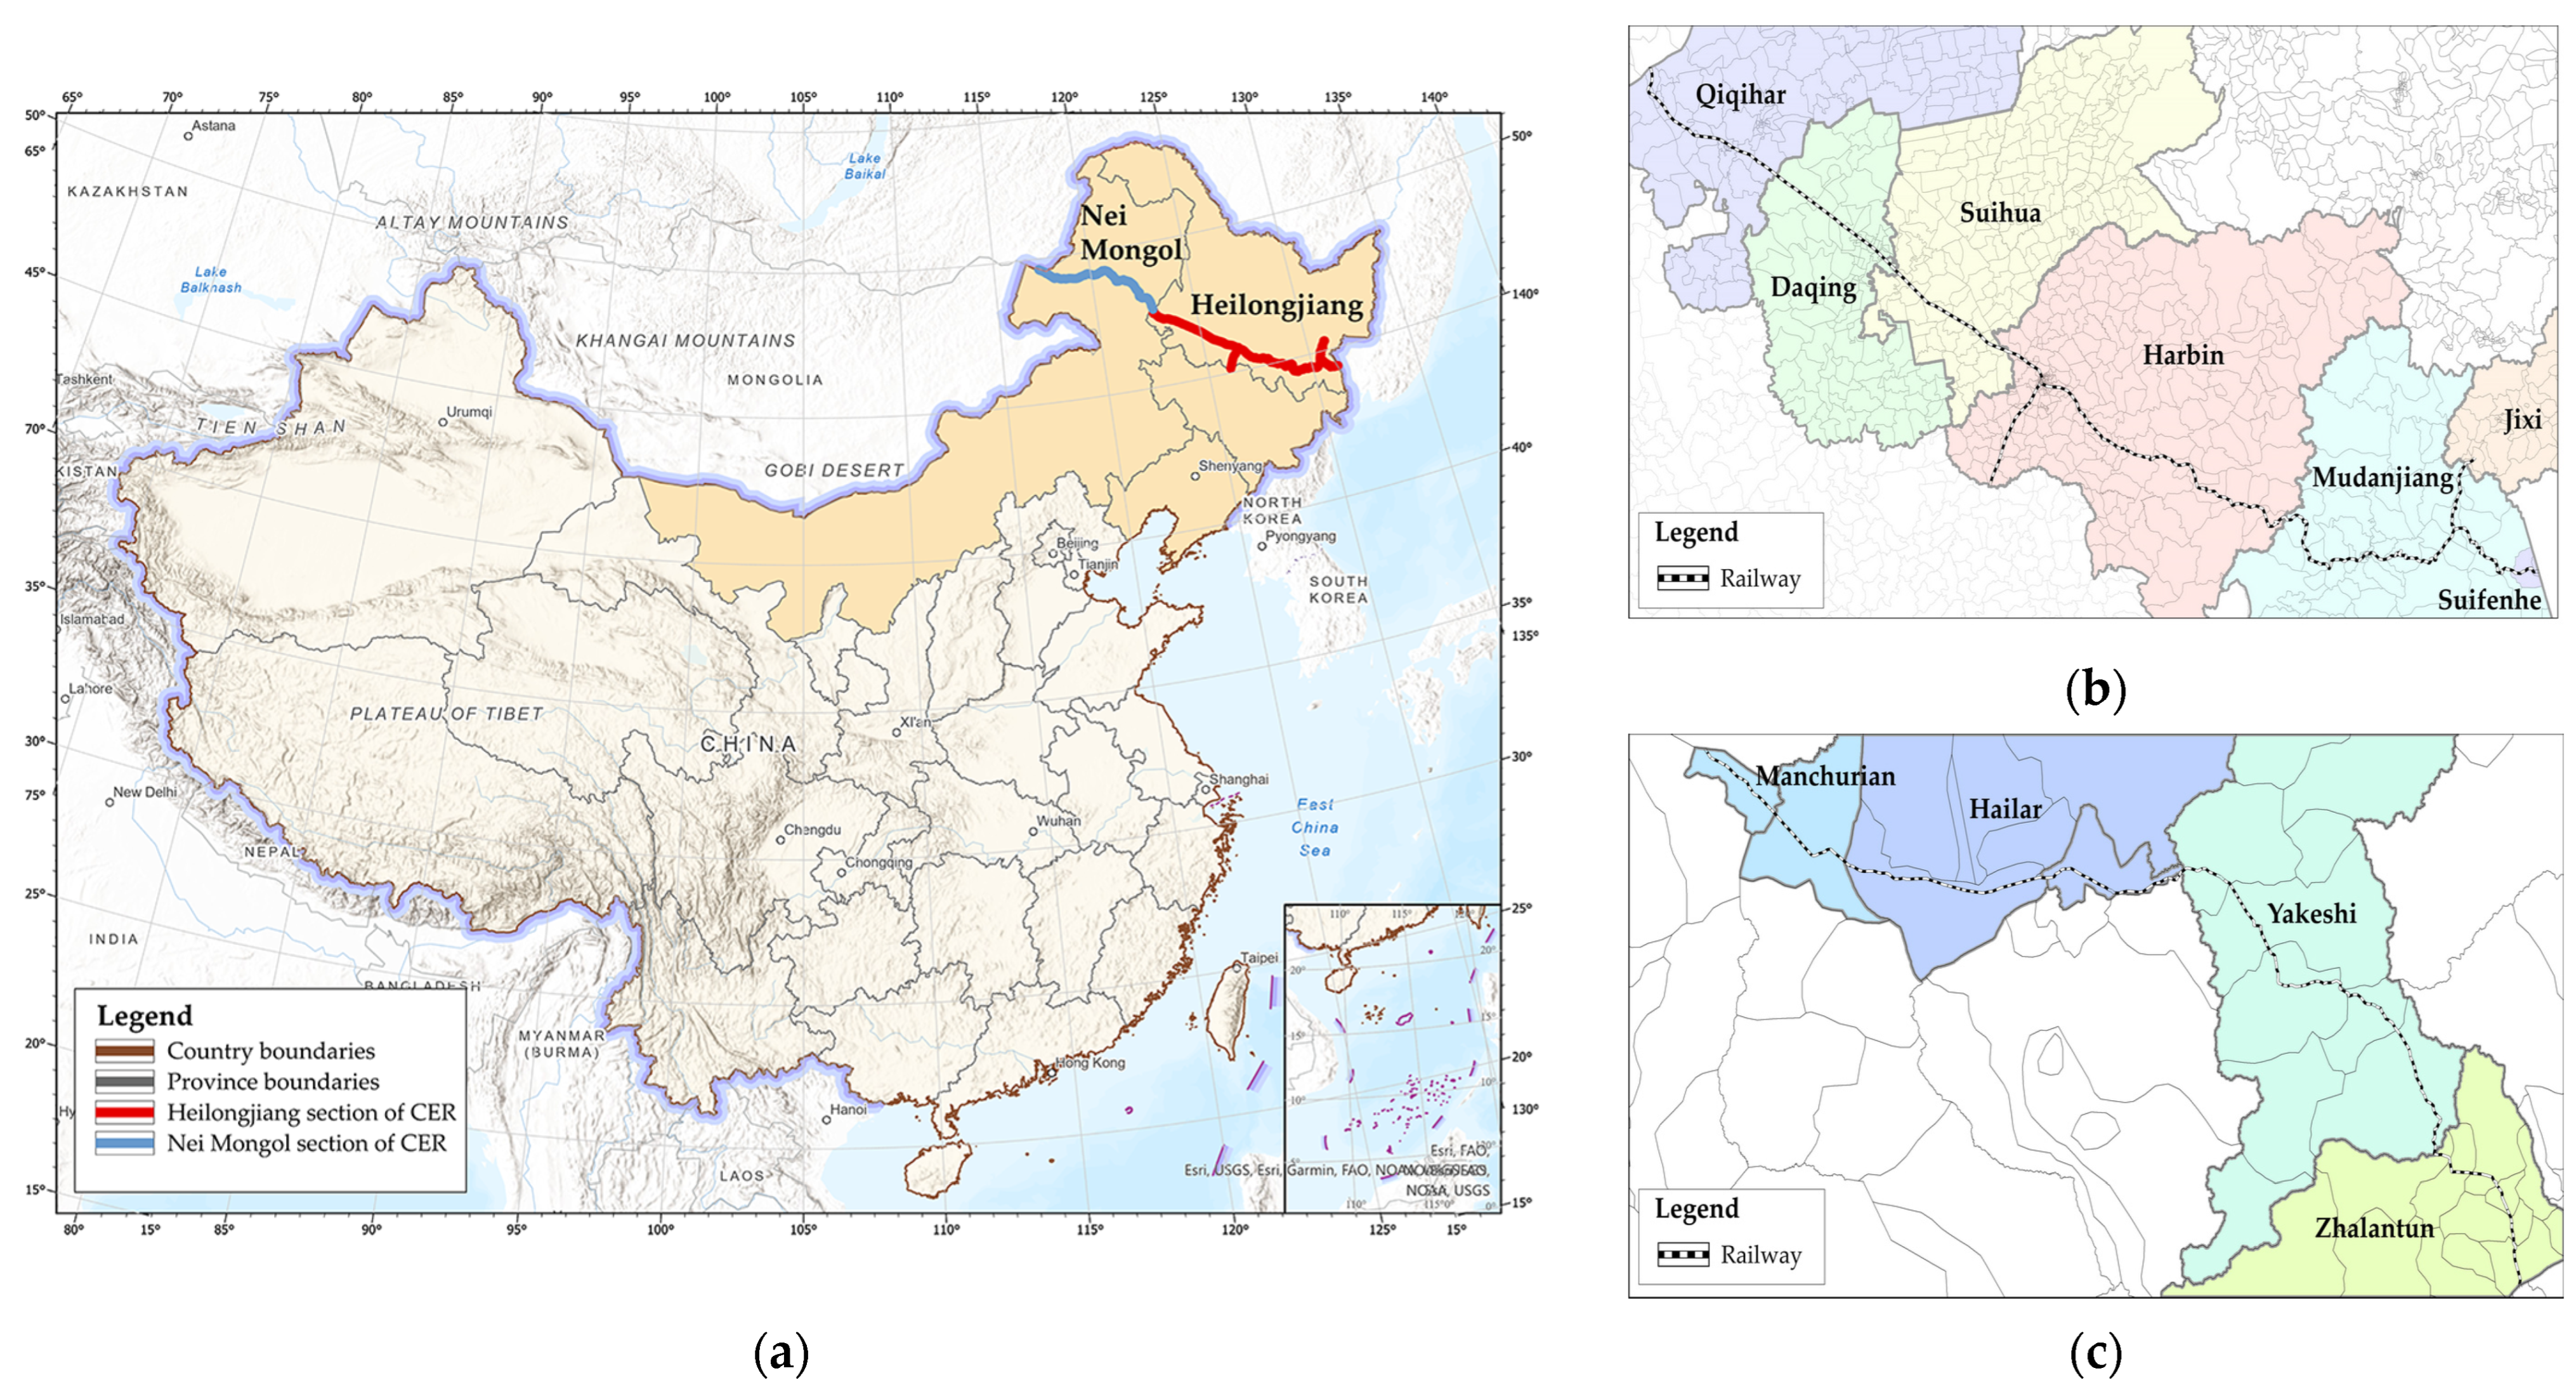
Figure 1. Location of the study area. (a) CER location; (b) Heilongjiang section route; and (c) Nei Mongol section route. The administrative boundary was extracted from the Standard Map GS(2019)1686, supervised by the Ministry of Natural Resources of the People’s Republic of China (http://bzdt.ch.mnr.gov.cn/index.html, accessed on 3 September 2023).
Sustainability 15 15857 g001
Figure 2. Platform of the picture library of historic buildings along the CER.
Sustainability 15 15857 g002
Figure 3. Overall framework of the SE-DenseNet.
Sustainability 15 15857 g003
Figure 4. Segmentation of the characteristic areas on facade elements.
Sustainability 15 15857 g004
Figure 5. Technical framework.
Sustainability 15 15857 g005
Figure 6. Process by which the SE-DenseNet model was trained on the CER dataset: (a) loss; (b) accuracy.
Sustainability 15 15857 g006
Figure 7. Urban–rural distribution differences. (a) Error spatial distribution. (b) Urban–rural functional differences.
Sustainability 15 15857 g007
Figure 8. Confusion matrix of the historic building functions.
Sustainability 15 15857 g008
Figure 9. Two-dimensional mapping of deep features predicted by the t-SNE.
Sustainability 15 15857 g009
Figure 10. Kernel density analysis of the t-SNE. (a,b) All images of the dataset. (cr) Images of each function cluster.
Sustainability 15 15857 g010
Figure 11. Example of a worker residence prototype extracted by kernel density.
Sustainability 15 15857 g011
Figure 12. Dot plot of the average expression and weighted area of the facade elements.
Sustainability 15 15857 g012
Table 1. Sample data for addresses and functions of historic buildings.
LocationIDDocument NumberHistoric FunctionCurrent FunctionCoordinates
HLJQiqiharQ-FLEJ-001230206-0013Train stationTrain station123.543169, 47.244953
HarbinH-DL-061230102-0047HospitalHospital126.613617, 45.772577
DaqingD-DM-019230624-0003Work areaResidence124.438397, 46.870988
SuihuaS-ZD-013231282-0070OfficeResidence125.990628, 46.078661
MudanjiangM-HL-103231083-0429Train garageExhibition129.069733, 44.818738
JixiJ-LS-001230305-0012ResidenceResidences130.711617, 45.062775
SuifenheSF-SFH-004231081-0004ReligionChurches131.153397, 44.390952
NMManchurianN-MCR-063150781-0088MansionResidence117.444027, 49.578333
HailarN-HLR-009UnregisteredWater towerUnoccupied120.071055, 49.191166
YakeshiN-YKS-015150782-0014Military campResidence121.902555, 48.758416
ZhalantunN-ZLT-023150783-0040SchoolSchool122.733468, 48.016591
Table 2. Samples of the dataset of the CER architectural heritage images.
CategoryExamples
Train station
(268)
Sustainability 15 15857 i001
Train garage
(26)
Sustainability 15 15857 i002
Water tower
(53)
Sustainability 15 15857 i003
Assistant
(49)
Sustainability 15 15857 i004
Work area
(690)
Sustainability 15 15857 i005
Military camp
(91)
Sustainability 15 15857 i006
Pillbox
(65)
Sustainability 15 15857 i007
Police
(38)
Sustainability 15 15857 i008
Leisure
(122)
Sustainability 15 15857 i009
Office
(652)
Sustainability 15 15857 i010
School
(161)
Sustainability 15 15857 i011
Religion
(167)
Sustainability 15 15857 i012
Business
(545)
Sustainability 15 15857 i013
Hospital
(212)
Sustainability 15 15857 i014
Mansion
(611)
Sustainability 15 15857 i015
Residence
(3320)
Sustainability 15 15857 i016
Table 3. Results comparing the models’ performances.
ModelsAccuracyPrecisionRecallF1-ScoreKappa
VGG1664.12%0.685630.428470.413240.49452
mnasNet76.93%0.758180.688490.700650.68751
ShuffleNet V278.35%0.764000.698330.72410.70299
ConvnNxt-B80.13%0.818980.721120.761230.72445
MobileNet v380.34%0.786270.704270.730680.72714
Resnet 5081.19%0.811270.71340.755840.73814
Sequencer2d-M81.33%0.833920.739040.778130.74214
EfficientNet V281.55%0.847470.738190.781920.74629
DenseNet 12183.22%0.853390.752980.787320.76778
SE-DenseNet85.84%0.883550.808560.841900.81553
Table 4. Sample prototypes of the CER architectural heritage.
CategoryExamples
Train station
(21)
Sustainability 15 15857 i017
Train garage
(26)
Sustainability 15 15857 i018
Water tower
(53)
Sustainability 15 15857 i019
Assistant
(49)
Sustainability 15 15857 i020
Work area
(690)
Sustainability 15 15857 i021
Military camp
(91)
Sustainability 15 15857 i022
Pillbox
(65)
Sustainability 15 15857 i023
Police
(38)
Sustainability 15 15857 i024
Leisure
(122)
Sustainability 15 15857 i025
Office
(652)
Sustainability 15 15857 i026
School
(161)
Sustainability 15 15857 i027
Religion
(167)
Sustainability 15 15857 i028
Business
(545)
Sustainability 15 15857 i029
Hospital
(212)
Sustainability 15 15857 i030
Mansion
(611)
Sustainability 15 15857 i031
Residence
(3320)
Sustainability 15 15857 i032
Disclaimer/Publisher’s Note: The statements, opinions and data contained in all publications are solely those of the individual author(s) and contributor(s) and not of MDPI and/or the editor(s). MDPI and/or the editor(s) disclaim responsibility for any injury to people or property resulting from any ideas, methods, instructions or products referred to in the content.