Article

Temporal and Spatial Evolution Characteristics and Influencing Factors Analysis of Green Production in China’s Dairy Industry: Based on the Perspective of Green Total Factor Productivity

School of Economics and Management, Shanghai Ocean University, Shanghai 201306, China
*
Author to whom correspondence should be addressed.
Sustainability 2023, 15(23), 16250; https://doi.org/10.3390/su152316250
Submission received: 24 September 2023 / Revised: 5 November 2023 / Accepted: 10 November 2023 / Published: 23 November 2023

Abstract

:
Accelerating the green development of the dairy industry is an important work to promote the construction of ecological civilization and ensure the safe supply of dairy products. Existing studies lack a comprehensive analysis of the green development characteristics of China’s dairy industry. Based on the input–output system, the study measured and analyzed the green total factor productivity of China’s dairy industry in 29 provinces (cities, autonomous regions, and municipalities) since the 10th Five-Year Plan period, using the super-efficiency EBM model and the GML index based on non-directional and variable scale returns. Accelerating the green development of the dairy industry is an important work to promote the construction of ecological civilization and ensure the national nutrition intake. The existing studies lack a comprehensive understanding of the green development characteristics of China’s dairy industry. Therefore, this paper constructs an input–output system, measures and analyzes the green total factor productivity of the dairy industry in 29 provinces (cities, autonomous regions and municipalities directly under the Central Government), since the “15th Five-Year Plan” period based on the non-oriented super-efficiency EBM model and GML index with variable returns to scale. On this basis, the dynamic evolution of regional differences was explored using Kernel density estimation and the Dagum Gini coefficient, and the influencing factors of green total factor productivity in China’s dairy industry were analyzed using a two-way fixed effects model. The results show that from 2001 to 2020, the green total factor productivity of China’s dairy industry showed an overall upward trend, and presented a gradient pattern of “Northeast–East–Central–West” in turn, with green technical efficiency being the main driving force for promoting green total factor productivity in China and various regions. The gap in green total factor productivity between provinces and cities is gradually narrowing, and the polarization phenomenon is weakening. Super variation density is the main source of regional differences, and the difference between the West and the East is the largest, while the difference between the Central and the Northeast is the smallest. As for the influencing factors, industry agglomeration, economic development level, and environmental planning level have a significant positive promoting effect on the green total factor productivity of China’s dairy industry, while the level of population urbanization has a significant inhibitory effect on it. In order to promote the green and sustainable development of China’s dairy industry and promote the coordinated development of regional green, it is necessary to accelerate the efficiency of green technology while promoting the innovation of green technology, accelerate the integrated development of industry and formulate relevant policies according to local conditions to promote the coordinated development of green technology between regions.

1. Introduction

Ecological progress is vital to the well-being of the people and the fundamental and long-term plan for China’s sustainable development. The Fifth Plenary Session of the 19th Central Committee of the Communist Party of China in 2021 proposed that it is necessary to deepen the supply-side structural reform of agriculture [1], further promote the green development of agriculture, and mobilize the whole party and society to accelerate the modernization of agriculture and rural areas. Since the reform and opening-up, China has been facing a situation of increasing population and decreasing arable land. Despite this, China has achieved remarkable achievements in agricultural production and development, with steadily increasing per capita grain yield and farmers’ income. As an important part of agriculture, the dairy industry bears the task of providing high-quality milk sources for the nation and meeting the growing needs of the people for a better life. However, it also faces the problems of high pollution, low productivity, regional imbalances, and insufficient innovation power, which no longer meet the requirements of high-quality development. Therefore, how to reduce pollution emissions while increasing output and achieving green development in the dairy industry is a key issue for high-quality development. Therefore, the dairy industry needs to transform and upgrade in the green direction and step into the road of green development [2].
According to assessments, China’s agricultural greenhouse gas emissions account for 17% of the country’s total greenhouse gas emissions [3], while livestock emissions account for 54.3% of agricultural greenhouse gas emissions. Livestock breeding is the largest source of CH4 emissions [4], accounting for 38.8% of national and 68.5% of agricultural CH4 emissions. The fermentation of a cow’s digestive system is recognized as an important source of agricultural greenhouse gas emissions. In the future, with the comprehensive implementation of the dairy industry revitalization action, China’s fresh milk production will steadily increase, and the proportion of large-scale farming will continue to grow. On the one hand, the operation mode of “high input, high consumption and high pollution” in dairy farming in China leads to excessive carbon emissions in some areas and damages the ecological environment. On the other hand, China has a vast territory, and there are differences in economic and technological development levels, resource endowment and culture among different provinces, leading to obvious provincial disparities in the green development of the dairy industry [5]. In this context, how to accelerate the green and coordinated development of the dairy industry has become an important topic of concern for academic circles and decision-making departments [6]. Therefore, this paper calculates the green development characteristics and influencing factors of China’s dairy industry in various provinces through green total factor productivity, which has important practical significance for the realization of high-quality sustainable development in China’s dairy industry.
This article takes 29 provinces in China (excluding Hainan, Jiangxi, Hong Kong, Macao, and Taiwan due to incomplete data) as the research objects and calculates the total factor productivity of the dairy industry under the environmental constraints of carbon emissions and pollutant emissions, namely the green total factor productivity of the dairy industry. Using methods such as Kernel density estimation and Dagum Gini coefficient, the article systematically analyzes the growth trend and regional differences in China’s green total factor productivity of the dairy industry to study the level of green production in China’s dairy industry, and analyzes its influencing factors through a two-way fixed-effects model [7].

2. Review of Green Total Factor Productivity Assessment Research

Green Total Factor Productivity (GTFP) is a new type of total factor productivity index that considers the impact of energy consumption and pollutant emissions on economic growth in addition to the traditional total factor productivity. Therefore, GTFP can better measure the quality of economic development while also reflecting the requirements of green development and ecological civilization construction [8]. Existing research on green production efficiency assessment is abundant, but there is relatively little research on the measurement and spatio-temporal evolution characteristics of green total factor productivity in the dairy industry, and even less research specifically focused on green production in the dairy industry. The research mainly focuses on three aspects: First, it focuses on the calculation and analysis of carbon emissions. Many scholars have calculated the overall carbon emissions of the industry for different livestock and poultry species from a national perspective, and believe that there are spatial differences in carbon emissions in China’s livestock industry [9,10,11]. Some scholars have conducted research based on provincial or specific regions [12,13,14]. Second, it focuses on the calculation and analysis of green total factor productivity. Yi Qing et al. [14] combined the generalized Malmquist index and stochastic frontier production function, introduced environmental factors, and set livestock and poultry pollutant emissions as input variables to study changes in total factor productivity and their contribution components. Zou Jie et al. [15] used the non-radial non-oriented output SBM model, with the carbon emissions of livestock and poultry as the non-oriented output, to calculate and analyze the environmental efficiency and influencing factors of China’s livestock industry, and believe that there are spatial differences in China’s livestock industry environmental efficiency. Xu Biaowen et al. [16] used the integrated directional distance function and Luenberger productivity indicator (LPI) to analyze changes in China’s green total factor productivity of the livestock industry and regional differences, with carbon emissions from livestock and poultry as the non-oriented output. Third, it focuses on the calculation and analysis of green total factor productivity for specific livestock species. Cui Zhang [17] included greenhouse gas emissions from herbivorous livestock in the total factor productivity research system and used the super slacks-based measure (SSBM) model and GML index method to calculate the total factor productivity of China’s herbivorous livestock. Du Hongmei et al. [18] used the non-radial, non-angle-based directional distance function and the Malmquist–Luenberger productivity index to calculate the growth of green total factor productivity for different scales of pig farming in 17 major pig-producing provinces in China. Zhu Ning et al. [19] used the slacks-based measure (SBM) model and Malmquist–Luenberger productivity index to analyze the environmental total factor productivity and environmental efficiency of different scales of egg-laying farms, with pollutants from egg-laying farms as the non-oriented output. Existing research on the dairy industry mainly focuses on two aspects: First, it focuses on the calculation and analysis of carbon emissions from the national, provincial, or local dairy industry, such as Wang Xiaoqin et al. [20], who evaluated the system greenhouse gas emissions of a large-scale dairy farm in Xi’an based on the life cycle theory. Huang Wenqiang et al. [21] evaluated the carbon footprint of milk production in a large-scale dairy farm in Dongying, Shandong Province in 2013. Second, it only considers the production situation of the dairy industry, such as Li Junru et al. [22], who measured the technical progress rate and spatio-temporal differentiation characteristics of different scales of dairy farming based on cost–benefit data from 2010 to 2018.
In view of this, compared with previous studies, the possible contributions of this paper are as follows: First, in terms of research methods, the radial DEA model requires input–output to increase in the same proportion, which is different from the actual situation. The non-radial SBM model will lose the original ratio between the target value of input–output and the actual value on the effective front surface, which may lead to the problem of efficiency measurement bias. Instead, the non-oriented super-efficiency epsilon-based measure (EBM) model with variable returns to scale also takes into account the radial ratio between the target value and the actual value of input–output and the non-radial relaxation variables of each input–output, which can effectively make up for the shortcomings of the above two models. Second, in terms of research content, this paper not only considers the production situation of the dairy industry, but also calculates the green total factor productivity level of the dairy industry from the perspective of the whole industry chain, and explores its spatio-temporal evolution characteristics through Dagum Gini coefficient and Kernel density estimation method, so as to analyze and discuss the green production situation of China’s dairy industry. Five factors affecting the green total factor productivity of the dairy industry were analyzed in order to provide a reference for promoting the green coordinated development of the dairy industry in China.

3. Calculation and Analysis of Green Total Factor Productivity

3.1. Selection of Basic Data Sources and Variables

The time range of carbon emission source data selected in this paper is from 2001 to 2020, with a total span of 20 years. It mainly involves three types of indicators: input, desired output and undesirable output. The descriptive statistics of each variable are shown in Table 1. Based on the perspective of the whole industry chain, this paper divides the dairy industry into two parts: feed planting and dairy feeding [23]. The energy consumption, gastrointestinal fermentation and fecal excretion of dairy cows will all produce carbon emissions. Therefore, the statistics of variables in this paper include the consumption of feed crops such as corn, wheat and soybean, the number of dairy cattle, the use of electricity and coal for feeding dairy cows, the quality of excreta, and the output value of dairy products. The data come from the China Rural Statistical Yearbook, China Agricultural Product Cost–Benefit Resources Compilation, China Energy Statistical Yearbook, China Statistical Yearbook [24] and other existing studies. Considering the availability and consistency of data, the study excludes the data from five regions: Hainan, Jiangxi, Hong Kong, Macao and Taiwan.
(1)
Expected input: Referring to Chen Yao et al. [23], assets, energy and agricultural resources are selected as the proxy variables of expected input. The investment of assets includes four items: medical and epidemic prevention fee, tool and material purchase fee, repair and maintenance fee and fixed asset fee. Energy input includes electricity input and coal input; agricultural resource input is the amount of feed grain consumption.
(2)
Expected output: In this paper, dairy output is selected as the proxy variable of expected output, so as to reflect the total value of economic activities in the dairy industry within a year.
(3)
Undesirable output: The negative impact of dairy farming on the environment is mainly caused by pollutants such as manure and greenhouse gas emissions. The carbon emissions of the dairy industry refer to the calculation methods of Bai Mei [25], Wang Xiaoqin [20], and Li Ting-yu [26] et al., based on the life cycle method from the perspective of the whole industrial chain [27], and methane and nitrous oxide are converted into carbon dioxide equivalent according to the greenhouse benefit potential (GWP) coefficient. The types of pollutants in the dairy industry mainly include three harmful substances, namely chemical oxygen demand (COD), total nitrogen (TN) and total phosphorus (TP).

3.2. Model Selection

3.2.1. Super-Efficiency EBM Model

The Data Envelopment Analysis (DEA) model is a common method to measure efficiency. Among them, Tone et al. [28] proposed a hybrid radial model with both radial and non-radial distance functions, namely the EBM model, aiming at the radial problem between input and output of the traditional DEA model. Based on this, this paper takes the EBM model as the basis and sets super efficiency and non-orientation, as shown in Equation [28] below.
γ * = min θ ε i = 1 m ϖ i s i x i o ϕ + ε + 1 r = 1 s W r + r = 1 q ϖ r + s r + y r o + ε + p = 1 q ϖ p b s p b b p o
s . t . j = 1 n x i j λ j θ x i o + s i = 0
j = 1 n y r j λ j ϕ y r o s r + = 0
j = 1 n b p j λ j ϕ b p + s p = 0
λ j 0 , s i 0 , s r + 0 , s p b 0 , θ 1 , ϕ 1
In Equation (1), γ* represents the comprehensive efficiency value, which satisfies 0 ≤ γ* ≤ 1; θ represents the mirror efficiency value; xio, yro and bpo represent the original data of input, output and undesired output factors, respectively; λ represents the relative weight of input factors; si—represents the slack variable of the ith input factor which is non-radial; wi—represents the weight of the ith input factor, which is satisfied i = 1 m w i = 1 ; εx is the key parameter combining radial and non-radial relaxation vectors, and 0 ≤ εx ≤ 1; ωi, ωr+ and ωpb represent the weights of input factors in i, expected output in r and non-expected output in p, respectively; si, sr+, and spb− denote the slack variables of the ith input, the RTH output, and the PTH desired output, respectively.

3.2.2. Global Malmquist–Luenberger Index

Since the EBM model’s measurement of green TFP is a static measure, it cannot reflect its dynamic changes. Therefore, based on the EBM model of super efficiency, this paper introduces the GML index (Global Malmquist–Luenberger), and the formula is [29]:
G M L t , t + 1 ( x t , y t , b t , x t + 1 , y t + 1 , b t + 1 ) = 1 + D t ( x t , y t , b t ) 1 + D t + 1 ( x t + 1 , y t + 1 , b t + 1 )
GML index is the index of GTFP, reflecting the growth rate of green TFP. It can be further decomposed into two parts: green technological change (GTC) and green efficiency change (GEC), namely, GTFP = GTC × GEC. The formula is:
= 1 + D t ( x t , y t , b t ) 1 + D t + 1 ( x t + 1 , y t + 1 , b t + 1 ) × 1 + D G ( x t , y t , b t ) 1 + D t ( x t , y t , b t ) × 1 + D t + 1 ( x t + 1 , y t + 1 , b t + 1 ) 1 + D G ( x t + 1 , y t + 1 , b t + 1 )
= G E C t , t + 1 × G T C t , t + 1
In Equation (4), x, y and b represent input, desired output and undesired output, respectively. When GML > 1, it indicates that green TFP has increased, and when GML < 1, it indicates that green TFP has decreased. When GEC and GTC > 1 or (<), it indicates the improvement (deterioration) of GTFP and the progress (regression) of GTFP, respectively.

3.2.3. Dagum Gini Coefficient and Its Decomposition

In this paper, the Dagum Gini coefficient is used to measure the regional differences in green TFP of China’s dairy industry. The larger the Gini coefficient is an upgrade of the traditional Gini coefficient, which can be decomposed into intra-group coefficient, component coefficient and hypervariable density coefficient, respectively, reflecting the gap within and between regions, as well as the cross-overlapping phenomenon of regions, and reflecting the relative gap. The more unbalanced the development of green TFP in the dairy industry among regions is, this methods makes up for the deficiency that other methods used to measure the regional gap cannot solve the phenomenon of overlapping inspection data. According to the Gini coefficient definition, the formula is [30]:
G i n i = j = 1 k h = 1 k i = 1 n j r = 1 n k y j i y h r 2 n 2 μ , μ h μ j μ k
where k represents the number of regions, the number of provinces when n, μ represents the average value of green TFP of each province, yji(yhr) represents the green TFP of the dairy industry of each province in the region, nj(nh) represents the number of provinces in the region, and the Gini coefficient Gjj of region j is the formula of Gini coefficient Gjh between region j and region h:
G j j = i = 1 n j r = 1 n j y j i y h r 2 n 2 μ j
G jh = i = 1 n j r = 1 n h y j i y h r n j n h ( μ j + μ h )
According to the Gini coefficient decomposition method [31], Gini coefficient Gini can be decomposed into three parts: intra-regional difference contribution Gw, inter-regional net difference contribution Gnb and hypervariable density contribution Gt, and the relationship between them satisfies Gini = Gw + Gnb + Gt. The intensity of trans variation refers to the regional imbalance caused by the overlap between regions [32], and the formula is:
G w = j = 1 k G j j n j n n j y ¯ i n y ¯
G nb = i = 2 n j h = 1 j 1 G j h ( n j n n h y ¯ h n y ¯ + n h n n j y ¯ j n y ¯ ) D j h
G t = j = 2 k h = 1 j 1 ( 1 D j h ) G j h ( n j n n h y ¯ h n y ¯ + n h n n j y ¯ j n y ¯ )
Djh represents the relative impact of GTFP growth of the dairy industry between regions j and h; djh represents the difference of green TFP growth of the dairy industry between regions, that is, the mathematical expectation of the sum of all sample values of yjiyhr > 0 in region j and h; pjh represents the mathematical expectation of the sum of all sample values of yjiyhr < 0 in region j and h. The formula is:
D jh = d jh p j h d j h + p j h
d j h = 0 d F j ( y ) 0 y ( y x ) d F h ( x )
p j h = 0 F h ( y ) 0 y ( y x ) d F j ( x )

3.2.4. Kernel Density Estimation Function

Kernel density estimation is a method based on the Kernel function to determine the distribution form of the probability density of random variables by using smooth estimation. The advantage of this method is that it does not need to make any distribution assumption on the data, and can be applied to any dimension of data. It is widely used in spatial unbalanced distribution by many scholars. Therefore, this paper uses the kernel density function to study the evolution of regional differences in green TFP of the dairy cow industry. The formula is [30]
f ( x ) = 1 N h i = 1 N K ( X i x h )
In Formula (13), K(*) is the kernel density function, N represents the number of observations and h represents the green TFP of the dairy industry in each region; Xi represents the observations with independent distribution and x is the mean value.

4. Analysis of GTFP Development Characteristics of Chinese Dairy Industry

4.1. Analysis of the Temporal Evolution Characteristics of GTFP in the Chinese Dairy Industry

Based on the provincial panel data of China’s dairy cow industry from 2001 to 2020, using MAXDEA 8.22 software, this paper selects the super efficiency, non-directed EBM model and GML index to calculate the green TFP and its decomposition items of 29 provinces (municipalities, autonomous regions and municipalities directly under the Central Government) of China’s dairy industry.
It can be seen from Table 2 that the overall GTFP of China’s dairy industry fluctuates around “1” from 2001 to 2020. This indicates that the overall GTFP of China’s dairy industry is in an upward development trend. Figure 1: From 2001 to 2020, the overall development of the green technical efficiency index (GEC) was relatively gentle, with an average value of 1.010 and an average annual growth rate of 1%, contributing 66.67% to the GTFP of the dairy cow industry. The development trend of GTC is roughly the same as that of GTFP, with an average value of 1.005 and an average annual growth rate of 0.5%, contributing 33.33% to GTFP in the dairy industry. It shows that green technical efficiency plays a significant role in promoting the growth of GTFP in China’s dairy industry during the sample period, and becomes the main driving force to improve the green development level of the dairy industry.
In terms of stages, this paper is divided into four stages according to the five-year plan for national economic and social development.
(1) During the “10th Five-Year Plan” period (2001–2005), the GTFP of the Chinese dairy industry showed a development trend of “slight decline-continuous rise”. The GTFP had an average annual growth rate of 2.1% at this stage. The green technology efficiency had an average annual growth rate of 1.5%, and the green technology progress had an average annual growth rate of 0.6%, both of which contributed to the growth of GTFP in the dairy industry. In the late 1990s, due to the continuous increase in grain production, there was a structural surplus ingrain supply, and the supply of feed grains increased accordingly. However, the growth rate of farmers’ income slowed down. To address this situation, the Chinese government adopted various measures, vigorously developed animal husbandry and actively promoted large-scale, standardized and industrialized breeding. At the same time, the government gradually reduced relevant taxes such as the livestock tax in China to stimulate production and promote the rapid development of the dairy industry. China also joined the WTO and opened up to the outside world, and a large number of foreign advantages resources and technologies poured into the country. The cooperation between domestic and foreign dairy enterprises indirectly promoted the green development of the Chinese dairy industry.
(2) During the “11th Five-Year Plan” period (2006–2010), the GTFP of the Chinese dairy industry experienced significant fluctuations, showing a development trend of “significant decline to significant increase then decline again”. In this stage, the GTFP of the Chinese dairy industry had an average annual growth rate of 1.6%, of which the green technology efficiency had an average annual growth rate of 1.4% and contributed 93.33% to the GTFP of the dairy industry, while the green technology progress had an average annual growth rate of 0.1% and contributed 6.67% to the GTFP of the dairy industry. This indicates that the main driving force for the growth of GTFP in the Chinese dairy industry during this period was the improvement of green technology efficiency, while the contribution of green technology progress to GTFP growth was limited. During this period, the supply and demand of grain in China became tense again, and grain prices rose sharply. To address this situation, the government began to reduce the scale of animal husbandry with high grain consumption, gradually reducing the proportion of concentrate feed in the feed mix and leading to increased fermentation in the digestive tract of dairy cows. During this period, frequent incidents of Chinese dairy product quality and safety occurred, including issues such as “melamine”. These incidents reduced consumers’ trust in Chinese dairy products and brought setbacks to the development of the Chinese dairy industry. To solve this problem, the government introduced the “Plan for the Rectification and Revitalization of the Dairy Industry” [33], strengthened the supervision of dairy product quality, and improved relevant laws and regulations. With the strong support of the government, the dairy industry gradually recovered.
(3) During the “12th Five-Year Plan” period (2011–2015), the GTFP of the Chinese dairy industry showed a development trend of “slight increase—slight decline—continuous increase”. In this stage, the GTFP of the Chinese dairy industry had an average annual growth rate of 0.3%, of which the green technology progress had an average annual decrease of 0.5%, but the green technology efficiency had an average annual growth rate of 0.8%. This offset the negative impact of the decrease in green technology progress and still drove the growth of GTFP in the Chinese dairy industry. During this stage, with the comprehensive layout and continuous improvement of relevant policies under the support of the government, the dairy industry economy resumed growth. However, factors such as low purchase prices for raw milk and low prices for imported dairy products still had an impact on the Chinese dairy industry. In 2012, the Ministry of Environmental Protection and the Ministry of Agriculture jointly issued the “12th Five-Year Plan for the Prevention and Control of Pollution in Livestock and Poultry Farming” policy, which mainly focused on the implementation of the concept of ecological civilization, and included the reduction of emissions from livestock and poultry farming into the national energy-saving and emission-reduction work system. Subsequently, relevant regulations such as the “Regulations on the Prevention and Control of Pollution from Large-scale Livestock and Poultry Farming” were introduced to strengthen the environmental protection and management of the livestock and poultry farming industry and actively guide the development of the dairy industry towards green and low carbon.
(4) During the 13th Five-Year Plan period (2016–2020), the GTFP of China’s dairy industry showed an evolution characteristic of “slight increase—slight decline—slight increase—overall steady growth,” with an average annual growth rate of 2.2%, among which the average annual growth rate of green technology efficiency was 0.3%, and the average annual growth rate of green technology progress was 1.9%. The progress of green technology and the improvement of green technology efficiency jointly promote the improvement of the green development level of the dairy industry. Since 2017, the State has vigorously promoted the process of resource utilization of livestock and poultry manure pollution. The State Council has successively issued a series of policies, such as Opinions on Accelerating the Resource Utilization of Livestock and Poultry Breeding Waste and Notice on Strengthening Environmental Supervision in the Process of Resource Utilization of Livestock and Poultry Breeding Waste [29]. It provided institutional guidance for the application of green production technology in livestock and poultry breeding in all regions of the country. In 2016–2017, the progress of green technology reached a peak of 1.098, and the GTFP of China’s dairy industry also reached the highest point during this period. It has greatly promoted the green production level of China’s dairy industry.

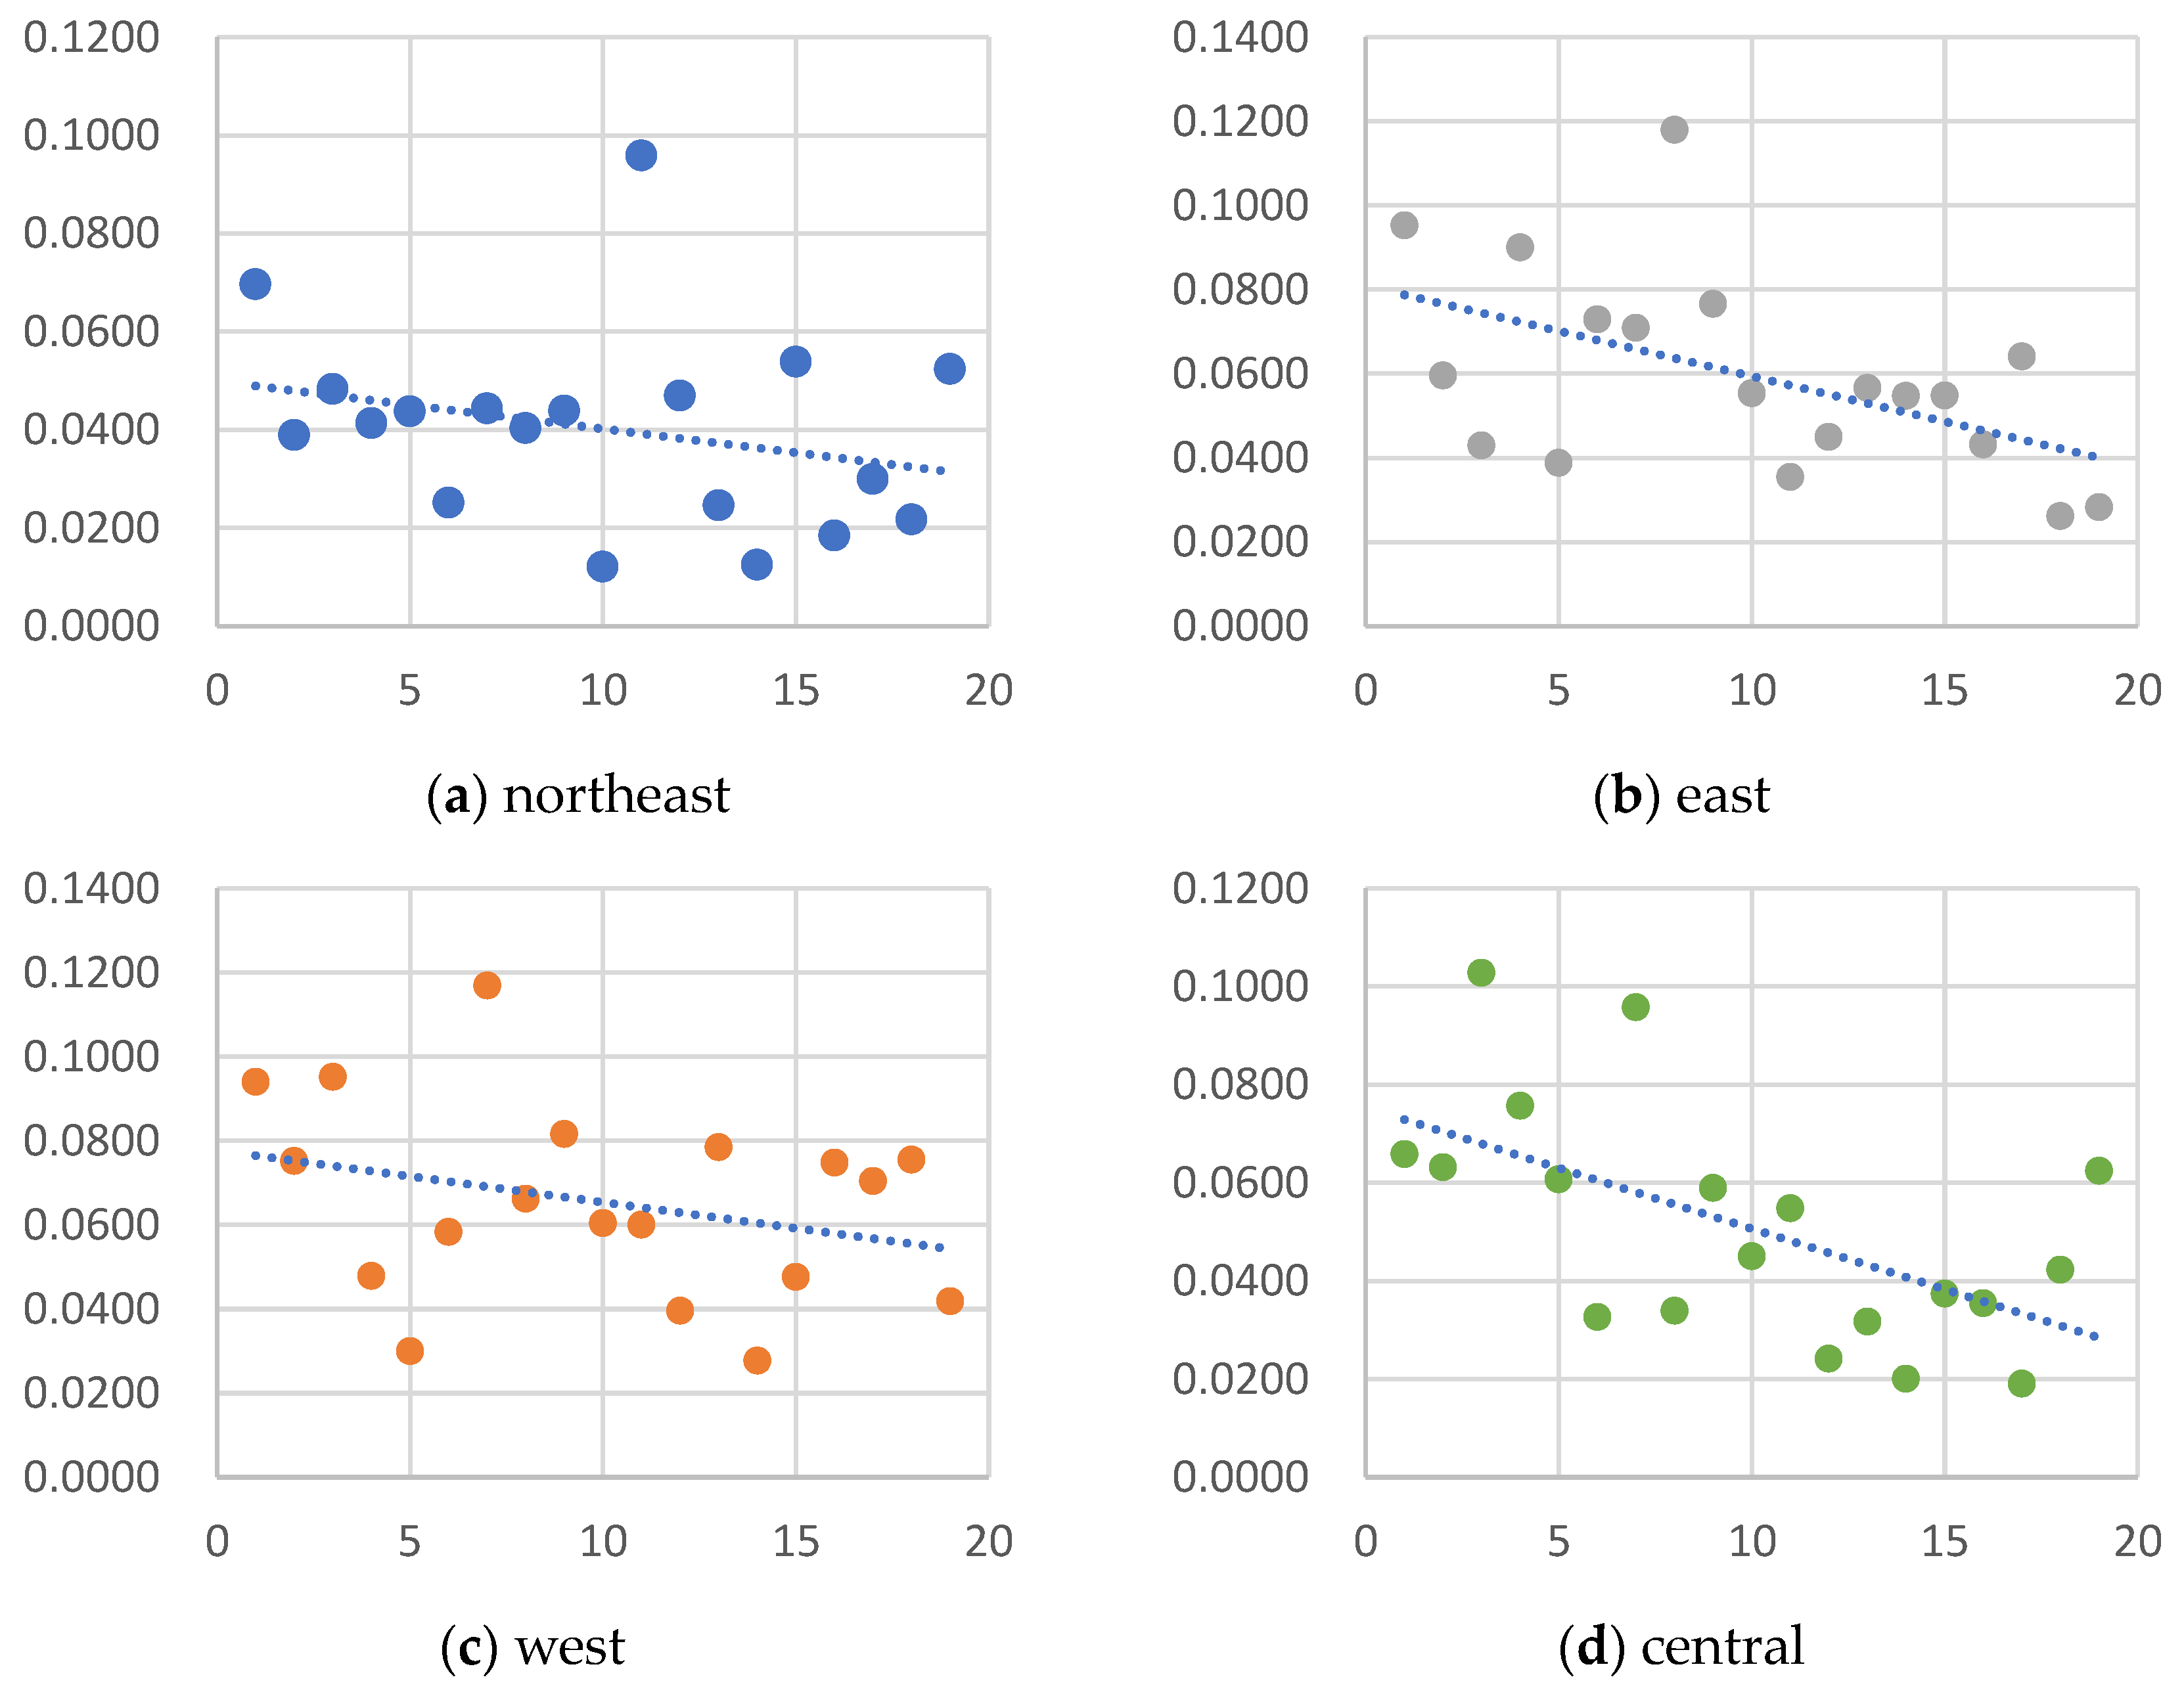
4.2. Regional Analysis of GTFP in the Chinese Dairy Industry

Considering the differences in resource endowment and socio-economic conditions among provinces and cities in China, this paper further studies the regional differences in GTFP of the dairy industry.
Table 3 shows the GTFP and its decomposition in the dairy industry in different regions. From 2001 to 2020, the changes in GTFP in China’s dairy industry exhibited spatial imbalance, with a “higher in the East and lower in the West” pattern in terms of growth rate. In terms of relative levels, the Northeast had the highest level, with a mean of 1.028 and an annual growth rate of 2.8%; followed by the East, with a mean of 1.018 and an annual growth rate of 1.8%; the Central region was in the middle, with a mean of 0.999 and an annual decrease of 0.1%; and the West had the lowest level, with a mean of 0.983 and an annual decrease of 1.7%. Compared with other regions, the Northeast is an important potential development area for China’s dairy industry with unique competitive advantages, including fertile soil, abundant grain and pasture resources, strong environmental carrying capacity, high certification of green products, and the continuous expansion of standardized scale breeding of livestock and poultry. In 2017, the Ministry of Agriculture issued the “Guiding Opinions on Accelerating the Development of Modern Animal Husbandry in the Main Grain-Producing Areas of Northeast China”, which pointed out that by 2020, significant progress should be made in the construction of modern animal husbandry in Northeast China, the industrial structure adjustment should be basically completed, and the green development model of combining planting and breeding and agricultural–pastoral circulation will be basically formed. In addition, policy and financial support for the development of modern animal husbandry in Northeast China should be strengthened, which greatly improves the level of green development in the dairy industry in the Northeast. The Eastern region has superior geographical conditions, mostly located in economically developed coastal areas, especially in provinces with policy preferences. The regulation of environmental protection and pollution control in dairy farming is active, and green production and breeding technologies are widely promoted and applied, resulting in a good level of green ecological development in the dairy industry. However, compared with the Northeast and the East, the Central and Western regions (excluding Inner Mongolia) still have relatively extensive dairy farming methods and lower capacity for treating pollutants such as manure, resulting in relatively backward green productivity in the dairy industry. There is still potential for improvement in their economic development, resource constraints and ecological protection levels, and transformation and upgrading should be accelerated.
From the decomposition of the GTFP index in each economic region, the growth of dairy GTFP in Northeast China comes from the combined effect of green technology efficiency and green technology progress. The mean value of GEC in the Eastern region is 1.017, with an average annual growth rate of 1.7%, and the mean value of GTC is 1.001, with an average annual growth rate of 0.1%. The growth of dairy GTFP in the Central region mainly comes from green technical efficiency, with an average annual growth rate of 0.2% and an average annual decline of 0.2% in green technical progress. The decrease in GTFP in the dairy industry in the Western region is the result of the combined effect of GTI and GTI, with an average annual decrease of 1.4% in GEC and 0.4% in GTC.
Further from the provincial level, the top five provinces in terms of GTFP of China’s dairy cow industry from 2001 to 2020 are Inner Mongolia (1.045), Beijing (1.043), Tianjin (1.042), Heilongjiang (1.041) and Shanghai (1.039). The next five were Gansu (0.975), Guangxi (0.968), Guizhou (0.958), Sichuan (0.956) and Tibet (0.916). From the perspective of regional differences, except for Fujian and Zhejiang, the other seven provinces in the Eastern region have achieved positive growth in milk GTFP. In Northeast China, the dairy GTFP of Heilongjiang, Liaoning and Jilin provinces all achieved positive growth. In Central China, only two provinces, Hubei and Henan, achieved GTFP growth. In the Western region, only three provinces, Inner Mongolia, Shaanxi and Chongqing, have achieved positive growth in dairy GTFP, among which Inner Mongolia’s average annual growth rate of dairy GTFP is as high as 4.5%. It can be seen that there are 15 provinces (municipalities and autonomous regions) in China with dairy GTFP greater than 1, and 51.7% of them have effective dairy GTFP, most of which are located in economically developed areas along the Eastern coast.
From the perspective of provincial decomposition items, the GTFP driving conditions of China’s dairy industry can be divided into three types: the first type is driven by green technology efficiency and green technology progress, which mainly includes 11 provinces: Beijing, Tianjin, Shanghai, Jiangsu, Hubei, Henan, Inner Mongolia, Shaanxi, Heilongjiang, Jilin and Liaoning. In the second case, green technology efficiency or green technology progress is “monorail driven”, in which the main driving factor in Guangdong, Shandong, Hebei, Fujian, Zhejiang, Shanxi and Ningxia is green technology efficiency, while the main driving factor in Anhui, Chongqing and Yunnan is green technology progress. The third is the “double-track collapse” of green technology efficiency and green technology progress, which shows an overall decline in Hunan, Xinjiang, Qinghai, Gansu, Guangxi, Guizhou, Sichuan and Tibet. It can be seen that green technical efficiency has promoted the green ecological development of China’s dairy industry to a large extent.
Based on the above results, the Dagum Gini coefficient and its decomposition method are further used to explore the spatial sources and contribution rates of regional differences in GTFP of the dairy industry in the whole country and the four economic zones. According to the data in Table 4, the average of the overall GTFP Gini coefficient of the dairy cow industry during the sample period is 0.658. It decreases from 0.960 to 0.465, with a decrease of 51.56%, indicating that the regional gap of GTFP in China’s dairy industry in the sample period is generally narrowing.
From the perspective of the intra-regional Gini coefficient, the Western region has the largest intra-regional difference, and the average Gini coefficient is 0.654. The Eastern region is the second, and the mean value of the intra-regional difference is 0.0594. The Central region is third, and the mean value of the intra-regional difference is 0.0507. The Northeast region is the lowest, and the mean value of the intra-regional difference is 0.0402. It can be seen that the difference in GTFP growth of the dairy industry in the Western region is the largest, followed by the Eastern and Central regions, and the difference in the Northeast region is small. From the perspective of the changing trend (Figure 2), the Gini coefficients of the GTFP of the dairy cow industry in the four regions in the sample interval show a downward trend, and the decline degree is the highest in the Central region, followed by the Eastern region and the lower in the Northeastern region and the Western region.
From the perspective of the inter-regional Gini coefficient, the regional difference between the West and the East is the largest, and the average Gini coefficient is 0.0696. The regional differences between the “West”–“Northeast” region and the “Central”–“West”" region are relatively large, and the mean Gini coefficients are 0.0687 and 0.0674, respectively. The degree of regional difference between the Central and Eastern regions and the Eastern and Northeastern regions is the second, and the mean Gini coefficient is 0.0665 and 0.0652, respectively. The regional difference between Central China and Northeast China is the smallest, and the mean Gini coefficient is 0.0623. From the perspective of the change trend, the differences among the groups basically show a trend of fluctuation and decline. The Gini coefficient of the “West”–“East” region decreases the most by 64.84%, followed by the “West”–“Northeast” region, “East”–“Northeast” region and “Central”–“East” region, which are 54.85%, 48.55% and 39.84%, respectively. The inter-regional Gini coefficients of Central–Northeast and Central–West show a smaller decline of 33.04% and 24.7%, respectively.
In terms of the contribution rate of Gini coefficient decomposition items to the overall Gini coefficient, super-variation density has the largest contribution rate during the sample period, with an average annual contribution rate of about 41.16% and a contribution rate between 26.09–66.95%. The contribution rate of regional difference was the second, with an average annual contribution rate of 30.27% and a contribution rate between 8.91% and 47.54%. The contribution rate of intra-regional differences is relatively low, with an average annual contribution rate of about 28.56% and the contribution rate ranging from 23.64% to 31.81%. From the perspective of the change trend (Figure 3), during the sample investigation period, the contribution of inter-regional difference and super-variation density varies greatly, while the contribution of intra-regional difference keeps a stable change trend with small fluctuation. The above analysis shows that the main source of regional differences in GTFP of the dairy industry in China is super-variation density; that is, the degree of overlap between different regions, followed by inter-regional differences, and the contribution rate of intra-regional differences to regional differences in GTFP of the dairy industry is relatively small.

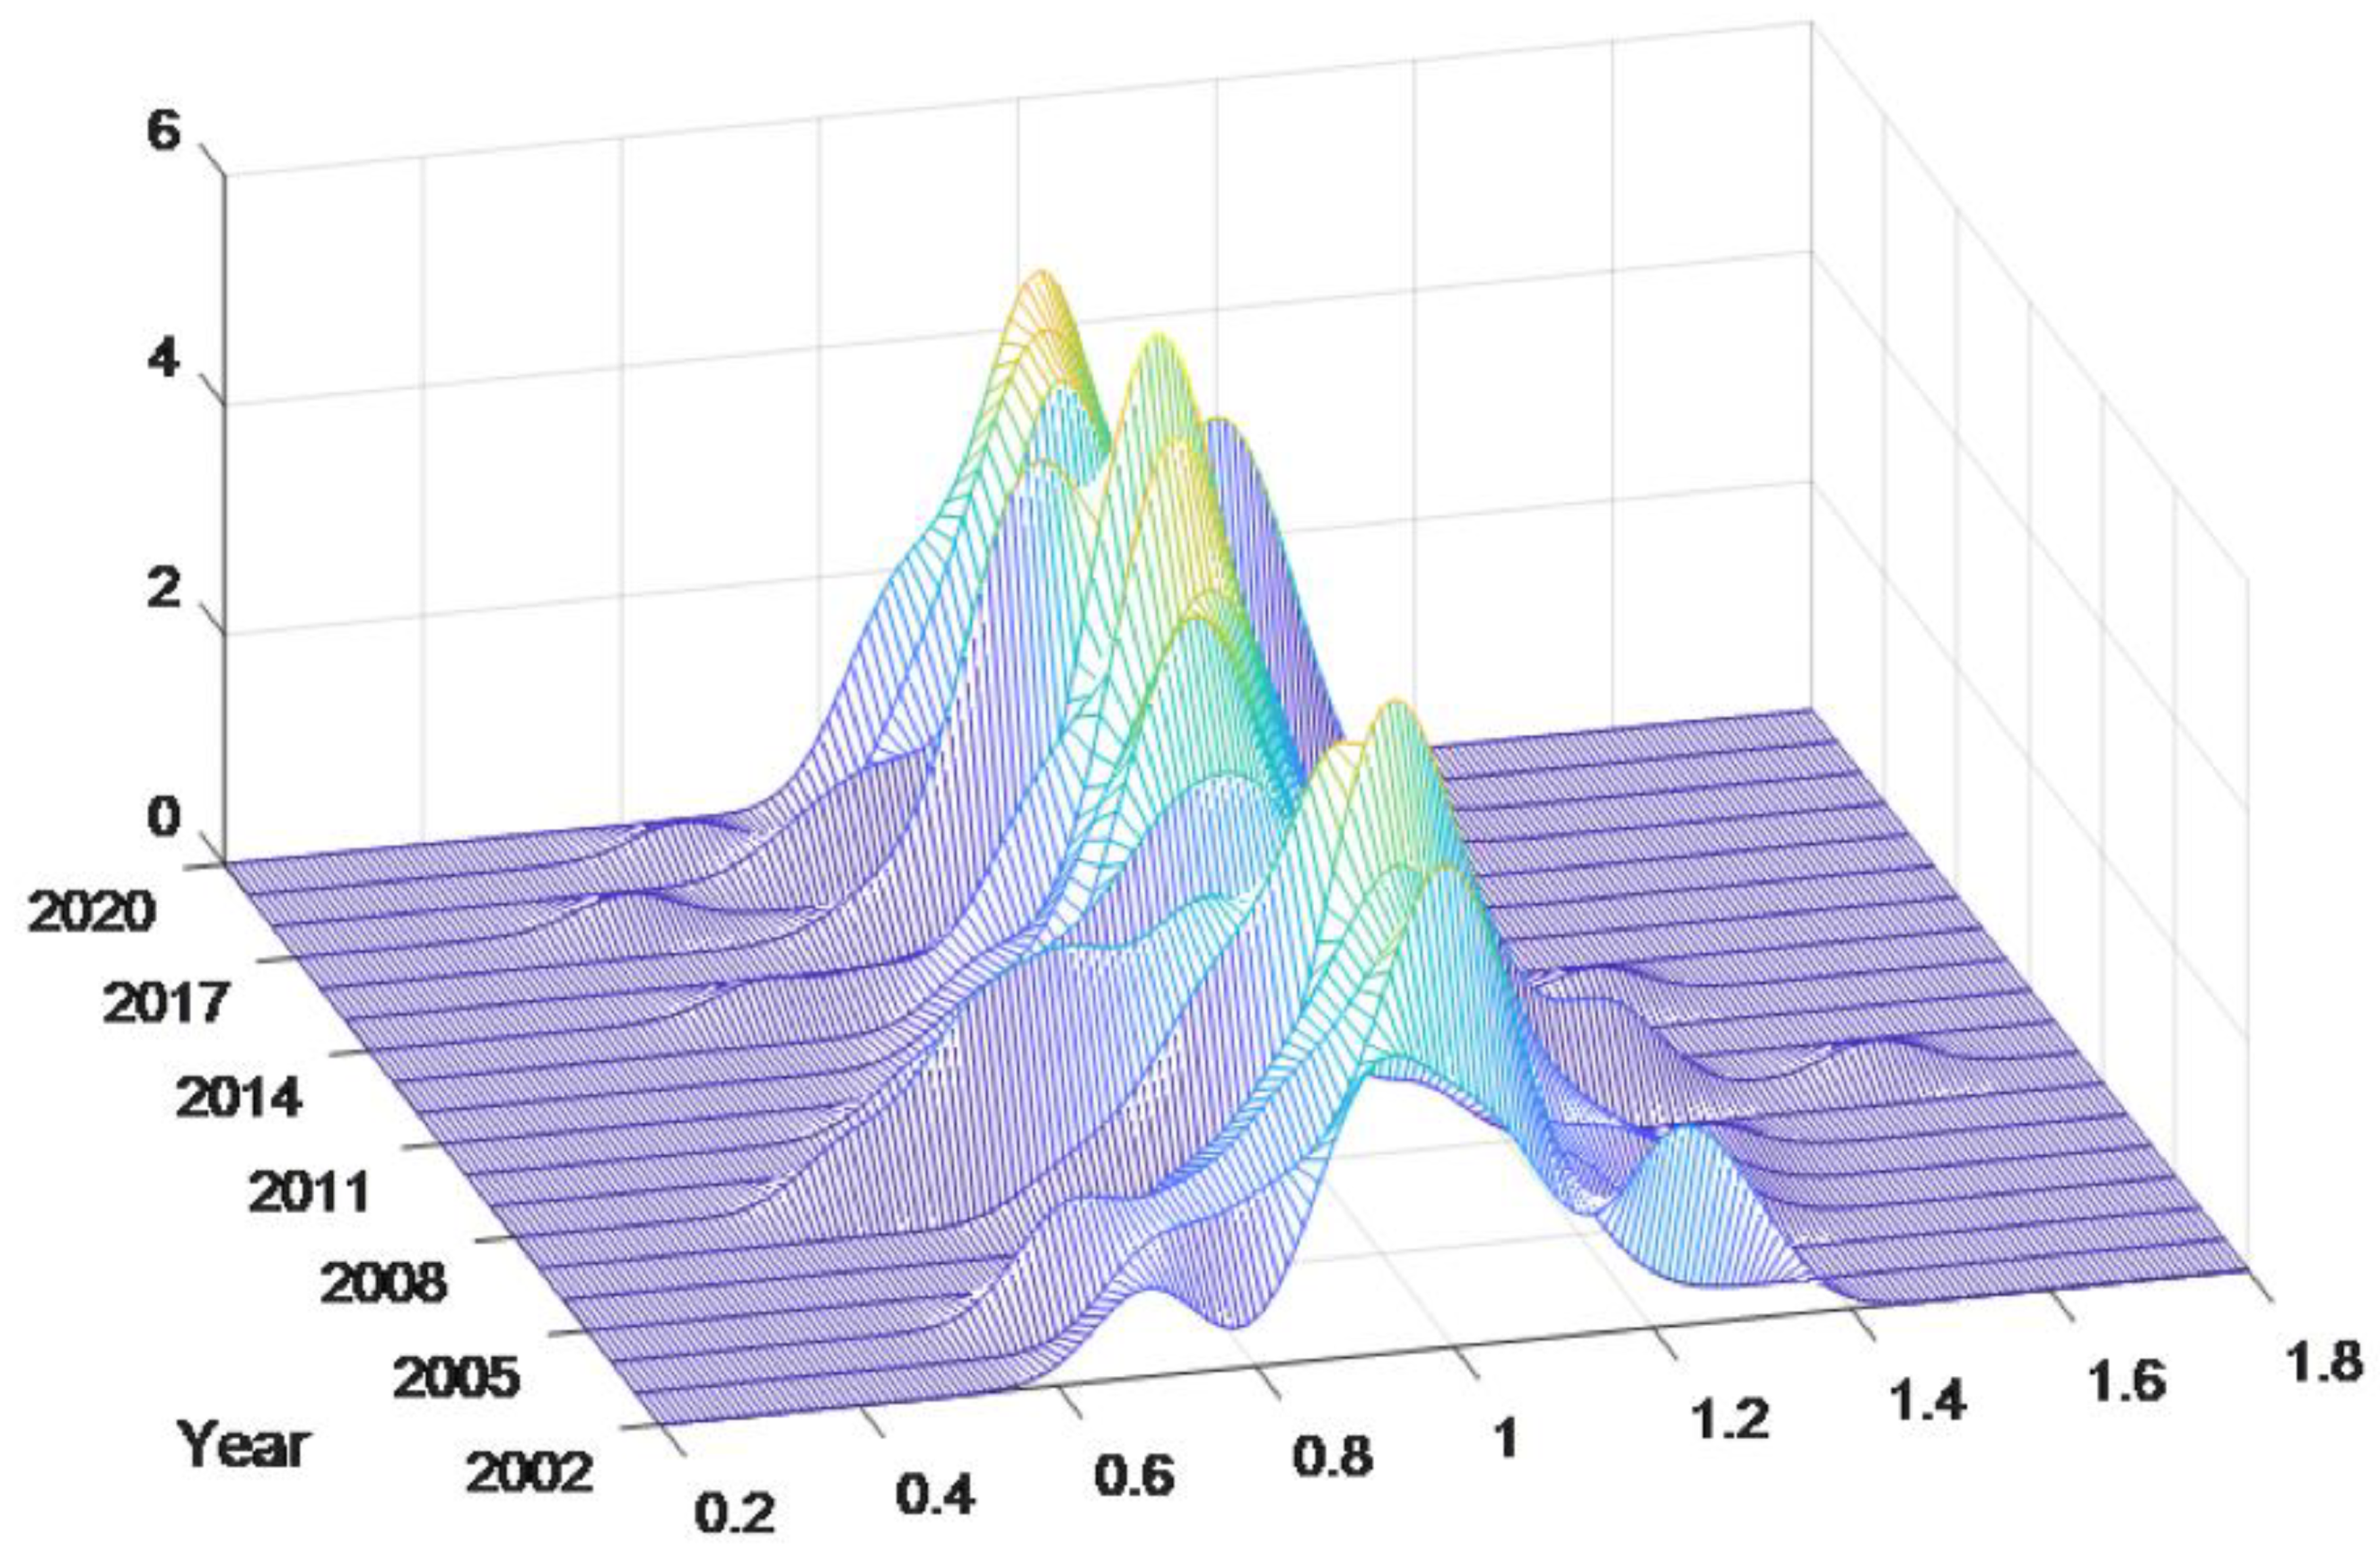
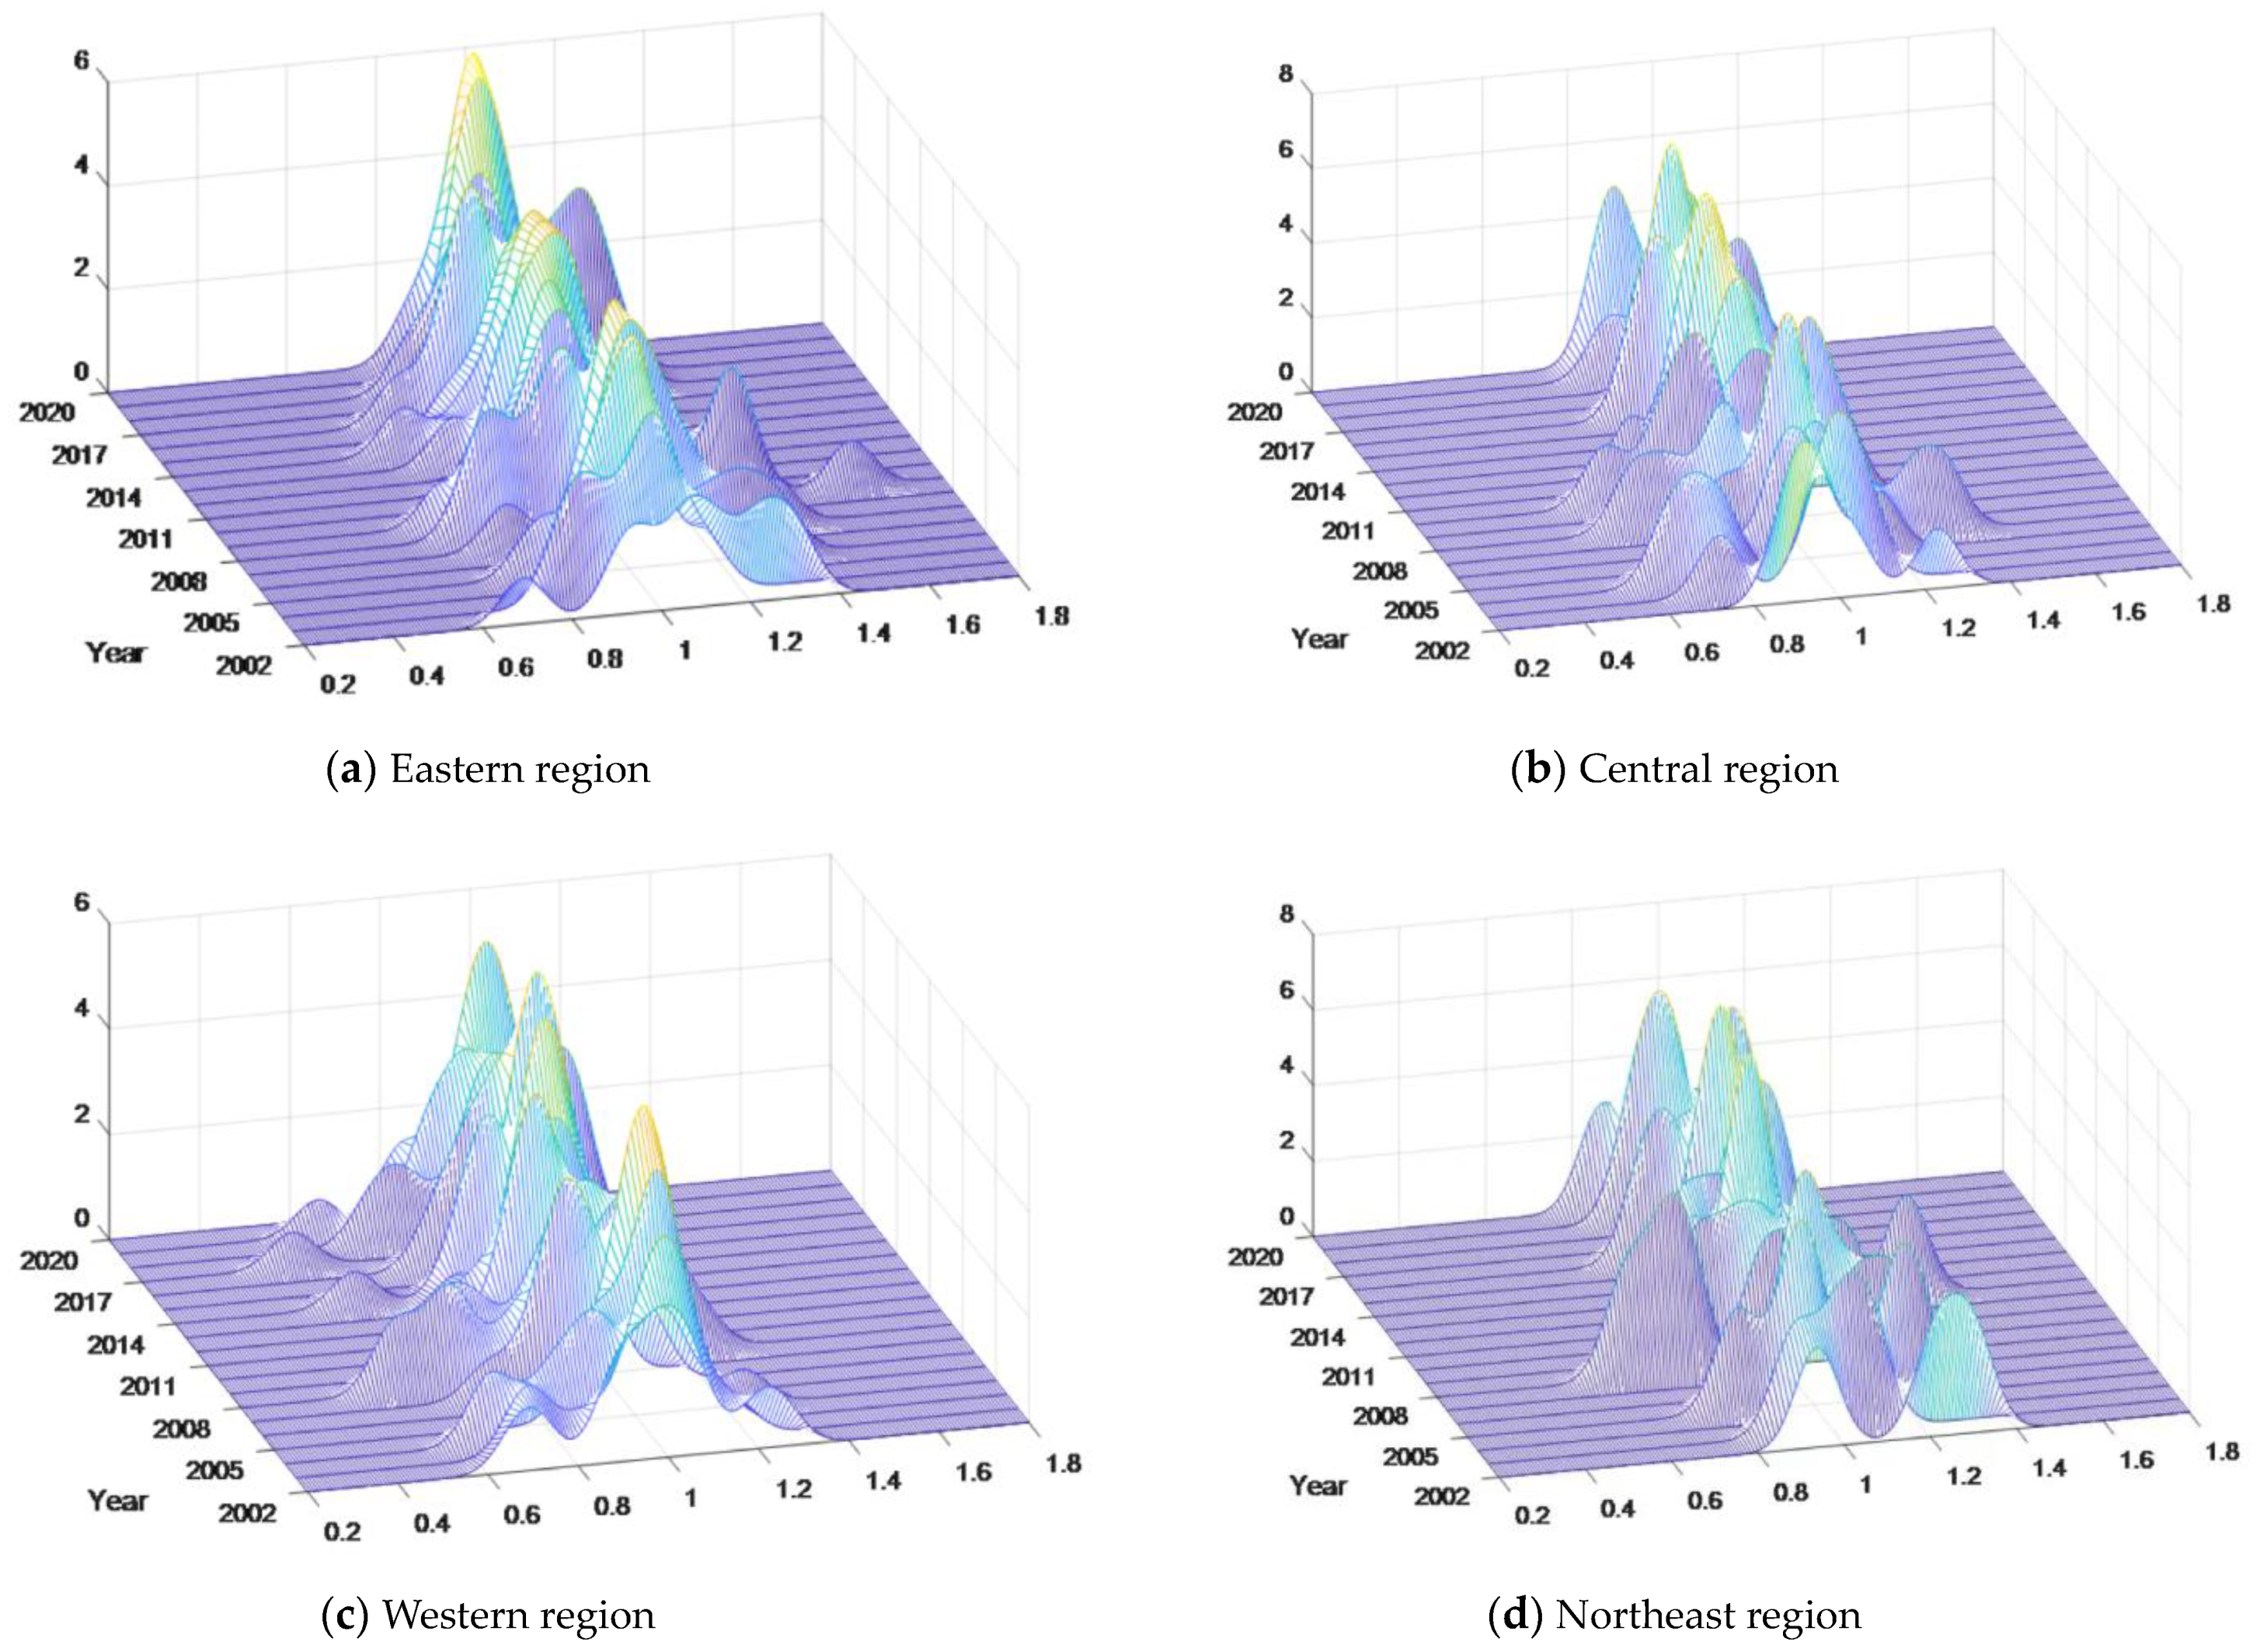
4.3. The Dynamic Evolution of China’s Dairy Industry GTFP

Figure 4 shows the evolution of GTFP in China’s dairy industry from 2001 to 2020. Firstly, from the distribution position, the center of the Kernel density curve moves to the right, indicating that the GTFP of China’s dairy industry has increased. Secondly, from the perspective of distribution pattern, the decrease in peak height in 2008 indicates that the difference degree of GTFP in China’s dairy industry is expanding, indicating that different provinces are affected by the “melamine” event to different degrees. Generally speaking, the peak changes from “flat and wide” to “high and narrow”, indicating that the difference degree of GTFP in China’s dairy industry in all provinces is gradually narrowing. From the perspective of distribution polarization, the distribution of GTFP in the dairy industry changed from multi-peak to bi-peak, and the polarization phenomenon weakened. From the perspective of distribution extensibility, there are different degrees of trailing phenomenon each year, indicating that there are provinces with low and high GTFP in the dairy cow industry in China, indicating that the “catch-up effect” of the low-level provinces on the high-level provinces in the GTFP of the dairy cow industry is insufficient during this period, and the regional difference increases.
Figure 5a shows the distribution dynamics of GTFP in the dairy industry in the Eastern region. The center of the Kernel density curve experienced a swing change process of “first moving to the left and then moving to the right”, which generally showed a right shift, indicating that the overall GTFP of the dairy industry in the Eastern region was on the rise, and the overall distribution of GTFP of the dairy industry in the Eastern region experienced a development transition process from scattered to concentrated. The phenomenon of right tailing has existed for some years, indicating that there are areas with high dairy GTFP in the eastern region (such as Beijing and Tianjin). (b) shows the evolution of the GTFP of the dairy industry in the Central region. The center of the Kernel density curve moved to the right, indicating that the GTFP of the dairy industry in the Central region increased slightly. The shape of the wave peak gradually narrows from a broad peak to a sharp peak, and the tailing phenomenon gradually weakens, indicating that the GTFP gap of the dairy industry in the Central region is gradually narrowing, and the overall GTFP level of the dairy industry in the Central region is gradually evolving from a dispersed image to a concentrated one, with a value between 0.8 and 1.2. (c) shows the evolution of the GTFP of the dairy industry in the Western region. The center of the Kernel density function shifted to the left, indicating that the GTFP of the dairy industry in the Western region had decreased. The peak mainly showed a “multi-peak” distribution, and the side peak was significantly lower than the main peak, indicating that the GTFP of the dairy cow industry in Western China was polarized, and the absolute difference was expanding. The distribution curve has a right trailing and gradually broadens, indicating that the GTFP difference of the dairy industry in the Western region is gradually expanding. (d) shows the evolution of the GTFP of the dairy industry in Northeast China. From the perspective of time, it can be divided into two parts. The first half of the distribution is mainly multi-peak with polarization phenomenon. In the second half of the investigation period, the distribution form is changed from multi-peak to single peak, and the polarization phenomenon is weakened.

5. Factors Influencing China’s Dairy Industry GTFP

5.1. Selection of Indicators

This paper selects the following five influencing factors:
(1) Agglomeration of the dairy industry: Industry agglomeration is one of the important factors affecting the green development of the dairy industry. The improvement of the agglomeration level of the dairy industry can generate economies of scale, knowledge spillover effects, competition effects, etc. By sharing dairy farming production factors, exchanging and learning among business entities, and promoting independent learning of business entities to improve production and breeding technologies, it can promote the green and benign development of the dairy industry, thereby promoting the improvement of the dairy industry GTFP. However, industry agglomeration is not always beneficial to GTFP, and it may lead to crowding effects, exacerbating the consumption of production factors such as feed and medicine in the region or generating vicious competition, which reduces the growth of the dairy industry GTFP. Therefore, the impact of industry agglomeration in the dairy industry on its GTFP is uncertain. Therefore, this article uses the Location Quotient (LQ) to calculate the level of agglomeration in the dairy industry. The higher the LQ value, the higher the degree of agglomeration, as shown in the following formula [29]:
M i t = e i t / e j t E i t / E j i
In the formula, Mit represents the industrial aggregation degree of the dairy industry in the ith province (city, autonomous region) in the TTH year; eit represents the output value of the dairy cow industry in the ith province (municipality, autonomous region) in the TTH year; ejt represents the output value of the dairy industry in the TTH year of the country; Eit represents the gross domestic product of province (municipality, autonomous region); i in year t; and Ejt represents the gross domestic product of the country in year t.
(2) Level of economic development: The level of economic development reflects the scale and potential of economic development in a region. With the improvement of the economic development level, social attention to green production and sustainable development will also increase, thus promoting the upgrading of industrial institutions. At the same time, the improvement of regional economic development level and the increase in scientific and technological innovation resources will also promote the progress of green technology to improve the efficiency of resource utilization, and ultimately promote the growth of green TFP. However, if the economic growth is based on the extensive economic development model, the economic development level will be slow compared with the growth level with a large amount of production factors input, resulting in an increase in pollution emissions, which is not conducive to the improvement of green TFP. In this paper, per capita GDP is used to represent the level of economic development, which is expressed by the ratio of regional GDP to regional resident population.
(3) Level of environmental regulation: The “Porter hypothesis” suggests that appropriate environmental regulations can promote technological innovation and create a feedback mechanism to encourage economic entities to innovate green technologies to improve production efficiency and pollution control capabilities [34]. According to externalities theory, environmental regulation is an important external constraint that affects the growth of the dairy industry GTFP. Environmental regulation can to some extent restrict the emission and treatment of pollutants in the dairy industry, force business entities to reduce pollution emissions, and thus form a constraint on the sustainable development of the dairy industry. Considering the availability of data, the proportion of environmental pollution control investment to regional GDP is used to represent the level of environmental regulation.
(4) Pollutant discharge efficiency: The improvement of production technology level will bring higher product quality or improve production efficiency, while the progress of green production technology will improve the degree of environmental friendliness and reduce the production and emission of pollutants. However, only focusing on “green” and sacrificing “production” will also inhibit the growth level of GTFP in the dairy industry. In this paper, the ratio of pollution emissions of the dairy industry to total industrial output is used to express it.
(5) Level of urbanization of population: Labor is an important factor of production in the dairy industry, and the development of urbanization is often accompanied by the improvement of human capital level, which makes the industrial development more to the direction of cleaner production. In turn, it promotes the growth of GTFP in the dairy industry. Theoretically, there is an inverted U-shaped relationship between urbanization and carbon emissions [35]. This paper uses the ratio of the number of permanent rural residents to the total population to express it. The descriptive statistics of each variable are shown in Table 5.

5.2. Model Specification

In this paper, the panel data of 29 provinces in China from 2001 to 2020 are selected to study the factors affecting the GTFP of China’s dairy industry, and the model used is constructed as follows:
ln G T F P i , t = β 0 + β 1 L Q i , t + β 2 ln P E R G D P i , t + β 3 E R i , t + β 4 G P T i , t + β 5 ln P U i , t + γ i + ε t + e i , t
In the equation, t represents year, i represents province, GTFP represents explained variable, LQ, PERGDP, ER, GPT and PU are explanatory variables, γi is the individual fixed effect, εt is the time-fixed effect, and eit is the random disturbance term. According to the adjustment method of Qiu Bin [36], it is known that GTFP is obtained by multiplying the measured Malmquist productivity index, and since the Malmquist index refers to the change rate of the index relative to the previous year, we assume that the GTFP of the dairy industry in 2001 is 1. The 2002 dairy GTFP is the 2001 GTFP multiplied by the 2002 Malmquist index. The 2003 dairy GTFP is the 2002 value multiplied by the 2003 Malmquist index, and so on.

5.3. Empirical Tests and Results Analysis

This paper chooses the two-way fixed effect model for regression [29]. The two influencing factors of time and region are fixed. The regression results are shown in Table 6.
The specific analysis is as follows:
(1) The industrial agglomeration of the dairy industry has a positive impact on the GTFP growth of the dairy industry, which passes the significance test at the 1% level. The estimation results show that industrial agglomeration generates positive externalities and promotes industrial competitiveness and economic development to a certain extent. The agglomeration of the dairy cow industry has gradually expanded the industrial production scale and feeding scale in the region, and the benign competition between different production subjects through knowledge exchange and resource sharing has promoted the growth of GTFP in the dairy cow industry.
(2) The level of economic development had a positive impact on the GTFP of the dairy industry, which passed the significance test at the level of 1%. It shows that economic development is conducive to the coordinated development of the economy, resources and environment of the dairy industry in our country. The improvement of the economic development level will drive the innovation and development of science and technology, and at the same time, the social attention to the ecological environment and sustainable development will also increase, creating powerful conditions for the improvement of the GTFP of the dairy industry.
(3) The level of environmental planning has a significant positive impact on the dairy industry GTFP, which has passed the significance test at the 5% level. This indicates that investments in environmental pollution control are conducive to the coordinated development of China’s dairy industry economy, resources and environment. Investments in environmental pollution control can improve the construction of relevant infrastructure for green production and popularize knowledge and technologies related to green production, such as organizing relevant lectures and providing guidance services.
(4) Pollutant discharge efficiency has a negative impact on the GTFP of the dairy industry, which passes the significance level at the 1% level. The estimation results show that in the process of pursuing high output or low sewage discharge, phenomena such as continuous extensive operation or high cost are likely to occur, resulting in environmental overload and low green production levels.
(5) The level of population urbanization promotes the improvement of the dairy industry GTFP, but it did not pass any level of significance test, indicating that for every 1% increase in the level of population urbanization, the green total factor productivity of the dairy industry will correspondingly increase. That is, there is a positive correlation between the level of population urbanization and the green total factor productivity of the dairy industry. This may be related to the weak intensity of the level of population urbanization, which has a limited effect on the dairy industry GTFP, but it still reflects that the improvement of urbanization level can promote the green development of the dairy industry to some extent.

6. Conclusions

This paper uses the super efficiency EBM model and GML index to measure the green TFP of China’s dairy industry from 2001 to 2020 with carbon emissions and pollutant emissions as undesirable outputs, and then uses the two-way fixed effect model to analyze the influencing factors of GTFP of China’s dairy industry:
(1) On the whole, the average GTFP of China’s dairy industry from 2001 to 2020 is 1.016, which is relatively high, indicating that the GTFP of China’s dairy industry is growing. From the regional point of view, the GTFP of the dairy cow industry in various regions of China is obviously different, which is mainly manifested as a decreasing trend of “Northeast—East—Central—West”. From the provincial point of view, the GTFP of the dairy cow industry in Inner Mongolia, Beijing, Tianjin, Heilongjiang and Shanghai is far ahead of the national average level, while Guangxi, Guizhou, Sichuan and Tibet are relatively backward. In terms of GTFP decomposition items of the dairy cow industry, the GTFP growth of the dairy cow industry in all regions of China mainly relies on the promotion of green technology efficiency, while the promotion effect of green technology progress is relatively low.
(2) The Degum Gini coefficient and decomposition results show that the Gini coefficient of GTFP of China’s dairy industry shows a steady downward trend as a whole. The main source of regional differences in GTFP in the dairy industry is super-variation density, followed by inter-regional differences and the least contribution from intra-regional differences. During the sample period, the intra-regional variation of GTFP in the Western region is the largest, followed by the Eastern region, the Central region and the Northeast region. The difference between the West and East regions is the largest, and the difference between the Central and Northeast regions is the smallest.
(3) The GTFP of China’s dairy industry has increased, and the peak has changed from “flat and wide” to “high and narrow”, and the degree of differentiation has been reduced, and the polarization phenomenon has weakened. The GTFP level of the dairy industry in the Eastern region increased, and the overall gap among provinces gradually narrowed. The GTFP level of the dairy industry in the Central region increased slightly, and the tailing phenomenon weakened. The GTFP level of the dairy industry in the Western region has decreased, and there is a certain polarization phenomenon and the regional level gap has increased. The polarization phenomenon in Northeast China weakened during the investigation period, and the horizontal gap within the region narrowed.
(4) Dairy industrial agglomeration, economic development level and the level of environmental regulation have significant positive effects on the green total factor productivity of the dairy industry. Higher regional GDP per capita and more investment in environmental pollution control can improve the green production level of the regional dairy industry, and a high concentration of the dairy industry will improve the green total factor productivity of the regional dairy industry through economies of scale, knowledge spillover effect and competition effect. However, sewage efficiency has a negative effect on the green total factor productivity of the dairy industry.
This study station studies the green development level of the dairy industry from the perspective of provinces in China, but the green development level of different dairy farms in the same region is also different. In the future, targeted research should be conducted on provinces with relatively low green development levels of the dairy industry. The dairy industry includes not only the three major links of feed cultivation, dairy cattle breeding and transportation, but also milk production and processing, etc. This study did not consider the carbon emission of milk processing and transportation, which will have a certain impact on the GTFP level of the dairy industry in each province. There are still many places in each major link that will produce carbon emissions, such as the use of pesticides, agricultural film and straw incineration in the process of feed cultivation, which is not involved in this paper because the relevant statistical yearbook has not counted, and there will be certain errors in the final calculation results, which need to be improved in the next study.

Author Contributions

Writing—original draft, Y.L.; Writing—review & editing, H.L. All authors have read and agreed to the published version of the manuscript.

Funding

This research received no external funding.

Informed Consent Statement

Informed consent was obtained from all subjects involved in the study.

Data Availability Statement

No new data were created or analyzed in this study. Data sharing is not applicable to this article.

Conflicts of Interest

The authors declare no conflict of interest.

References

  1. Opinions of the CPC Central Committee and The State Council on Comprehensively Promoting Rural Revitalization and Accelerating Agricultural and Rural Modernization. Qinghai Agric. Technol. Ext. 2021, 3–9.
  2. Chen, J.; Zhong, F. The Role of Income and Food Prices in Diet-Related Greenhouse Gas Emissions in China: A Path towards a Sustainable Diet. Foods 2022, 11, 4051. [Google Scholar] [CrossRef]
  3. Dong, H.; Li, Y.; Tao, X. Agricultural greenhouse gas emissions and mitigation technologies in China. Trans. Chin. Soc. Agric. Eng. 2008, 24, 269–273. [Google Scholar]
  4. The Writing Committee of the Third National Climate Change Assessment Report. In The Third National Climate Change Assessment Report; Science Press: Beijing, China, 2015.
  5. Liu, C.; Shi, X.; Li, C. Digital Technology, Factor Allocation and Environmental Efficiency of Dairy Farms in China: Based on Carbon Emission Constraint Perspective. Sustainability 2023, 15, 15455. [Google Scholar] [CrossRef]
  6. Milić, D.; Novaković, T.; Tekić, D.; Matkovski, B.; Đokić, D.; Zekić, S. Economic Sustainability of the Milk and Dairy Supply Chain: Evidence from Serbia. Sustainability 2023, 15, 15234. [Google Scholar] [CrossRef]
  7. Lu, Z.; Shao, C.; Wang, F.; Dong, R. Evaluation of Green and Low-Carbon Development Level of Chinese Provinces Based on Sustainable Development Goals. Sustainability 2023, 15, 15449. [Google Scholar] [CrossRef]
  8. Wang, Y.; Yu, W. Spatial econometric study on convergence of total factor productivity among provinces in China. J. Shandong Univ. (Philos. Soc. Sci.) 2017, 43–49. [Google Scholar]
  9. Yao, C.; Qian, S.; Li, Z.; Liang, L. Measurement and spatiotemporal evolution mechanism of carbon emissions from livestock industry among provinces in China. Resour. Sci. 2017, 39, 698–712. [Google Scholar]
  10. Wu, Q.; Zhang, Y.; Zhang, M. Quantitative evaluation, spatio-temporal characteristics and dynamic evolution of carbon emissions from China’s animal husbandry: 2001–2020. J. Arid. Land Resour. Environ. 2022, 36, 65–71. [Google Scholar] [CrossRef]
  11. Xu, L.; Qu, J.; Wu, J.; Wei, Q.; Bai, J.; Li, H. Spatial-temporal changes and prediction of carbon emissions in China’s agriculture and animal husbandry. J. Ecol. Rural Environ. 2019, 35, 1232–1241. [Google Scholar] [CrossRef]
  12. Chen, Y.; Shang, J. Estimation of greenhouse gas emissions from livestock industry in the four major pastoral areas of China and decomposition of influencing factors. China Popul. Resour. Environ. 2014, 24, 89–95. [Google Scholar]
  13. Tang, H.; Su, Y.; Ma, H.; Wang, J. Pattern and equity of carbon emissions from animal husbandry in Xinjiang. Arid Land Geogr. 2017, 40, 1338–1345. [Google Scholar] [CrossRef]
  14. Yi, Q.; Li, B.; Geng, N. Analysis of total factor productivity of China’s animal husbandry based on environmental adjustment. China Popul. Resour. Environ. 2014, 24, 121–125. [Google Scholar]
  15. Zou, J.; Xiang, C. Measurement of environmental efficiency in China’s animal husbandry and analysis of influencing factors. Environ. Pollut. Control 2016, 38, 90–96. [Google Scholar] [CrossRef]
  16. Xu, B.; Shen, Z.; Lin, G. Evolution of Green Total Factor Productivity and Regional Disparity in China’s Husbandry. Chin. J. Eco-Agric. 2019, 27, 613–622. [Google Scholar]
  17. Cui, Z.; Wang, M.; Shi, Z. Analysis of total factor productivity of China’s herbivorous animal husbandry under greenhouse gas emissions constraints. J. Agrotech. Econ. 2018, 66–78. [Google Scholar] [CrossRef]
  18. Du, H.; Wang, M.; Hu, M. Spatio-temporal differences of green total factor productivity in pig farming of different scales: Based on non-radial, non-angular SBM productivity index model. J. Hunan Agric. Univ. (Soc. Sci. Ed.) 2019, 20, 16–23. [Google Scholar] [CrossRef]
  19. Zhu, N.; Qin, F. Analysis of environmental efficiency and environmental total factor productivity in large-scale livestock and poultry farms: A case study of laying hens. J. Agrotech. Econ. 2015, 86–98. [Google Scholar] [CrossRef]
  20. Wang, X.; Liang, D.; Wang, X.; Peng, S.; Zheng, J. Evaluation of greenhouse gas emissions from a dairy farming system using a life cycle assessment. Trans. Chin. Soc. Agric. Eng. 2012, 28, 179–184. [Google Scholar]
  21. Huang, W. Method and Case Analysis of Carbon Footprint Assessment for Milk Production in Large-Scale Dairy Farms. Master’s Thesis, Chinese Academy of Agricultural Sciences, Beijing, China, 2015. [Google Scholar]
  22. Li, J.; Shi, Z.; Hu, X. Analysis of spatiotemporal differentiation characteristics of total factor productivity in China’s dairy industry. Chin. J. Agric. Resour. Reg. Plan. 2022, 43, 92–103. [Google Scholar]
  23. Chen, Y. Measurement of Carbon Emissions and Reduction Pathways in China’s Livestock Industry. Master’s Thesis, Northeast Forestry University, Harbin, China, 2016. [Google Scholar]
  24. Available online: http://www.stats.gov.cn/ (accessed on 10 November 2023).
  25. Bai, M.; Ma, W.; Wu, J.; Lu, Y.; Ren, K.; Kang, J. Estimation of greenhouse gas emissions from large-scale dairy farms in Beijing. J. Domest. Anim. Ecol. 2017, 38, 78–85. [Google Scholar]
  26. Li, T.; Xiong, H.; Wang, M. How should China’s dairy industry develop under the “dual carbon” target? A study on carbon emissions of the dairy industry from the perspective of the entire industry chain. Issues Agric. Econ. 2022, 15, 17–29. [Google Scholar] [CrossRef]
  27. Hoehn, D.; Laso, J.; Cristóbal, J.; Ruiz-Salmón, I.; Butnar, I.; Borrion, A.; Bala, A.; Fullana-i-Palmer, P.; Vázquez-Rowe, I.; Aldaco, R.; et al. Regionalized Strategies for Food Loss and Waste Management in Spain under a Life Cycle Thinking Approach. Foods 2020, 9, 1765. [Google Scholar] [CrossRef] [PubMed]
  28. Tone, K.; Tsutsui, M. An Epsilon-based Measure of Efficiency in DEA: A Third Pole of Technical Efficiency. Eur. J. Oper. Res. 2010, 207, 1554–1563. [Google Scholar] [CrossRef]
  29. Lin, Z.; Zhang, Y. Spatio-temporal differences and influencing factors of green total factor productivity in China’s animal husbandry. J. Ecol. Rural. Environ. 2023. [Google Scholar] [CrossRef]
  30. Wang, R. Regional differences and spatiotemporal evolution of green development level of China’s pig industry: An empirical study based on Dagum Gini coefficient decomposition and Kernal density estimation. Product. Res. Res. 2023, 74–79. [Google Scholar]
  31. Dagum, C. A New Approach to the Decomposition of the Gini Income Inequality Ratio. Empir. Econ. 1997, 22, 515–531. [Google Scholar] [CrossRef]
  32. Liu, S. Regional differences and stochastic convergence of economic growth quality in China. J. Quant. Tech. Econ. 2019, 36, 24–41. [Google Scholar] [CrossRef]
  33. Yu, G. Estimation and Influencing Factors of Carbon Emissions in China’s Dairy Industry; Northeast Agricultural University: Harbin, China, 2019. [Google Scholar]
  34. Guo, J. The impact of environmental regulation on green technology innovation: Evidence from China’s “Porter Effect”. Financ. Trade Econ. 2019, 40, 147–160. [Google Scholar]
  35. Zhang, T.; Yang, J.; Sheng, P. The influence of urbanization on carbon emissions in China and its channels of action. China Popul. Resour. Environ. 2016, 26, 47–57. [Google Scholar]
  36. Qiu, B.; Yang, S.; Xin, P. FDI technology spillover channels and productivity growth in China’s manufacturing industry: An analysis based on panel data. J. World Econ. 2008, 20–31. [Google Scholar]
Figure 1. GTFP and its decomposition trend of dairy industry in China from 2001–2020.
Sustainability 15 16250 g001
Figure 2. Variation trend of GTFP Gini coefficient in dairy industry in China.
Sustainability 15 16250 g002
Figure 3. Sources and contribution rates of GTFP regional differences in dairy industry in China.
Sustainability 15 16250 g003
Figure 4. Distribution dynamics of GTFP in Chinese dairy industry.
Sustainability 15 16250 g004
Figure 5. Distribution dynamics of GTFP in Chinese dairy industry by sub-region.
Sustainability 15 16250 g005
Table 1. Dairy industry GTFP evaluation index system.
IndicatorsVariableVariable Representation
input indicatorsagricultural resource inputsgrain consumption (10,000 tons)
energy inputselectricity input (kWh)
coal input (tons)
medical and epidemic prevention expenses (CNY 10,000)
asset inputstools and materials purchase (CNY 10,000)
repair and maintenance expenses (CNY 10,000)
fixed assets (CNY 10,000)
expected outputeconomic growth of the dairy industryoutput value of dairy products (CNY 100 million)
undesirable outputcarbon emissions of the dairy industrycarbon emissions of the dairy industry (10,000 tons)
pollutant emissions of the dairy industryCOD, TN, TP (tons)
Table 2. GTFP and its decomposition of dairy industry in China from 2001–2020.
PeriodGTFPGECGTCCumulative GTFP
2001–20021.0151.0011.0051.015
2002–20030.9650.9611.0040.981
2003–20041.0031.0230.9810.984
2004–20051.1011.0661.0321.084
mean of 10th Five-Year Plan period1.0211.0151.006——
2005–20061.1320.9791.1561.216
2006–20070.9711.0460.9281.187
2007–20080.8341.0020.8321.020
2008–20091.1861.0191.1641.206
2009–20100.9501.0260.9261.157
mean of 11th Five-Year Plan period1.0161.0141.001——
2010–20110.9971.0210.9761.154
2011–20121.0031.0160.9861.156
2012–20130.9761.0460.9321.132
2013–20140.9860.9920.9941.118
2014–20151.0500.9661.0871.168
mean of 12th Five-Year Plan period1.0031.0080.995——
2015–20160.9641.0050.9591.132
2016–20171.1091.0101.0981.241
2017–20180.9960.9791.0171.237
2018–20190.9961.01390.9821.232
2019–20201.0471.0071.0391.279
mean of 13th Five-Year Plan period1.0221.0031.019——
mean value of 2001–20201.0161.0101.005——
Table 3. GTFP and its decomposition of provincial dairy industry in China from 2001–2020.
RegionProvinceRankingGTFPGECGTCRegionProvinceRankingGTFPGECGTC
EasternBeijing21.0431.0221.021NortheastHeilongjiang41.0411.0061.035
Tianjin31.0421.0211.021Jilin81.0251.0211.004
Shanghai51.0391.0281.011Liaoning101.0171.0131.004
Guangdong61.0261.0370.989WesternInner Mongolia11.0451.0201.025
Shandong121.0131.0170.997Shanxi111.0131.0131.000
Jiangsu131.0101.0011.009Chongqing141.0040.9961.008
Heibei151.0011.0080.993Ningxia170.9971.0000.997
Fujian160.9991.0160.983Yunnan180.9970.9921.004
Zhejiang200.9921.0020.990Xinjiang210.9820.9880.994
CentralHubei71.0251.0211.004Qinghai220.9810.9761.005
Henan91.0241.0161.008Gansu250.9750.9800.994
Shanxi190.9951.0010.994Guangxi260.9680.9900.978
Anhui230.9790.9791.000Guizhou270.9580.9670.99
Hunan240.9760.9920.984Sichuan280.9560.9670.988
-----Tibet290.9160.9450.970
Table 4. Gini coefficient and contribution rate of GTFP in Chinese dairy industry.
YearGeneral GInter-Regional Gini Coefficient
East–NortheastWest–NortheastWest–EastCentral–NortheastCentral–EastCentral–West
20020.0960.09080.11290.10530.09610.09360.0838
20030.0670.0550.06240.07030.05590.06630.0709
20040.09110.07610.11820.08040.15020.10440.1075
20050.07430.09680.06520.07810.0670.09610.0702
20060.04690.04850.05160.03640.05890.0640.067
20070.06590.05430.07470.08440.04560.06170.0546
20080.10330.11110.10710.10710.1070.08870.1149
20090.08550.10110.05740.11390.03890.09940.0551
20100.08510.06760.06950.08320.08410.11340.1053
20110.05780.04150.04990.06370.0420.05540.0705
20120.06370.10360.1050.05060.11670.04830.0608
20130.04110.04940.04740.04340.04080.03750.0345
20140.06690.06530.08010.07190.03210.05630.0732
20150.03590.04040.02290.04460.01920.04180.0278
20160.05170.05920.05540.05610.05090.0480.0466
20170.05740.03960.05290.06960.03160.0480.0576
20180.06070.06260.06690.07030.03910.04710.0527
20190.05270.02920.05540.05670.04380.03750.064
20200.04650.04670.0510.0370.06440.05630.0631
mean0.06580.06520.06870.06960.06230.06650.0674
yearintra-regional Gini coefficientcontribution rate
NortheastEasternWesternCentralintra-regionalinter-regionalsuper-variation density
20020.06960.09520.09410.065928.70%32.56%38.73%
20030.03890.05950.07530.063231.08%8.91%60.01%
20040.04830.04290.09520.102825.63%48.00%26.37%
20050.04130.090.04790.075726.80%34.33%38.87%
20060.04370.03880.030.060723.64%47.54%28.82%
20070.02510.07290.05830.032727.43%46.48%26.09%
20080.04430.07090.11690.095828.95%35.77%35.28%
20090.04030.1180.06620.033928.55%31.42%40.02%
20100.04380.07660.08160.05928.13%38.88%32.99%
20110.01210.05540.06050.045129.22%35.74%35.03%
20120.09590.03540.06010.054825.62%31.90%42.48%
20130.04690.0450.03960.024229.98%3.08%66.95%
20140.02460.05660.07850.031729.17%41.03%29.80%
20150.01240.05470.02770.020130.03%19.67%50.30%
20160.05380.05480.04770.037429.27%21.04%49.68%
20170.01840.04320.07490.035531.15%40.70%28.15%
20180.02990.06410.07040.019130.99%28.12%40.88%
20190.02170.02610.07550.042331.81%20.71%47.49%
20200.05230.02820.04190.062526.55%9.27%64.19%
mean0.04020.05940.06540.050728.56%30.27%41.16%
Table 5. Descriptive statistics of influencing factors of GTFP in China of dairy industry.
Variable NameAbbreviationNumber of ObservationsMean VarianceStandard DeviationMaximum Minimum
industrial agglomerationLQ5511.8346.7642.60316.5780.045
economic developmentlnPergdp5511.0810.6360.7982.803−1.175
environmental planningER5510.0120.0000.0090.1350.001
emission efficiencyGPT5513.1189.9203.15324.2810.112
urbanization ratelnPU551−0.8180.2010.449−0.158−2.263
Table 6. Regression results of influencing factors of GTFP of dairy industry in China.
Variable NameCoefficientStd. Err.tp > |t|95% Conf. Interval
LQ7.92 ***2.053.850.0003.8711.97
lnPergdp64.39 ***13.224.870.00038.4090.38
ER936.64306.133.060.002335.171538.11
GPT6.91 ***0.947.320.0005.058.77
LnPU75.5041.751.810.071−6.53157.54
_cons3.9668.030.060.955−129.80137.52
ProvinceYES
YearYES
N551
R-squared0.8664
*** represents the significant levels of p values below 1%.
Disclaimer/Publisher’s Note: The statements, opinions and data contained in all publications are solely those of the individual author(s) and contributor(s) and not of MDPI and/or the editor(s). MDPI and/or the editor(s) disclaim responsibility for any injury to people or property resulting from any ideas, methods, instructions or products referred to in the content.

