Abstract
After conducting true triaxial tests on sandstone in a laboratory setting, this study aims to determine the safe tunnelling rate of the roadway by examining the instability and failure characteristics of surrounding rock under different disturbance stresses in deep underground roadway excavation. Results showed that the mechanical properties, deformation, and failure characteristics of sandstone differed under different loading and unloading rates. Specifically, as the loading rate increased, the crack initiation stress increased while the damage stress remained unchanged, and the deformation anisotropy of the rock decreased. In contrast, as the unloading rate increased, the residual stress of the rock decreased, the brittleness increased, and the deformation anisotropy of the rock increased. Additionally, the expansion of the rock went through three critical stages: (1) A–B: a sharp increase in the dilatancy of sandstone (M) in a short period, accompanied by a large number of cracks, (2) B–C: a weakened stage of expansion ability, in which M continued to decrease over time, albeit at a slower rate, and (3) C–D: a stage of enhanced expansion ability, during which M began to increase again, albeit at a slower rate than its rate of decrease. This final stage was the longest.
1. Introduction
As energy demand continues to increase, shallow energy exploitation can no longer keep up, and both domestic and foreign energy exploration and exploitation are moving deeper. This trend has raised safety concerns in coal mining due to the increasing mining depth [1]. However, traditional laboratory tests often fail to replicate the complex field conditions of deep rock masses. To address this issue, higher sample preparation requirements are needed to simulate the field stress conditions [2].
While previous scholars have conducted triaxial tests to analyze the physical and mechanical properties, deformation, and failure characteristics of rocks [3,4,5,6], the stress conditions of rock masses become more complicated during roadway excavation as coal mining depth increases. To ensure the stability of the surrounding rock and improve excavation safety, excavation speed is often reduced, which alters the disturbance stress of surrounding rock to minimize the risk of instability and rockfall. Therefore, investigating the mechanical properties of rocks under true triaxial stress is essential for understanding and controlling the stability of the roadway surrounding rock. This is of significant importance to ensure the safety and economical production of coal mines [7].
Many scholars have conducted laboratory tests to simulate rock’s triaxial loading and unloading tests to study the mechanical properties of surrounding rock. However, to better reflect the actual situation of underground rock mass under three-dimensional stress conditions during the excavation of a deep underground space project, the true triaxial test is used to simulate the stress path. For instance, Liu et al. [8] proposed a new calculation method for the brittleness index of granite based on damage stress and axial strain under true triaxial unloading conditions, which showed that the brittleness of granite is stronger. Similarly, Yin et al. and Zhao et al. [9,10] studied the mechanical properties of sandstone under different loading and unloading conditions using a true triaxial test system. Zhang et al. [11] obtained rock failure laws of different depths and stress paths of deep sandstone using true triaxial simulation tests and claimed that the M-C strength criterion could describe rock failure characteristics more accurately. Hu et al. [12] found that rock deformation anisotropy is related to bedding dip angle by conducting rockburst tests on different bedding sandstones. Zhang et al. and He et al. [13,14] believed that high stress and high unloading rate are the main inducing factors for the instantaneous occurrence of rockburst based on true triaxial single-side rapid unloading tests of granite. Zhang et al. [15] proposed a yield approach rate to describe how fast rock approaches a yield point under different stress paths by studying the effect of different unloading rates on rock strength under conventional triaxial conditions. Qiu et al. [16] quantitatively described the volumetric dilatancy characteristics of granite under different unloading rates by performing conventional triaxial tests. Guo et al. [17] studied the expansion criterion of rock based on the viewpoint of energy. Hou et al. [18] performed a detailed study on the dilatancy characteristics of rocks by uniaxial and triaxial tests on eight kinds of rocks. Zhang et al. [19] conducted a numerical simulation of the dilatancy phenomenon of sandstone under triaxial compression, which showed that the number of micro-fractures in sandstone increases sharply after the dilatancy turning point. Cong et al. [20] studied the failure mechanism of brittle rock at different unloading rates by conducting laboratory tests on marble under axial pressure and confining pressure unloading and particle flow simulation. Kang and Wei and Li et al. [21,22] conducted numerical simulation studies of rock failure modes and strength characteristics at different unloading rates, which obtained new mechanical parameters for reference and more clearly analyzed the root cause of rock failure. Li et al. [23] conducted true triaxial tests on sandstone specimens with void-type defects, which showed that the expansion phenomenon of sandstone specimens with double voids and three voids is not obvious, and specimens are mainly shear failure. Zhao et al. [24] studied the response mechanism of rock to the unloading rate under complex triaxial stress. Dai et al. and Li et al. [25,26] found differences in the deformation characteristics of rocks under different unloading rates by triaxial tests. Huang et al. [27] studied the dilatancy characteristics of rock in the excavation process by loading and unloading mechanical tests on sandy mudstone under different stress states. Hu et al. [28] compared rock strength parameters under loading and unloading conditions and believed that the mechanical property degradation of rock under unloading conditions appears more serious. Young and Nasseri [29] investigated the anisotropic characteristics of sandstone using a true triaxial loading and unloading test. Yin et al. [30] examined the dilatancy characteristics of rock under intermediate principal stress and different stress paths using a true triaxial experimental system. Wu [31] conducted a study on rock failure using a true triaxial experimental system and found that the acoustic emission energy and count under unloading conditions were higher than those under loading conditions, while the expansion capacity was larger. Du [32] conducted a true triaxial test to investigate the peak strength and failure mode of rock and concluded that the M-C strength criterion was no longer applicable, and the failure mode of the rock changed from shear failure to plate-crack failure. Chu et al. [33] performed cyclic loading and unloading tests on coal samples under triaxial conditions, finding that the cumulative residual deformation of coal samples increased with the number of cycles, and the relative residual deformation decreased first, stabilized, and then rose sharply.
Wen et al. [34] conducted loading and unloading tests under triaxial conditions, and concluded that rock failure was caused by lateral expansion under unloading conditions. Jia et al. [35] used the RFPA (Realistic Failure Process Analysis) method to investigate the mechanical characteristics and failure modes of combined rock under true triaxial conditions. The results showed that the local failure characteristics of the combined rock mass were significant, and the failure location was related to the hardness and softness of the rock. Liang et al. [36] conducted true triaxial tests and found that shear failure was the primary failure mechanism under the gradient stress cycle, while tensile failure was the secondary mechanism. Chen et al. [37] also conducted true triaxial tests and found that the length of granite bridges affected their strength and failure mode under unloading conditions, and that intermediate principal stress had a significant influence on rock failure. Furthermore, they found that true triaxial testing was more conducive to brittle failure of rock than uniaxial testing.
Fan et al. [38] investigated the brittle failure of red sandstone under different stress paths using true triaxial mechanics. Ma et al. [39] conducted true triaxial tests and found that the influence of intermediate principal stress changes on rock’s mechanical properties and failure modes was related to the stress path. Gong et al. [40,41,42,43,44] all used a true triaxial testing machine to conduct rockburst tests on deep granite under high-stress conditions. Here, a new dynamic bounding surface plasticity damage model is developed for rocks, which considers high strain rates and confinements. The proposed model is validated by conventional triaxial compression tests, dynamic triaxial tests, and split Hopkinson pressure bar (SHPB) tests [45]. A dual coupled Micro-Macro Continuum-Discontinuum approach named distinct lattice spring model (DLSM) is used to investigate the mechanisms of zonal disintegration within deep rock masses. The model is validated through numerical simulations and laboratory tests, and is found to be capable of reproducing the process of zonal disintegration explicitly [46]. To investigate the influence of both damage and plasticity on cavity expansion in rock medium, a plastic damage solution is derived for undrained spherical cavity expansion using a modified Cam-Clay (MCC) model as the plasticity driver and a damage evolution criterion. The proposed solution is verified through a classic solution in literature, and the role of damage in undrained spherical cavity expansion is investigated [47].
The existing research results have made significant contributions to our understanding of stress-strain curves under loading and unloading conditions. However, few studies have investigated the dilatancy characteristics of rocks under true triaxial loading and unloading conditions. Therefore, in this study, we employed a true triaxial fluid-structure coupling system to investigate rock deformation mechanical properties at different stages under various loading and unloading conditions. It is worth noting that many deep underground rocks are subject to three-dimensional stress inequality due to tectonic stress. Under excavation stress, the rock mass often experiences unilateral or double-sided unloading, but most studies on rock mechanical properties by scholars at home and abroad are based on uniaxial or conventional triaxial tests, which cannot reflect the actual stress state of rock. Thus, the true triaxial test is more suitable for reflecting rock deformation and mechanical properties under different loading and unloading conditions. In this paper, we use the loading and unloading modes of always loading, always holding, and always unloading, which closely simulate actual engineering conditions, to simulate rock roadway driving. Moreover, we varied the loading and unloading rates to simulate different working conditions.
2. Test Device and Sample
The test system adopts the “true triaxial fluid-structure coupling test system,” independently developed by Yin and Li et al. [10,48]. The test device comprises a frame, true triaxial pressure chamber, loading system, inner seal seepage system, data measurement and acquisition system, acoustic emission test system, etc. The true triaxial pressure cell was designed to withstand loading force up to 6000 kN in the X direction and Z direction, 4000 kN in the Y direction and sealing pressure of 60 MPa, which meet test requirements and as shown in Figure 1.
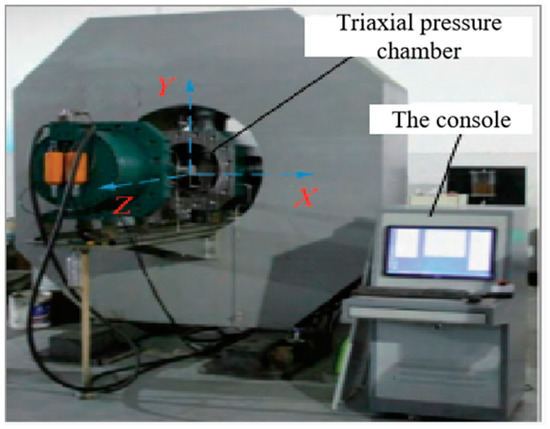
Figure 1.
True triaxial fluid-structure coupling test system and specimen.
The rock samples are taken from Yuwang Coal Mine of Huaneng Group, China, and the lithology is sandstone. True triaxial sandstone specimens are strictly prepared according to the International Society of Rock Mechanics standard. Young’s modulus E of sandstone is 10.6 GPA, Poisson’s ratio v of sandstone is 0.31, the porosity of the sandstone measured by mercury injection is 4.15%, and the pore diameter peak is between 100 nm and 500 nm. The apparent density is 2260 kg/m3, and the specimen is a cube specimen with a side length of 100 mm, and the flatness of the end face is controlled to 0.05 mm to reduce the influence of friction effect on the test.
3. Test Program
To study the mechanical properties and deformation characteristics of sandstone under different loading and unloading conditions, we conducted true triaxial mechanical tests at varying loading and unloading rates. The stress path is illustrated in Figure 2, and the direction of loading and unloading stress is shown in Figure 3. The tests were divided into two parts:
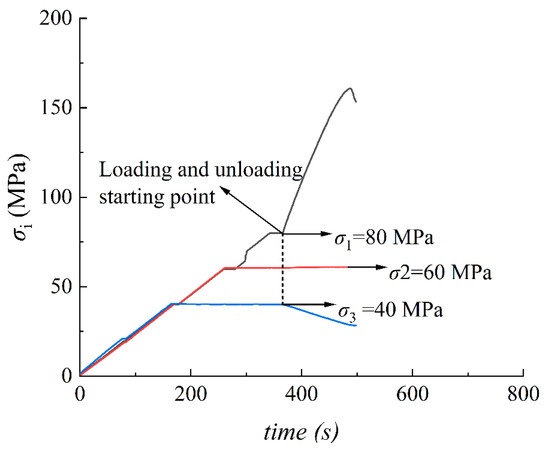
Figure 2.
Loading and unloading stress path.
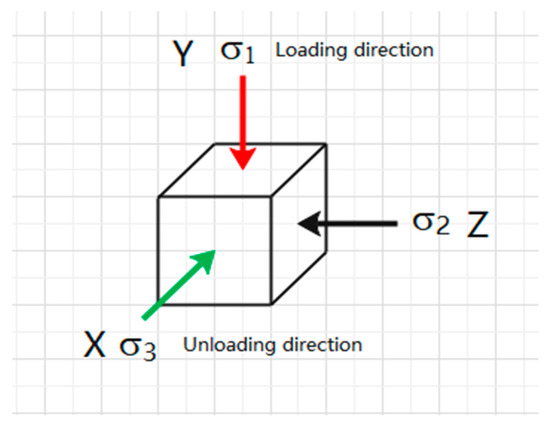
Figure 3.
Schematic diagram of loading and unloading direction.
- (1)
- Tests at different loading rates: load σ1, σ2, and σ3 to 40 MPa at a rate of 2 kN/s, load σ1 and σ2 to 60 MPa at a rate of 2 kN/s while σ3 remains unchanged, and load σ1 to 80 MPa at a rate of 2 kN/s while σ3 and σ2 remains unchanged. After maintaining the stress state (i.e., after loading and unloading starting point), unload σ3 at a constant 1 kN/s on one side, σ2 remains unchanged, and increase σ1 at different loading rates (displacement control mode) until sandstone sample failure. The experiment group is named group G, as shown in Table 1.
 Table 1. Loading and unloading rates were tested in each group.
 - (2)
- Tests at different loading rates: load σ1, σ2, and σ3 to 40 MPa at a rate of 2 kN/s, load σ1 and σ2 to 60 MPa at a rate of 2 kN/s while σ3 remains unchanged, and load σ1 to 80 MPa at a rate of 2 kN/s while σ3 and σ2 remains unchanged. After maintaining the stress state (i.e., after loading and unloading starting point), unload σ3 from one side at a constant unloading rate (force control mode), remain σ2 unchanged, and increase σ1 at a constant 0.003 mm/s until the sandstone sample failure. The experiment group is named group H, as shown in Table 1.
4. Experimental Results and Analysis
4.1. Mechanical Properties of Sandstone under True Triaxial Loading Rates
The stress-strain curves of sandstone under different loading conditions follow a consistent pattern. In this study, we focused on the stress-strain curves after the loading and unloading starting points to investigate the mechanical properties and deformation characteristics of sandstone under various loading rates. We observed that the pore fissures of sandstone were compacted during the initial stage of loading, but this compaction stage was not as pronounced in the stress-strain curve after unloading. Additionally, as shown in Figure 4a, we found that the peak maximum principal stress increased with the loading rate. In Figure 4b, it can be seen that sandstone specimen G1 started to expand at the beginning of loading, while the starting points of expansion for specimens G2, G3, G4, and G5 shifted backward and approached the yield strength point with increasing loading rates.
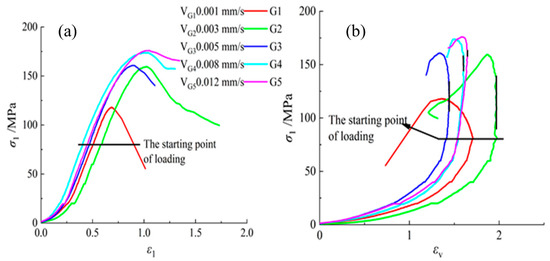
Figure 4.
Stress-strain characteristics curve under different loading conditions: (a) curves of maximum principal stress and maximum principal strain (b) curves of maximum primary stress and volumetric strain.
The stress-strain curves presented in Figure 4b demonstrate that sandstone undergoes volume expansion before macroscopic failure. Prior to the volume expansion, the lateral strain rate of sandstone was equivalent to the axial strain rate during a time period, known as the equal velocity deformation stage of ε1 + ε2 + ε3 = 0. The length of the black line segment in Figure 4b indicates the duration of the constant velocity deformation stage. The equal velocity deformation stage time for specimens G5, G4, G3, and G2 are 7.2 s, 18 s, 46.8 s, and 124.8 s, respectively. The length of the line segment decreases with an increase in loading rate, indicating a shorter isokinetic deformation stage before the onset of expansion and a quicker response time to the origin of expansion. For instance, the black line segment in the stress-strain curve of sandstone specimen G5 is relatively short, implying a swift entry into the dilatancy stage. Conversely, the black line segment in the sandstone specimen G2 is longer, which means it takes more time to reach the dilatancy stage.
The mechanical properties of rock are significantly affected by the development and evolution of cracks inside the rock. In this study, it was found that the pore cracks of the sandstone specimen were compressed and closed during the loading process. Building on the work of Martin and Chandler on the failure process of rocks, the stress-strain curve under true triaxial loading can be divided into three stages [49], as illustrated in Figure 5:
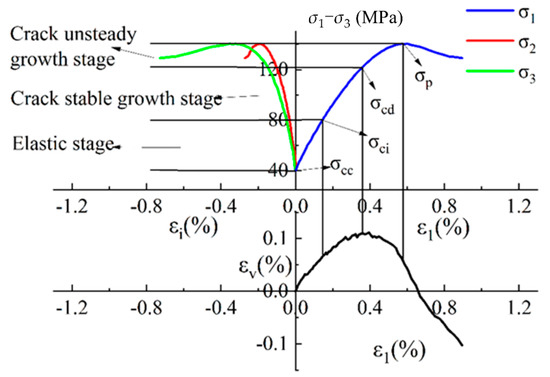
Figure 5.
Stress-strain characteristics curve and characteristic points.
- (1)
- Elastic deformation stage: the sandstone rapidly begins the elastic deformation stage with the loading of σ1 and unloading of σ3.
- (2)
- The stage of steady crack growth: with the loading time increase, σ1 reaches the crack initiation stress σci, and the crack increases gradually and enters the stage of steady crack growth.
- (3)
- The stage of fracture unstable propagation: with continuous loading of σ1 and unloading of σ3, the crack expands rapidly, and the volume expands. In this case, the corresponding axial stress is the damage stress σcd, which is the long-term strength of the rock.
Fracture initiation stress σci and damage stress σcd are crucial mechanical parameters for characterizing rock behavior. In this study, the strain measurement method is adopted to determine σcd and σci. Specifically, σcd is defined as the stress at the inflection point of the rock volume curve, where compression turns into expansion. On the other hand, σci is identified as the stress value at the endpoint of the horizontal section of the axial strain stiffness curve.
The failure of rocks is primarily caused by fracture propagation and structural damage due to increased deviatoric stress. In this study, we define σcip as the deviatoric stress at crack initiation, σcdp as the deviatoric stress at damage onset, and σfp as the peak deviatoric stress. Deviatoric stress is represented by σ1 − σ3, and the deviatoric stress-strain curve for the sandstone specimen G5 is shown in Figure 5, which also highlights the location of each characteristic point.
Table 2 presents the deviatoric stress at each characteristic point for different loading and unloading rates. As G1 experiences expansion at both loading and unloading starting points, the deviatoric stress at each feature point cannot be calculated. The table shows that increasing the loading rate has little effect on the damage deviatoric stress and peak deviatoric stress of the rock. In contrast, the crack initiation deviatoric stress increases with the loading rate, and this increase is more uniform. To better understand the influence of the increasing loading rate on deformation in the three stages, we propose a deviatoric stress deformation compliance Δq.
Table 2.
Eigenvalues of each pinpoint under loading conditions.
Among them, the deviant stress deformation compliance Δq is a physical quantity that reflects the rate of change of the rock deformation increment corresponding to the increase in deviant stress in each stage under loading conditions. It provides insights into the response rate of rock deformation to deviant stress in each stage. Δσk represents the difference in deviational stress at each stage, while Δεk represents the sum of the absolute strain values of the rock in each direction.
The Figure 6a shows that the deviatoric stress deformation compliance of sandstone increases with loading rate, with an inflection point in the unstable propagation stage of crack growth. At the stage of steady crack growth and fracture unstable propagation, the response of specimen G3 to deviatoric stress is weak, and the deviatoric stress deformation compliance increases evenly. G2 has a higher deviatoric stress deformation compliance than G3 due to its lower loading rate, which inhibits rock deformation. For G4 and G5, the increase rate of the deviatoric stress deformation compliance is greater than G2 at any stage, indicating that the response rate of rock deformation on deviatoric stress increases with loading rate. The increase in loading rate has little effect on rock deformation at the stages of elastic deformation and steady crack growth, while the high loading rate has little effect on rock deformation at the stage of fracture unstable propagation. The fitting results of sandstone specimens G2, G4, and G5 are in good agreement with exponential growth, while G3 is not.
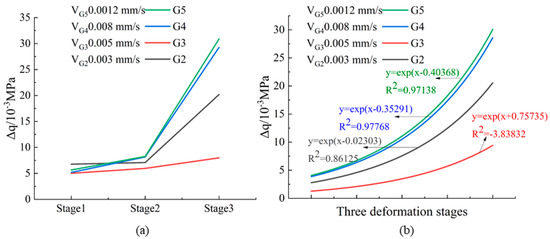
Figure 6.
Deformation compliance of deviational stress at each stage of the stress-strain curve: (a) variation law of deviatoric stress deformation compliance, (b) fitting curve of deviatoric stress deformation compliance index.
4.2. Mechanical Properties of Sandstone under True Triaxial Conditions with Different Unloading Rates
The stress-strain characteristics of rock under different true triaxial unloading rates exhibit a consistent trend, as depicted in Figure 7. Notably, the stress-strain curve during unloading exhibits a similar evolution to that during loading, with pore cracks compacted during the loading stage. Conversely, the post-peak stress-strain curve falls rapidly under different unloading rates, while the rock shows excellent plastic deformation under true triaxial loading conditions. The elastic modulus and peak stress of the rock during unloading decrease as the unloading rate increases, as the load-carrying capacity of the rock decreases as σ3 reduces. To better study the mechanical properties of rock under unloading conditions, the stress-strain curve after unloading is analyzed based on the unloading start point as the strained base point. The damage stress corresponds to the stress value at the inflection point of rock volume strain, as shown in the deviatoric stress-volume strain characteristics curve in Figure 8. When the unloading rate reaches 1 kN/s, the rock expands at the loading and unloading starting point, leading to rapid development of cracks. The variation in the curves in Figure 8 and Figure 9 is similar since the volumetric expansion is dominated by the strain in the direction of σ3. In addition, the strain in the direction of the minimum principal stress increases gradually, indicating that the increase in the unloading rate promotes inflation in this direction. Furthermore, Figure 10 shows that when the peak stress is reached, the intermediate principal stress direction experiences compression, with H3 and H5 exhibiting violent brittle failures.
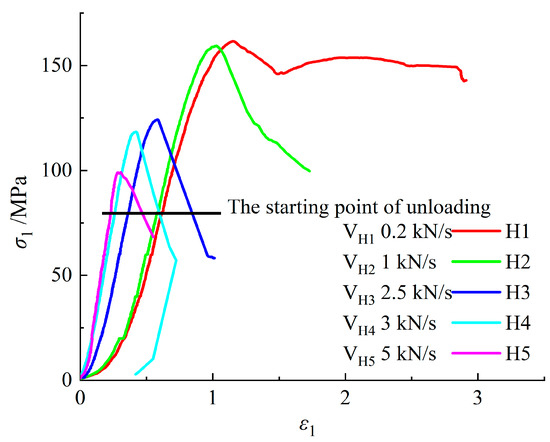
Figure 7.
Stress-strain characteristics curve under unloading condition.
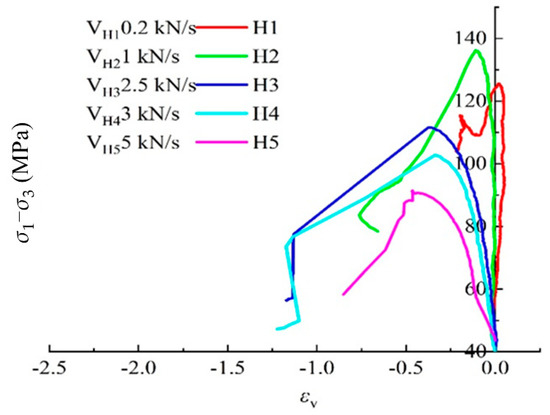
Figure 8.
Deviatoric stress-volume strain characteristics curve.
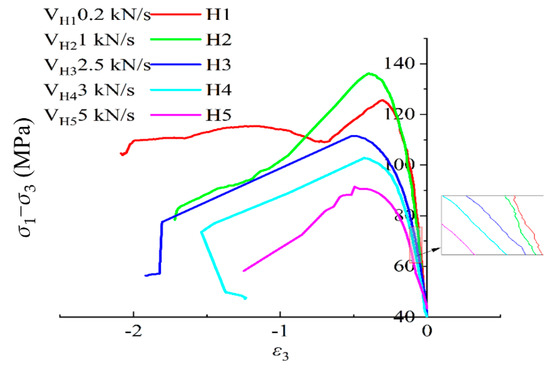
Figure 9.
Deviatoric stress-minimum principal strain characteristics curve.
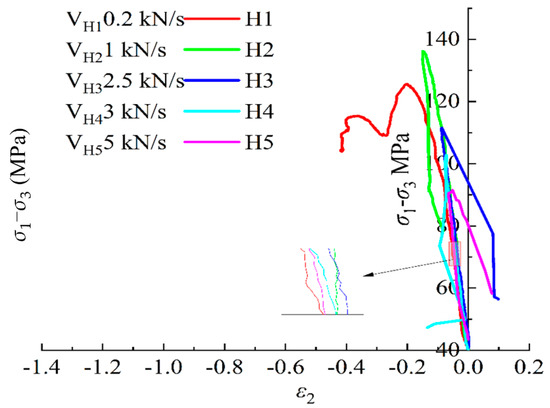
Figure 10.
Deviatoric stress-intermediate principal strain characteristics curve.
Brittleness of rock refers to its tendency to fail under minimal plastic deformation. A thorough investigation of the impact of unloading rate on rock brittleness can provide valuable insights into the mechanical behavior of sandstone under unloading conditions. In their study, Zhou et al. [50] proposed a quantitative approach to assess rock brittleness by considering the relative magnitude and absolute rate of post-peak stress drop in simple and complex stress states. They introduced a new brittleness index, B1, which was defined as follows:
B1 is the relative value of the post-peak stress drop, ranging from 0 to 1, σp is the peak stress, and σr is the residual stress. We redefine B2 based on the research of Zhou et al. (2014):
In the formula, B2 is the absolute rate of post-peak stress drop. According to the calculation of Kac(AC) by Zhou Hui et al., this paper should use Kac to calculate, and Kac is the absolute numerical value of the slope of the line between the peak strength point and residual strength point. Figure 11 is a calculation diagram of Kac(AC).
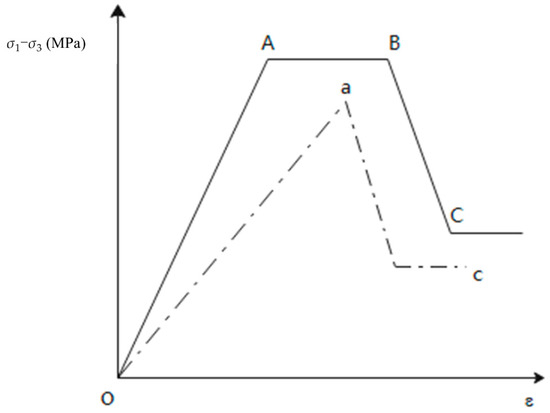
Figure 11.
Slope Kac (AC) selection diagram of a line from the yield starting point to the residual starting point.
Thus, the calculation formula Bd for the brittleness index is obtained.
In the formula, Bd represents the brittleness index, and a higher Bd value indicates a higher degree of brittleness. The variations of residual stress, peak strain, peak stress, and residual strain at different unloading rates are shown in Table 3, along with the corresponding brittleness indexes.
Table 3.
Residual stress-strain and peak stress-strain of rock Brittleness index of rock.
As shown in Table 3, the residual stress and strain decrease as the unloading rate increases. However, the brittleness index initially increases and then decreases, with the highest value observed for H3. Moreover, H3 and H5 exhibit high brittleness coefficients and significant compression in the intermediate principal stress direction. When the brittleness coefficient is low, the rock’s brittle failure is less severe, and the displacement in the intermediate principal stress direction is not compressed. These results suggest that the brittle failure of rocks under unloading conditions is closely related to the compression of strain after the peak of the deviatoric stress-intermediate principal strain characteristics curve. The displacement in the direction of the intermediate principal stress after the peaks of H4 and H1 did not compress, indicating that there was no severe brittle failure after the peak stress, and the brittleness index was relatively low.
Therefore, the brittle failure of rocks under different unloading rates is closely related to the intermediate principal strain, while there is no correlation between the unloading rate and the brittle failure of the rock.
4.3. Dilatancy Characteristics and Deformation Anisotropy of Rock under Different True Triaxial Loading and Unloading Conditions
4.3.1. Deformation Anisotropic Characteristics of Rocks
The phenomenon of anisotropy in rocks refers to the variation in physical and mechanical properties of the rock in different directions. In the case of sandstone under true triaxial loading and unloading conditions, the lateral strain difference (ε2-ε3) is defined as a parameter to analyze the mechanical properties of the rock [51]. Figure 12 and Figure 13 illustrate the difference between deviating stress and lateral strain under true triaxial loading and unloading conditions, respectively. These figures provide insights into the characteristic law of deformation anisotropy of sandstone under different loading and unloading conditions.
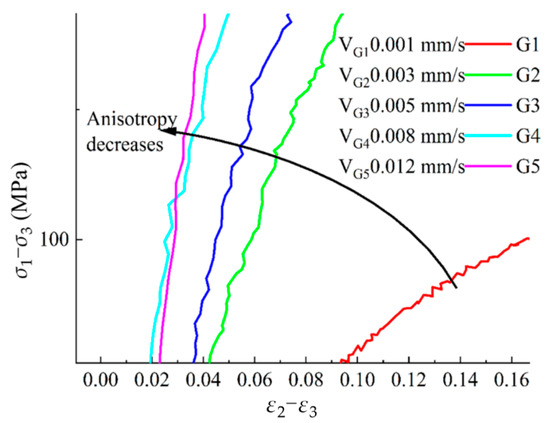
Figure 12.
Anisotropy characteristics of rock under different loading rates.
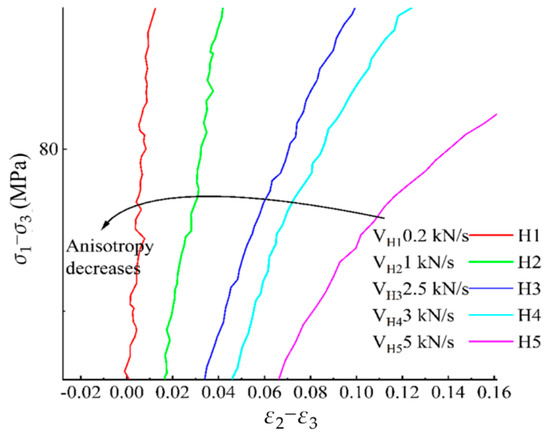
Figure 13.
Anisotropy characteristics of rock under different unloading rates.
Figure 12 shows that as the loading rate increases, the deformation anisotropy of sandstone weakens. Specifically, in specimens with low loading rates such as G1, the increase in deviatoric stress significantly affects the deformation characteristics of sandstone. However, in specimens with high loading rates such as G2, G3, G4, and G5, the increase in deviatoric stress has a lesser impact on the deformation anisotropy of sandstone. Moreover, the distance between anisotropic characteristic curves of sandstone deformation does not change significantly as the deviatoric stress increases gradually.
Figure 13 demonstrates that as the unloading rate decreases, the anisotropy of sandstone also weakens. For instance, in sandstone specimen H1 with low unloading rate, the increase in deviatoric stress has a minimal influence on the deformation characteristics of sandstone. Additionally, as the deviatoric stress gradually increases, the distance between anisotropic characteristic curves of sandstone deformation also increases gradually with the increase in unloading rate. In general, the increase in deviatoric stress enhances the deformation anisotropy of sandstone, but different loading and unloading rates have a more significant impact on the deformation anisotropy.
4.3.2. Dilatancy Characteristics
During the unstable propagation stage of fracture, sandstone undergoes rapid lateral deformation, which results in an expansion of its volume. This change in volume causes the rock’s volumetric strain state to shift from compression to tension. This transition is indicated by an inflection point in the axial strain-volumetric strain characteristics curves, which can be seen in Figure 5. This inflection point marks the beginning of the volumetric expansion stage of sandstone.
To further investigate the impact of loading and unloading rates on the mechanical properties of sandstone during the dilatation stage, a fitting analysis was conducted to determine the relationship between volumetric strain and time from the start of dilatation to the peak stress point. This analysis provides valuable insight into the behavior of sandstone during this critical stage of deformation, allowing for a more comprehensive understanding of its mechanical properties.
Figure 14a displays the fitted curve of volumetric strain and time under loading conditions. Here, εv − εvi represents the difference between the volumetric strain at each moment and the volumetric strain at the starting point of expansion, and t − ti represents the difference between the time at each moment and the time at the starting point of expansion. Here, εvi and ti represent the volumetric strain and time at the starting point of expansion. As shown in the figure, the relationship between volume and time under the condition of loading is a quadratic polynomial, namely:
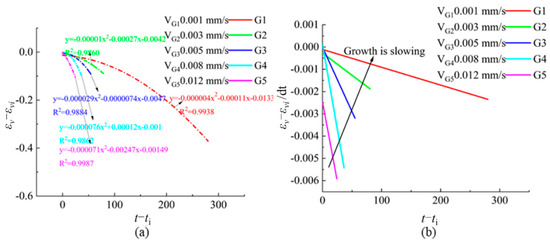
Figure 14.
(a) fitting curve of volumetric strain and time under loading condition; (b) volumetric strain rate changes with time in dilatancy stage under loading condition.
In Equation (5), a, b and c are fitting coefficients. By taking the derivative of Equation (5), the relationship between the volumetric strain rate of rock and time can be obtained:
Based on Equation (6), Figure 14b illustrates the relationship between the volumetric strain rate and time during the dilatancy stage under true triaxial loading conditions. As observed in Figure 14b, the volumetric strain rate of the rock during dilatancy increases with time under loading conditions. Moreover, as the loading rate increases, the expansion time of sandstone decreases, leading to an accelerated growth rate of the volumetric strain rate and an increase in its maximum numerical value. This is attributed to the fact that an increase in loading rate reduces the bearing capacity of the rock at a faster rate, which ultimately results in a faster expansion of the rock.
However, sandstone subjected to low loading rates exhibit low and roughly equal initial volume strain rates. Conversely, sandstone specimen G5 experiences an initial volume strain rate that is higher than the initial volume strain rates of the remaining sandstone specimens by a factor of 10–20, and even higher than that of sandstone specimen G3, which experiences an initial volume strain rate that is 333 times lower. This behavior can be attributed to the rapid expansion of the crack of sandstone during the initial stages of loading. Additionally, the limitation of σ2 and σ3 on lateral strain is restricted, and the lateral volume expansion, caused by the instantaneous increase in stress in the σ1 direction, surpasses the limitations of σ2 and σ3 on lateral volume expansion. Simultaneously, the mechanical properties of sandstone deteriorate rapidly with increasing time, further contributing to the rapid increase in the volume expansion rate of sandstone G5, and leading to the appearance of macro damage at a faster rate. Moreover, before the expansion phase, sandstone subjected to high loading rates generates more cracks. Consequently, when the bearing capacity of the sandstone decreases to a certain extent, the cracks begin to expand rapidly, leading to a larger volumetric strain rate at the starting point of expansion.
To better comprehend the impact of loading and unloading rates on rock dilatancy, we propose the dilatancy characteristic relation:
where M is the rock expansion capacity induced by unit deviatoric stress at each moment of the expansion stage. In addition, M is a variable used to reflect the dilatancy change law of sandstone under deviatoric stress in the dilatancy stage, which can reflect the dilatancy of rock under the action of deviatoric stress at every moment.
σv − σvi is the difference between the deviatoric stress at each time, the deviatoric stress at the starting point of expansion, and σvi is the deviatoric stress at the starting point of expansion. Figure 15 shows the relation curve between deviatoric stress and time in the expansion stage. It can be found from Figure 15 that the relation between deviator stress difference and time is a quadratic polynomial, namely:
where a1, b1 and c1 are fitting coefficients. According to the fitting results in Figure 14a and Figure 15, the relationship between the expansion characteristic index and time under different loading rates can be obtained from the characteristic relation Equation (7). According to the relationship between M and t, Figure 16 is drawn.
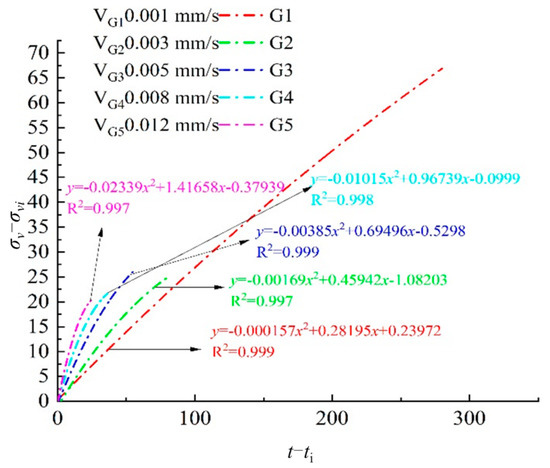
Figure 15.
Deviatoric stress-time curve under different loading rates during expansion.
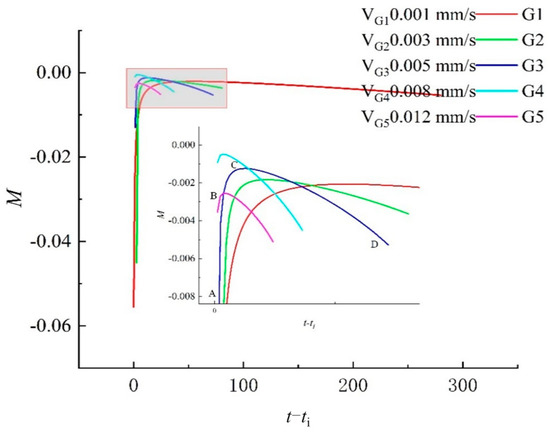
Figure 16.
Deviatoric stress-induced dilatability-time relation curve under different loading rates.
Figure 16 reveals the relationship between rock dilation and deviatoric stress, showing the expansion capacity of rock at different times during the expansion stage and the corresponding evolution pattern. At the onset of expansion, the M value drops sharply and then starts to increase at a constant rate. The entire expansion stage of rock under true triaxial loading can be divided into three stages, as illustrated by sandstone specimen G3:
Stage A–B represents the instant crack propagation stage: Prior to expansion, the rock accumulated multiple micro-cracks that rapidly expanded at the moment of expansion, resulting in a significantly higher M value at point A compared to the rest of the expansion stage. Over time, the M value drops rapidly because of the transient growth of micro-cracks. At this stage, the M value decreases with increasing loading rate.
Stage B–C represents the weakened expansion ability stage: As time passes, after the micro-cracks have expanded, the M value begins to decrease slowly, and the expansion capacity slowly decreases until it reaches the lowest point at C. At this lowest point, the M value decreases with increasing loading rate.
Stage C–D represents the enhanced expansion ability stage: Once the M value drops to the lowest point, it starts to rebound and increase over time. Notably, the slope of the C–D section increases with increasing loading rate, indicating that the rock still has a certain bearing capacity.
Furthermore, under different loading rates, the expansion stage duration weakens. Stage A–B is completed instantly, while stage B–C takes the least time, and stage C–D occupies the entire expansion process.
Figure 17a mapped the volume strain under unloading conditions and the fitting curve of time, from which it can be seen that the relationship between time and volume strain of the expansion stage under unloading conditions conforms to the quadratic term of change. Therefore, using the same way under unloading conditions, the expansion phase of the volumetric strain rate is calculated.
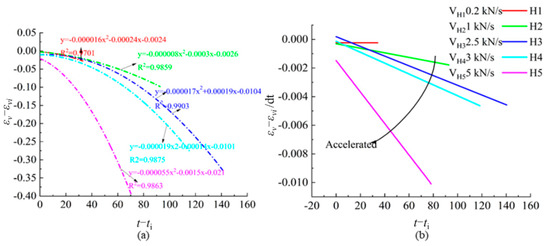
Figure 17.
(a) fitting curve of volumetric strain and time under unloading condition (b) volumetric strain rate changes with time during dilatation under unloading condition.
In Figure 17b, it can be observed that when the unloading rate is 0.2 kN/s, the volumetric strain rate remains constant during the expansion process. This is because the lateral volume expansion caused by σ1 is not significant, and the slow unloading in the direction of σ3 enhances the bearing capacity of the sandstone. Even though there is some lateral volume expansion, the bearing capacity of the sandstone can still restrict the lateral volume expansion when the unloading rate is not sufficiently high. However, as time progresses, the volumetric strain rate increases, and with the increase in the unloading rate, the expansion time of the sandstone first increases and then decreases, and the volumetric strain growth rate accelerates. Sandstone H5 shows a more pronounced effect during the expansion stage, and rapid unloading decreases the carrying capacity of the rock. Consequently, the lateral volume expansion rate of the rock reaches a very high numerical value during a short period, leading to macro damage that occurs faster than in H2, H3, and H4. The results indicate that the expansion of rock can still be inhibited by the loading capacity of the rock at a lower unloading rate. However, it can only be promoted when the unloading rate increases to a certain value.
Figure 18 shows the relation curve between deviatoric stress and time in the expansion stage. It can be seen from Figure 18 that the relation between deviator stress difference and time is a quadratic polynomial, namely:
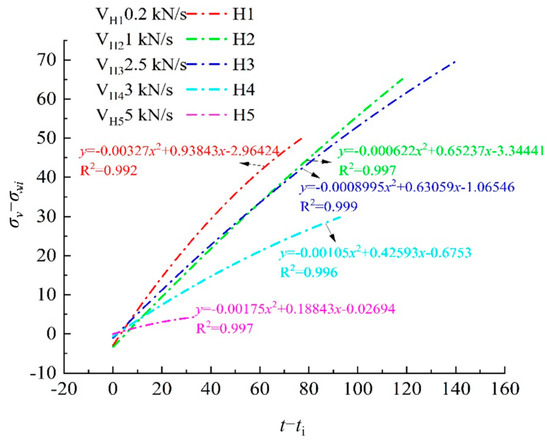
Figure 18.
Deviatoric stress-time curve under different unloading rates during expansion.
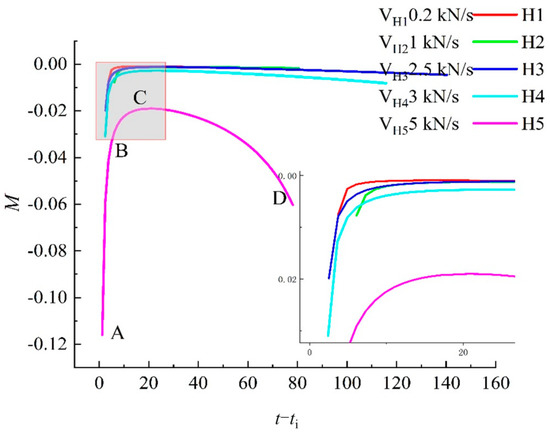
Figure 19.
Deviatoric stress-induced dilatability-time relation curve under different unloading rates.
From Figure 19, it is evident that the expansion capacity of rock at different times during the expansion stage, as well as the change in this capacity with time, is affected by deviatoric stress. Based on our analysis, the entire expansion stage of rock under varying rates of loading in the true triaxial condition can be divided into three smaller stages, taking H5 as an example:
The first stage (A–B) is characterized by instant crack propagation. At the initiation point A, the M value reaches its maximum and is significantly higher than in the other two stages. Additionally, as the unloading rate increases, the M value at point A also increases. Sandstone H5 exhibits greater deformation compared to other specimens during this moment of expansion. At this time, the bearing capacity of sandstone H5 is considerably lower than that of other sandstone specimens.
The second stage (B–C) is the stage where expansion ability weakens. As time progresses and microcracks expand, the M value gradually decreases, resulting in a slow reduction in the expansion capacity until the lowest point C. At this point, the M value increases with the unloading rate.
In the third stage (C–D), the expansion ability is related to the unloading rate. In contrast to the loading condition, where the unloading rate is low, the M value remains constant with time. As depicted in the figure, the unloading rate does not affect the M value, and specimens H1, H2 and H3 exhibit similar behavior during this stage. However, the M value will increase with time only when the unloading rate exceeds a certain threshold.
Under different unloading rates in the true triaxial, a low unloading rate has little effect on sandstone expansion during the whole stage. However, when the unloading rate increases to 5 kN/s, there is a big difference, and the curve at this time is more similar to the curve under the loading rate.
5. Discussion
Under true triaxial loading and unloading conditions, an increase in compressive stress enhances the deformation anisotropy of sandstone, but the loading and unloading rates have a more significant impact on the deformation anisotropy. Specifically, as the loading rate increases, the deformation anisotropy weakens, while a decrease in the unloading rate also weakens the anisotropy of sandstone.
The behavior of sandstone during the dilatancy stage is significantly influenced by loading rates. As the loading rate increases, the expansion time of sandstone decreases, leading to an accelerated growth rate of the volumetric strain rate and an increase in its maximum numerical value. Sandstone subjected to low loading rates exhibits low and roughly equal initial volume strain rates, while sandstone subjected to high loading rates generates more cracks and has a larger volumetric strain rate at the starting point of expansion.
Overall, these mechanisms help us better understand and predict the mechanical properties and behavior of sandstone under different loading and unloading conditions. This has important implications for understanding and predicting the behavior of rocks in geological and engineering applications.
6. Conclusions
The mechanical properties of sandstone under true triaxial conditions are influenced by various loading and unloading rates. In this study, we conducted true triaxial mechanical tests on sandstone using a fluid-structure coupling test system. Our test results revealed the following effects of different loading and unloading rates on sandstone’s mechanical properties:
Firstly, under different loading rates, crack initiation stress σci decreases with the loading rate, while damage stress σcd and peak stress σf remain unchanged. Furthermore, the constant velocity deformation stage before expansion is shortened. We also analyzed the introduction of deviatoric stress deformation of the true triaxial unloading compliance during the deformation process. Overall, the deviatoric stress deformation compliance rises with an increase in loading rate, with a significant difference appearing only at the stage of fracture unstable propagation. Additionally, the mechanical properties of sandstone deteriorate rapidly with time, leading to faster volume expansion rates and macro damage for sandstone G5.
Secondly, under different unloading rates, sandstone’s curve falls rapidly after the peak, indicating strong brittleness. Residual stress and residual strain decrease with an increase in the unloading rate, and brittleness is related to the principal intermediate strain when rock is broken. Furthermore, the brittleness index increases with an increase in the principal intermediate strain. At lower unloading rates, rock dilatation can still be inhibited by the loading capacity of rock, but it can be promoted only when the unloading rate increases to a certain value.
Thirdly, the anisotropy of rock deformation weakens with an increase in loading time, causing expansion time to decrease and volumetric strain rate to accelerate. Conversely, the anisotropy of rock deformation strengthens with an increase in unloading rate, causing expansion time to first increase and then decrease, and volumetric strain rate to accelerate.
Lastly, rock dilatation under true triaxial conditions can be divided into three stages, with different dilatation laws under different loading and unloading rates. The ability to expand under loading conditions increases with time, whereas under unloading conditions, the capacity expansion remains unchanged when the unloading rate is low and is related to the unloading rate when it is high.
In conclusion, this study provides valuable insights into the effects of different loading and unloading rates on sandstone’s mechanical properties under true triaxial conditions.
Author Contributions
Investigation, Y.W.; Writing—original draft, W.D.; Writing—review & editing, B.Y.; Funding acquisition, D.Z. All authors have read and agreed to the published version of the manuscript.
Funding
The National Natural Science Foundation of China (51874053, 52064016) and the Scientific Research Foundation of the State Key Laboratory of Coal Mine Disaster Dynamics and Control (2011DA105287-zd201804).
Data Availability Statement
The experimental data supporting the conclusions are available from the corresponding author on request.
Acknowledgments
This study was financially supported by the National Natural Science Foundation of China (51874053, 52064016) and the Scientific Research Foundation of the State Key Laboratory of Coal Mine Disaster Dynamics and Control (2011DA105287-zd201804).
Conflicts of Interest
No, I declare that the authors have no competing interest as defined by Sustainability, or other interest that might be perceived to influence the results and/or discussion reported in this paper.
References
- He, M.C.; Xie, H.P.; Peng, S.L.; Jiang, Y.D. Study on rock mechanics in deep mining engineering. Chin. J. Rock Mech. Eng. 2005, 16, 2803–2813, (In Chinese with English abstract). [Google Scholar]
- Gao, M.Z.; Ye, S.Q.; Yang, B.G.; Liu, Y.T.; Li, J.H.; Liu, J.J.; Xie, H.P. Research progress of deep in-situ rock mechanics. China Sci. Found. 2021, 6, 895–903, (In Chinese with English abstract). [Google Scholar] [CrossRef]
- Guo, Y.T.; Yang, C.H. Experimental investigation on strength and deformation properties of anhydrite under conventional triaxial compression. Rock Soil Mech. 2010, 35, 1776–1780, (In Chinese with English abstract). [Google Scholar] [CrossRef]
- Huo, L.; Yang, C.H.; Liu, J.; Mao, H.J.; Huang, W.G. Experimental Research on the Failure of Mudstone Cap Rock of Western HubeiEastern Chongqing Suffered Uplift and Erosion. Chin. J. Undergr. Space Eng. 2018, 14, 33–42, (In Chinese with English abstract). [Google Scholar]
- Zhou, H.W.; Xie, H.P.; Zuo, J.; Du, S.; Man, K.; Yan, C.Y. Experimental study of the effect of depth on mechanical parameters of rock. Chin. Sci. Bull. 2010, 55, 3276–3284, (In Chinese with English abstract). [Google Scholar]
- Xie, H.P.; Gao, M.Z.; Fu, C.; Lu, Y.Q.; Yang, M.Q.; Hu, J.J.; Yang, B.G. Mechanical behavior of brittle-ductile transition in rocks at different depths. J. China Coal Soc. 2021, 46, 701–715, (In Chinese with English abstract). [Google Scholar] [CrossRef]
- Xie, H.P.; Lu, J.; Li, C.B.; Li, M.H.; Gao, M.Z. Experimental study on the mechanical and failure behaviors of deep rock subjected to true triaxial stress: A review. Int. J. Min. Sci. Technol. 2022, 32, 915–950. [Google Scholar] [CrossRef]
- Liu, J.; Zhang, L.M.; Cong, Y.; Wang, Z.Q. Research on the mechanical characteristics of granite failure process under true triaxial stress path. Rock Soil Mech. 2021, 42, 2069–2077, (In Chinese with English abstract). [Google Scholar] [CrossRef]
- Yin, G.Z.; Ma, B.; Liu, C.; Li, M.H.; Li, J. Effect of loading and unloading rates on mechanical properties and energy characteristics of sandstone under true triaxial stress. J. China Coal Soc. 2019, 42, 454–462, (In Chinese with English abstract). [Google Scholar] [CrossRef]
- Li, M.; Yin, G.; Xu, J.; Li, W.; Song, Z.; Jiang, C. A Novel True Triaxial Apparatus to Study the Geomechanical and Fluid Flow Aspects of Energy Exploitations in Geological Formations. Rock Mech. Rock Eng. 2016, 49, 4647–4659. [Google Scholar] [CrossRef]
- Zhao, H.G.; Song, Z.L.; Zhang, D.M.; Liu, Y.B. True triaxial experimental study on mechanical characteristics and energy evolution of sandstone under various loading and unloading rates. Geomech. Geophys. Geo-Energy Geo-Resour. 2021, 7, 1–17. [Google Scholar] [CrossRef]
- Zhang, J.W.; Fan, W.B.; Song, Z.X.; Huo, Y.H.; Ding, L.J. Mechanical characteristics of deep sandstone under true triaxial stress paths. J. China Univ. Min. Technol. 2021, 50, 106–114, (In Chinese with English abstract). [Google Scholar] [CrossRef]
- Hu, J.; He, M.C.; Li, Z.H.; Feng, J.L. Experimental study of strain rockburst of anisotropic bedded sandstone. J. China Univ. Min. Technol. 2021, 48, 735–741, (In Chinese with English abstract). [Google Scholar] [CrossRef]
- Zhang, K.; Zhou, H.; Pan, P.Z.; Shen, L.F.; Feng, X.T. Characteristics of strength of rocks under different unloading rates. Rock Soil Mech. 2010, 31, 2072–2078, (In Chinese with English abstract). [Google Scholar] [CrossRef]
- He, M.C.; Miao, J.L.; Li, J.D.; Wang, C.G.W. Experimental study on rockburst process of deep granite samples. Chin. J. Rock Mech. Eng. 2007, 5, 865–876, (In Chinese with English abstract). [Google Scholar]
- Qiu, S.L.; Feng, X.T.; Zhang, C.Q.; Zhou, H. Experimental study on mechanical properties of deep buried marble under different unloading rates of confining pressure. Chin. J. Rock Mech. Eng. 2010, 29, 1807–1817, (In Chinese with English abstract). [Google Scholar]
- Guo, J.Q.; Huang, W.F.; Liu, X.R.; Chen, J.X.; Jiang, J.G. Rock dilatancy criterion based on releasable strain energy. J. China Coal Soc. 2019, 44, 2094–2102, (In Chinese with English abstract). [Google Scholar]
- Hou, W.S.; Li, S.D.; Li, X.; He, H.M.; Pan, L.; Liu, Y.H.; Wang, R.Q. Comparison between initial and peak dilatancy characteristics of rock. J. Geotech. Eng. 2013, 35, 1478–1485, (In Chinese with English abstract). [Google Scholar]
- Zhang, W.L.; Feng, M.; Jiang, Y. Study on Triaxial Compression Test of Sandstone Dilatancy Based on PFC3D. Coal Technol. 2019, 38, 23–25, (In Chinese with English abstract). [Google Scholar]
- Cong, Y.; Cong, Y.; Zhang, L.M.; Jia, L.X. 3D particle flow simulation of loading-unloading failure process of marble. Rock Soil Mech. 2019, 40, 1179–1186+1212, (In Chinese with English abstract). [Google Scholar]
- Li, X.B.; Chen, Z.H.; Weng, L.; Li, C.J. Unloading responses of pre-flawed rock specimens under different unloading rates. Trans. Nonferrous Met. Soc. China 2019, 29, 1516–1526, (In Chinese with English abstract). [Google Scholar] [CrossRef]
- Li, Z.Y.; Wu, P.; Jiang, D.Y.; Xiao, F.; Liu, W. Study on True Triaxial Mechanical Characteristics with Hole Defects of Sandstone. Chin. J. Undergr. Space Eng. 2022, 18, 120–128, (In Chinese with English abstract). [Google Scholar]
- Kang, D.A.; Wei, W.B. Unloading-induced failure of brittle rock and implications for excavation-induced strain burst—ScienceDirect. Tunn. Undergr. Space Technol. 2019, 84, 495–506. [Google Scholar]
- Zhao, Y.; Bi, J.; Wang, C.; Liu, P. Effect of Unloading Rate on the Mechanical Behavior and Fracture Characteristics of Sandstones Under Complex Triaxial Stress Conditions. Rock Mech. Rock Eng. 2021, 54, 4851–4866. [Google Scholar] [CrossRef]
- Dai, B.; Zhao, G.; Dong, L.; Yang, C. Mechanical Characteristics for Rocks under Different Paths and Unloading Rates under Confining Pressures. Shock. Vib. 2015, 1, 1–8. [Google Scholar] [CrossRef]
- Li, J.Z.; Lin, F.; Zhang, Z. Triaxial Experimental Study on Changes in the Mechanical Properties of Rocks Under Different Rates of Confining Pressures Unloading. Soil Mech. Found. Eng. 2019, 56, 246–252. [Google Scholar] [CrossRef]
- Huang, X.; Liu, Q.S.; Liu, B.; Liu, X.; Pan, Y.; Liu, J. Experimental Study on the Dilatancy and Fracturing Behavior of Soft Rock Under Unloading Conditions. Int. J. Civ. Eng. 2017, 15, 921–948. [Google Scholar] [CrossRef]
- Hu, X.W.; Yi, X.J.; Wang, S.Y.; Huang, R.Q. Experimental study on mechanical properties of red sandstone under different triaxial stress paths. Hydrogeol. Eng. Geol. 2009, 36, 57–61. [Google Scholar]
- Young, R.P.; Nasseri, M.H.B. The effect of true-triaxial stress path on induced fracturing in anisotropic gneiss. In Proceedings of the ISRM 2nd International Conference on Rock Dynamics, Suzhou, China, 18–19 May 2016. [Google Scholar]
- Yin, G.Z.; Lu, J.; Li, X.; BIan, G.; Song, Z.L.; Liu, Y.B. Influence of intermediate principal stress on dilatancy and strength characteristics of sandstone. J. China Coal Soc. 2017, 42, 879–885, (In Chinese with English abstract). [Google Scholar] [CrossRef]
- Wu, G. Comparative analysis of failure effect of rock mass under loading and unloading conditions. Rock Soil Mech. 1997, 2, 13–16, (In Chinese with English abstract). [Google Scholar] [CrossRef]
- Du, K. Fracture Characteristics of Deep Rock Mass under True Triaxial Unloading and Mechanism of Induced Rockburst; Central South University: Changsha, China, 2013; (In Chinese with English abstract). [Google Scholar]
- Chu, Y.P.; Sun, H.; Zhang, D.M. Experimental study on evolution in the characteristics of permeability, deformation, and energy of coal containing gas under triaxial cyclic loading-unloading. Energy Sci. Eng. 2019, 7, 2112–2123. [Google Scholar] [CrossRef]
- Wen, T.; Tang, H.M.; Fan, Z.Q.; Cai, Y.; Wang, J.D. Mechanical properties and unloading constitutive model of Padong Formation rocks. J. China Univ. Min. Technol. 2018, 47, 768–779, (In Chinese with English abstract). [Google Scholar] [CrossRef]
- Jia, P.; Yang, N.; Liu, D.; Liu, D.; Wang, S.; Zhao, Y.; Tong, X. Failure mechanism of combined rock under true triaxial loading and unloading conditions. J. Cent. South Univ. (Nat. Sci. Ed.) 2021, 52, 2867–2875. [Google Scholar]
- Liang, Y.; Ran, Q.; Zou, Q.; Hong, Y. Experimental Study of Mechanical Behaviors and Failure Characteristics of Coal Under True Triaxial Cyclic Loading and Unloading and Stress Rotation. Nat. Resour. Res. 2022, 31, 971–991. [Google Scholar] [CrossRef]
- Chen, G.Q.; Liu, D.; Xu, P.; Qin, C.A. Experimental study on true triaxial excavation unloading of jointed rock bridge. Chin. J. Rock Mech. Eng. 2018, 37, 325–328, (In Chinese with English abstract). [Google Scholar]
- Fan, P.X.; Li, Y.; Zhao, Y.T.; Wang, M.Y.; Wang, D.R.; Shi, H.J. Experimental study on unloading failure strength characteristics of red sandstone. Chin. J. Rock Mech. Eng. 2018, 37, 852–861, (In Chinese with English abstract). [Google Scholar]
- Ma, X.; Rudnicki, J.W.; Haimson, B.C. The application of a Matsuoka-Nakai-Lade-Duncan failure criterion to two porous sandstones. Int. J. Rock Mech. Min. Sci. 2017, 92, 9–18. [Google Scholar] [CrossRef]
- Ma, X.; Haimson, B.C.; Rudnicki, J.W. True triaxial failure stress and failure plane of two porous sandstones subjected to two distinct loading paths. Porous Rock Fract. Mech. 2017, 285–307. [Google Scholar]
- Miao, J.L.; He, M.C.; Li, D.J.; Zeng, F.J.; Zhang, Q. Acoustic emission characteristics and fracture mechanism of granite strain rock burst. Chin. J. Rock Mech. Eng. 2009, 28, 1593–1603, (In Chinese with English abstract). [Google Scholar]
- Gong, Q.M.; Yin, L.J.; Wu, S.Y.; Zhao, J.; Ting, Y. Rock burst and slabbing failure and its influence on TBM excavation at headrace tunnels in Jinping II hydropower station. Eng. Geol. 2012, 124, 98–108. [Google Scholar] [CrossRef]
- Zhao, X.; Wang, J.; Cai, M.; Cheng, C. Influence of Unloading Rate on the Strainburst Characteristics of Beishan Granite Under True-Triaxial Unloading Conditions. Rock Mech. Rock Eng. 2014, 47, 467–483. [Google Scholar] [CrossRef]
- Zhao, X.G.; Cai, M. Influence of specimen height-to-width ratio on the strainburst characteristics of Tianhu granite under true-triaxial unloading conditions. Can. Geotech. J. 2014, 52, 890–902. [Google Scholar] [CrossRef]
- Huang, L.; Liang, J.; Ma, J.; Chen, W. A dynamic bounding surface plasticity damage model for rocks subjected to high strain rates and confinements. Int. J. Impact Eng. 2022, 168, 104306. [Google Scholar] [CrossRef]
- Ma, J.; Yin, P.; Huang, L.; Liang, Y. The application of distinct lattice spring model to zonal disintegration within deep rock masses. Tunn. Undergr. Space Technol. 2019, 90, 144–161. [Google Scholar] [CrossRef]
- Huang, L.; Liang, J.; Ma, J.; Yang, H.; Gui, Y. Spherical cavity expansion in porous rock considering plasticity and damage. Int. J. Numer. Anal. Methods Geomech. 2021, 45, 2235–2259. [Google Scholar] [CrossRef]
- Yin, G.Z.; Li, M.H.; Xu, J.; Wang, W.Z.; Li, W.P.; Li, X.; Song, Z.L.; Deng, B.Z. Development and application of multifunctional true triaxial fluid-structure coupling test system. J. Rock Mech. Eng. 2015, 34, 2436–2445. [Google Scholar]
- Martin, C.D.; Chandler, N.A. The progressive fracture of Lac du Bonnet granite. Int. J. Rock Mech. Min. Sci. Geomech. Abstr. 1994, 31, 643–659. [Google Scholar] [CrossRef]
- Zhou, H.; Meng, Z.F.; Zhang, C.Q.; Lu, J.J. Quantitative evaluation method of rock brittleness characteristics based on stress-strain curve. Chin. J. Rock Mech. Eng. 2014, 33, 1114–1122, (In Chinese with English abstract). [Google Scholar] [CrossRef]
- Li, Z.L. Study on Mechanical Properties and FailureMechanism of Rock under True TriaxialLoading and Unloading Conditions. Ph.D. Thesis, China University of Mining and Technology, Xuzhou, China, 2015. (In Chinese with English abstract). [Google Scholar]


Disclaimer/Publisher’s Note: The statements, opinions and data contained in all publications are solely those of the individual author(s) and contributor(s) and not of MDPI and/or the editor(s). MDPI and/or the editor(s) disclaim responsibility for any injury to people or property resulting from any ideas, methods, instructions or products referred to in the content. |
© 2023 by the authors. Licensee MDPI, Basel, Switzerland. This article is an open access article distributed under the terms and conditions of the Creative Commons Attribution (CC BY) license (https://creativecommons.org/licenses/by/4.0/).