Article

Optimization of Recharge Schemes for Deep Excavation in the Confined Water-Rich Stratum

1
College of Civil Engineering and Architecture, Guangxi University, Nanning 530004, China
2
School of Civil and Architectural Engineering, East China University of Technology, Nanchang 330013, China
*
Author to whom correspondence should be addressed.
Sustainability 2023, 15(6), 5432; https://doi.org/10.3390/su15065432
Submission received: 23 February 2023 / Revised: 13 March 2023 / Accepted: 14 March 2023 / Published: 20 March 2023

Abstract

:
With the excavation of a metro station in a confined water-rich stratum as our background, the sensitivity of four typical recharge parameters is analyzed by using numerical simulation. Based on the orthogonal analysis method, an optimal recharge scheme was obtained. The results show that the main influential factors of ground settlement and groundwater recovery are recharge pressure and recharge depth. The main influential factor of retaining structure deformation and influence radius of recharge is the distance between the recharge wells and the foundation pit. For the groundwater recharging of a deep excavation in the water-rich confined area of Jinan, China, the optimal effect can be achieved when setting recharge wells with a depth of 50 m arranged in a line with a spacing of 10 m at a horizontal distance of 20 m away from the retaining wall and recharge pressure is 40 kPa. With the same construction difficulty, the maximum settlement in optimized scheme decreased 71.19%, the flux of groundwater recovery increased 11.96%, the maximum horizontal displacement of the wall decreased 15.61%, and the influence radius of recharge enlarged 8.62% compared to original scheme.

1. Introduction

When a deep excavation is carried out in a confined water-rich stratum, dewatering in the confined aquifer is necessary to ensure a dry construction environment and meet safety needs. Obviously, dewatering in deep excavation projects will induce groundwater level drops, which is likely to cause excessive ground settlement [1,2,3]. To minimize and eliminate groundwater drawdown and ground settlement caused by pumping, groundwater recharge can be adopted [4,5,6], which injects the water into the aquifer through the recharge well. However, the unreasonable recharge scheme not only increases the economic cost, but also results in horizontal deformations of the retaining structure of foundation pit due to the seepage force and water pressure brought by recharge [7,8]. For this reason, studying the influence of different recharge parameters on the deep excavation engineering and optimizing the groundwater recharge scheme has important engineering guiding significance.
Currently, studies about groundwater recharge applied in deep excavation have focused on controlling ground settlement. Pumping will reduce the pore pressure and increase the effective stress, resulting in soil consolidation [9,10,11]. On the contrary, injecting will reduce the effective stress and lead to soil swelling [12,13,14]. Liu et al. analyzed the stress paths of aquitard in association with discharge and recharge, they introduced the influence zone of recharge on relieving vertical deformation [15]. Zeng et al. developed a method referred to as the combined recharge to relieve settlement during the old recharge wells rebuild [16], whereas the combined recharge may cause large amounts of soil swelling in the protected area around the top of recharged aquifer [13]. Zheng et al. numerically and experimentally studied the influence of recharge opening time and recharge rate on surface settlement [17,18]. Several scholars studied recovering the groundwater level and alleviating groundwater overexploitation by recharge activities. Guo et al. carried out field tests to prove the feasibility of injecting the pumped water, and they derived the calculation method of discharge rate under the combination of pumping and recharge activities [19]. Zhang et al. established a formula to evaluate recharge efficiency and they found that the drawdown rises with the increase of the injection rate [20]. Cao et al. found that pressurized recharge is more efficient compared with natural recharge; it can effectively compensate for the loss of groundwater resources [21]. Zhang et al. developed a laboratory seepage test device to study the influence of recharge well spacing on drawdown [22]. Moreover, pumping and injecting will change the water pressure and deform the retaining structure [23]. Zhang et al. compared the pore water pressure and horizontal displacement of soil with the condition of only discharge and recharge following discharge [8]. However, most existing studies only describe the effect of recharge on the enclosure structure and surrounding environment qualitatively, few studies have been concerned with quantify the impact of each recharge parameter. Furthermore, the optimization of the recharge scheme needs further study.
In this paper, four typical recharge parameters, such as recharge well depth, recharge pressure, recharge well spacing, and the distance between the recharge well and retaining wall, are selected to conduct the orthogonal test under five levels, and different recharge schemes are obtained. Then, the above recharge scheme was put into the established numerical model to calculate the results, and the sensitivity of recharge parameters analysis were analyzed. Additionally, the optimal recharge scheme was obtained based on the orthogonal analysis method.

2. Project Overviews

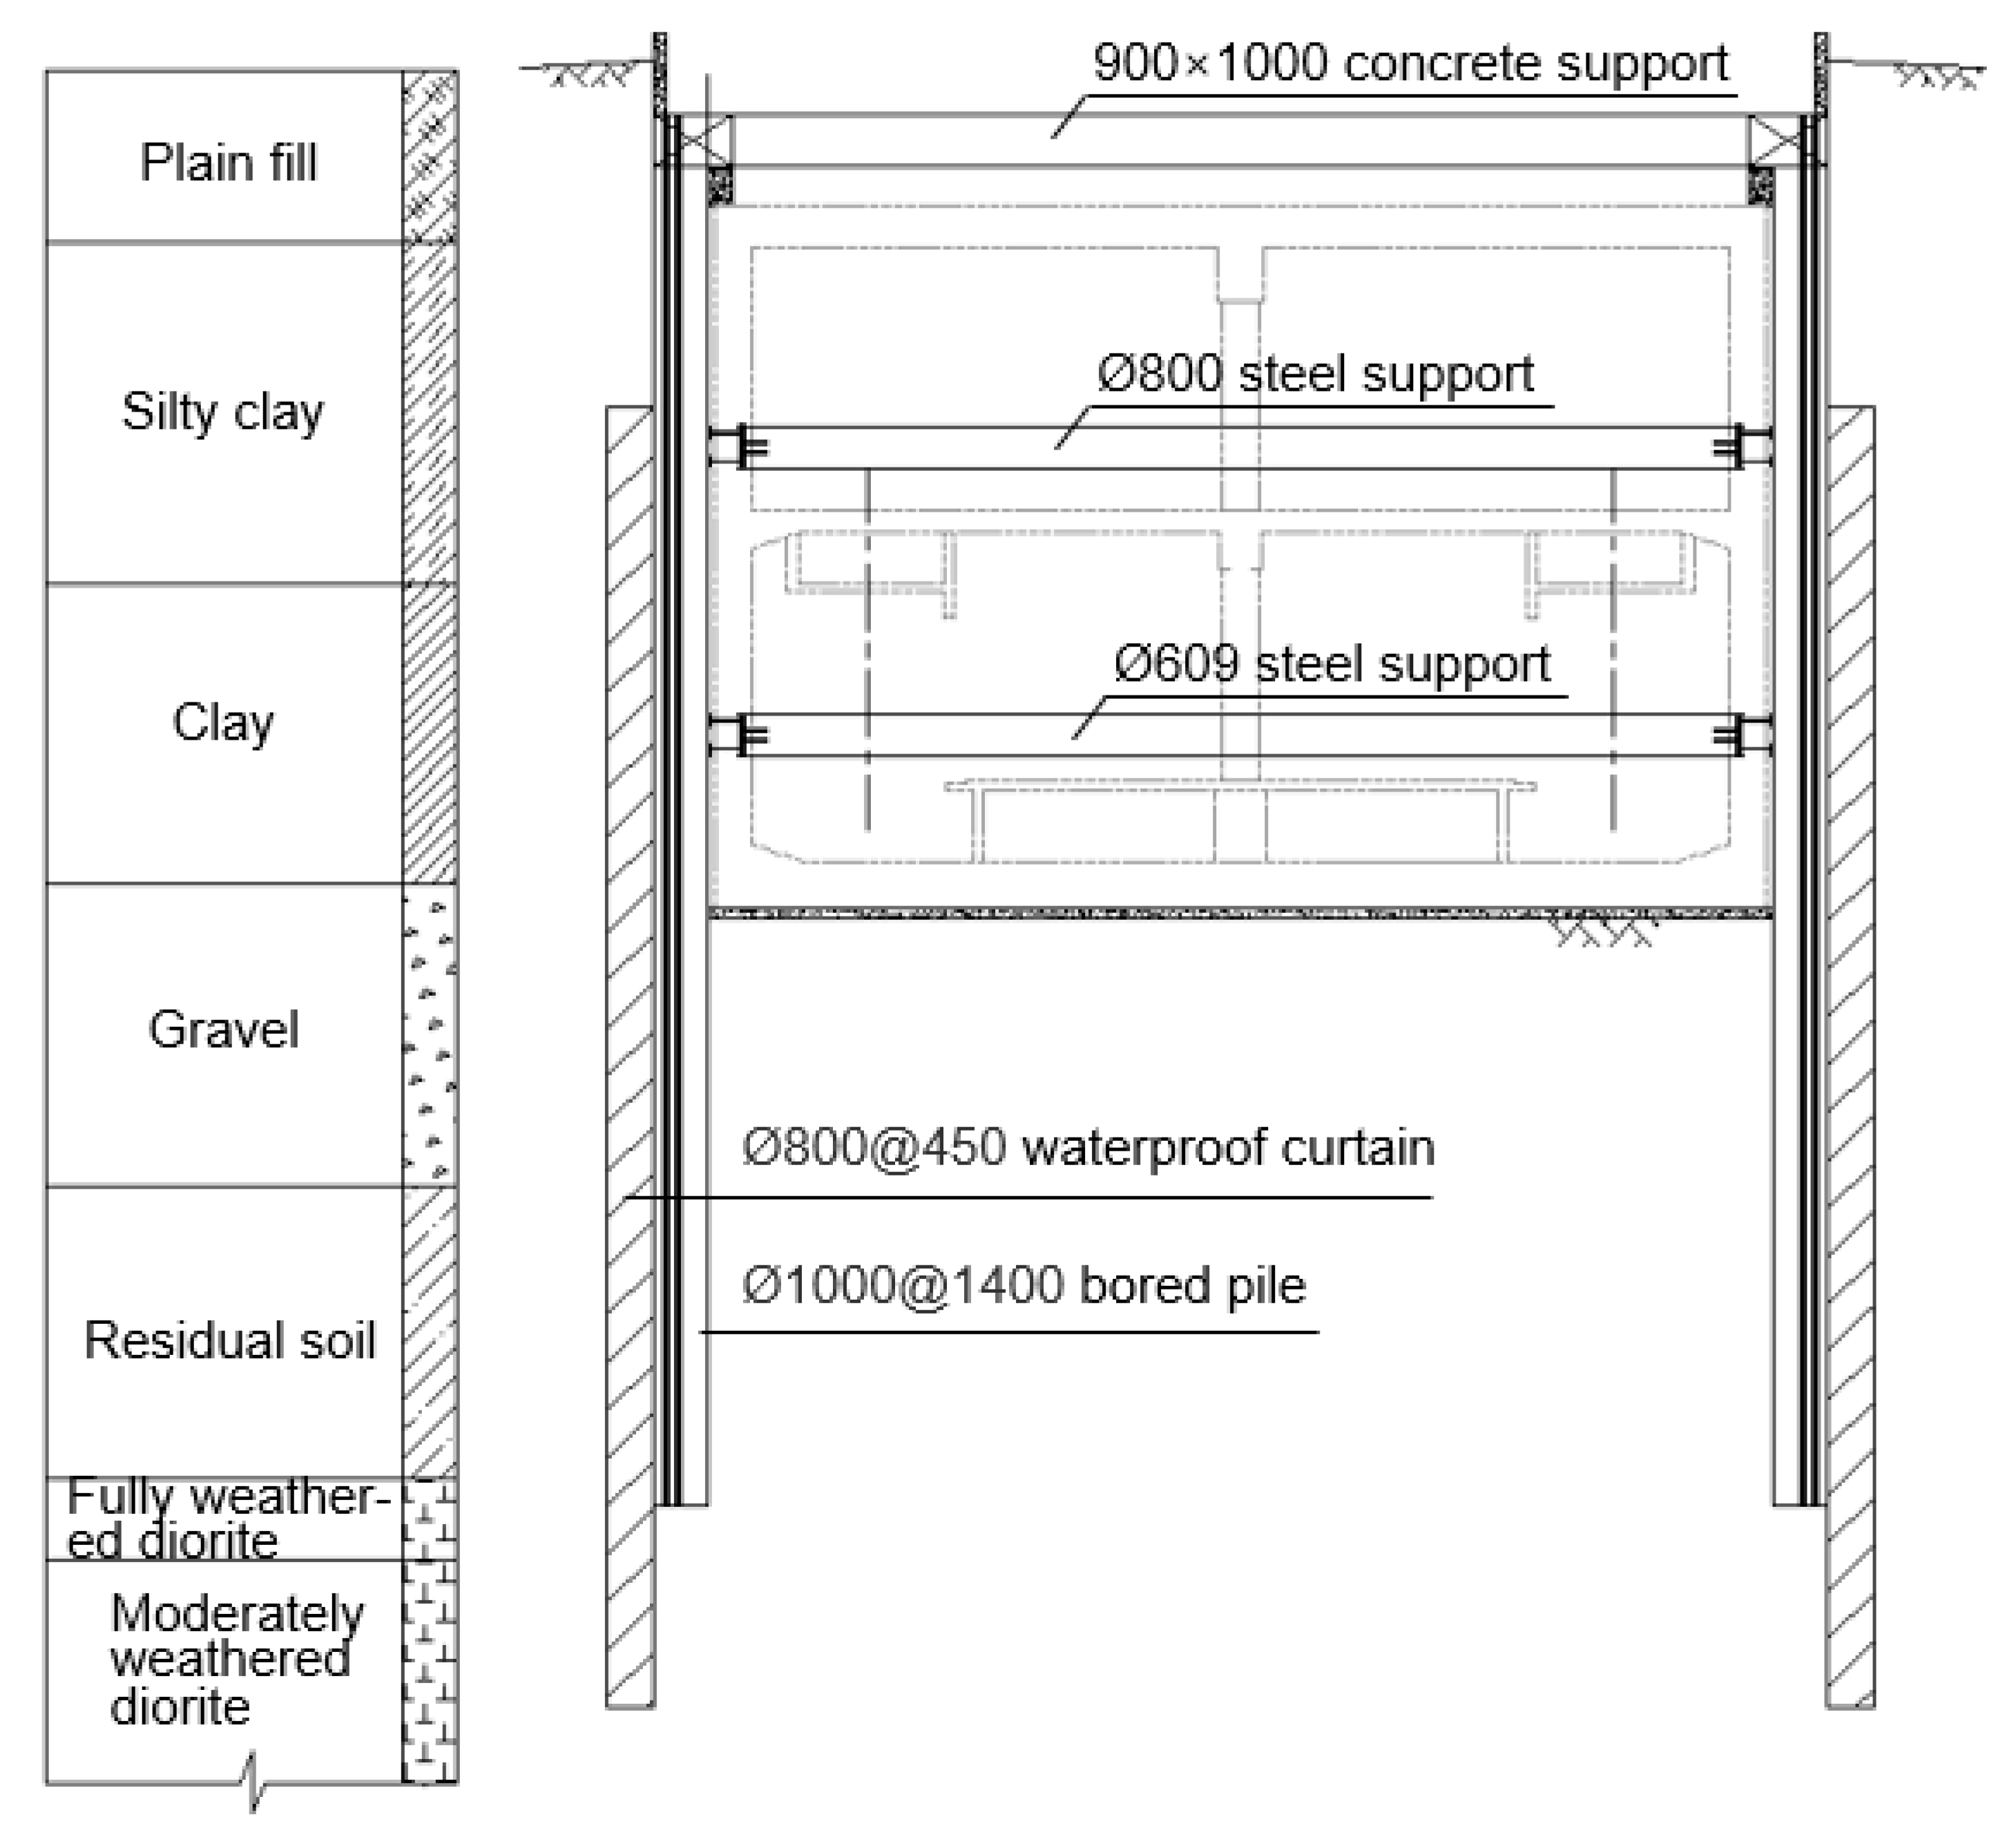
This investigated project was a metro station located in Jinan, China. According to the site investigation and laboratory test report, the main parameters of the soil layer were obtained as shown in Table 1. Figure 1 presents the construction site of the excavation. The total length of excavation is 210.6 m, including a standard part (Part 1) of length 185.8 m and two shields end well parts (Part 2) of length 12.4 m. The width of Part 1 is 19.5 m and the excavation depth is 15.77 m. The width of Part 2 is 24 m and the excavation depth is 17.39 m. The retaining system of the foundation pit consists of retaining pile and internal support. Figure 2 shows the standard section profile of the metro station.
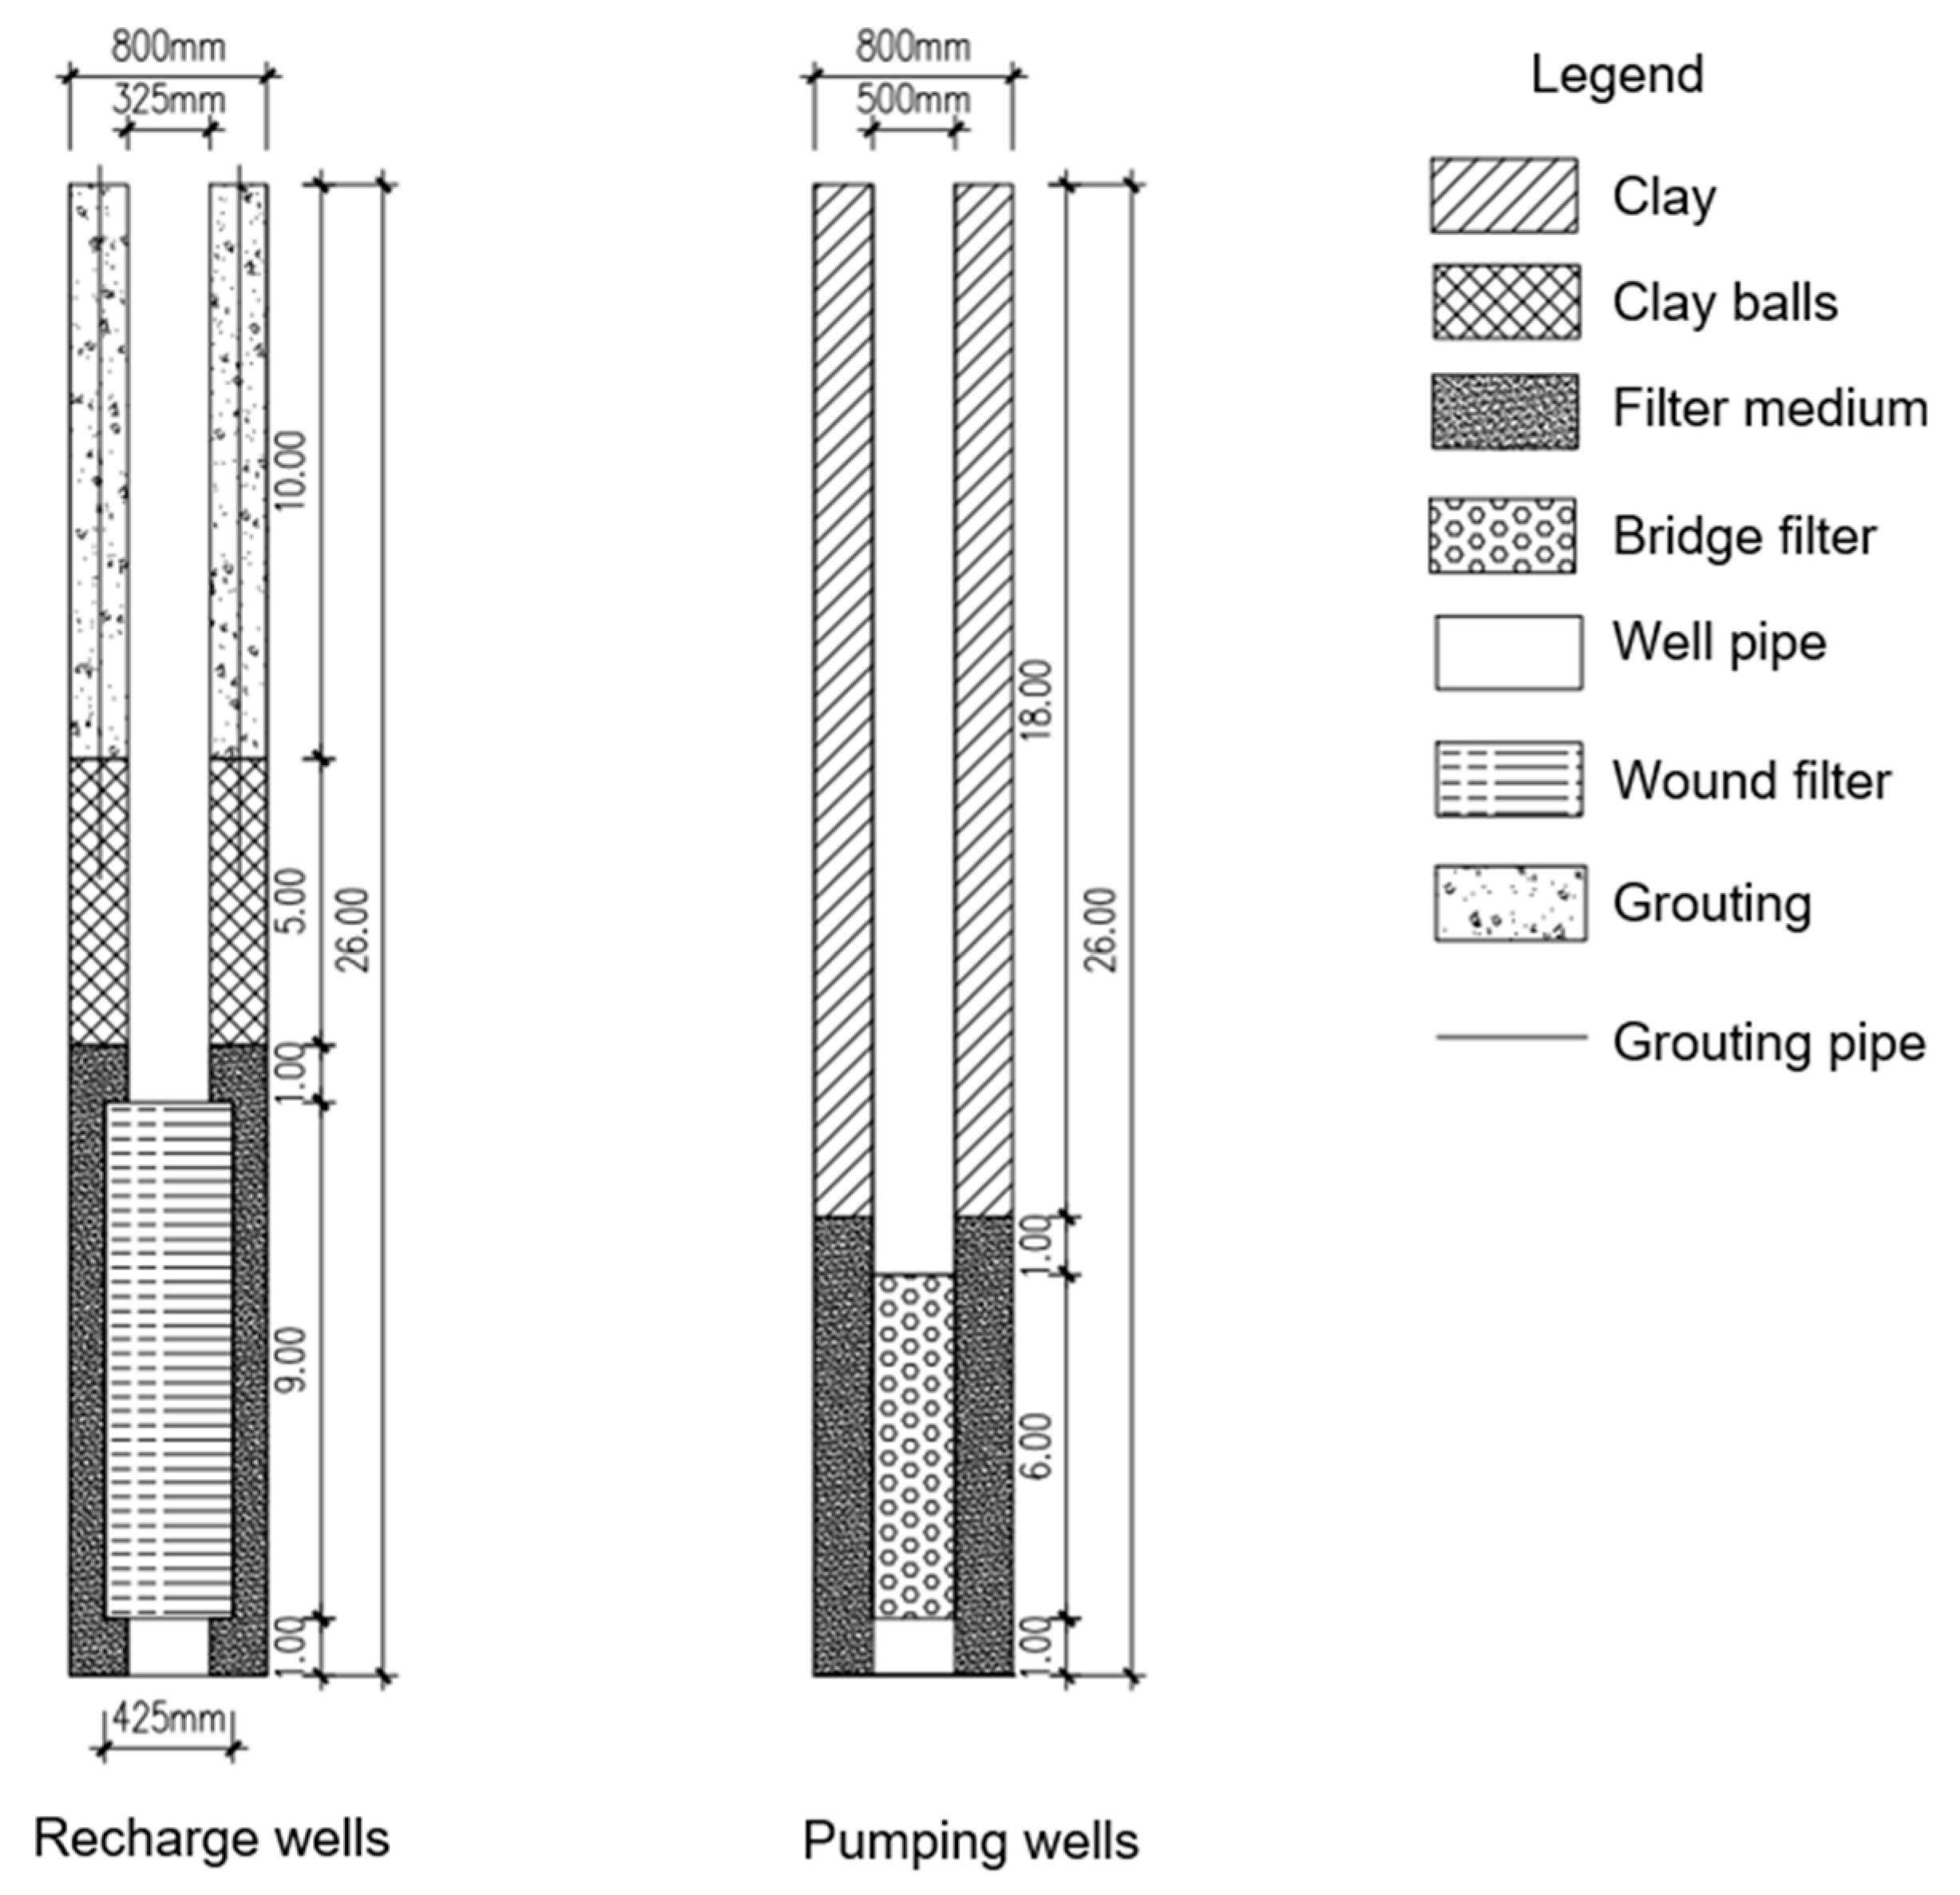
Jinan is famous as the “Spring City” due to its abundant groundwater. The groundwater at the construction site consists of phreatic water and confined water. The buried depth of water level in phreatic aquifer ranges from 8.1 m to 8.7 m and changes with atmospheric precipitation. The confined aquifer is mainly composed of gravel, residual soil and fully weathered diorite. The long-term monitoring data show that the piezometric head in confined aquifer is 8.9–11.1 m below the ground surface and changes with seasons. In order to meet the construction safety needs and protect groundwater resources, dewatering and recharge measurements were conducted in this project. The layout of pumping and recharge wells is presented in Figure 3. Twenty-five pumping wells were installed with a spacing of 25~30 m inside the foundation pit. Thirty recharge wells were arranged with a spacing of 25 m at a horizontal distance of 10~20 m away from the retaining wall. Figure 4 depicts the structure of these wells. The recharge construction measure was taken when excavating to the basement and it lasted 36 days. The control mode of recharge measure can be divided into injecting with constant pressure or injecting with constant flow. This project adopts constant pressure recharge, and the recharge pressure is 50 kPa.

3. Methods

3.1. The Orthogonal Test Model

Orthogonal test analysis is a method based on mathematical statistics and orthogonal principle [24]. It involves selecting typical points from a large number of experimental points and arranging these in multifactor experiments scientifically by using an orthogonal table. Orthogonal test analysis can significantly reduce the number of experiments so as to find the optimal experimental schemes objectively and quickly [25]. The analysis process of the orthogonal test can be summarized in five steps [26,27]: determining the test factors and their possible variation levels, selecting an appropriate orthogonal array, listing the test scheme and numerical simulation results, conducting a comprehensive evaluation of results, determining the optimum combination of factors.
For the deep excavation in a confined water-rich stratum, the influence of recharge on foundation pit engineering should be considered as follows: (1) ground settlement; around the pit; (2) groundwater recovery; (3) deformation of the retaining structure; (4) areas affected by construction; (5) construction difficulty and economic benefits. Therefore, the four typical parameters are considered in the recharge construction: A, the depth of the recharge well; B, the distance between the recharge well and retaining wall; C, the spacing of recharge wells; and D, recharge pressure. As shown in Table 2, the five-level orthogonal array L25(54) is employed.

3.2. Establishment of Numerical Model

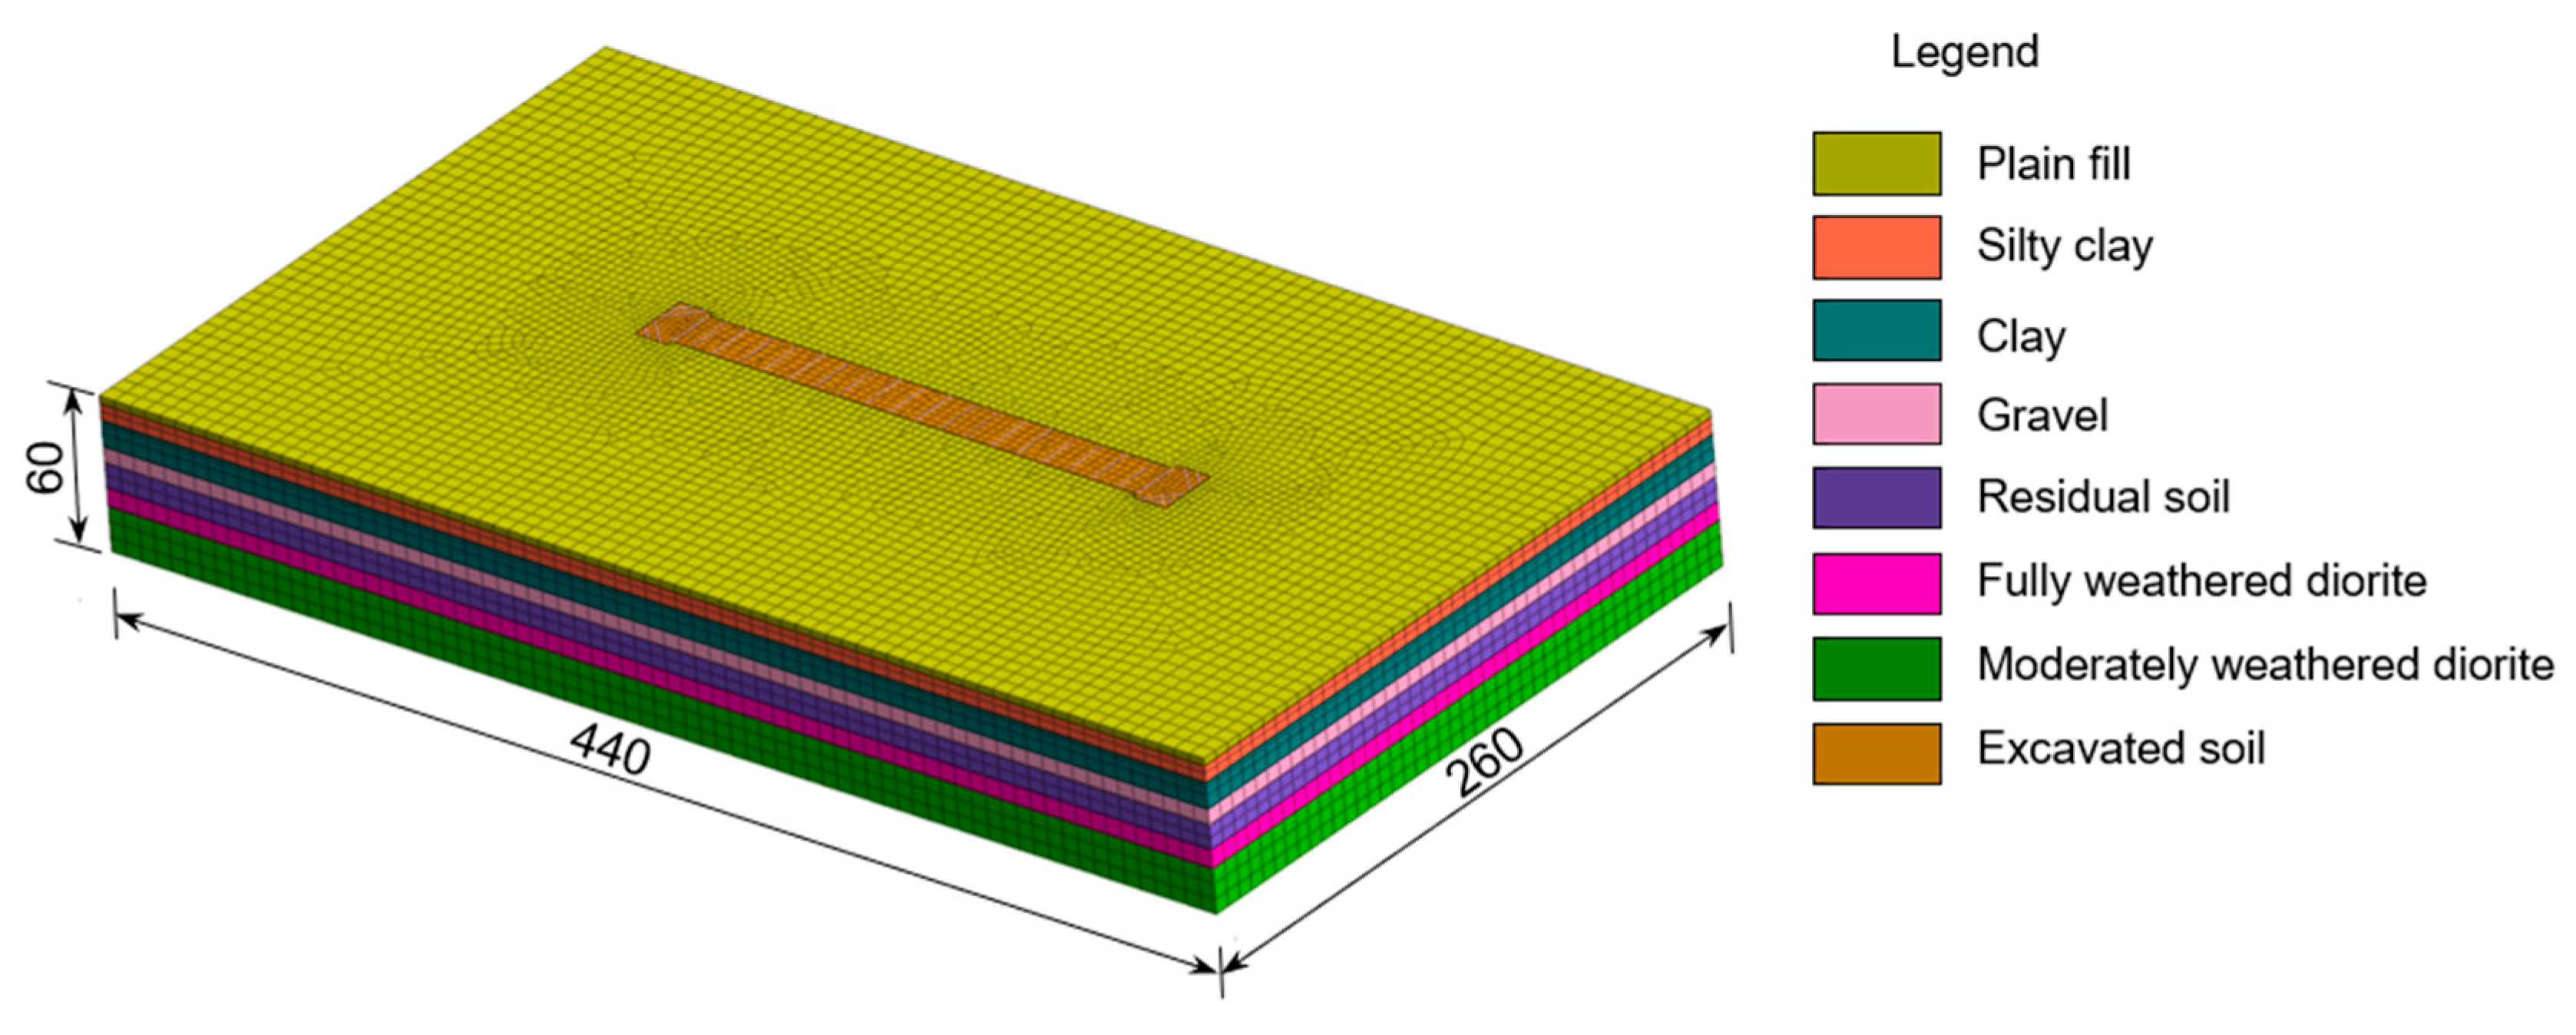
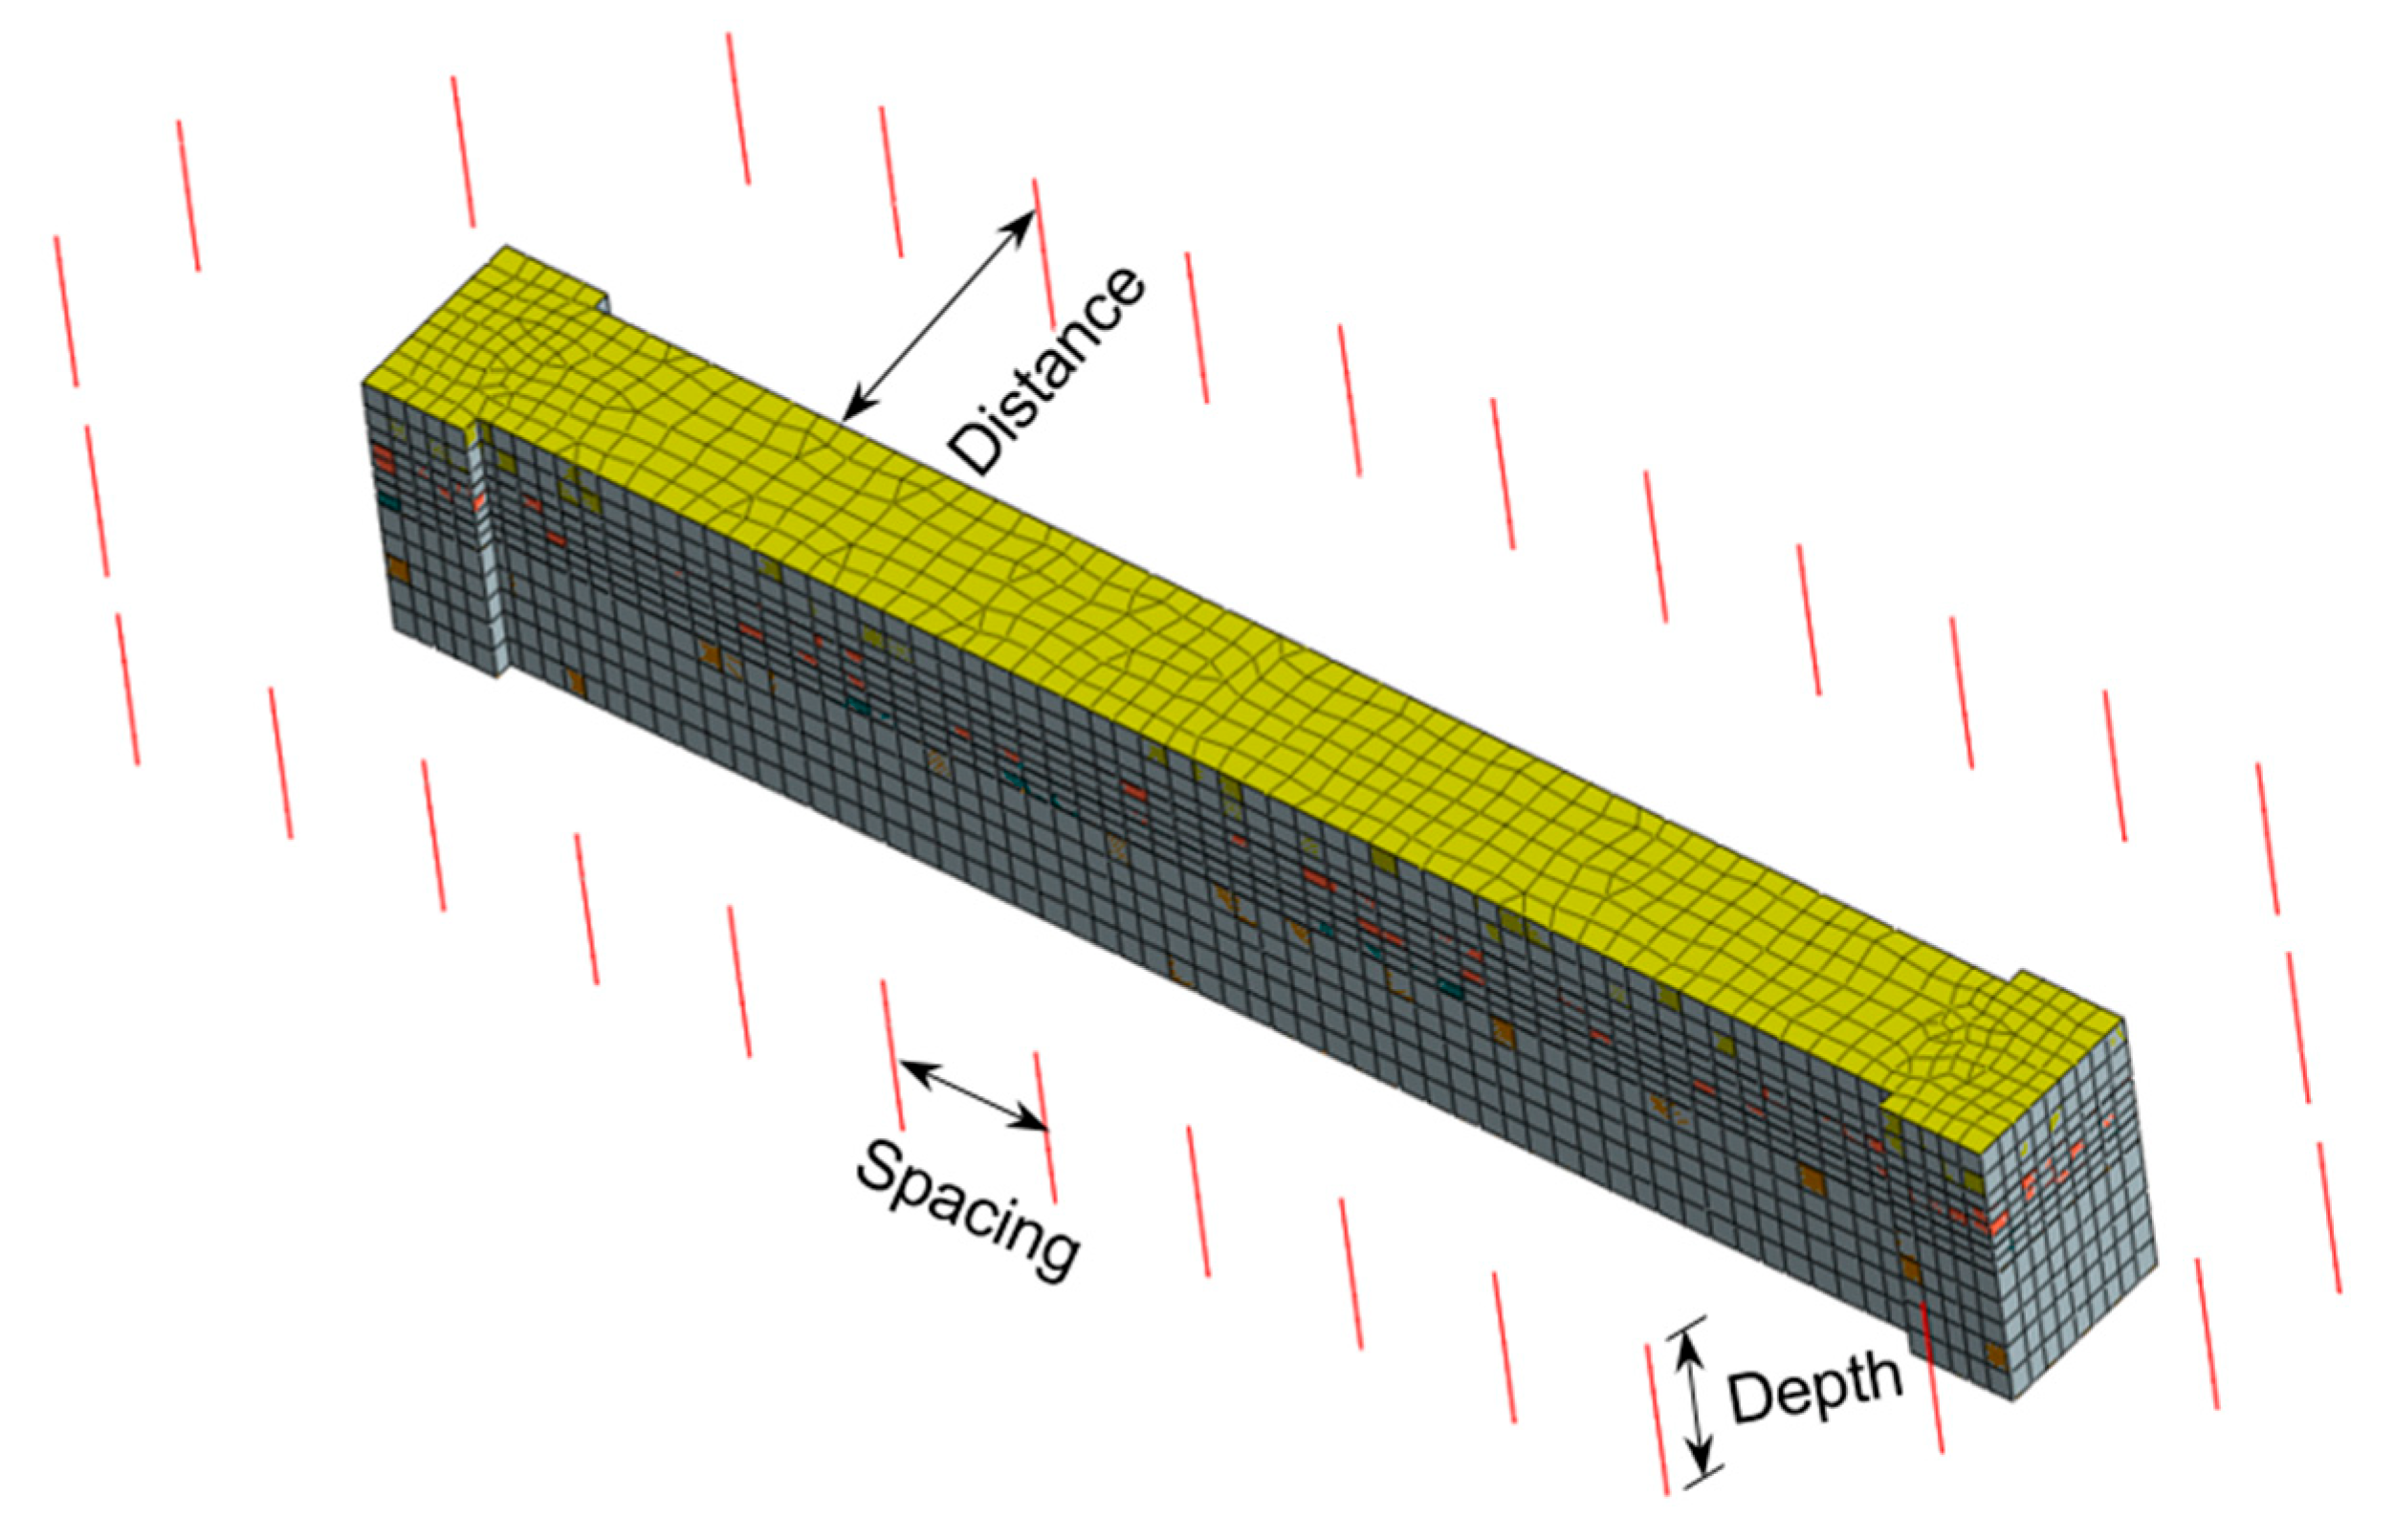
In this paper, numerical modeling was conducted to analyze the results of different recharge schemes. The horizontal size of the numerical model is 440 m long and 260 m wide. The vertical size was set as 60 m, including 7 soil layers as shown in Table 1. Figure 5 presents the grid mesh of the numerical model, and local mesh is refined inside and near the pit. The soil adopts a three-dimensional solid element, the retaining structure adopts a two-dimensional element, the crown beam and steel support adopts a one-dimensional beam element, and the dewatering well and recharge well adopts a one-dimensional display element for simulation as shown in Figure 6.

3.3. Optimization Method Based on Multi-Target Orthogonal Test Design

The common orthogonal test analysis methods include visual analysis method, variance analysis method and effect analysis method [28,29]. These three analysis methods have certain difficulties for the multi-target orthogonal test problem and require a large calculation. In this paper, a matrix analysis method can be used to calculate the weight of each factor affecting the test results. According to the weight, the optimal scheme of the influencing factors can be quickly obtained. The orthogonal matrix analysis method is defined as follows:
ω = M T R
M = K 11 0 0 0 K 12 0 0 0 K 1 m 0 0 0 0 K 21 0 0 0 K 22 0 0 0 K 2 m 0 0 0 0 0 K l 1 0 0 0 K l 2 0 0 0 K l m
K i j = k i j / j = 1 m k i j
T = T 1 0 0 0 0 T 2 0 0 0 0 0 T l
T i = 1 / j = 1 m K i j
R T = R 1 R 2 R l
R i = r i / i = 1 l r i
In the formula, i is factor number of the orthogonal test and it ranges from 1 to l, j is level number of the orthogonal test and it ranges from 1 to m. kij is the sum of calculation results, kij taking the reciprocal when the test results of the measurement index are the larger the better, ri is the range of calculation results, Ri reflect the degree of influence on range value.

4. Results and Discussion

4.1. The Results of Orthogonal Test

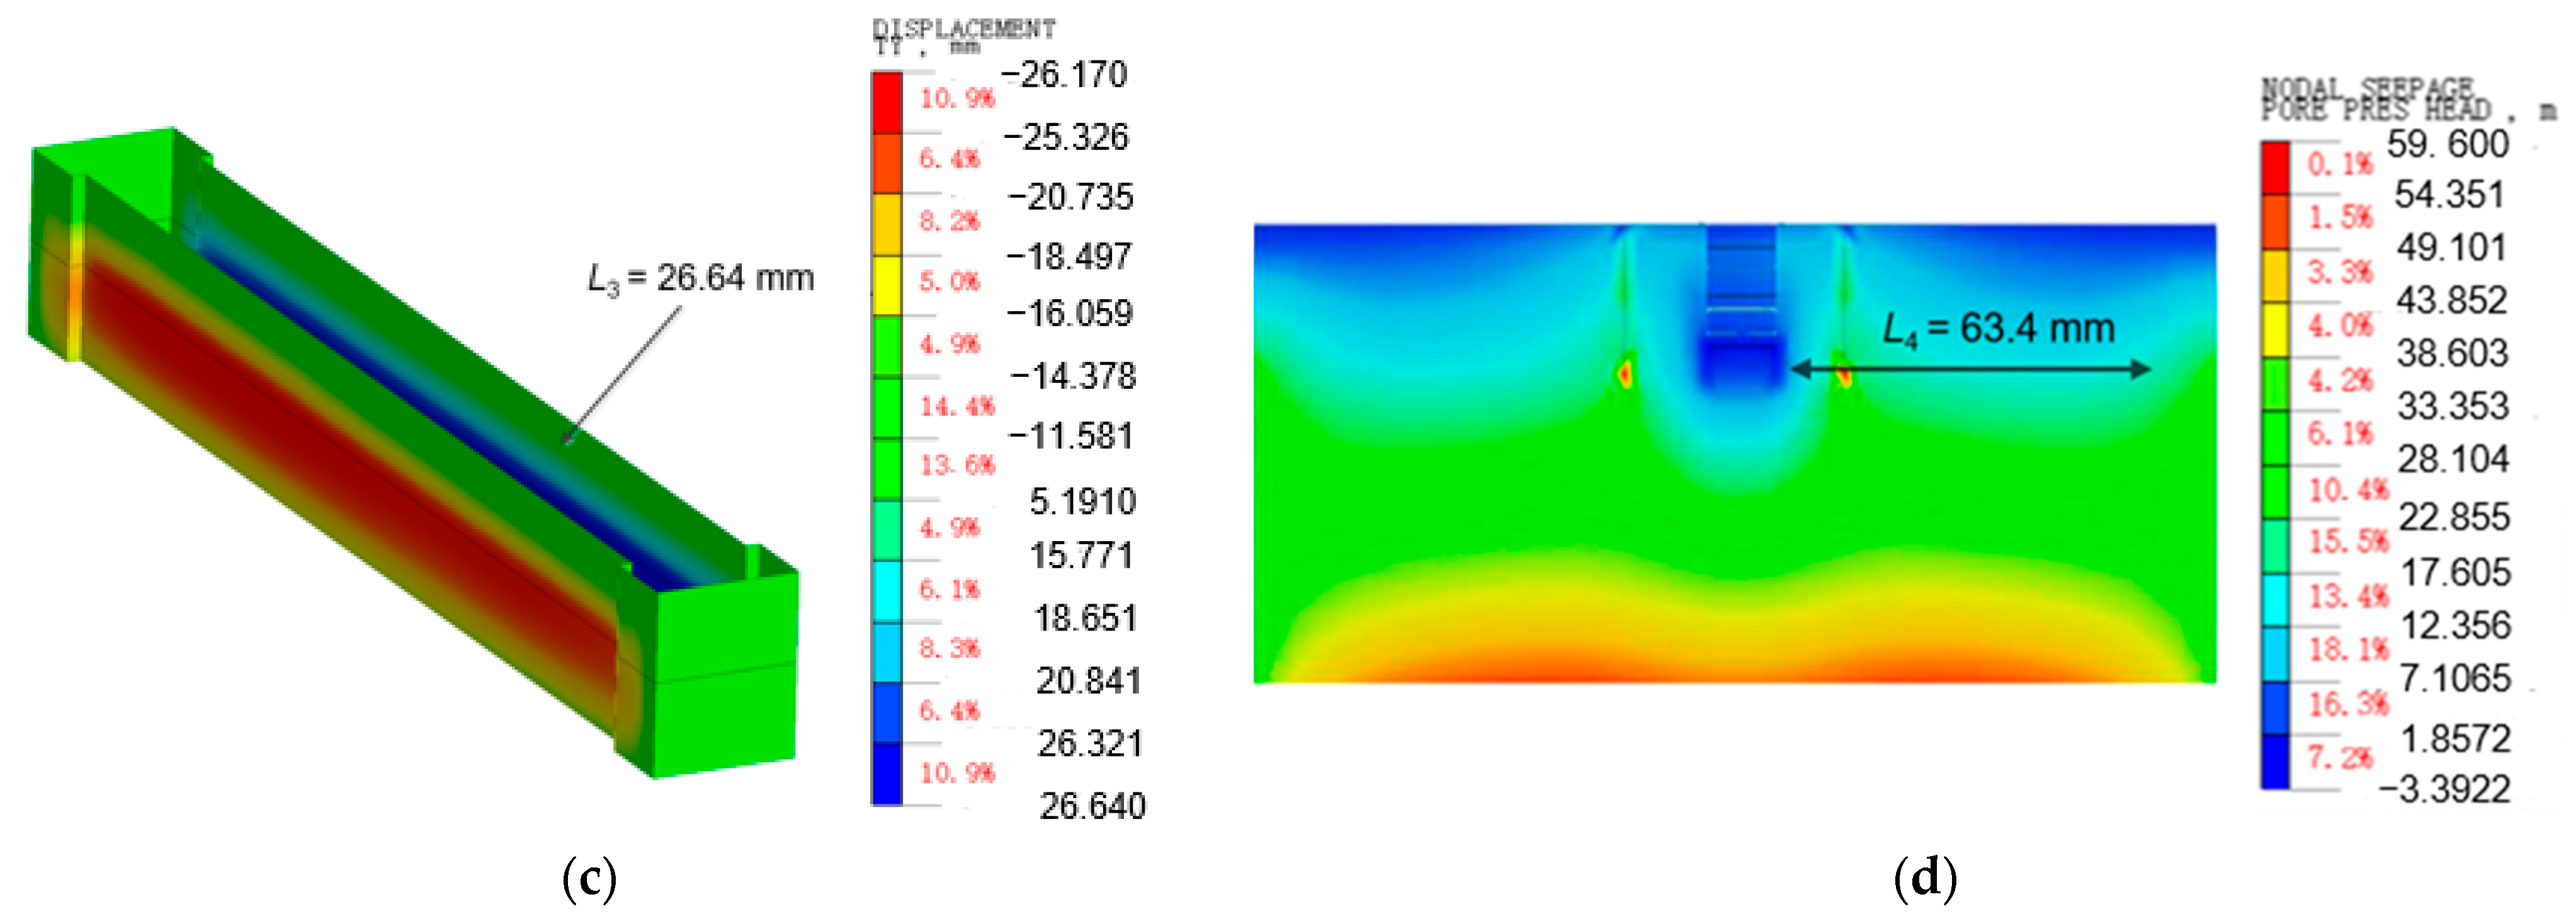
The 25 orthogonal schemes were simulated on the finite element model, and the surface subsidence around the pit, the recovery of groundwater, the deformation of the retaining structure, the area affected by construction, and other indicators were analyzed. Among them, the surface subsidence around the pit is based on the maximum ground settlement (L1). Groundwater recovery is evaluated by the flux (L2) of a 5 m2 cross-section with a depth of 20 m at a horizontal distance of 50 m away from the retaining wall. The deformation of the retaining structure is evaluated by the maximum horizontal displacement of the wall (L3). The area affected by construction is represented by area radius (L4). The difficulty of recharge construction (L5) is divided into 17 grades from 4 to 20. The excavation without recharge is a control group. The calculated results of all 25 schemes are shown in Table 3. Figure 7 presents the cloud diagram of the finite element analysis results when using recharge Scheme No.1.

4.2. Influence of Recharge Parameters on Ground Settlement

It can be seen from Table 4 and Figure 8 that recharge pressure and recharge well depth are the main influencing factors of ground settlement. With the increase of recharge pressure and recharge well depth, the settlement on the ground surface is controlled. Since the simulation model was set as a confined intact well, the higher recharge pressure could make the injected water overcome the pressure and enter the seepage field of groundwater, which relieved the settlement. The deeper recharge can make the injected water percolate through the aquicludes and effect the deeper soil layer. However, the distance between the recharge well and the retaining wall and the spacing of the recharge wells have no obvious effect on the ground settlement.

4.3. Influence of Recharge Parameters on the Flux of Groundwater Recovery

It can be seen from Table 5 and Figure 9 that the influencing factors on the flux of groundwater recovery are similar to the ground settlement, mainly including recharge pressure and recharge well depth. In unit time, the larger recharge pressure can make more injected water into the soil layer. When the recharge well depth goes deep into the impermeable layer, the recharge water can be injected into the confined aquifer, which in turn infuses more recharge water. However, the distance between the recharge well and retaining structure and the spacing of recharge well have no obvious effect on the flux of groundwater recovery.

4.4. Influence of Recharge Parameters on the Horizontal Displacement of Retaining Structure

It can be seen from Table 6 and Figure 10 that the main influencing factors on the horizontal displacement of the retaining wall are the distance between the recharge well and the retaining wall and the recharge pressure. When the recharge wells are close to retaining wall, the seepage force and water pressure caused by recharge will increase the horizontal displacement of the retaining structure. Under the influence of soil particle size, grain size distribution, void ratio, and other factors, too large pressure and depth will affect the consolidation and reorganization of soil particles, and thereby affect the coupling between soil and groundwater.
According to the calculation results of K3~K5, when the distance between the recharge well and the retaining wall exceeds a certain value, the effect of the distance on the horizontal displacement of the retaining structure gradually weakens. The farther the distance, the more significant its sensitivity decreases; it tends to be flat after 40 m.

4.5. Influence of Recharge Parameters on the Influence Radius of Recharge

As shown in Table 7 and Figure 11, the four recharge parameters which affect the influence radius of recharge are the distance and the depth. According to the Dupuit formula, the radius of groundwater uplift contributed by recharge is about 80~120 m. The farther the recharge well is from the wall, the larger the influence radius of recharge is. Compared with the recharge pressure, the depth of recharge well has a greater influence on the influence radius of recharge. However, in the case of large recharge pressure, a short recharge well is difficult to affect the confined aquifer, which reduces the sensitivity of the recharge radius.
According to the calculation results of K2~K5, increasing the recharge well depth has no significant effect on the range of influence when the wells reached the confined aquifer. However, if the recharge wells are too deep, the recharge water will enter the deeper impermeable layer under the confined aquifer. Then the water pressure into the confined aquifer will be dispersed, so that the vertical groundwater uplift curve of the stratum will be moved down, and the groundwater seepage area will be decreased.

4.6. Influence of Recharge Parameters on the Construction Difficulty

As shown in Table 8 and Figure 12, we can reduce the amount of recharge well when increasing the spacing and decreasing the distance appropriately. In this way, the economic benefits are increased. Under the condition of meeting the national design requirements and standards, the construction difficulty and economy of Scheme No.1 are better.

4.7. The Optimization of Recharge Scheme

After the above sensitivity analysis, the optimal scheme for each parameter index is obtained, but each optimal scheme is not the same. The orthogonal matrix analysis method is used to obtain the optimal scheme. The first evaluation index is the ground settlement, the smaller the better. The negative value is converted into a positive value for judgment, and the matrix analysis is as follows:
M 1 = 1 / 46.35 0 0 0 1 / 44.67 0 0 0 1 / 39.32 0 0 0 1 / 34.99 0 0 0 1 / 22.25 0 0 0 0 1 / 37.68 0 0 0 1 / 39.56 0 0 0 1 / 36.17 0 0 0 1 / 37.79 0 0 0 1 / 36.38 0 0 0 0 1 / 39.33 0 0 0 1 / 37.36 0 0 0 1 / 36.81 0 0 0 1 / 36.23 0 0 0 1 / 37.85 0 0 0 0 1 / 56.88 0 0 0 1 / 48 0 0 0 1 / 37.24 0 0 0 1 / 28.22 0 0 0 1 / 17.24 ,   T 1 = 6.9971 0 0 0 0 7.4955 0 0 0 0 7.4973 0 0 0 0 6.3009 ,   R 1 = 24.1 / 70.23 3.39 / 70.23 3.1 / 70.23 39.64 / 70.23
The second index is the flux of groundwater recovery, the larger the better. The third index is the horizontal displacement of the retaining structure, the smaller the better. The fourth index is the influence radius, the smaller the better. The fifth index is the difficulty of construction, the smaller the better. Similarly, matrix analysis is used according to Equations (2)–(7), which will not be repeated in the paper. The index weight matrix calculation result is as follows:
ω 1 = 0.0518 0.0538 0.0611 0.0686 0.1079 0.0091 0.0096 0.0100 0.0095 0.0099 0.0084 0.0088 0.0089 0.0091 0.0087 0.0623 0.0741 0.0955 0.2062 0.1260 ,   ω 2 = 0.0508 0.0541 0.0569 0.0667 0.0771 0.0138 0.0129 0.0131 0.0129 0.0142 0.0160 0.0147 0.0154 0.0153 0.0164 0.0680 0.0893 0.1077 0.1532 0.1338 ,   ω 3 = 0.0537 0.0502 0.0505 0.0493 0.0451 0.0576 0.0508 0.0592 0.0593 0.0621 0.0159 0.0158 0.0163 0.0167 0.0161 0.0840 0.0838 0.0758 0.0644 0.0734 ,   ω 4 = 0.0306 0.0299 0.0290 0.0292 0.0314 0.1389 0.1462 0.1332 0.1153 0.1042 0.0264 0.0260 0.0276 0.0280 0.0277 0.0156 0.0155 0.0150 0.0152 0.0151 ,   ω 5 = 0.0566 0.0515 0.0472 0.0423 0.0405 0.0542 0.0644 0.0515 0.0476 0.0442 0.0623 0.0566 0.0519 0.0479 0.0432 0.0567 0.0515 0.0457 0.0405 0.0436
Calculate the average value of the weight matrix of the orthogonal experimental analysis index, and the calculation process is as follows:
ω = 1 5 ( ω 1 + ω 2 + ω 3 + ω 4 + ω 5 ) = 0.0487 0.0479 0.0489 0.0512 0.0604 0.0547 0.0568 0.0534 0.0489 0.0469 0.0258 0.0244 0.0240 0.0234 0.0224 0.0573 0.0628 0.0679 0.0959 0.0784 = A 1 A 2 A 3 A 4 A 5 B 1 B 2 B 3 B 4 B 5 C 1 C 2 C 3 C 4 C 5 D 1 D 2 D 3 D 4 D 5
According to the above calculation, the main order of the influence of each parameter index is recharge pressure, depth, distance, spacing. Among them, A5B2C1D4 has the largest weight.
Compared with the monitoring data of original recharge scheme, the optimized recharge scheme has better results (See Table 9). Such as, the maximum ground settlement in the optimized scheme decreased by 71.19%, the flux of groundwater recovery increased 11.96%, the maximum horizontal displacement of the wall decreased 15.61%, the influence radius of recharge enlarged 8.62%, and the construction difficulty still the same.

5. Conclusions

For relieving the adverse impact of the deep excavation in a confined water-rich stratum on the surrounding environment, numerical modelling and orthogonal analysis were combined to optimize the groundwater recharge scheme. The main conclusions and suggestions are as follows.
(1)
In terms of ground settlement and the flux of groundwater recovery, the main influential factor is the recharge pressure and the depth of recharge well. The main influential factor of retaining structure deformation and influence radius of recharge is the distance between recharge wells and retaining wall. Construction difficulty increases approximately linearly with the four typical recharge parameters.
(2)
Recharge can restore the seepage flux of groundwater to a certain extent and thereby reduce the ground settlement caused by dewatering effectively. The water pressure brought by recharge is coupled with the soil stress around the foundation pit, which aggravates the unbalanced pressure on both sides of the retaining structure and leads to further deformation of the pit retaining structure.
(3)
In a pit with thick high-permeability soil layers, the recharge scheme A5B2C1D4 (the depth of recharge well is 50 m, distance between recharge well and retaining wall is 20 m, spacing is 10 m, pressure is 40 kPa) can recover the groundwater seepage flux to the maximum extent and reduce the adverse effects of recharge on the retaining structure. The method of obtaining the optimal scheme can provide a reference for the groundwater recharging of the deep excavation in a water-rich confined area.

Author Contributions

Conceptualization, B.W.; Formal analysis, X.S.; Funding acquisition, B.W.; Methodology, K.Z.; Software, X.S.; Validation, K.Z.; Writing—original draft, K.Z. and X.S.; Writing—review & editing, B.W. and G.M. All authors have read and agreed to the published version of the manuscript.

Funding

This research was funded by the National Natural Science Foundation of China (Grant No. 52168055), the Natural Science Foundation of Jiangxi Province (Grant No. 20212ACB204001).

Institutional Review Board Statement

Not applicable.

Informed Consent Statement

Not applicable.

Data Availability Statement

The data presented in this study are available on request from the corresponding author.

Conflicts of Interest

The authors declare no conflict of interest.

References

  1. Zhang, Y.Q.; Wang, J.H.; Li, M.G. Effect of Dewatering in a Confined Aquifer on Ground Settlement in Deep Excavations. Int. J. Géoméch. 2018, 18, 04018120. [Google Scholar] [CrossRef]
  2. Tornborg, J.; Karlsson, M.; Kullingsjö, A.; Karstunen, M. Modelling the construction and long-term response of Göta Tunnel. Comput. Geotech. 2021, 134, 104027. [Google Scholar] [CrossRef]
  3. Zeng, C.-F.; Wang, S.; Xue, X.-L.; Zheng, G.; Mei, G.-X. Characteristics of ground settlement due to combined actions of groundwater drawdown and enclosure wall movement. Acta Geotech. 2022, 17, 4095–4112. [Google Scholar] [CrossRef]
  4. Pujades, E.; Jurado, A. Groundwater-related aspects during the development of deep excavations below the water table: A short review. Undergr. Space 2019, 6, 35–45. [Google Scholar] [CrossRef]
  5. Liu, F.; Xing, H.; Wu, B.; Liu, G.; Ma, S.; Huang, H.; Meng, G. Study on the effect of dewatering-recharge-excavation of deep foundation pits on soil-structure-groundwater under a deep confined water environment. Arab. J. Geosci. 2022, 15, 710. [Google Scholar] [CrossRef]
  6. Ervin, M.C.; Benson, N.D.; Morgan, J.R.; Pavlovic, N. Melbourne’s Southbank Interchange: A permanent excavation in compressible clay. Can. Geotech. J. 2004, 41, 861–876. [Google Scholar] [CrossRef]
  7. Zhang, Y.-Q.; Wang, J.-H.; Chen, J.-J.; Li, M.-G. Numerical study on the responses of groundwater and strata to pumping and recharge in a deep confined aquifer. J. Hydrol. 2017, 548, 342–352. [Google Scholar] [CrossRef]
  8. Zhang, Y.; Yan, X.; Yang, T.; Wu, J.; Wu, J. Three-Dimensional Numerical Investigation of Pore Water Pressure and Deformation of Pumped Aquifer Systems. Groundwater 2019, 58, 278–290. [Google Scholar] [CrossRef]
  9. Wang, J.; Liu, X.; Wu, Y.; Liu, S.; Wu, L.; Lou, R.; Lu, J.; Yin, Y. Field experiment and numerical simulation of coupling non-Darcy flow caused by curtain and pumping well in foundation pit dewatering. J. Hydrol. 2017, 549, 277–293. [Google Scholar] [CrossRef]
  10. Calderhead, A.; Therrien, R.; Rivera, A.; Martel, R.; Garfias, J. Simulating pumping-induced regional land subsidence with the use of InSAR and field data in the Toluca Valley, Mexico. Adv. Water Resour. 2011, 34, 83–97. [Google Scholar] [CrossRef]
  11. Zeng, C.-F.; Wang, S.; Xue, X.-L.; Zheng, G.; Mei, G.-X. Evolution of deep ground settlement subject to groundwater drawdown during dewatering in a multi-layered aquifer-aquitard system: Insights from numerical modelling. J. Hydrol. 2021, 603, 127078. [Google Scholar] [CrossRef]
  12. Zhou, X.; Burbey, T.J. Deformation characteristics of a clayey interbed during fluid injection. Eng. Geol. 2014, 183, 185–192. [Google Scholar] [CrossRef]
  13. Zeng, C.-F.; Zheng, G.; Xue, X.-L. Responses of deep soil layers to combined recharge in a leaky aquifer. Eng. Geol. 2019, 260, 105263. [Google Scholar] [CrossRef]
  14. Shi, Y.-J.; Li, M.-G.; Zhang, Y.-Q.; Li, J.; Wang, J.-H. Field Investigation and Prediction of Responses of Far-Field Ground and Groundwater to Pumping Artesian Water in Deep Excavations. Int. J. Géoméch. 2018, 18, 04018132. [Google Scholar] [CrossRef]
  15. Liu, N.-W.; Peng, C.-X.; Li, M.-G.; Chen, J.-J. Hydro-mechanical behavior of a deep excavation with dewatering and recharge in soft deposits. Eng. Geol. 2022, 307, 106780. [Google Scholar] [CrossRef]
  16. Zeng, C.-F.; Zheng, G.; Xue, X.-L.; Mei, G.-X. Combined recharge: A method to prevent ground settlement induced by redevelopment of recharge wells. J. Hydrol. 2018, 568, 1–11. [Google Scholar] [CrossRef]
  17. Zheng, G.; Ha, D.; Zeng, C.; Cheng, X.; Zhou, H.; Cao, J. Influence of the opening timing of recharge wells on settlement caused by dewatering in excavations. J. Hydrol. 2019, 573, 534–545. [Google Scholar] [CrossRef]
  18. Zheng, G.; Cao, J.; Cheng, X.; Ha, D.; Wang, F. Experimental study on the artificial recharge of semiconfined aquifers involved in deep excavation engineering. J. Hydrol. 2018, 557, 868–877. [Google Scholar] [CrossRef]
  19. Guo, F.; Wang, G.-H.; Li, Z.-C. Influence of artificial recharge in a phreatic aquifer on deep excavation dewatering: A case study of Dongguantou Nan Station in Beijing, China. Hydrogeol. J. 2022, 30, 673–689. [Google Scholar] [CrossRef]
  20. Zhang, Y.-Q.; Li, M.-G.; Wang, J.-H.; Chen, J.-J.; Zhu, Y.-F. Field tests of pumping-recharge technology for deep confined aquifers and its application to a deep excavation. Eng. Geol. 2017, 228, 249–259. [Google Scholar] [CrossRef]
  21. Cao, J.; Li, Q.; Cheng, X.; Zheng, G.; Ha, D.; Zeng, C. Study on artificial recharge and well loss in confined aquifers using theoretical and back-analysis calculations of hydrogeological parameters from recharge and pumping tests. Bull. Eng. Geol. Environ. 2022, 81, 483. [Google Scholar] [CrossRef]
  22. Zhang, C.-H.; Wang, B.-T.; Liu, Y. Research on the Effective Control of Ground Settlement during Double-Layered Foundation Pit Dewatering Based on Seepage Control-Recharge Coupling Model. Adv. Civ. Eng. 2022, 2022, 9669176. [Google Scholar] [CrossRef]
  23. Serrano-Juan, A.; Vázquez-Suñè, E.; Monserrat, O.; Crosetto, M.; Hoffmann, C.; Ledesma, A.; Criollo, R.; Pujades, E.; Velasco, V.; Garcia-Gil, A.; et al. Gb-SAR interferometry displacement measurements during dewatering in construction works. Case of La Sagrera railway station in Barcelona, Spain. Eng. Geol. 2016, 205, 104–115. [Google Scholar] [CrossRef] [Green Version]
  24. Deng, L.-C.; Li, X.-Z.; Chen, Y.-W.; Zhuang, Q.-W.; Zhu, L.-H.; Zhang, C. Investigations on Cutting Force and Temperature Field of Pick Cutter Based on Single Factor and Orthogonal Test Methods. Rock Mech. Rock Eng. 2022, 56, 619–645. [Google Scholar] [CrossRef]
  25. Hao, J.; Wang, B. Parameter Sensitivity Analysis on Deformation of Composite Soil-Nailed Wall Using Artificial Neural Networks and Orthogonal Experiment. Math. Probl. Eng. 2014, 2014, 502362. [Google Scholar] [CrossRef] [Green Version]
  26. Quan, H.; Guo, Y.; Li, R.; Su, Q.; Chai, Y. Optimization design and experimental study of vortex pump based on orthogonal test. Sci. Prog. 2019, 103. [Google Scholar] [CrossRef] [Green Version]
  27. Lafifi, B.; Rouaiguia, A.; Boumazza, N. Optimization of Geotechnical parameters using Taguchi’s design of experiment (DOE), RSM and desirability function. Innov. Infrastruct. Solut. 2019, 4, 35. [Google Scholar] [CrossRef]
  28. Yu, K.; Ren, F.; Puscasu, R.; Lin, P.; Meng, Q. Optimization of combined support in soft-rock roadway. Tunn. Undergr. Space Technol. 2020, 103, 103502. [Google Scholar] [CrossRef]
  29. Yang, L.; Chen, S.; Dong, P.; Wang, Q.; Huang, C. Orthogonal Analysis and Numerical Simulation of Rock Mechanics Parameters in Stress Field of Shaft Heading Face. Adv. Mater. Sci. Eng. 2020, 2020, 3107364. [Google Scholar] [CrossRef]
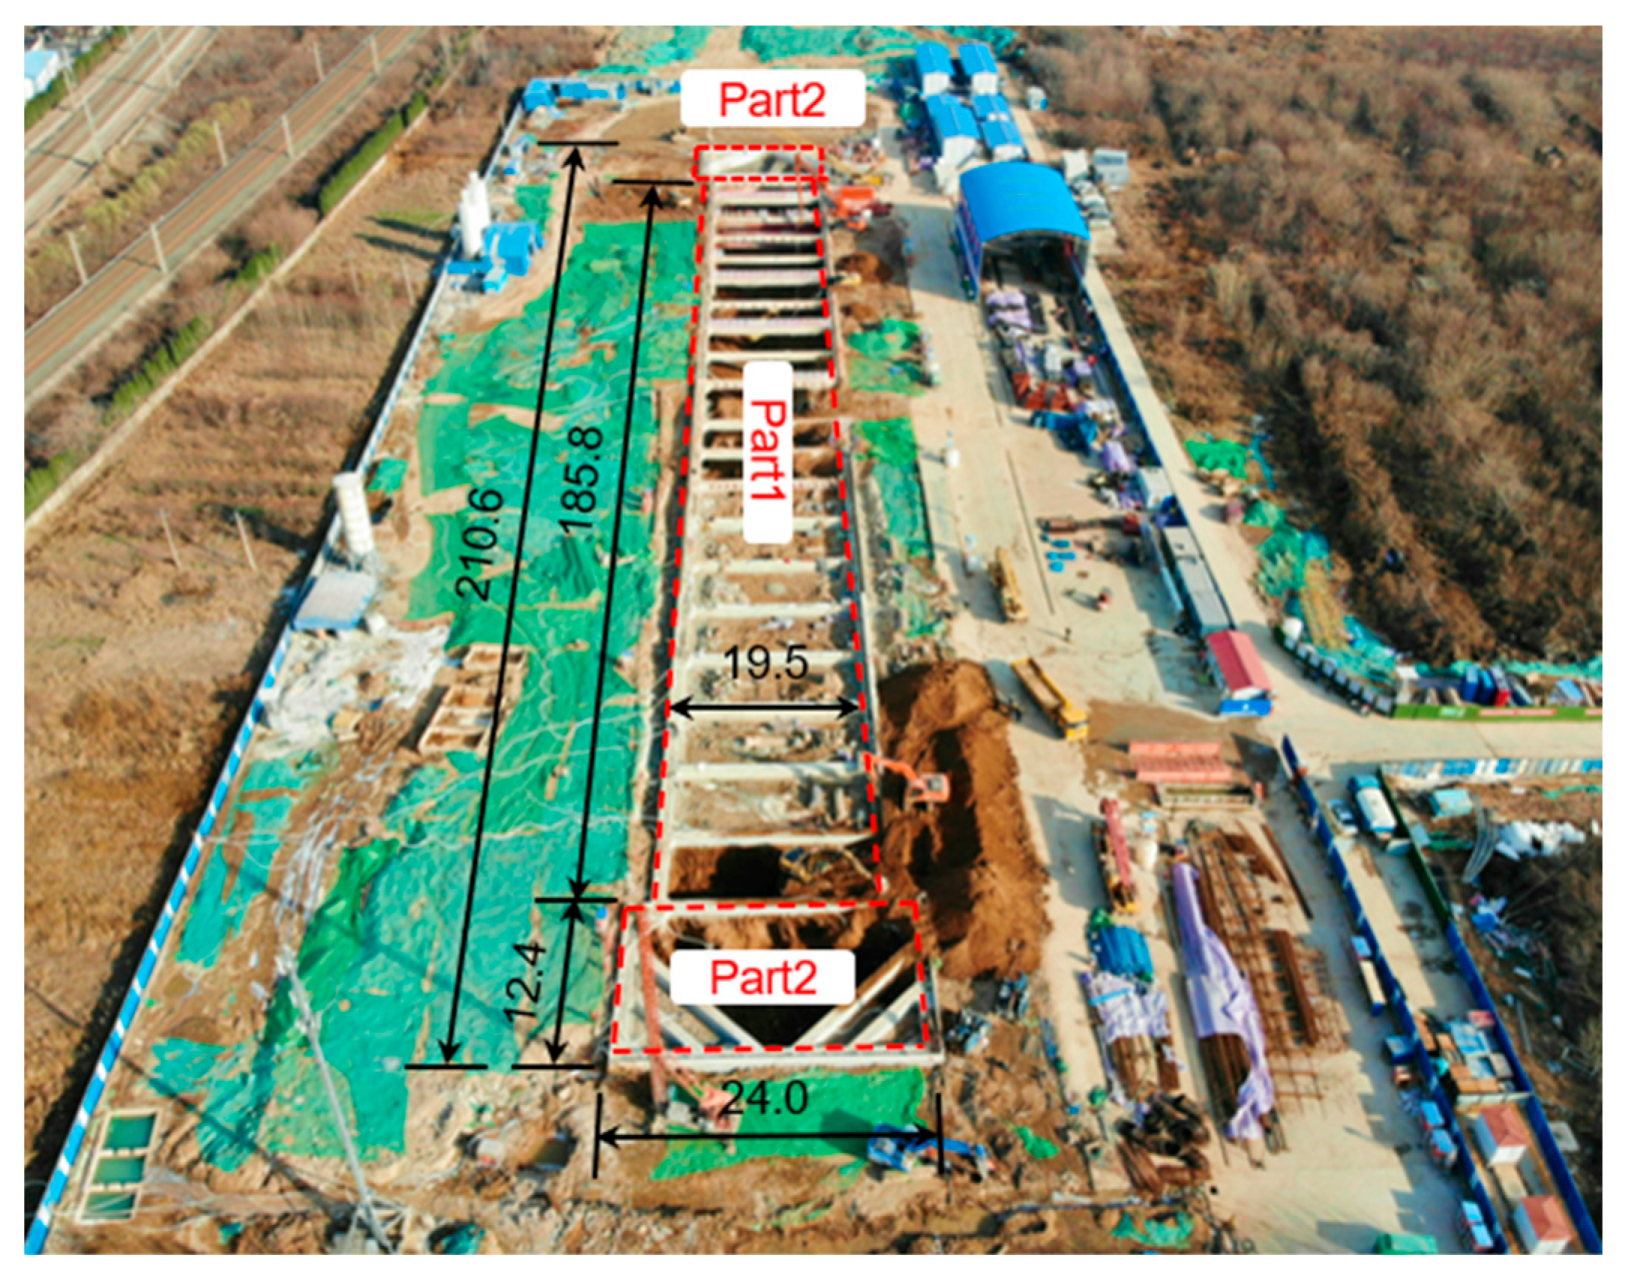
Figure 1. Construction site of foundation pit (unit: m).
Sustainability 15 05432 g001
Figure 2. Standard section profile of metro station (unit: mm).
Sustainability 15 05432 g002
Figure 3. Layout of pumping and recharge wells.
Sustainability 15 05432 g003
Figure 4. Structure of pumping and recharge wells (unit: m).
Sustainability 15 05432 g004
Figure 5. Finite element calculation model (unit: m).
Sustainability 15 05432 g005
Figure 6. Simulation of recharge wells.
Sustainability 15 05432 g006
Figure 7. Cloud chart of simulation results under Scheme No.1. (a) Ground settlement; (b) the flux of groundwater recovery; (c) the horizontal displacement of retaining structure; (d) the influence radius of recharge.
Sustainability 15 05432 g007aSustainability 15 05432 g007b
Figure 8. Sensitivity analysis of ground settlement.
Sustainability 15 05432 g008
Figure 9. Sensitivity analysis of the flux of groundwater recovery.
Sustainability 15 05432 g009
Figure 10. Sensitivity analysis of the horizontal displacement of retaining structure.
Sustainability 15 05432 g010
Figure 11. Sensitivity analysis of the influence radius of recharge.
Sustainability 15 05432 g011
Figure 12. Sensitivity analysis of the construction difficulty.
Sustainability 15 05432 g012
Table 1. Parameters of soil layer.
LayerDepth (m)E (MPa)vφ (°)C (kPa)K (m/day)γ (kN/m3)
Plain fill320.80.324.853.70.34517.9
Silty clay1021.60.3420.837.10.00519.2
Clay1622.10.321.344.50.00719.5
Gravel2226.50.2616.328.13.519.3
Residual soil27.528.70.3318.350.81.3817.4
Fully weathered diorite2932.30.2833.432.21.29620.6
Moderately weathered diorite6037.10.1933.934.62.1621.8
Note: E = elastic modulus; v = poisson ratio; φ = friction angle; C = cohesion; K = hydraulic conductivity; γ = unit weight.
Table 2. Orthogonal design table.
Recharge Well ParametersLevel
12345
Depth A (m)1020304050
Distance away from retaining structure B (m)1220406080
Spacing C (m)1020304050
Pressure D (kPa)1020304050
Table 3. Orthogonal table and numerical simulation results.
Scheme No.Recharge Well ParametersL1
(mm)
L2
(m3)
L3
(mm)
L4
(m)
L5
A (m)B (m)C (m)D (kPa)
Control groupWithout recharge−14.26.2825.963.70
110121010−13.926.5726.6463.44
210202020−11.758.2126.8168.37
310403030−9.3110.8227.2873.610
410604040−6.8412.3628.6480.713
510805050−4.5315.8329.1788.216
620122030−8.398.5436.7869.28
720203040−7.9213.4626.7567.411
820404050−4.2816.7432.6771.114
920605010−12.857.2326.1778.812
1020801020−11.2311.3225.9996.110
1130123050−3.1817.2438.8866.712
1230204010−11.837.4926.9269.810
1330405020−10.378.9826.3269.713
1430601030−8.3510.6227.8290.611
1530802040−5.5915.8827.4998.814
1640124020−8.9110.1827.9463.911
1740205030−6.8216.2828.9271.714
1840401040−4.5916.8231.8273.912
1940602050−4.0118.6334.7889.115
2040803010−10.668.6927.5293.613
2150125040−3.2819.8839.7864.815
2250201050−1.2421.3640.4967.913
2350402010−7.629.8727.8471.611
2450603020−5.7413.6328.2376.814
2550804030−4.3716.8428.8783.417
Table 4. Intuitive analysis of ground settlement.
ParametersABCD
No.
K1−46.35−37.68−39.33−56.88
K2−44.67−39.56−37.36−48.00
K3−39.32−36.17−36.81−37.24
K4−34.99−37.79−36.23−28.22
K5−22.25−36.38−37.85−17.24
R224.103.393.1039.64
Ranking of sensitivityD > A > B > C
Optimal schemeA5B5C4D5
Note: Ki is the sum of all test results of corresponding parameters under the i-th level.
Table 5. Intuitive analysis of the flux of groundwater recovery.
ParametersABCD
No.
K153.7962.4166.6939.85
K257.2966.8061.1352.32
K360.2163.2363.8463.10
K470.6062.4763.6178.40
K581.5868.5668.2089.80
R227.796.097.0749.95
Ranking of sensitivityD > A > C > B
Optimal schemeA5B5C5D5
Table 6. Intuitive analysis of the horizontal displacement of retaining structure.
ParametersABCD
No.
K1138.54170.02152.76135.09
K2148.36149.89153.7135.29
K3147.43145.93148.66149.67
K4150.98145.64145.04154.48
K5165.21139.04150.36175.99
R326.6730.988.6640.90
Ranking of sensitivityD > B > A > C
Optimal schemeA1B5C4D1
Table 7. Intuitive analysis of the influence radius of recharge.
ParametersABCD
No.
K1374.2328391.9372.7
K2382.6345.1397374.8
K3395.6359.9373.6388.5
K4392.2416368.9385.6
K5364.5460.1373.2383.0
R431.1132.128.115.8
Ranking of sensitivityB > A > C > D
Optimal schemeA5B1C4D1
Table 8. Intuitive analysis of the construction difficulty.
ParametersABCD
No.
K150485050
K255525555
K360606060
K465656565
K570707070
R520222020
Ranking of sensitivityB > A = C = D
Optimal schemeA1B1C1D1
Table 9. Comparison of recharge schemes.
Scheme No.Recharge Well ParametersL1
(mm)
L2
(m3)
L3
(mm)
L4
(m)
L5
A (m)B (m)C (m)D (kPa)
Control groupWithout recharge−14.26.2825.963.70
Optimized scheme50201040−1.5319.0129.3170.612
Original scheme26152550−5.3116.9834.7365.012
Disclaimer/Publisher’s Note: The statements, opinions and data contained in all publications are solely those of the individual author(s) and contributor(s) and not of MDPI and/or the editor(s). MDPI and/or the editor(s) disclaim responsibility for any injury to people or property resulting from any ideas, methods, instructions or products referred to in the content.