Abstract
China is a rapidly aging nation. Therefore, it is a matter of urgency to address the challenges of aging in China and to coordinate the relationships between population aging, environmental issues, and socio-economic development. However, few empirical studies have thus far analyzed the impact of aging on green total factor productivity (GTFP) in China. Hence, this study employs a global Malmquist–Luenberger index method (GMLI) to calculate the GTFP scores of 30 Chinese provinces from 2002 to 2018. We apply spatiotemporal analysis methods to identify the variations of population aging and GTFP scores and then build a spatial econometric model to examine the impact of population aging on GTFP. Our study findings are as follows. (1) Whereas at the beginning of the 21st century, provinces with deep aging were mostly situated in the east, the population aging issue in China is now spreading across the entire country. (2) From a dynamic perspective, the overall GTFP growth rate in China during the sample period depicts a U-shaped structure with time. (3) Results of the spatial Durbin model show that the impact of population aging in a given region on GTFP is negative, but the spatial spillover effect of aging in neighboring regions on GTFP in a given region is positive, resulting in the loss of younger local labor forces in some provinces due to low birth rates and migration to neighboring regions. Finally, to cope with a growing aging population and to possibly eliminate the negative impacts of population aging on high-quality sustainable development, the government should promote the establishment of the old-age security system; increased investment in R & D and wide use of advanced technology should also be urgently encouraged.
1. Introduction
China has experienced rapid economic growth over the past forty years, primarily due to its resource-based economy. As a consequence, China has not only become the second-largest economy in the world but also suffers from serious environmental degradation caused by the overuse of natural resources, such as coal, which now poses a threat to sustainable development. The trade-off between environmental pollution and sustainable development has aroused significant government attention. As early as 2005, the “two mountain theory”, specifically, “clear waters and green mountains are as valuable as gold and silver mountains”, was formulated to emphasize the importance of balancing economic growth with environmental protection. It also implies that the effective way to improve the environment is to boost productivity [1]. In 2012, the report of the 18th National Congress of the Communist Party of China reinforced the government’s dedication to saving resources, reinforcing environmental protections, and strengthening the ecological civilization, that is, seeking green and sustainable development through productivity gains, environmental regulation, and policies. In 2020, the report of the 5th Plenary Session of the 19th Central Committee clearly stated that the economic and social development of China should adopt a high-quality development mode and promote the overall “green transformation” of economic and social development during the 14th Five-Year Plan period (2021–2025). In other words, the transition from rapid growth to high-quality and sustainable development is well under way. Given the vast improvements in quality of life due to robust economic growth over the years, life expectancy has also climbed [2].
In fact, according to statistics, the proportion of people over age 60 has risen rapidly from 10.45% in 2000 to 18.70% in 2020 [3]. The aging population from 60–69, 70–79, and over 80 now account for 55.83%, 30.61%, and 13.56%, respectively, of the population. At present, people over age 70 bring huge pressures to bear on society because they are less able to care for themselves. However, older people from 60–69 are the even bigger challenge for China within 20 years because they constitute the main source of the senior population. According to the Outline of the Healthy China 2030 Plan, the average life expectancy in China was 76.34 in 2015, 77.3 in 2019, and is expected to reach 79 in 2030 [4]. The increase in average life expectancy is expected to further exacerbate the degree of aging in the future. China will enter into a moderately aging society during the 14th Five-Year Plan period (2021–2025). Most important, however, is that in the next 20 years population aging will inevitably produce a profound impact on China’s economic and social development. Therefore, the resolution of the aging issue in conjunction with building sustainable economic pathways is critically connected.
For example, a series of problems exacerbated by population aging have become increasingly prominent in the recent decade. The government has realized the negative impact of population aging on high-quality development. In response to the ever-increasing aging population, it has formulated and implemented policies to improve the population structure. The Chinese government has introduced the three-child policy so as to soften the impact of the negative externalities of aging on high-quality economic development during the economic transformation. In other words, how to create a harmonious relationship between aging and sustainable development is now a core question for China [5]. During the recent 14th Five-Year Plan period, in addition to a green transformation, an active response to population aging was elevated to a national strategy, Furthermore, the Outline of the Healthy China 2030 Plan also emphasizes the importance of dealing with the challenges of population aging and coordinating the relationship between population aging and environmental issues [4]. Since there are huge spatial disparities in economic level, industrial structure, technologies, and education in particular, population aging will likely become a bottleneck to hinder green transformation and high-quality development. Population aging also varies from one region to another [6], which implies that a “one size fits all” policy will not work in China. One approach, when designing and implementing measures and policies, would be to prioritize precise region-targeted measures and policies during the design phase in the context of aging; such an approach is likely to help promote overall rapid high-quality development in China.
The paper contributes to the issues set out in three distinct ways. First, we apply a geo-visualization technique to map the spatiotemporal variations of population aging in 30 Chinese provinces from 2002 to 2018 with the aim of displaying the changes in the intensity of spatial clustering of aging over time and better understanding the role of aging in GTFP in a spatial dimension. Second, we use the global Malmquist–Luenberger index (GMLI) method proposed by Oh [7] based on traditional total factor productivity (TFP) to calculate the GTFP scores of the 30 provinces from 2002 to 2018. The spatiotemporal distribution of GTFP is also discussed. We notice huge differences in the GTFP scores across provinces. The implication of this finding is that, once again, more effective region-oriented measures and policies should be formulated in accordance with local conditions. Third, from the spatial distribution of GTFP and population aging, we observe strong spatial clustering. Thereafter, both the spatial spillovers of GTFP and population aging are incorporated to build a fixed effects spatial Durbin model (SDM) able to quantify the direct and indirect effects of population aging on GTFP. The use of SDM can be regarded as the most valuable part of our research. This is because it can fill a research gap in the existing literature, in that as far as we know no study has quantified the spatial spillover effect of aging in neighboring regions on GTFP in specific regions. The most important finding of our work is to confirm a positive spatial spillover effect of aging on GTFP, implying that population aging in neighboring provinces can help increase the GTFP of a given province due to competition caused by population mobility between adjacent provinces. Moreover, the main findings will help policymakers design and implement region-targeted measures and policies to alleviate the negative impacts of aging on high-quality development, but such policies and measures will also help to achieve the sustainable development goal in China.
The structure of this paper is organized such that Section 2 is a literature review. Section 3 introduces methods and data sources. Section 4 presents the spatiotemporal variations of GTFP and aging and the estimation results of classical and spatial econometric models. Conclusions and policy implications round out the paper in Section 6.
2. Literature Review
2.1. Research on GTFP
A method for evaluating productivity, known as the Malmquist productivity index, was first derived by Malmquist in his seminal work [8]. As environmental awareness increases, industrial byproducts, such as pollutants, which are also called ‘undesirable outputs in the production process’, are being incorporated into the evaluation model [9] in a bid to obtain a more exact productivity index. It is also referred to as ‘green productivity’ because the negative consequences of environmental pollution are considered [10].
However, the conventional Malmquist productivity method suffers two drawbacks. One is not satisfying circularity, and the other is that adjacent time productivity scores provide different measures of productivity change. To overcome the two problems, Pastor and Lovell [11] developed a new global productivity index, but still neglected to account for undesirable outputs. Subsequently, Oh [7] proposed another new global Malmquist productivity index, incorporating both desirable and undesirable outputs, known as the Global Malmquist–Luenberger Index (GMLI) or GTFP. Since then, it has gained credibility in assessing the productivity of countries [12] and industrial sectors [13]. For example, Feng et al. [14] investigated the GTFP changes in the metal industry of 30 Chinese provinces from 2000 to 2015. They found that GTFP increased by 11.52% every year. Xia and Xu [15] assessed the quality of growth of 30 Chinese provinces over the period of 1997–2015, measured by the GTFP index; conclusions showed that GTFP exhibited no positive growth for most provinces in most years, although GDP was growing fast. Liu et al. [16] evaluated the agricultural GTFP of 30 Chinese provinces from 2005 to 2017 and found an inverted U-shaped trend over the sample period.
Other researchers have focused on the driving factors of GTFP, such as factor market distortion [17], internet technology [18], land transfer marketization [19], political competition [20], foreign direct investment [21], energy consumption transition [22], financial agglomeration [23], green finance [24], green innovation [25], trade openness [26] investment in green technologies [27], and environmental regulation [28,29]. In addition, some studies have taken a few policies as quasi-natural experiments and investigated the policy effects on GTFP, for example, SO2 emissions trading scheme [30], free trade zone [31], e-commerce city pilot [32], emission trading system [33], smart city policy [34], and carbon trading [35]. Overall conclusions from empirical studies confirm that many factors can impact GTFP.
2.2. Research on the Impact of Aging on Productivity
As the issue of aging becomes increasingly prominent, the impact of aging on productivity has aroused interest from researchers. However, conclusions have not reached a consensus on the relationship between aging and productivity [36]; studies confirmed both negative and positive impacts.
From a negative research perspective, aging is seen to inhibit productivity growth mainly through human capital. Specifically, population aging has a depressive effect on human capital, since aging workers are subject to gradual reductions in their cognitive ability and other productivity-reducing effects of aging [37]. An increase in the aging population implies a lower labor supply and higher labor force costs that weaken economic growth and productivity [38]. Moreover, as people age, physical strength declines, leading to a decrease in productive capacity and impaired labor productivity [39]. Productivity also declines with age due to skill obsolescence, that is, the atrophy of skills associated with aging negatively impacts human capital; this is also known as technical skill obsolescence [40]. However, it is argued that these negative impacts can be offset to some extend by introducing non-discriminatory employment policies, improving worksite condition and retraining [41]. From a macro perspective, as the share of older workers increases and due to the widespread opinion that older workers are less productive than younger workers, the aging population is likely to have a negative impact on overall productivity [42].
However, from a positive research perspective, aging is seen to raise total factor productivity (TFP) because of investment in human capital and knowledge accumulation. Specifically, the ever-growing aging population promotes opportunities for an increase in human capital investment to reduce the dampening effect of aging on productivity, i.e., population aging promotes productive capacity [43]. Compared to younger workers, older workers usually have more experience in production and can make fuller use of their experience to increase productivity. For example, Liu et al. [39] investigated the determinants of agricultural TFP in China and found that the elderly population had a significant and positive impact on technical efficiency improvement. Similarly, Li et al. [43] found that population aging impacted positively agricultural GTFP in China. From a micro perspective, a case study using microdata of the assembly plant of truck manufacturing by Börsch-Supan and Weiss [42] showed that the average age-productivity profile of workers increased until age 65. Although older workers were slightly more likely to make errors, they seldom made severe errors. In other words, the implication here is that older workers can grasp difficult situations and then focus on the important tasks. It is also noteworthy that the increase in labor costs caused by aging may also have a positive effect on TFP. For example, using panel data of 22 emerging countries, Chen et al. [44] explored three mediating effects of labor costs on TFP and found that TFP turned out to be the main channel in which labor costs affect energy intensity. In another study using a panel data set of 30 provinces from 2010 to 2019, Qian and Wang [45] found that the passive increase in labor costs caused by aging significantly promoted GTFP in China. Some researchers have concluded that the relationship between aging and productivity is nonlinear. For example, Hu and Cao [46] found an inverted U-shaped curve between population aging and TFP in China’s manufacturing industry.
Although various modeling approaches and different datasets have been applied, the abovementioned research shows that conclusions on the impact of population aging on productivity have not yet reached a consensus. A reasonable explanation may be because we assume that observations are independent. In other words, migration of labor forces and spatial spillovers have been ignored, and the omission may cause biased conclusions and even undermine the foundation of empirical studies. From the spatiotemporal distribution of population aging, it is not evenly or randomly distributed but rather, presents spatial clustering. In addition, population migration has also been attributed to the uneven distribution of aging, which results in higher spatial clustering. Specifically, we assume that the young labor force in less developed regions tends to move to developed regions, thus causing not only accelerated aging in less developed regions, but also contributing to promoting productivity in developed regions. In other words, due to migration, population aging seems to occur more slowly [47], which may in turn promote GTFP. In this sense, we propose a research hypothesis that population aging has a positive spatial spillover effect on GTFP. To verify the hypothesis, spatial interaction effects should be incorporated to build spatial econometric models, namely SDM.
3. Models and Data Sources
3.1. GTFP
The expression of GMLI is written as [7]:
where EG(xkt+1, ykt+1, bkt+1) and EG(xkt, ykt, bkt) represent the efficiency values of decision-making unit (DMU) k in t + 1 and t measured in production frontiers is constituted by all DMUs in all periods, respectively. GML represents the efficiency change rate of the current period relative to the previous period; GML > 1 means growth, while GML < 1 indicates decline. The GMLI is used in the research to represent the GTFP.
3.2. Spatial Econometric Model
Let us first introduce an ordinary least squares (OLS) model used as the reference model. It is as shown as:
where yit represents the dependent variable of province i in year t. In the research, yit is the GTFP score. Xit represents a set of independent variables; β are parameters to be estimated; α is a constant term; μi represents the province fixed effect and εit is a random error.
We assume that observations are mutually independent in a classical econometric model. However, mapping the GTFP scores and population aging of Chinese provinces enables us to discover that the observations are not randomly distributed, but instead are inclined to present spatial clustering. In other words, the observations of proximate provinces tend to have similar values. Technically speaking, there is spatial autocorrelation. Spatial clustering has been ignored in classical models and neglecting it could result in a biased estimate for our study. To solve this problem, we introduce a spatial lag model incorporating the spatially lagged dependent variable (i.e., GTFP) based on the classical OLS model. Shown as follows, it is:
where Wyit is the spatial lag term of the dependent variable used to capture spatial clustering. In our study, it is also referred to as spatial interaction effects. ρ is a coefficient to be estimated, known as the spatial autoregressive coefficient. W represents an n × n spatial weight matrix for describing the spatial arrangement of Chinese provinces. We adopt a rook contiguity spatial weights matrix, whose elements are equal to 1 if two provinces have common boundaries, and 0 otherwise. All other variables are the same as in Equation (2).
Following the idea of the above spatial lag model, an explanatory variable may also have spatial interaction effects; these would indicate the impacts of driving factors of neighboring provinces on the GTFP of a particular province. As per the idea of including the dependent variable, spatial lags of explanatory variables can also be incorporated based on Equation (3). From the econometric perspective, it is of great theoretical significance to these spatial lags because the omitted-variable issue may lead to biased conclusions. As a result, another spatial econometric model can be shaped, namely the spatial Durbin model, expressed as:
where WX represents the spatial lags of explanatory variables used to capture the spatial interaction effects of explanatory variables. θ are parameters to be estimated. All other variables are the same as in Equation (3).
3.3. Variables in the GTFP Model
From the GMLI equation, three indicators are required, namely input, desirable output, and undesirable output. Specifically, there are three inputs. With regard to the labor force input, the quantity of employment of the whole society was used as a labor input indicator. The energy input is measured as the consumption of standard coal equivalent. The data for capital are not directly available from the yearbooks; therefore we have adopted the perpetual inventory method to calculate the capital stocks of 30 provinces during the sample period [17]. The formula is given as:
where Ki,t, δi,t, and Ii,t represent the capital stock, capital depreciation rate, and fixed-asset investment of province i in year t, respectively.
Outputs include two types, namely desirable and undesirable. Specifically, gross provincial product (GPP) was treated as a desirable output. It is noteworthy that, according to the deflation index, nominal GDP was deflated to the actual GDP of the year 2000 as the base period. We also consider two undesirable outputs, namely sulfur dioxide (SO2) and chemical oxygen demand (COD) emissions. The former is a primary source of atmospheric pollution, while the latter is an important indicator for measuring wastewater pollution.
3.4. Variables in the Spatial Econometric Model
In our study, when investigating the impact of aging on GTFP, GTFP is the dependent variable in the model, whereas aging is a core independent variable. As per the data availability in the China Statistical Yearbooks, we have adopted an aging index widely used in most empirical studies, defined as the ratio of people aged 65 or older to the total population [48]. This index increases as the population ages. According to the World Health Organization (WHO), when the index reaches 7% or higher, a country is called an aging society; 14% or higher, an aged society; and 20% or higher, a super-aged society [49]. Along with the aging index, other exogenous independent variables also need to be controlled for in order to prevent omitted-variable bias. Specifically, we consider five control variables, namely, fiscal decentralization (FD), environmental regulation (ER), energy structure (ES), the proportion of medical expenditure to the total (Med), and income (PerGPP).
Fiscal decentralization (FD). The impacts of FD on GTFP are twofold. First, it may have a negative impact on GTFP because the GDP-oriented tournament urges local governments to pay closer attention to rapid economic growth than to pollutant emissions control and environmental protection, which in turn may inhibit GTFP. In other words, as the extent of FD increases, the higher the fiscal autonomy of local governments, and the lower GTFP. On the other hand, FD can promote GTFP since fiscal decentralization can give greater autonomy to local governments, which in turn can allocate resources as per their specific conditions and thus improve resource use rates to increase GTFP. Since the conclusions are ambiguous, we do not hypothesize the impact of the FD on GTFP. FD is defined as the ratio of fiscal expenditure of local governments to that of the central government.
Environmental regulation (ER). The impact of environmental regulation is also twofold, namely negative and positive. Negatively, environmental regulation by the government will increase the production costs of regulated enterprises because they need to adjust the optimal production scale and allocate resources to R & D activities, which may impair GTFP. Positively, appropriate environmental regulation may motivate regulated enterprises to increase innovation capabilities and enhance competitive advantage (Porter, 1991), which may ultimately contribute to technological progress and GTFP growth. As with FD, we do not hypothesize the impact of ER on GTFP. Besides, ER is defined as the proportion of pollution discharge expenses to the total.
Energy structure (Energy). Coal as the conventional energy is the primary energy source in China. According to the latest statistics, in 2020 it still accounted for 67.6% of the total energy consumption [3]. Since coal combustion is the main source of various pollutants, e.g., SO2, it is primarily responsible for environmental degradation in China. Notably, as the largest coal consumer in the world [50], China is one of the most polluted countries. China’s historically coal-dominated energy consumption structure is blamed for environmental pollution which consequently impairs GTFP growth. That is, the higher the share of coal, the lower the GTFP. Therefore, we hypothesize that energy structure (Energy) has a negative impact on GTFP. The variable Energy is defined as the proportion of coal consumption to total consumption.
Medical expenditure (Medical). Medical expenditure may exhibit either a positive or a negative impact on GTFP. Specifically, on the one hand, increasing this expenditure not only contributes to the accumulation of health capital, but may also promote GTFP growth, giving it a positive impact. On the other hand, as governments face the ever-growing aging population, they will have to expand fiscal expenditure on healthcare and aging care, which could otherwise have been used for production activities or other fields, e.g., environmental protection. In this case, GTFP growth is hindered. We therefore do not hypothesize the impact of medical expenditure on GTFP. The Med variable is defined as the proportion of medical expenditure to the total.
Income (perGPP). Income plays an important role in GTFP due to two aspects. One is that technologies are closely correlated with income, since high-income regions can propel technological innovations and upgrade production processes, thereby promoting GTFP growth. The second is that high-income regions usually have optimal industrial structures. Specifically, the tertiary industry, which is characterized by low pollution and high value-added, dominates the economies and also contributes to increasing GTFP. Hence, we hypothesize that an increase in income enhances GTFP growth. The income variable is measured by per capita gross provincial product (perGPP).
3.5. Data Sources
The data for the variables in this research are obtained from the China Statistical Yearbook, China Statistical Yearbook on Environment, China Energy Statistical Yearbook, and China Population and Employment Statistical Yearbook. It should be noted that Tibet, Hong Kong, Macau, and Taiwan are excluded from this study due to data unavailability.
4. Empirical Results
4.1. Spatial Distribution of the Aging Index
Before quantifying the impact of aging on GTFP, it is of great practical significance to exhibit the aging index of each province in maps. We apply a geo-visualization technique to map the spatial distribution of population aging in 2002, 2006, 2012, and 2018, as shown in Figure 1.
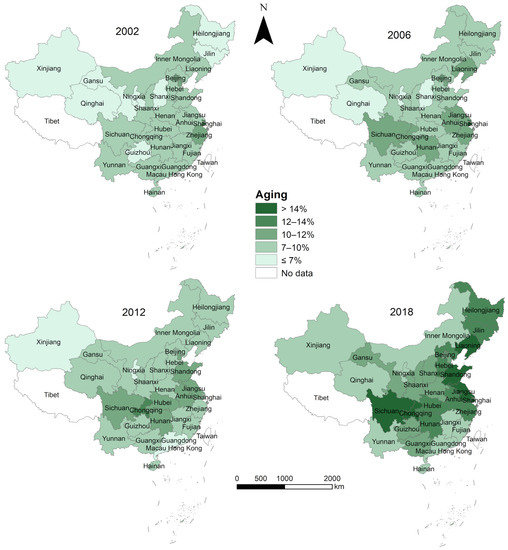
Figure 1.
Spatial distribution of population aging in 2002, 2006, 2012, and 2018.
From a spatiotemporal perspective, the aging index of all provinces shows gradually increasing trends from 2002 to 2018. At the very beginning of the sample period, provinces with a high aging index are mainly located in the eastern coastal region, specifically, Beijing, Tianjin, Jiangsu, Shanghai, and Zhejiang. Notably, the Yangtze River Delta region has a high aging index. Provinces with a medium aging index are mostly concentrated in southwestern (e.g., Sichuan and Guangxi) and central China (e.g., Hubei and Hunan). The northeastern provinces (e.g., Inner Mongolia, Gansu, Ningxia, Xinjiang, and Qinghai) and two northeastern provinces (Heilongjiang and Jilin) have low aging indexes characterized by low economic levels. In contrast, we found that two economically developed eastern provinces, namely Guangdong and Fujian, have relatively low aging indexes in 2002. One possible interpretation is that, in those two provinces, people followed the tradition of high birth preferences, making the aging index lower than those of other eastern regions [51,52]. Gradually, the high aging index indicates a dispersed trend from east to west. Although we observed some differences in the growth rates of the aging index, most provinces are indeed facing a serious population aging issue. From 2002 to 2006, the eastern region witnessed rapid growth. However, the index slows from 2006 to 2012. By 2018, population aging in most eastern provinces is prominent. In the meantime, the aging index for the middle provinces continues rising from 2002 to 2018.
Importantly, two western provinces (Sichuan and Chongqing) and three northeastern provinces (Heilongjiang, Jilin, and Liaoning) experienced rapid aging rates over the sample period and are now considered to be aged provinces because of the out-migration of the labor force. Young people have migrated from the five provinces to the economically advantageous eastern region for work opportunities and higher salaries; this in turn has aggravated population aging. However, the aging process in other provinces, such as Xinjiang and Qinghai, is relatively slow. Attention should also be paid to Guangdong, an economically developed eastern province. The aging index in 2018 is 8.26%, much lower than that of other eastern provinces, indicating an optimal young population structure. In addition to strong birth preferences, Guangzhou has attracted a significant number of the young labor force who wish to settle down; this further optimizes the population structure and lowers population aging. We surmise that this particularity accounts for the continued rapid economic growth in Guangzhou. The final study period of 2018 shows that all 30 provinces have become aged: the aging index surpasses 7%.
However, to better display the changes in the growth rates of the aging index, we calculated the differences in the aging index between 2002 to 2018; the spatial distribution is shown in Figure 2.
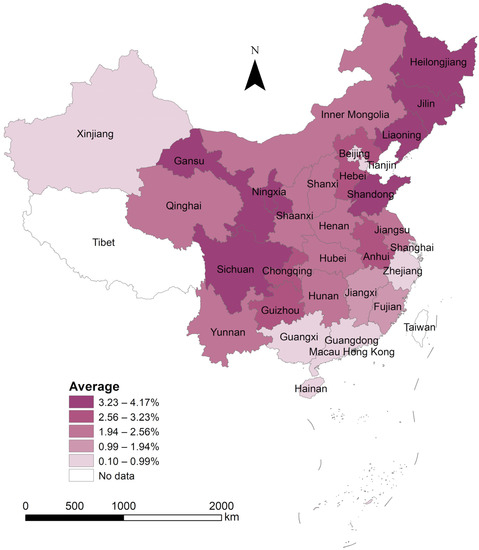
Figure 2.
Spatial distribution of the difference in aging index between 2002 and 2018.
In Figure 2 we observe that, with the exception of Beijing and Tianjin, provinces with the slowest aging rates are situated in the southeastern region. The reason is twofold. First, in 2002 Beijing and Tianjin provinces already have a relatively high aging index. Second, a large influx of younger migrants tends to optimize demographic structures and slow aging rates. Similarly, three western provinces, Xinjiang, Yunnan, and Guangxi, have the lowest aging rates in 2002 due to high birth rates.
In contrast, seven provinces are recorded to have the highest aging rates, namely, Heilongjiang, Jilin, Liaoning, Shandong, Gansu, Ningxia, and Sichuan. Some central provinces, such as Henan, Anhui, and Hunan, also have relatively high growth rates. One reasonable explanation for this is that young labor forces tend to flow towards the neighboring economically developed eastern region.
4.2. Spatial Distribution of GTFP Scores
Mapped areas of the spatial distribution of the GTFP scores of 30 provinces are depicted in Figure 3.
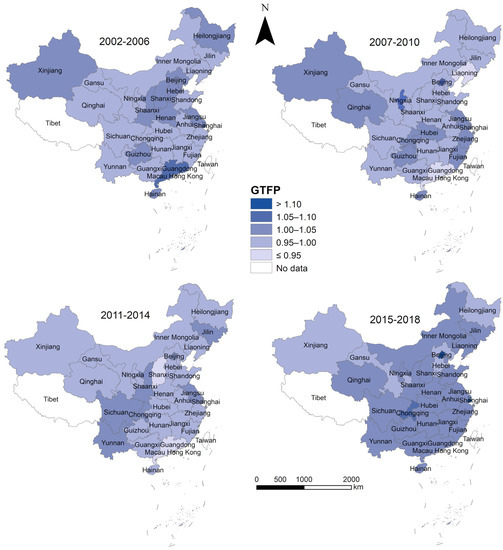
Figure 3.
Spatial distribution of GTFP growth rates by province from 2003 to 2018.
The differences between Figure 1 and Figure 3 show the changes in the GTFP scores of each province for the four time intervals (2002–2006, 2007–2010, 2011–2014, and 2015–2018). From 2002 to 2006, among the 30 provinces, 17 provinces have GTFP growth, and are mainly located in northern China, whereas the GTFP scores of the remaining 13 provinces are less than 1, implying a decline in GTFP. Most of the 13 provinces are underdeveloped western ones. During the period, Guangdong, Shanghai, Beijing, and Tianjin have the highest average annual growth rate of GTFP. Later, from 2007 to 2010, most provinces with the highest GTFP growth are concentrated in the economically developed eastern region. In addition, three provinces in northwestern China, Qinghai, Ningxia, and Xinjiang, witness high GTFP growth during this time. From 2011 to 2014, in general, southern provinces have high GTFP growth, whereas the GTFP scores in northern provinces decrease, except for Jilin, Beijing, Shandong, and Shaanxi provinces. From 2015 to 2018, most provinces in China have rapid GTFP growth, with the exception of Hebei, Heilongjiang, Gansu, and Xinjiang; the implication here is that China’s overall GTFP has greatly improved during the period. Notably, Beijing, Shanghai, Jiangsu, and Zhejiang witness the highest GTFP growths.
To better understand the overall changes in the GTFP scores of the 30 provinces from 2002 to 2018, we have mapped the spatial distribution of annual change rates in Figure 4.
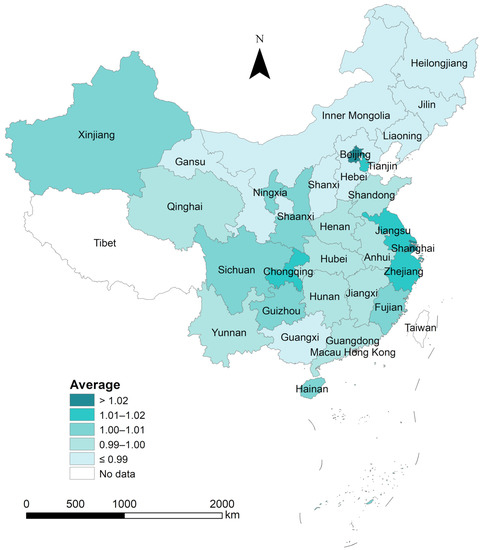
Figure 4.
Spatial distribution of GTFP change rates by province.
Figure 4 shows that provinces with the lowest GTFP growth rates are mainly in the underdeveloped northern region, including the northeastern provinces, Inner Mongolia, Hebei, Shanxi, and Gansu, and one western province (Guangxi). The GTFP in these provinces has likely decreased from 2002 to 2018, indicating that they suffered from low economic growth rates as well as a reduction in GTFP. In contrast, provinces with the highest growth rates, Beijing and Shanghai, are the two most developed municipalities. The GTFP of six provinces (Tianjin, Jiangsu, Zhejiang, Shaanxi, Chongqing, and Guizhou) also increases rapidly across the study period. Finally, we observed that provinces with a GTFP lower than 1.000 were mostly located in central China. From the above analysis, we can conclude that the changes in GTFP growth of 30 provinces are not randomly distributed but instead present as strong spatial clustering. The spatial spillovers of GTFP should therefore be incorporated into the model. Otherwise, biased conclusions are likely to result.
4.3. Results of Classical and Spatial Panel Data Models
Prior to estimating the spatial econometric model, we first provide below the results of the classical econometric models as our reference models. Included are the fixed effects model and the random effects model, with estimation results given in Table 1.

Table 1.
Results of classical panel data models.
To verify which is the better model, the fixed effects or the random effects, we performed a Hausman test. The null hypothesis can be strongly rejected, indicating that test results favor the fixed effects model (Model 1) against the random effects model (Model 2). From the second column in Table 1, estimation results show that all variables are significant at a 1% significance level. Specifically, we observed that the estimated coefficient of the Aging variable is negative, indicating that population aging does inhibit GTFP; this finding is consistent with research by Mason and Lee [37]. The coefficient of the FD variable is also negative, indicating that an increase in fiscal decentralization lowers GTFP growth. The impact of environmental regulation (ER) on GTFP is positive, indicating that increasing the stringency of environmental regulation contributes to GTFP growth. The Energy variable has a negative impact on GTFP, showing that the coal-dominated energy structure is the main reason for low GTFP scores. The estimated coefficient of the Med variable is also negative, implying that an increase in medical expenditure inhibits GTFP. Lastly, we observe that the PerGPP variable has a positive estimated coefficient, confirming that income plays an important role in GTFP growth.
From Figure 1, the spatial distribution of the GTFP of 30 provinces indicates strong spatial clustering. To ascertain if there is significant spatial autocorrelation, we carried out a Moran’s I test to verify the hypothesis. Moran’s I test results from 2002 to 2018 are set out in Table 2.
Table 2.
Results of Moran’s I test from 2002 to 2018.
Table 2 illustrates that Moran’s I values of GTFP over the sample period are significant and positive, except for five years (e.g., 2002, 2003, 2006, 2007, and 2008), indicating spatial autocorrelation. In the early stage of the sample period, the GTFP scores in maps displayed weak spatial clustering, while the spatial autocorrelation strengthened increasingly in the later stages. On the other hand, in the case of the Aging variable, we observed that Moran’s I values from 2002 to 2018 (except 2014) are positive at a 10% significance level at least, implying strong spatial clustering. Importantly, spatial interaction effects among the provinces should not be neglected when modeling the relationship between aging and GTFP.
Next, we estimated the fixed effects and random effects of spatial lag models and spatial Durbin models incorporating spatial interaction effects. Similarly, the Hausman test results also prefer the fixed effects models. For the sake of completeness, we summarize the results of both the fixed effects and random effects models in Table 3.
Table 3.
Results of spatial lag models and spatial Durbin models.
Table 3 confirms that the spatial autoregressive coefficient ρ of the fixed effects spatial lag model (Model 3) is significant and positive, indicating the existence of spatial interaction effects of GTFP. This finding is in line with Moran’s I test results. On the one hand, it may exhibit significant spatial spillovers of GTFP. On the other hand, increases in the GTFP scores of neighboring provinces contribute to the GTFP growth of a given province. Furthermore, the coefficient ρ of the random effect model (Model 4) is highly insignificant, further supporting the conclusion that fixed effects models should be chosen. However, the spatial lag model merely incorporates the spatial lag of the dependent variable into the model, but ignores the spatial lags of the explanatory variables; this aspect of the model could lead to biased estimates. To address the omitted-variable bias, the fixed effects spatial Durbin model is estimated with results shown in column four (Model 5). We observed that the spatial autoregression coefficient ρ is also significant and positive, but much lower than in the spatial lag model (Model 3), implying that the upward bias is corrected.
Therefore, the fixed effects spatial Durbin model is the best-fitted model for our study. However, LeSage and Pace [53] advise that the estimation results of the spatial Durbin models should not be explained directly; following the suggestions of LeSage and Pace [53] we therefore calculated the direct and indirect effects of these explanatory variables. In particular, the direct effect refers to the impact of an explanatory variable of the given province on the GTFP of the local province, while the indirect effect refers to the impact of an explanatory variable of neighboring provinces on the GTFP of the given province, implying a spatial interaction effect. The total effect is the summation of direct and indirect effects. The direct, indirect, and total effects are summarized in Table 4.
Table 4.
Direct, indirect and total effects of explanatory variables.
5. Discussion
The direct effect of the aging index (Aging) was found to be significant and negative, indicating that population aging has a negative impact on the GTFP of a given province. The more severe aging is, the lower GTFP is in the local province. Population aging profoundly changes the demographic structure. As a result of fewer young people, the ability to innovate declines, thus lowering the local GTFP. Second, population aging increases labor costs and changes the optimal production functions of local enterprises; this too inhibits GTFP growth. Third, population aging suggests that senior labor forces are widely employed, and may lower labor productivity and impair GTFP due to their lower physical strength generally. Fourth, aging causes an increase in local investment in medical expenditures for aging care, which may lead to reduced fiscal spending on other needs such as education, environmental protection, etc., thereby hindering local GTFP growth.
On the other hand, the indirect effect of the aging index is significant and positive, indicating that population aging of neighboring provinces can contribute to GTFP growth of a given province. The main reason is the competition caused by population mobility between adjacent provinces. Specifically, as a province is aging rapidly, it provides limited job opportunities for young people. Due to large differences in economic level and salaries, young people in aged provinces tend to migrate to economically developed neighboring provinces. These younger migrants not only improve the demographic structure of the region, but they also enhance economic growth and GTFP improvements.
The direct effect of fiscal decentralization (FD) is significant and negative, implying that it has a negative impact on GTFP in a given province. In other words, the higher fiscal decentralization, the lower GTFP. One possible interpretation is that after the tax-sharing reform, the central government adopted a GDP-oriented appraisal mechanism. In response, local governments took active measures to stimulate rapid economic growth at the expense of environmental quality. High fiscal decentralization implies that local governments have more autonomy, so they tend to prioritize economic growth at the expense of environmental protection. As a result, the environment worsened and GTFP was thus impaired. In contrast, the indirect effect of fiscal decentralization is positive, implying that the increased fiscal decentralization of neighboring provinces improves local GTFP growth.
We found that the direct effect of environmental regulations (ER) is significant and positive, indicating that environmental regulation improves GTFP growth in a given province. This finding supports the Porter hypothesis. One reasonable explanation is that intensified environmental regulation pushes the regulated enterprises in the local region to innovate production technologies and introduce advanced equipment which can improve GTFP. However, the indirect effect is insignificant.
We observed that energy structure (Energy) has a significant and negative direct effect on GTFP, confirming that a high proportion of coal in the energy structure inhibits GTFP. Notably, a large amount of coal has been consumed in China, and accounts for more than half the world’s total. As mentioned earlier, coal is the main source of various pollutants. Hence, environmental pollutants caused by coal combustion are responsible for GTFP losses in most provinces. However, the indirect effect of energy structure is significantly positive, indicating that coal-dominated energy structure in neighboring provinces contributes to GTFP growth in a given province. One possible reason for this finding is that provinces with high proportions of coal are usually dependent on crude development patterns and tend to adopt lax environmental standards. As a result, energy-intensive and highly-polluting enterprises tend to shift to the region due to the abundance of coal reserves and loose environmental regulations, which impairs GTFP in this region but benefits the GTFP of neighboring provinces.
The Med variable has a negative direct effect on GTFP, indicating that an increase in medical expenditure inhibits GTFP growth in the local province. In facing the severe aging problem, governments will have to increase their expenditures to cope with the huge demand for healthcare and aging care; this affects local economic growth and impairs GTFP. The indirect effect, however, is insignificant.
Lastly, the per capita GPP variable (perGPP) was found to have a positive direct effect, implying that the economic level is an important contributor to GTFP growth in the local province because high-income regions can more easily promote technological progress and thus improve GTFP. However, the indirect effect of per capita GDP is negative. One possible explanation for this is that high-income provinces attract inflows of job seekers and talent from nearby provinces, which not only increases the labor pool and improves the GTFP of local provinces, but may also lead to reducing GTFP in neighboring provinces.
6. Conclusions and Policy Implications
Our main objective in this paper was to examine the impact of population aging on green total factor productivity (GTFP) in China. At the outset, we analyzed the spatiotemporal variations of the aging index of 30 Chinese provinces from 2002 to 2018. Next, we measured the GTFP score of each province during the sample period using the global Malmquist–Luenberger method, and thereafter discussed the spatiotemporal distribution. Lastly, we established a spatial Durbin model to quantify the direct and indirect spillover impact of population aging on GTFP.
The main research findings are, first, that regional differences exist in the aging index among provinces in China. At the beginning of the 21st century, the highest aging index was found mainly in the eastern region; however, the aging rate in the eastern provinces has slowed slightly in recent years, mainly due to the inflows of young people from other areas. Nevertheless, serious population aging gradually began to spread throughout the country over time. Accordingly, the aging problems in the central and western provinces have worsened. Notably, the northeastern region has long been characterized by a net outflow of population, with an average annual population outflow exceeding two million, thus exacerbating the aging problem in this region. In 2018, all 30 provinces entered the phase of moderate aging. A second finding shows regional differences in the change of GTFP. Specifically, 14 provinces witnessed continuous growth over time, and the growth rate in the central-eastern region is faster than in the west. The overall GTFP presents a U-shaped curve from 2002 to 2018 We expect the overall GTFP to continue to increase in the coming years; in other words, the high-quality sustainable development goal can be achieved. Third, although aging can decrease GTFP in a given province, the present research has verified that the positive spatial spillover effect of aging exists; that is to say, an increase in the aging index in neighboring provinces can positively affect GTFP in a province. The main reason is that high aging index regions provide fewer job opportunities to young people, which pushes them to migrate to economically developed neighboring provinces for work. As a result, the migration has caused GTFP losses in the aged provinces but has contributed to the GTFP growth in the neighboring provinces. The focus of our research is on the direct and indirect (spatial spillover) effects of aging on GTFP by means of SDM, rather than TFP (Hu and Cao, 2017), agricultural TFP (Liu et al., 2020), or productivity (Li et al., 2022). Besides, unlike the previous studies mentioned earlier, our study reveals that aging has the strong spatial spillover effect on the GTFP of neighboring regions. Hence, the joint effect of aging should be paid attention to when implementing relevant policies.
Based on this study′s main findings, policy implications can be given. The aging population in China will reach 400 million by 2035, when it will enter the phase of severe aging [54]. To face and cope with the challenge of rapid population aging, a series of policies is urgently needed. First, the government should actively promote the construction of an old-age security system through preferential policies or subsidies. The number of government-funded elderly care institutions should be increased to meet the rising demand for elderly care. Private capital should also be encouraged to invest in the elderly care industry through a series of preferential policies so that private capital-funded institutions can satisfy diversified aging care demand.
Second, the central government should adjust appraisal and evaluation models for local governments, replacing the traditional “GDP tournament” with the novel “GTFP score.” Hence, a prerequisite for them is a deeper understanding of the importance of GTFP, which contributes to achieving the high-quality sustainable development goal. When stimulating rapid economic growth, environment-related indicators should be prioritized. In other words, local governments must see a clear way to reach the trade-off between economic development and environmental protection.
Third, an effective way to cope with the negative impact of aging on GTFP is to increase investment in R & D and promote the widespread use of advanced technologies. Technological progress is a major driving force for GTFP growth. As the R & D investment increases and technologies are innovated, productivity will be greatly enhanced because advanced technologies will also mitigate the negative impact of aging on GTFP by replacing some human labor with equipment.
One final approach to possibly eliminating the negative impact of aging is to increase investment in the education sector, popularize basic education, and promote higher education. There is abundant evidence showing that aging does not reduce labor productivity for a more educated workforce. In addition, as education increases and experience is gained, the accumulation of human capital may be enhanced by aging, which is beneficial for GTFP growth.
Author Contributions
Conceptualization: L.J. and B.Z.; Data curation: X.C. and Y.J.; Formal analysis: L.J. and X.C.; Funding acquisition: B.Z.; Project administration: B.Z.; Validation: L.J. and X.C.; Visualization: Y.J.; Writing—original draft: L.J., X.C. and B.Z; Writing—review and editing: L.J. and B.Z. All authors have read and agreed to the published version of the manuscript.
Funding
This research is funded by the National Natural Science Foundation of China (41901170, 41971183), the Natural Science Foundation of Guangdong Province (2018B030312004), Guangdong Basic and Applied Basic Research Foundation (2019A1515011385), and the Innovation Group Project of Southern Marine Science and Engineering Guangdong Laboratory (Zhuhai) (311021018). All authors have read and agreed to the published version of the manuscript.
Institutional Review Board Statement
Not applicable.
Informed Consent Statement
Not applicable.
Data Availability Statement
The data presented in this research are available on request from the corresponding author.
Conflicts of Interest
The authors declare no conflict of interest.
References
- Xu, S. Overexploitation Risk in “Green Mountains and Clear Water”. Ecol. Econ. 2021, 179, 106804. [Google Scholar] [CrossRef]
- Chen, R.; Xu, P.; Song, P.; Wang, M.; He, J. China has faster pace than Japan in population aging in next 25 years. Biosci. Trends. 2019, 13, 287–291. [Google Scholar] [CrossRef]
- National Bureau of Statistics of China. China Statistical Yearbook 2021; China Statistics Press: Beijing, China, 2021.
- State Council of the CPC Central Committee. Outline of the Healthy China 2030 Plan; State Council of the CPC Central Committee: Beijing, China, 2016. [Google Scholar]
- Bai, C.; Lei, X. New trends in population aging and challenges for China’s sustainable development. China Econ. J. 2020, 13, 3–23. [Google Scholar] [CrossRef]
- Man, W.; Wang, S.; Yang, H. Exploring the spatial-temporal distribution and evolution of population aging and social-economic indicators in China. BMC. Public. Health 2021, 21, 966. [Google Scholar] [CrossRef] [PubMed]
- Oh, D. A Global Malmquist-Luenberger Productivity Index. J. Prod. Anal. 2010, 34, 183–197. [Google Scholar] [CrossRef]
- Malmquist, S. Index Numbers and Indifference Surfaces. Trab. Estadística 1953, 4, 209–242. [Google Scholar] [CrossRef]
- Chung, Y.H.; Färe, R.; Grosskopf, S. Productivity and Undesirable Outputs: A Directional Distance Function Approach. J. Environ. Manag. 1997, 51, 229–240. [Google Scholar] [CrossRef]
- Lin, E.; Chen, P.; Chen, C. Measuring Green Productivity of Country: A Generalized Metafrontier Malmquist Productivity Index Approach. Energy 2013, 55, 340–353. [Google Scholar]
- Pastor, J.; Lovell, C.A.K. A Global Malmquist Productivity Index. Econ. Lett. 2005, 88, 266–271. [Google Scholar] [CrossRef]
- Wu, H.; Ren, S.; Yan, G.; Hao, Y. Does China’s outward direct investment improve green total factor productivity in the “Belt and Road” countries? Evidence from dynamic threshold panel model analysis. J. Environ. Manag. 2020, 275, 111295. [Google Scholar] [CrossRef]
- Chen, S.; Golley, J. ‘Green’ productivity growth in China’s industrial economy. Energ. Econ. 2014, 44, 89–98. [Google Scholar] [CrossRef]
- Feng, C.; Huang, J.B.; Wang, M. Analysis of green total-factor productivity in China’s regional metal industry: A meta-frontier approach. Resour. Policy 2018, 58, 219–229. [Google Scholar] [CrossRef]
- Xia, F.; Xu, J. Green total factor productivity: A re-examination of quality of growth for provinces in China. China. Econ. Rev. 2020, 62, 101454. [Google Scholar] [CrossRef]
- Liu, D.; Zhu, X.; Wang, Y. China’s agricultural green total factor productivity based on carbon emission: An analysis of evolution trend and influencing factors. J. Clean. Prod. 2021, 278, 123692. [Google Scholar] [CrossRef]
- Lin, B.; Chen, Z. Does factor market distortion inhibit the green total factor productivity in China? J. Clean. Prod. 2018, 197, 25–33. [Google Scholar] [CrossRef]
- Wu, L.; Zhang, Z. Impact and threshold effect of Internet technology upgrade on forestry green total factor productivity: Evidence from China. J. Clean. Prod. 2020, 271, 122657. [Google Scholar] [CrossRef]
- Lu, X.H.; Jiang, X.; Gong, M.Q. How land transfer marketization influence on green total factor productivity from the approach of industrial structure? Evidence from China. Land Use Policy 2020, 95, 104610. [Google Scholar] [CrossRef]
- Jin, G.; Shen, K.; Li, J. Interjurisdiction political competition and green total factor productivity in China: An inverted-U relationship. China Econ. Rev. 2020, 61, 101224. [Google Scholar] [CrossRef]
- Yu, D.; Li, X.; Yu, J.; Li, H. The impact of the spatial agglomeration of foreign direct investment on green total factor productivity of Chinese cities. J. Environ. Manag. 2021, 290, 112666. [Google Scholar] [CrossRef]
- Xie, F.; Zhang, B.; Wang, N. Non-linear relationship between energy consumption transition and green total factor productivity: A perspective on different technology paths. Sustain. Prod. Consum. 2021, 28, 91–104. [Google Scholar] [CrossRef]
- Xie, R.; Fu, W.; Yao, S.; Zhang, Q. Effects of financial agglomeration on green total factor productivity in Chinese cities: Insights from an empirical spatial Durbin model. Energ. Econ. 2021, 101, 105449. [Google Scholar] [CrossRef]
- Lee, C.C.; Lee, C.C. How does green finance affect green total factor productivity? Evidence from China. Energ. Econ. 2022, 107, 105863. [Google Scholar] [CrossRef]
- Zhao, X.; Nakonieczny, J.; Jabeen, F.; Shahzad, U.; Jia, W. Does green innovation induce green total factor productivity? Novel findings from Chinese city level data. Technol. Forecast. Soc. 2022, 185, 122021. [Google Scholar] [CrossRef]
- Ding, L.; Wu, M.; Jiao, Z.; Nie, Y. The positive role of trade openness in industrial green total factor productivity—Provincial evidence from China. Environ. Sci. Pollut. Res. 2022, 29, 6538–6551. [Google Scholar] [CrossRef]
- Tong, L.; Jabbour, C.J.C.; Najam, H.; Abbas, J. Role of environmental regulations, green finance, and investment in green technologies in green total factor productivity: Empirical evidence from Asian region. J. Clean. Prod. 2022, 380, 134930. [Google Scholar] [CrossRef]
- Cheng, Z.; Kong, S. The effect of environmental regulation on green total-factor productivity in China’s industry. Environ. Impact Assess. 2022, 94, 106757. [Google Scholar] [CrossRef]
- Tian, Y.; Feng, C. The internal-structural effects of different types of environmental regulations on China’s green total-factor productivity. Energ. Econ. 2022, 113, 106246. [Google Scholar] [CrossRef]
- Hou, B.; Wang, B.; Du, M.; Zhang, N. Does the SO2 emissions trading scheme encourage green total factor productivity? An empirical assessment on China’s cities. Environ. Sci. Pollut. Res. 2020, 27, 6375–6388. [Google Scholar] [CrossRef]
- Jiang, Y.; Wang, H.; Liu, Z. The impact of the free trade zone on green total factor productivity—Evidence from the shanghai pilot free trade zone. Energ. Policy 2021, 148, 112000. [Google Scholar] [CrossRef]
- Cao, X.; Deng, M.; Li, H. How does e-commerce city pilot improve green total factor productivity? Evidence from 230 cities in China. J. Environ. Manag. 2021, 289, 112520. [Google Scholar] [CrossRef] [PubMed]
- Feng, Y.; Wang, X.; Liang, Z.; Hu, S.; Xie, Y.; Wu, G. Effects of emission trading system on green total factor productivity in China: Empirical evidence from a quasi-natural experiment. J. Clean. Prod. 2021, 294, 126262. [Google Scholar] [CrossRef]
- Wang, K.L.; Pang, S.Q.; Zhang, F.Q.; Miao, Z.; Sun, H.P. The impact assessment of smart city policy on urban green total-factor productivity: Evidence from China. Environ. Impact Asses. 2022, 94, 106756. [Google Scholar] [CrossRef]
- Yu, D.; Liu, L.; Gao, S.; Yuan, S.; Shen, Q.; Chen, H. Impact of carbon trading on agricultural green total factor productivity in China. J. Clean. Prod. 2022, 367, 132789. [Google Scholar] [CrossRef]
- Backes-Gellner, U.; Veen, S. Positive effects of ageing and age diversity in innovative companies–large-scale empirical evidence on company productivity. Hum. Resour. Manag. J. 2013, 23, 279–295. [Google Scholar] [CrossRef]
- Mason, A.; Lee, R.; Jiang, J.X. Demographic dividends, human capital, and saving. J. Econ. Ageing 2016, 7, 106–122. [Google Scholar] [CrossRef] [PubMed]
- Choi, K.H.; Shin, S. Population aging, economic growth, and the social transmission of human capital: An analysis with an overlapping generations model. Econ. Model. 2015, 50, 138–147. [Google Scholar] [CrossRef]
- Liu, J.; Dong, C.; Liu, S.; Rahman, S.; Sriboonchitta, S. Sources of total-factor productivity and efficiency changes in China’s agriculture. Agriculture 2020, 10, 279. [Google Scholar] [CrossRef]
- Lovász, A.; Rigó, M. Vintage effects, aging and productivity. Labour. Econ. 2013, 22, 47–60. [Google Scholar] [CrossRef]
- Shephard, R.J. Aging and productivity: Some physiological issues. Int. J. Ind. Ergon. 2000, 25, 535–545. [Google Scholar] [CrossRef]
- Börsch-Supan, A.; Weiss, M. Productivity and age: Evidence from work teams at the assembly line. J. Econ. Ageing 2016, 7, 30–42. [Google Scholar] [CrossRef]
- Li, H.; Zhou, X.; Tang, M.; Guo, L. Impact of population aging and renewable energy consumption on agricultural green total factor productivity in rural China: Evidence from panel VAR approach. Agriculture 2022, 12, 715. [Google Scholar] [CrossRef]
- Chen, F.W.; Tan, Y.; Chen, F.; Wu, Y.Q. Enhancing or suppressing: The effect of labor costs on energy intensity in emerging economies. Energy 2021, 214, 118964. [Google Scholar] [CrossRef]
- Qian, W.; Wang, Y. How do rising labor costs affect green total factor productivity? based on the industrial intelligence perspective. Sustainability 2022, 14, 13653. [Google Scholar] [CrossRef]
- Hu, R.D.; Cao, J.B. The impact of population aging on total factor productivity of China’s manufacturing enterprises: Based on the empirical analysis of Shanghai and Shenzhen A-share listed manufacturing companies. West Forum 2021, 31, 100–111. (In Chinese) [Google Scholar]
- Dostie, B. Wages, productivity and aging. De Econ. 2011, 159, 139–158. [Google Scholar] [CrossRef]
- Xie, B.; Zhou, J.; Luo, X. Mapping spatial variation of population aging in China’s mega cities. J. Maps 2016, 12, 181–192. [Google Scholar] [CrossRef]
- Lin, Y.Y.; Huang, C.S. Aging in Taiwan: Building a society for active aging and aging in place. Gerontologist 2016, 56, 176–183. [Google Scholar] [CrossRef]
- Statistical Review of World Energy. 2020. Available online: https://www.bp.com/content/dam/bp/business-sites/en/global/corporate/pdfs/energy-economics/statistical-review/bp-stats-review-2020-full-report.pdf (accessed on 17 June 2020).
- Liang, Z.; Van Luong, H.; Chen, Y.P. Urbanization in China in the 1990s: Patterns and Regional Variations. In Urban China in Transition; Logan, J.R., Ed.; Blackwell Publishing Ltd.: Hoboken, NJ, USA, 2008; pp. 205–225. [Google Scholar]
- Chen, J.; Retherford, R.D.; Choe, M.K.; Li, X.; Cui, H. Population Policy, Economic Reform, and Fertility Decline in Guangdong Province, China, No. 120; East-West Center: Honolulu, Hawaii, 2009. [Google Scholar]
- LeSage, J.; Pace, R.K. Introduction to Spatial Econometrics. Chapman and Hall/CRC: New York, NY, USA, 2009. [Google Scholar]
- United Nations. The World Population Prospects: 2015 Revision, ESA/P/WP.241 Technical Report; United Nations Department of Economic and Social Affairs: New York, NY, USA, 2015.


Disclaimer/Publisher’s Note: The statements, opinions and data contained in all publications are solely those of the individual author(s) and contributor(s) and not of MDPI and/or the editor(s). MDPI and/or the editor(s) disclaim responsibility for any injury to people or property resulting from any ideas, methods, instructions or products referred to in the content. |
© 2023 by the authors. Licensee MDPI, Basel, Switzerland. This article is an open access article distributed under the terms and conditions of the Creative Commons Attribution (CC BY) license (https://creativecommons.org/licenses/by/4.0/).