Article

Spatiotemporal Dynamic Characteristics and Causes of China’s Population Aging from 2000 to 2020

1
College of Water Resources and Architectural Engineering, Tarim University, Alaer 843300, China
2
Institute of Urban and Rural Planning Theories and Technologies, Zhejiang University, Hangzhou 310058, China
3
Center for Balance Architecture, Zhejiang University, Hangzhou 310058, China
*
Author to whom correspondence should be addressed.
Sustainability 2023, 15(9), 7212; https://doi.org/10.3390/su15097212
Submission received: 15 March 2023 / Revised: 24 April 2023 / Accepted: 24 April 2023 / Published: 26 April 2023

Abstract

:
Aging involves the transformation of the population reproduction mode under the rapid development of the social economy. We studied population survey data based on the WorldPop population statistics website and used ArcGIS to construct a spatial database and implement spatial analysis methods. In this study, we analyzed the spatiotemporal evolution characteristics of population aging and its main influencing factors in counties of China, in order to provide a reference for the formulation of a national population development policy and the construction of a pension system. The results are as follows: ① The situation of population aging in China is becoming more serious, showing a point-line-area spatial pattern and two core–periphery aging patterns of high core–low periphery and low core–high periphery. ② The speed of population aging in China is characterized by rapid growth, large scale, and a high degree. Large areas of growing old before getting rich have emerged in the central and western regions. ③ The aging of the population has gradually spread to the northeast, southwest, northwest, and other regions. Influenced by factors such as population migration, population structure change, transportation facility construction, and geographic environment changes, a trend of aging that has spread across the Hu Huan-Yong line has appeared.

1. Introduction

Population aging is one of the most important demographic characteristics in the 21st century. According to the results of China’s fifth population census in 2000, the proportion of people over 65 years of age in the total population was 6.96%. A report by the United Nations Statistics Division on measuring the degree of social aging points out that an aging society is defined as one in which the population over 65 years old accounts for more than 7% of the total population [1]; according to this definition, China has started to become an aging society. According to the sixth census in 2010, the proportion of people over 65 years old was 8.87%; according to the seventh census in 2020, the number was 190.64 million, accounting for 13.5%, with a year-on-year growth rate of 8.3%. The China Development Foundation estimated that the proportion of the population over 65 would likely exceed 14% by 2022, marking the beginning of a deep aging phase of society. According to a prediction by the United Nations Population and Development Agency, the number of people over 65 years old in China will reach 334 million in 2050, ranking first in the world for the total number of elderly people [2]. China’s aging population shows a trend of large scale, fast speed, empty nest, difficult to support, and not rich first. This means that the country will face the severe challenge of an aging society in the future. How to transition to an aging society smoothly and in a healthy way has become an urgent problem to be solved in population development. To this end, China has issued a series of policy documents to clarify the national strategic position of “Building a Healthy China”. The 2022 Government Work Report also puts forward goals to “actively respond to the aging of the population, continuously accelerate the design of the top-level system, optimize the supply of urban and rural pension services, build a pension system framework with social protection and healthy pension as the core, and promote the high-quality development of the aging cause and industry”. Addressing the aging population has also risen to the level of national strategy. The problem of the aging population in China has become a hot topic of concern for the government, scholars, and the public [3].
Population aging is accompanied by the development of social aging, and the research on population aging also involves sociology, geography, economics, demographics, and many other fields. A number of European countries, including France, Sweden, and the United Kingdom, are the first to enter into an aging phase. Since the 1970s, such aging has gradually spread to Asia and the Americas. In the 21st century, the speed of global aging is accelerating.
Flynn found that 75% of the elderly population in the United States live in metropolitan areas, and half of them are concentrated in central urban areas, forming typical “retirement” centers [4]. According to the American Community Survey, between 2005 and 2009, 17% of the elderly population in the US lived in non-metropolitan areas. About 13.2% of residents in the 52 statistical metropolitan areas were reported to be elderly, with the Miami area, the Northeast, and the Midwest being major retirement centers. Among them, the proportion of elderly people in Miami is as high as 16.7%, and in Pittsburgh it is 18.0%. Since 2000, the elderly population in the US has grown by 29%, while the overall population has grown by only 12%, and the proportion of the elderly population has increased from 12.4% to 14.1%. The main reason for this phenomenon is that baby boomers are approaching the age of 65 and the fertility rate has dropped, hovering at replacement level. The elderly population in the metropolitan cores decreased by 1.5 million in 2010, from nearly 15% to 13% of the total population, and 97% of the increase in the elderly population occurred in suburbs and exurbs [4,5,6].
Since the 19th century, with declining fertility and mortality rates and increasing life expectancy, the population of most European countries has become increasingly old. In the European Union, the proportion of the elderly population is expected to reach around 30% by 2060 [6,7], with population aging growing faster in rural areas than urban areas due to the emigration of young people and the immigration of retired workers [6]. According to the United States Census Bureau’s report “An Aging World: 2015” (covering 141 countries), Europe is and will continue to be the most rapidly aging region in the world, with the proportion of older people expected to rise from 17.4 to 27.8% by 2050. Surprisingly, the populations in Asia, Latin America, and the Caribbean are aging at the same rate, with the proportion of older people growing slightly faster than in Europe. It is estimated that by 2050, the elderly population in Korea will reach 38% [5,8,9]. In Japan, the elderly accounted for about 25% of the population in 2015, indicating that it has entered a super-aging phase. The aging phenomenon during periods of rapid economic growth is mainly concentrated in rural areas, where large numbers of young people migrate [10,11]. These young migrants gather in cities and gradually age, which aggravates the aging of the urban population [12,13]. After the 1980s, 35% of the elderly population in Japan was concentrated in three metropolitan areas. By the 1990s, the spatial expansion of aging within metropolitan areas had increased [14]. Because these immigrants lack a common cultural background or blood relationships, they experience obvious social isolation. Therefore, the construction of age-friendly cities is emphasized [15].
With regard to international research progress, most scholars focus on the development trend of population aging [16], the spatial distribution characteristics of population aging [17,18], and the relationship between the population aging process and economic development [19]. Moreover, studies have also been focused on social services [20,21], social discrimination [22], and housing needs [23,24] of the aging population. In addition, some scholars have explored the migration of elderly populations to urban centers [25] and the motivation of elderly populations to stick to rural areas [26]. Flynn and Pan comprehensively analyzed the problems faced by an aging society from the perspectives of economy, society, environment, and geography, and put forward corresponding countermeasures and policy suggestions. Dong-Woo analyzed the trend of population aging from the perspective of population structure change, mainly using the aging coefficient and the ratio of young to old to describe the population structure. Areas with a ratio of old to young below 15.0% are referred to as young population areas, areas with a ratio between 15.0% and 30.0% are adult areas, areas with a ratio between 30.0% and 50.0% are in the initial stage of the elderly type, areas with a ratio between 50.0% and 70.0% are in the growth stage of the elderly type, and areas with a proportion of the elderly population exceeding 70.0% are in the mature stage of the elderly type. This study also described the impact of demographic changes on the trend of population aging by stages [27].
Relatively speaking, research on China’s aging problem started late but developed rapidly. Scholars have carried out research on spatial and temporal differentiation [28,29], the evolution process [30], the formation mechanism [31], trends and forecasts [32,33], the pension problem [34], and the correlation with economic society [35]. Scholars have mainly explored and studied the aging phenomenon in different regions in China from the national [36], urban agglomeration [37], provincial [38], and city and county [39] levels. The research method has gradually changed from traditional statistical analysis to a combination of statistical analysis, spatial analysis, and ArcGIS technology. Research methods such as space exploration analysis and geo-probes are also frequently used [40]. There are increasing research results in the cross-disciplinary fields of geography, sociology, and economics. Looking at the existing research, there are two main types of research on the regional differentiation of China’s aging population: The first type looks at the provincial level to analyze the change characteristics of differences in aging among the eastern, central, and western regions or between provinces, and finds that the degree of aging in the three regions decreases from high to low [41]. The second type takes prefecture-level cities as the research object, which can depict spatial changes in the elderly population in the province [42], but due to the large research scale it is impossible to describe and judge the national aging situation in detail [43]. Based on this, the intention of this study was to start from the national county scale, which can not only describe the spatial difference characteristics of the aging population in small regions, but also help to show the dynamic spatiotemporal characteristics of the national aging process, to make up for the shortcomings of the above two scales.
In China, a developing country, from 2000 to 2020, the birth rate remained at 10–14‰, and the impact of the birth rate on population aging has not been obvious. However, after 2020, the birth rate declined sharply to 6.77‰ in 2022. By the end of 2022, the population of China was 1411.75 million, 850,000 less than that at the end of 2021. Annual births amounted to 9.56 million, for a birth rate of 6.77‰ [44], and 10.41 million people died, for a mortality rate of 7.37‰. The natural population growth rate is −0.6‰. This is the first time that China’s population has experienced negative growth since 1962 (that is, nearly 61 years). In the future, the negative population growth will continue, and the pension problem will become more serious [45]. The next 20 years will be the golden period for the development of China’s pension industry. The large scale, wide scope, and heavy task of old-age care represents an urgent problem to be solved for a country with a large population. China wants to reasonably plan and construct the development of the old-age care industry in the next 20 years [46]. In order to formulate different old-age support strategies for different regions, it is necessary to study the spatial change characteristics, current situation, and trend of population aging in China in the past 20 years. Based on this, this paper analyzes the evolution characteristics of population aging from 2000 to 2020 and the main influencing factors. The purpose is to provide a basis for China to formulate different pension strategies for different regional needs.
This study provides two important contributions to the literature. First, we analyzed the spatial change characteristics, growth rate, and growth trend of China’s population aging. We summarized the change laws of population aging in countries with large populations, providing a reference basis for other developing countries to address the issue. Second, we analyzed the main influencing factors of population aging based on the actual situation of China’s population evolution. We found that changes in factors such as population migration, population structure, transportation networks, and geographic environment are closely related to population aging. These conclusions provide an important reference for China and other countries to address the issue of population aging. In particular, China can formulate targeted policies and strategies based on population aging trends and major influencing factors to alleviate the upcoming serious aging problem.

2. Methods and Materials

2.1. Research Methods

  • Aging Index
The index of population aging degree mainly includes the aging coefficient and the ratio of old to young. The aging coefficient reflects the aging degree of the population in a specific area by calculating the proportion of elderly population among the total population (when the United Nations defined the age structure of the population in 1956, 65 was taken as the starting age of the elderly population [47], so the definition standard of the elderly population in this study is over 65 years old). In addition, the ratio of old to young is often used to reflect the balance of the population in the region by comparing the number of elderly people over 65 years old to the population aged 0–14. If the aging coefficient of a region is high but the ratio of old to young is low, it indicates that the region has not entered a period of population decline. If the aging coefficient and the ratio of old to young are both high, it reflects that the region may be entering a period of absolute population decline and the population structure is seriously unbalanced.
2.
Aging Rate
Different regions are in different periods of population transition, so the measurement of population aging degree can only represent the results of one period and cannot dynamically describe the population aging of the region. In order to study the speed of population aging in different regions, we used an exponential growth model to simulate the process. The model was first constructed by Rogers and Woodward in the US, and is often used to describe the dynamic process of population aging [48]. Subsequently, Djernes and others optimized the model. In this study, the latest calculation method is used to describe the dynamic differentiation characteristics of population aging speed in each district and county [49]. The calculation formula is:
s i ( 65 + ) = 1 n ln [ p i m + n ( 65 + ) p i m ( 65 + ) ]
s i ( 0 + ) = 1 n ln [ p i m + n ( 0 + ) p i m ( 0 + ) ]
T A i ( 65 + ) = s i ( 65 + ) s i ( 0 + )
where m is the year and m + n is the year after n ;   p i m ( 65 + )  is the number of elderly and  p i m ( 0 + )  is the total population in district i in year m p i m + n ( 65 + )  is the number of elderly and  p i m + n ( 0 + )  is the total population in county i after n years;  s i ( 65 + )  is the average growth rate of the elderly population and  s i ( 0 + )  is the average growth rate of the total population in county i; and    T A i ( 65 + )  is the concentration of the elderly population in county i, which depicts the aging speed of the population and reflects the change speed of the proportion of the elderly population in the county. The larger the value of  T A i ( 65 + ) , the faster the aging process of the population in county i T A i ( 65 + )  = 0 indicates that population aging in county i maintains the status quo;  T A i ( 65 + ) >  0 indicates that the process is advancing rapidly; and  T A i ( 65 + ) <  0 indicates that the process is slowing down and the population is transforming to a younger age.
3.
Standard Deviation Ellipse
The standard deviation ellipse algorithm, which was introduced by sociology professor D. Welty Lefever in 1926, is used to measure the direction and distribution of a set of data [50]. Kozak and other scholars further optimized the algorithm and made the algorithm model into a spatial analysis tool in ArcGIS [51]. The optimized ArcGIS standard deviation ellipse tool can directly analyze the evolution trend, direction trend, and dispersion of urban population aging in China. The center of gravity of the ellipse can represent the center of gravity of the distribution of the elderly population in the whole region. The ellipse area can represent the concentration or dispersion degree of urban population aging. The azimuth angle can be used to analyze the main driving force and direction of population aging. The formulas for calculating the center of gravity, area, and azimuth of the ellipse are:
X = i = 1 m w i × x i i = 1 m w i
Y = i = 1 m w i × y i i = 1 m y i
where  x i  and  y i    are the spatial coordinates of the ith element, w is the weight of the ith element, X and Y are barycentric coordinates of the normalized ellipse, and m is the total number of pixels.
S D E x = i = 1 m ( x i x ˜ ) 2 m
S D E y = i = 1 m ( y i y ˜ ) 2 m
where  x ˜  and  y ˜  are the arithmetic mean centers of  x i  and    y i , respectively; and  S D E x  and  S D E y  are the center of the calculated ellipse.
tan θ = ( i = 1 m x i ˜ 2 i = 1 m y ˜ i 2 ) + ( i = 1 m x i ˜ 2 i = 1 m y i ˜ 2 ) 2 + 4 ( i = 1 m x i ˜ y i ˜ ) 2 2 ( i = 1 m x i ˜ y i ˜ )
  σ x = 2 i = 1 m ( x i ˜ cos θ y i ˜ sin θ ) 2 m
σ y = 2 i = 1 m ( x i ˜ sin θ + y i ˜ cos θ ) 2 m
where θ is the azimuth of the standard deviation ellipse, which is positive if rotated clockwise from due north;  x i ˜  and  y i ˜  are the difference between  x i  and  y i  and  x ˜  and  y ˜ , respectively; and  σ x  and  σ y  are the standard deviation of the x-axis and y-axis, respectively.
In order to describe the spatial variation characteristics of population aging in China, we used the Directional Distribution analysis tool in ArcGIS to create standard deviation ellipses. The main parameters include the ellipse size and weight fields. The ellipse size standard is 1_STANDARD_DEVIATION and the weight field is the proportion of the elderly population in the total population of each city.

2.2. Data Collection

The research data mainly include population, population migration, and main road traffic data. Population data are from the WorldPop website (https://www.portal.worldpop.org/demographics/ (accessed on 26 January 2020)) [52]. WorldPop develops peer-reviewed research and methods for the construction of open and high-resolution geospatial data on population distributions, demographics, and dynamics. WorldPop is based at the University of Southampton and maps populations across the globe. Since 2004, this organization has partnered with governments, UN agencies, and donors to produce almost 45,000 datasets, complementing traditional population sources with dynamic, high-resolution data for mapping human population distributions, with the ultimate goal of ensuring that everyone, everywhere is counted in decision-making. WorldPop provides default subnational population data for all UN agencies, the data that feeds into the DHIS2 health information software used by more than 70 ministries of health covering 2.4 billion people, and the basis for UN estimates of populations affected by disasters and conflicts [53]. The data are also the demographic basis for many health applications, including active use by governments for childhood vaccine delivery, and Imperial College London and University of Washington COVID-19 models that prompted UK and US national lockdowns [54].
We obtained population data of China from 2000 to 2020 using a background application download [53]. The data mainly include three fields: age group, gender, and year of population in each county. Based on the adjustment data of administrative divisions of counties over the years in the Compendium of Administrative Divisions of the People’s Republic of China, we carried out population data fusion and review for counties, and arranged the data according to the administrative division of counties in 2020, so as to carry out a cross-year comparative study on population aging among counties. The population migration data source was Baidu, a big data platform. The data included hundreds of millions of mobile phone communications, app use positioning, and user behavior trajectories [55]. These data have the advantages of high positioning accuracy, full coverage of traffic modes, and wide coverage of users, and thus can reflect the migration relationship of the urban population in China. The research data include uninterrupted and directional OD migration data between Chinese cities from 6 to 26 January 2020 [56], covering the population migration scale of each time period in the first three weeks of the Spring Festival. The data were divided into three categories: daily immigration, emigration, and migration scale between cities. We directly obtained the difference between the scale of immigration and emigration, and the average value, and used the result to depict the net migration emphasis of each city. The final data were main road traffic data in 2020, which were obtained from Baidu Maps by the Python tool, collected on 15 December 2020. It should be noted that due to the lack of population data in some districts and counties, we did not analyze Hong Kong, Macao, and Taiwan.

3. Distribution Characteristics of Population Aging in Different Counties of China

3.1. Spatial Distribution Characteristics of Population Aging

We refer to the United Nations population age structure classification criteria. Areas with more than 7% of the elderly population over 65 years old are old-age areas, those with 4–7% are adult areas, and those with less than 4% are young areas. According to the detailed standard of population aging by Lin [57], Wang [58], and other scholars, the age structure of the population in each county was divided into six types: areas with an aging coefficient below 4.0% are young population type, those with a value between 4.0 and 5.5% are early adulthood type, those between 5.5 and 7.0% are late adulthood type, those between 7.0 and 10.0% are early age type, those between 10.0 and 14.0% are middle-aged type, and those with a proportion of the elderly population over 14.0% are late-aged type. Based on the proportion of the elderly population in the total population in counties in China from 2000 to 2020, according to the above classification standards, the population aging types are graphically represented in Figure 1. It can be found from the figure that the spatial distribution of population aging in counties of China presents the following characteristics.
  • Spatial pattern of point-line-face
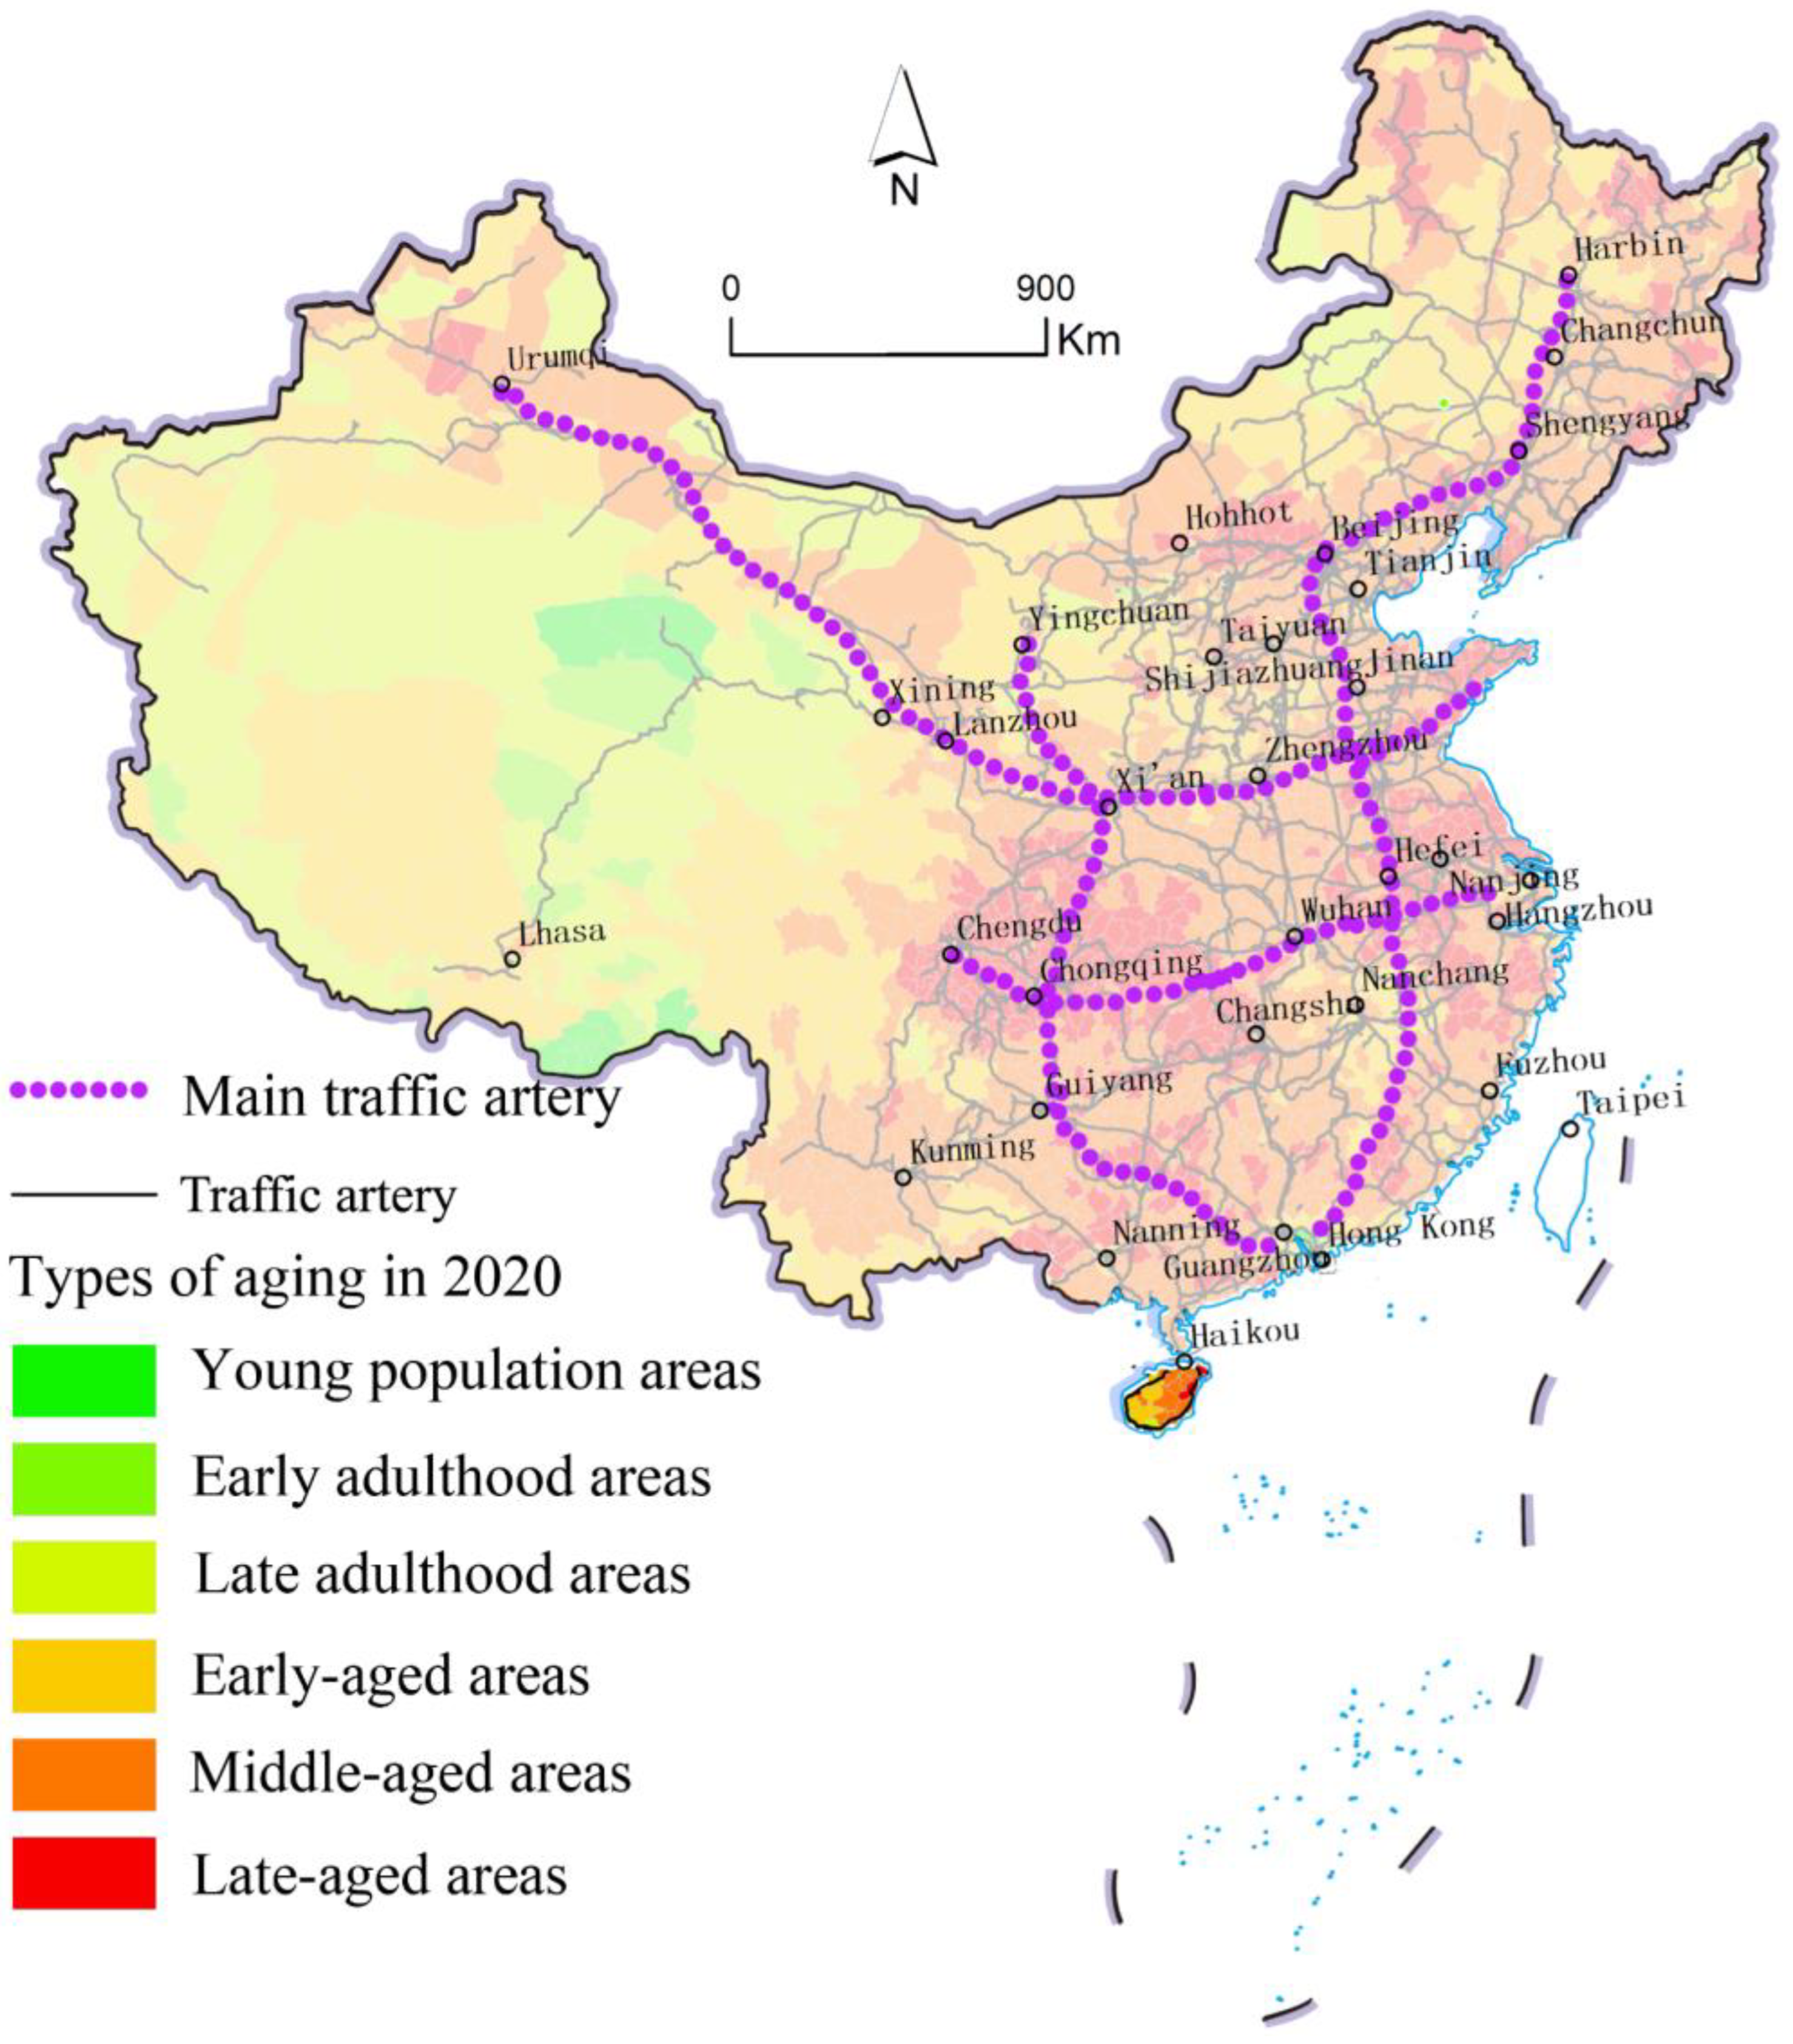
The aged areas in 2000 are represented in the form of dots, concentrated in the west of Chongqing City, the east of Sichuan, and the east of Jiangsu, and the later-aged areas are mainly concentrated in the east of Jiangsu. Over time, the aging population areas have spread along the main traffic arteries, forming linear areas such as the Lanzhou–Xinjiang, Sichuan–Hunan, and Beijing–Shanghai lines. Since 2015, the linear structure has evolved into a zonal and planar structure. From 2015 to 2020, the elderly population areas formed a planar structure with the Yangtze River Delta, Chengdu–Chongqing, and other urban agglomerations as the core, including three urban belts: Urumqi–Lanzhou–Chongqing–Nanning, Shenyang–Tianjin–Nanjing–Fuzhou, and Chongqing–Wuhan–Hefei.
2.
There are two core–periphery aging patterns in China: high core–low periphery and low core–high periphery.
High core–low periphery, also known as an uplift structure, means that the aging level in urban agglomerations and provincial or municipal core areas is higher than that of surrounding areas, such as in the northern slope of the Tianshan Mountains, Lanxi, and Harbin–Changcheng urban agglomeration. The urban agglomeration on the northern slope of Tianshan Mountain is the most typical. In 2020, the aging level of the main counties in urban agglomerations was expected to decrease from the core to the two wings, and the population type to change from adult to middle-aged. Urumqi, Shihezi, and other high-value cities in the center with aging populations are surrounded by low-value counties with aging populations. Low core–high periphery is also considered to be an aging collapse structure. The aging level is lower in many urban agglomerations, provinces, and city core areas than in the surrounding areas, such as Guangdong, Chongqing, Beijing, and Shanghai. Among them, Guangdong Province is the most typical. By 2020, Shenzhen maintained the young population type; the core area of Guangzhou was dominated by the adult population type, while middle- and late-aged areas gradually appeared in the periphery, forming the characteristic of increasing aging level from the core to the periphery.

3.2. Population Aging Growth Rate and Type

The aging population in China’s counties is growing rapidly at a large scale and to a deep degree. From 2000 to 2020, the number of counties with a young population dropped from 205 to 18 (Table 1). The number of adult counties dropped sharply from 1423 to 119. The number of elderly counties increased rapidly from 1277 to 2768. Among them, the growth rate of counties in the later old age stage is the fastest, with a rate of 100 times, which fully shows that the speed of population aging in counties in China is not only fast, but also large in scale and deep in degree.
Specifically, 1491 counties have become the old age type in 20 years and 68 counties have changed from young to old, mainly concentrated in Gansu, Ningxia, Xinjiang, Tibet, and Inner Mongolia. All 1423 adult-type counties have been transformed into old-age counties, mainly concentrated in Central, Western, and Northern China. On the whole, in addition to Qinghai, Tibet, Xinjiang, and other provinces, there are still a small number of young and adult counties. In the past 20 years, the counties that have entered the old-age phase of society have spread all over the country, which once again proves the large scale of population aging in China. From 2000 to 2015, population aging was in a negative growth state, mainly concentrated in young and adult counties. Since 2015, counties in the early stage of the elderly type have also shown a negative growth trend, which also reflects that most counties in China have entered the deep aging stage since 2015, and will be in a period of rapid deepening in the next 20 years, which shows the deep degree of China’s population aging. As the second round of baby boomers born between 1962 to 1975 have aged and entered the ranks of the elderly, the 539 counties currently in the early elderly stage will rapidly enter the middle stage, or even directly enter the late elderly stage. Similarly, 1562 middle-aged counties will also enter the late old age stage. In the next 20 years, China’s aging population will grow rapidly. According to the current growth rate, China will become a super-aging society with an elderly population of more than 20% in 20 years. In summary, the speed of aging in China’s counties is characterized by rapid growth, large scale, and deep degree.
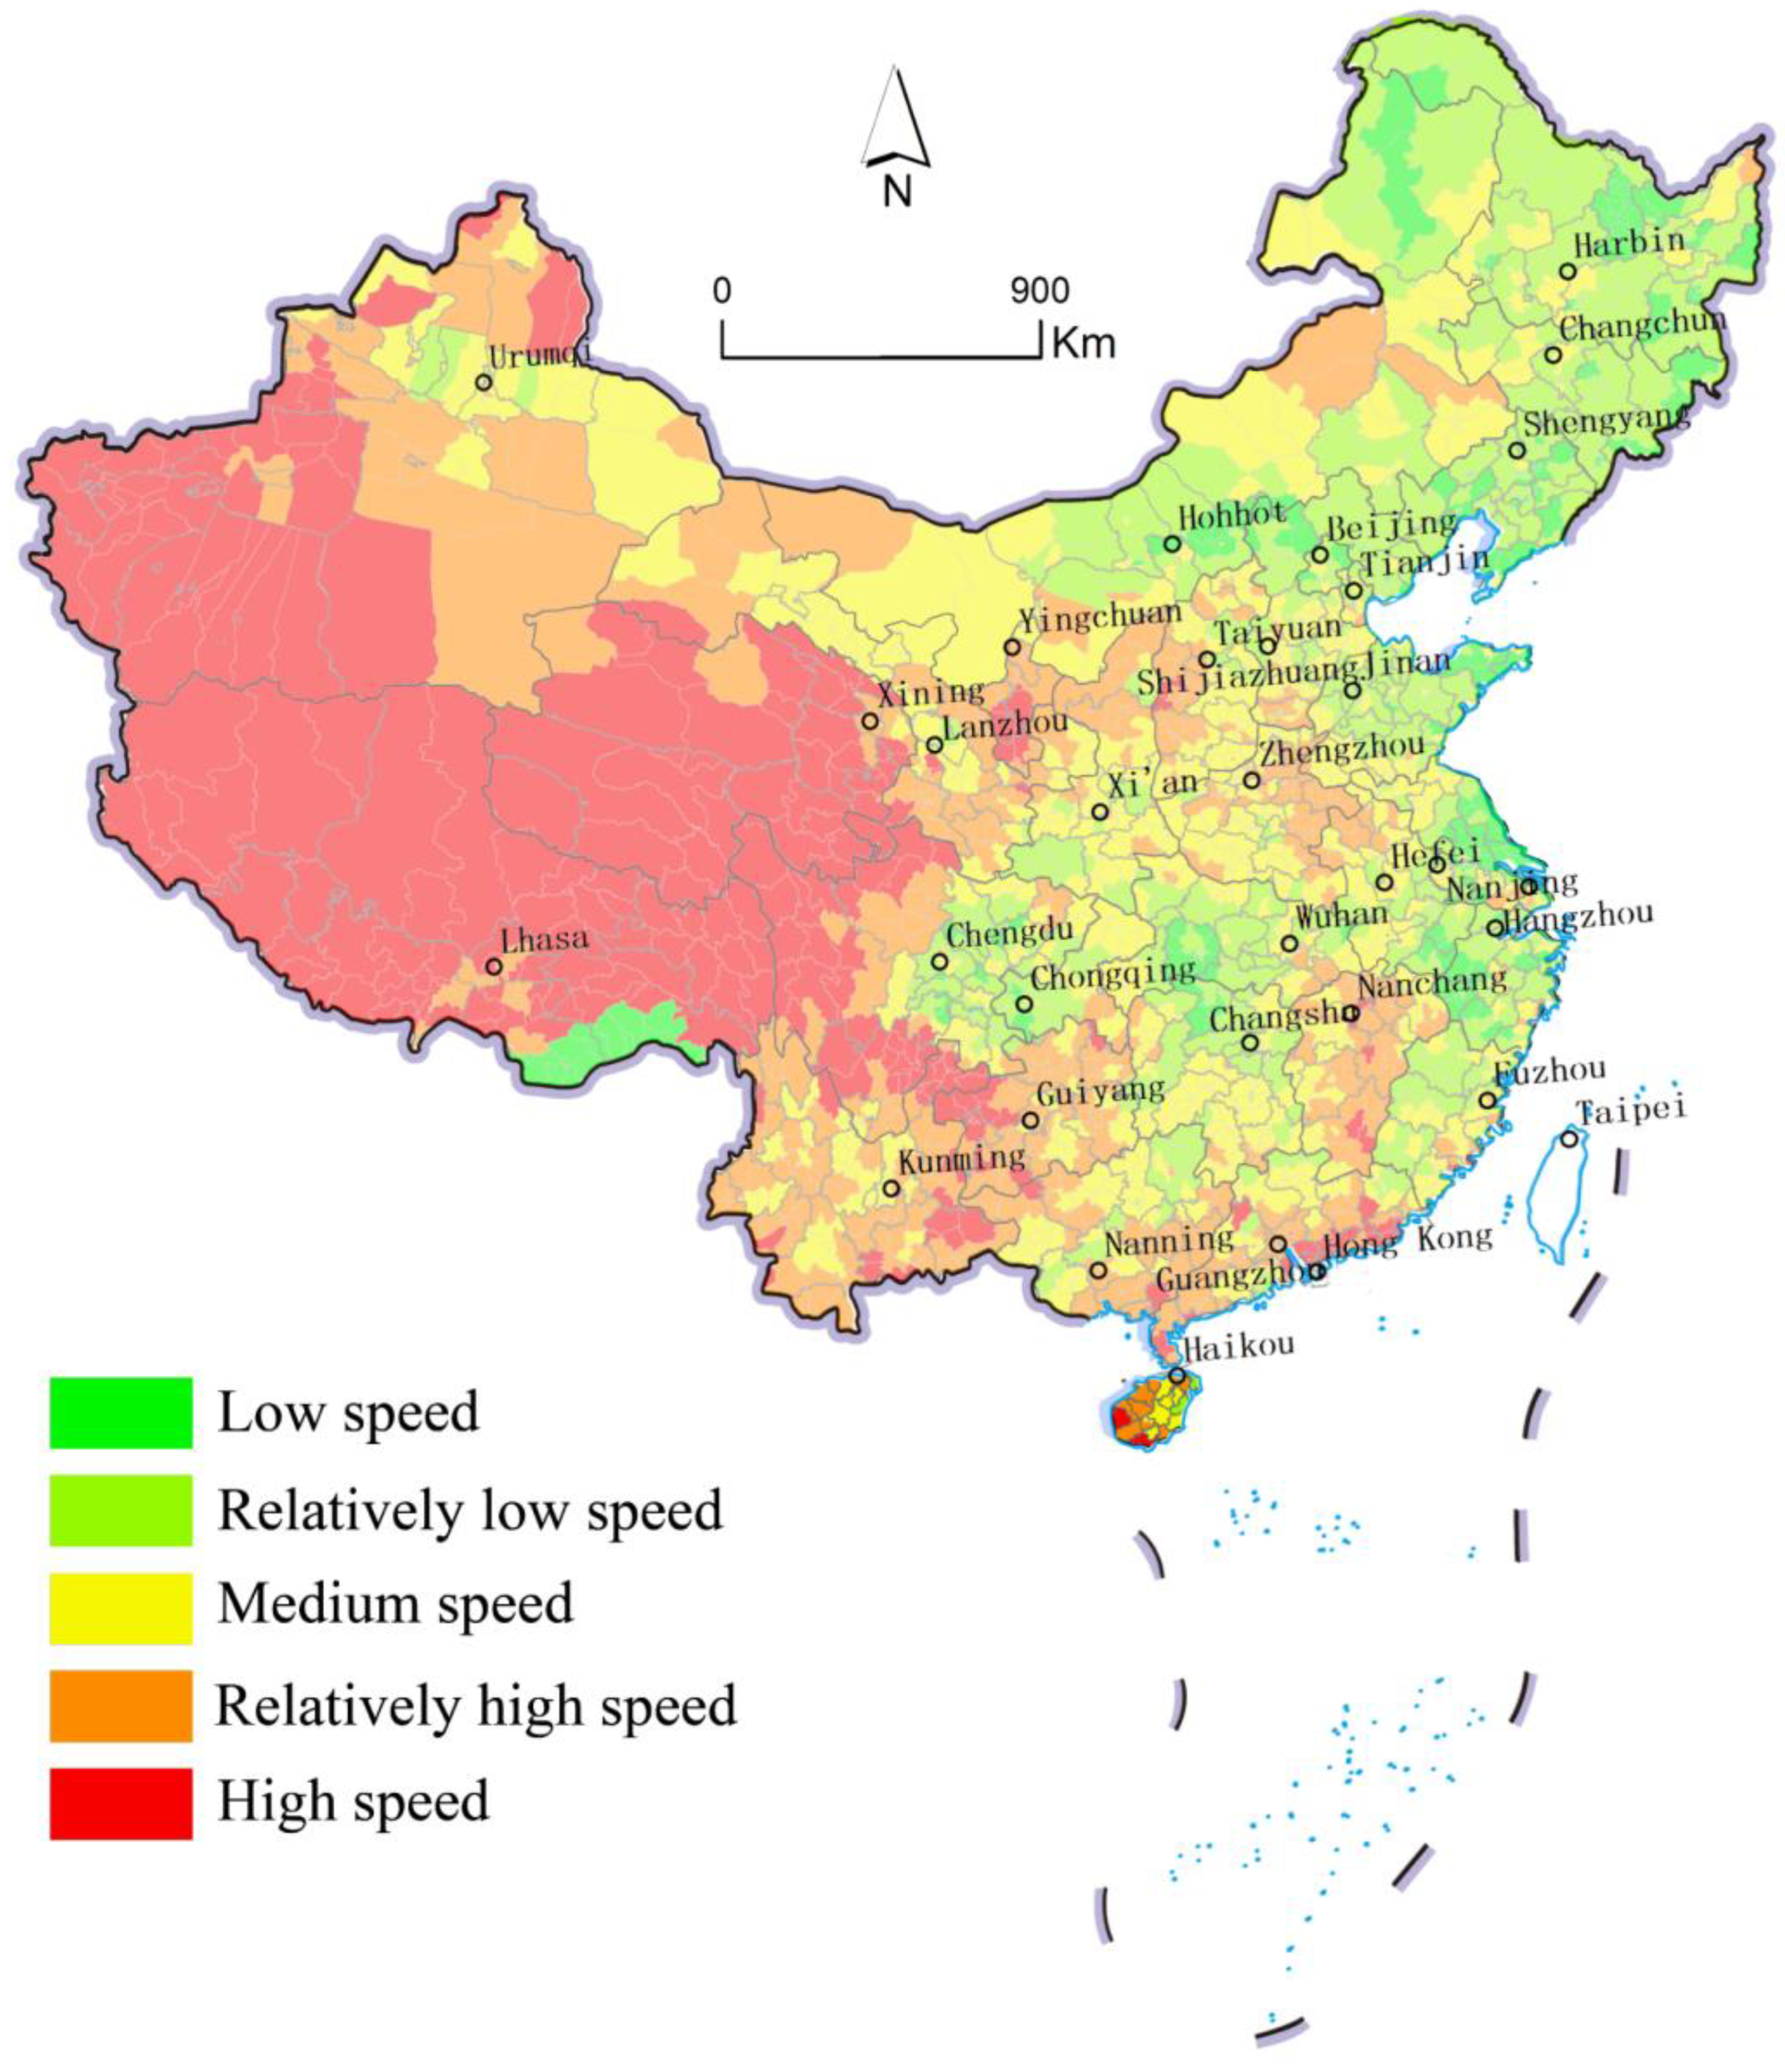
An exponential growth model is often used to simulate the process of population aging. We used an exponential growth model constructed by Rogers and Woodward in the US to describe the dynamic growth rate of population aging in China’s counties over the past 20 years, calculate the spatial differentiation of population aging speed in each county (Figure 2), and divide the average growth rate of the elderly population into five types (low, relatively low, medium, relatively high, and high speed) by using the natural breakpoint division method.
Regarding the changing rate of aging, there is a difference between east and west. The eastern coastal areas are dominated by low-speed and relatively low-speed growth, while the growth rate of the aging society tends to be stable, while the western areas are dominated by high-speed and high-speed growth. From 2000 to 2020, the aging rate in western provinces such as Qinghai, Tibet, Guizhou, Xinjiang, and Yunnan continued to grow. Among them, the average growth rate of the elderly population in Lenghu Town of Qinghai Province was 1.44% from 2000 to 2005 and 7.07% from 2015 to 2020. The rate was obviously faster in the west than the east. Due to the backward economy in the western region, large numbers of young and middle-aged people leave, which leads to the rapid advancement of aging in the region. Many people have moved into the eastern region, which has slowed down the average growth rate of the elderly population there. At the same time, there has been a relatively high growth rate along the Beijing–Guangzhou traffic line. Population migration and traffic trunk lines have an obvious impact on the regional growth rate of population aging.

3.3. Trend of Population Aging

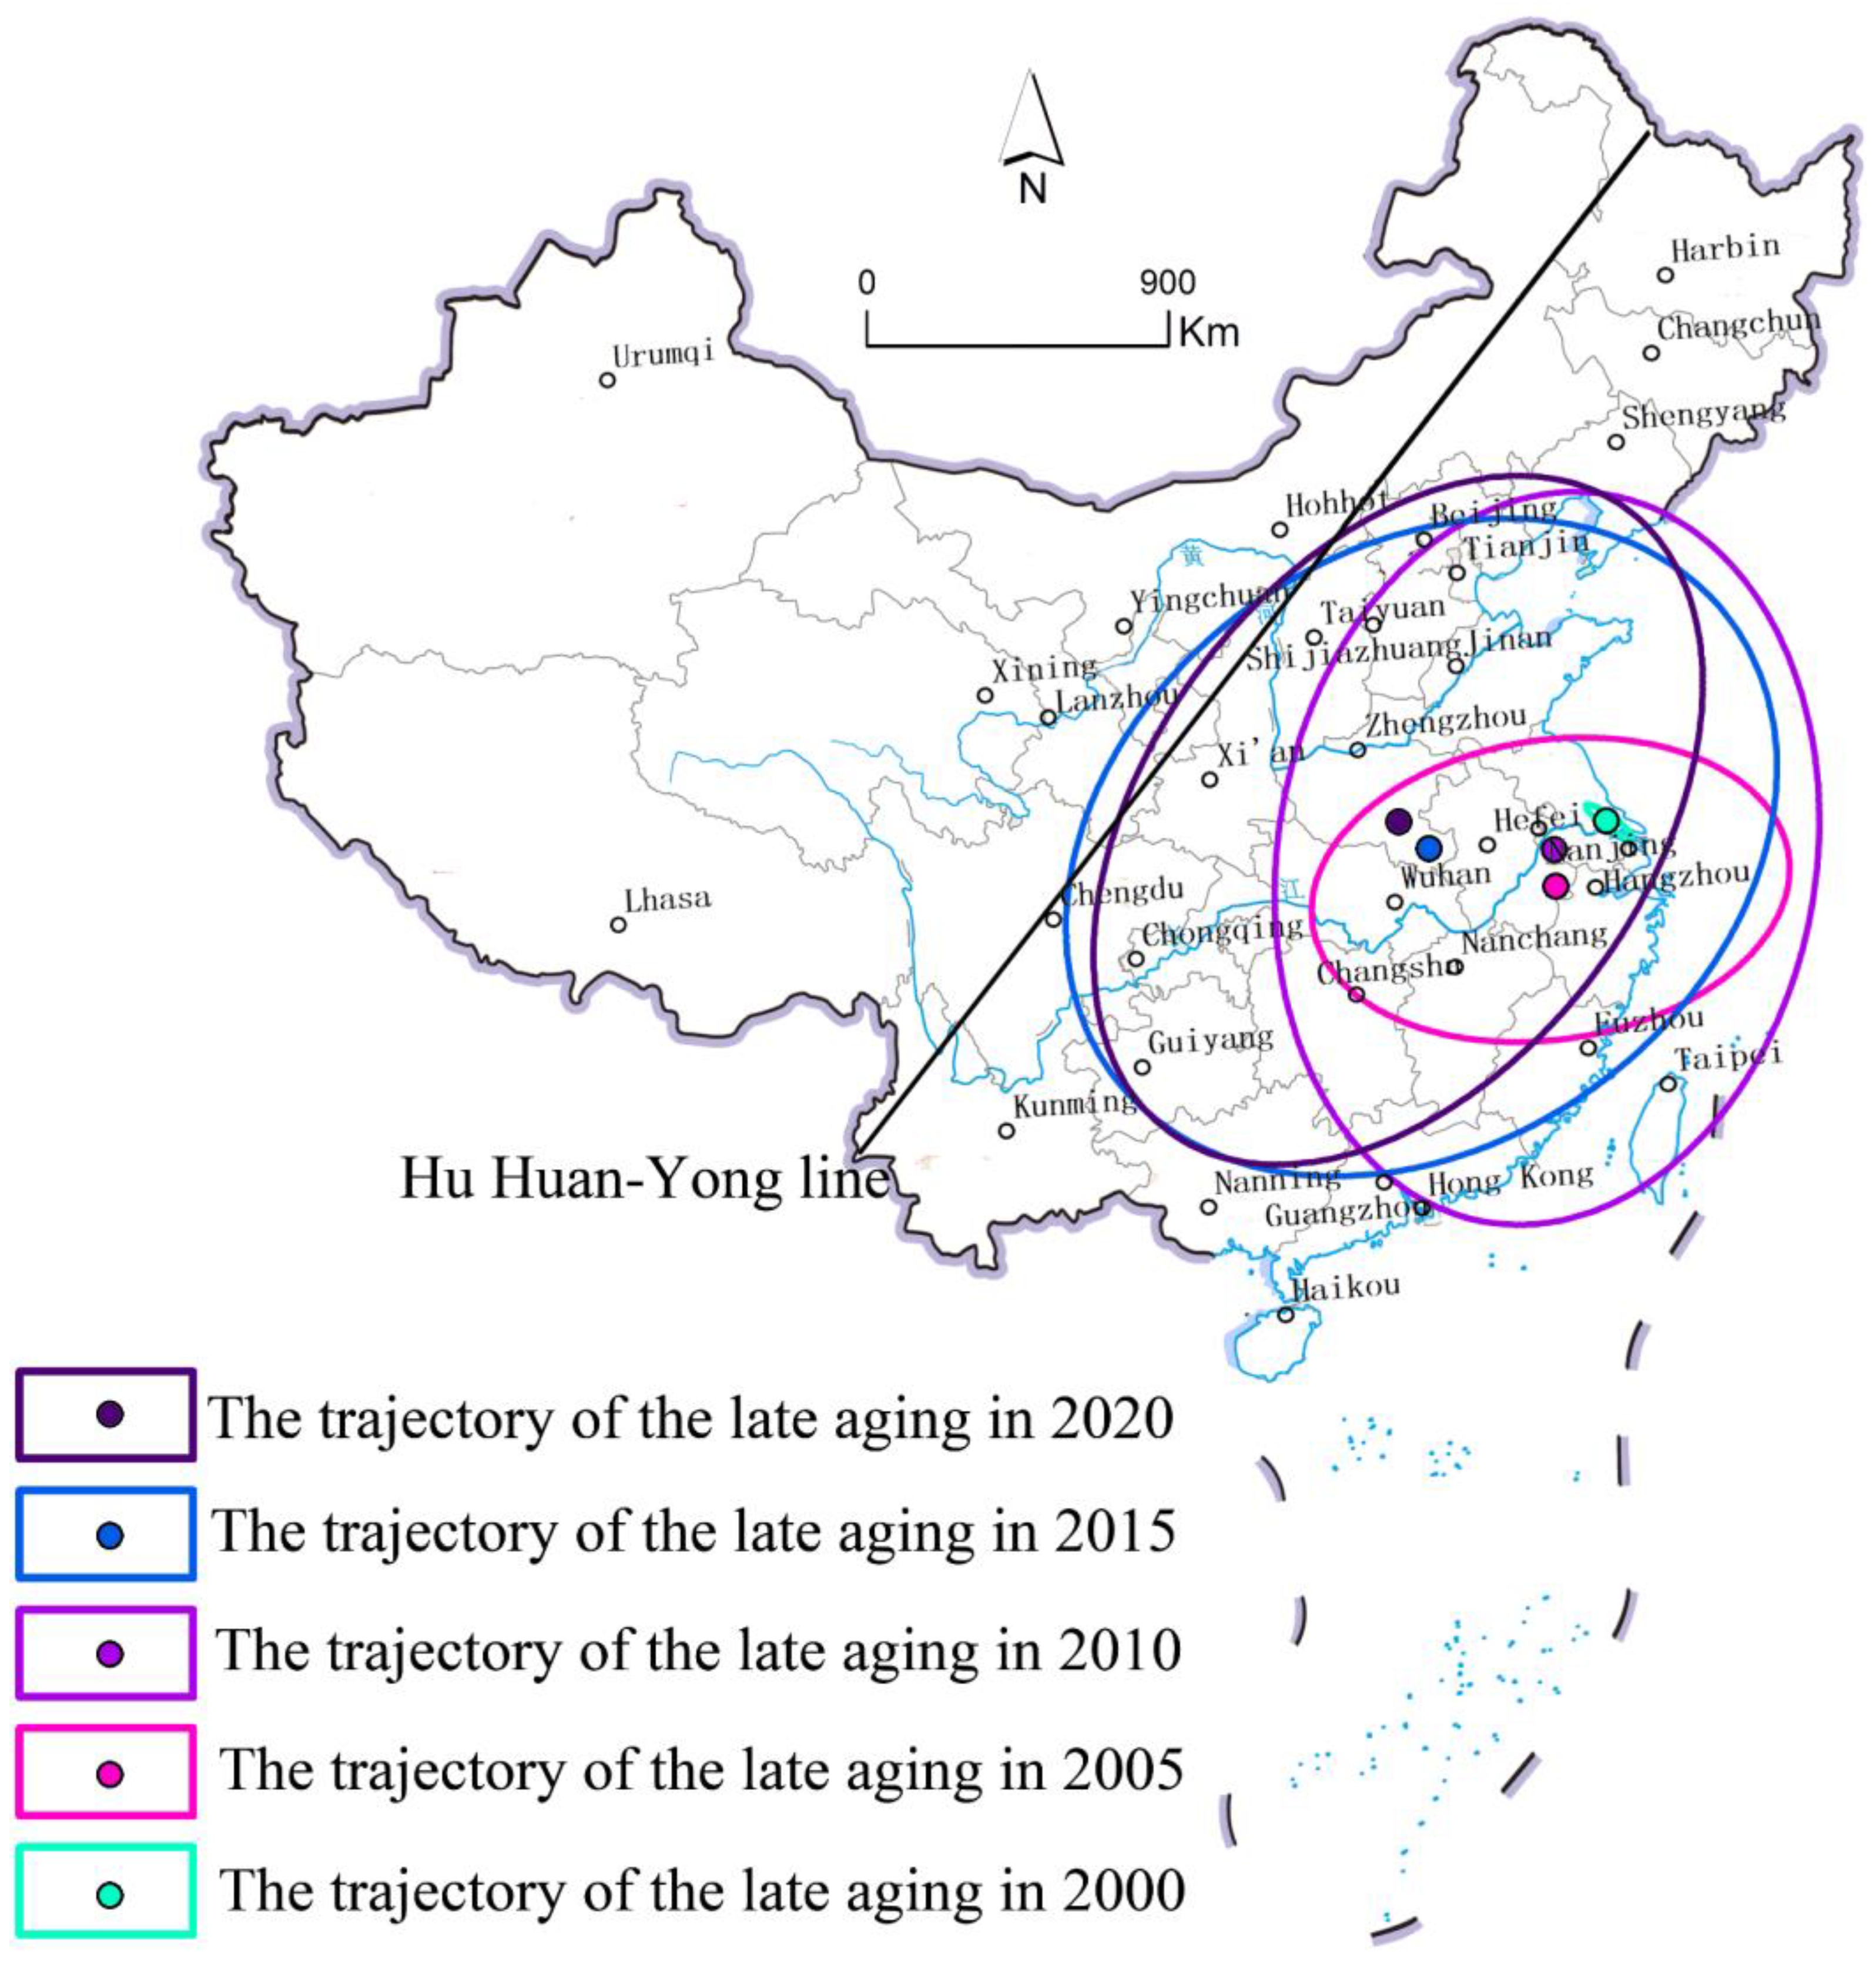
Taking counties entering the late aging stage as the research object, we calculated and drew the social center of gravity and a standard deviation ellipse of the aging population from 2000 to 2020 (Figure 3), so as to depict the spatial dynamic distribution trend of aging in counties in China. From 2000 to 2020, the focus on aging shifted from the southeast coast of Jiangsu to Anhui, and finally to the south of Hebei. The center of gravity of the aging population showed a clear trend of westward movement, and gradually approached and crossed the Hu Huan-Yong line. Central, Western, and Northern China show a deep aging trend. With regard to the change range of the ellipse rotation angle, it generally presents a trend from northeast to southwest. From 2010 to 2015, the Chengdu–Chongqing metropolitan area entered the aging society phase rapidly, and the elliptical angle shifted obviously to the southwest region. From 2015 to 2020, due to the rapid aging in Chengdu–Chongqing, the aging pattern in the southwest weakened, but in the northeast it was still strong. According to the change range of ellipse axis length, the increased length in the X-axis direction is the largest, which shows that population aging in this direction has obvious diffusion and change trends. A local contraction in the X-axis can be seen for 2015 to 2020, but the length of the Y-axis still increases, indicating a diffusion pattern of aging in the northeast and southwest directions. In the future, Heilongjiang, Liaoning, and Jilin in the northeast and Guizhou, Yunnan, Guangxi, and other provinces in the southwest will enter the deep aging stage at a large scale, along with Henan, Hubei, Shanxi, Shaanxi, and other provinces covered by the eclipse.

4. Influencing Factors of Population Aging

4.1. Impact of Migration

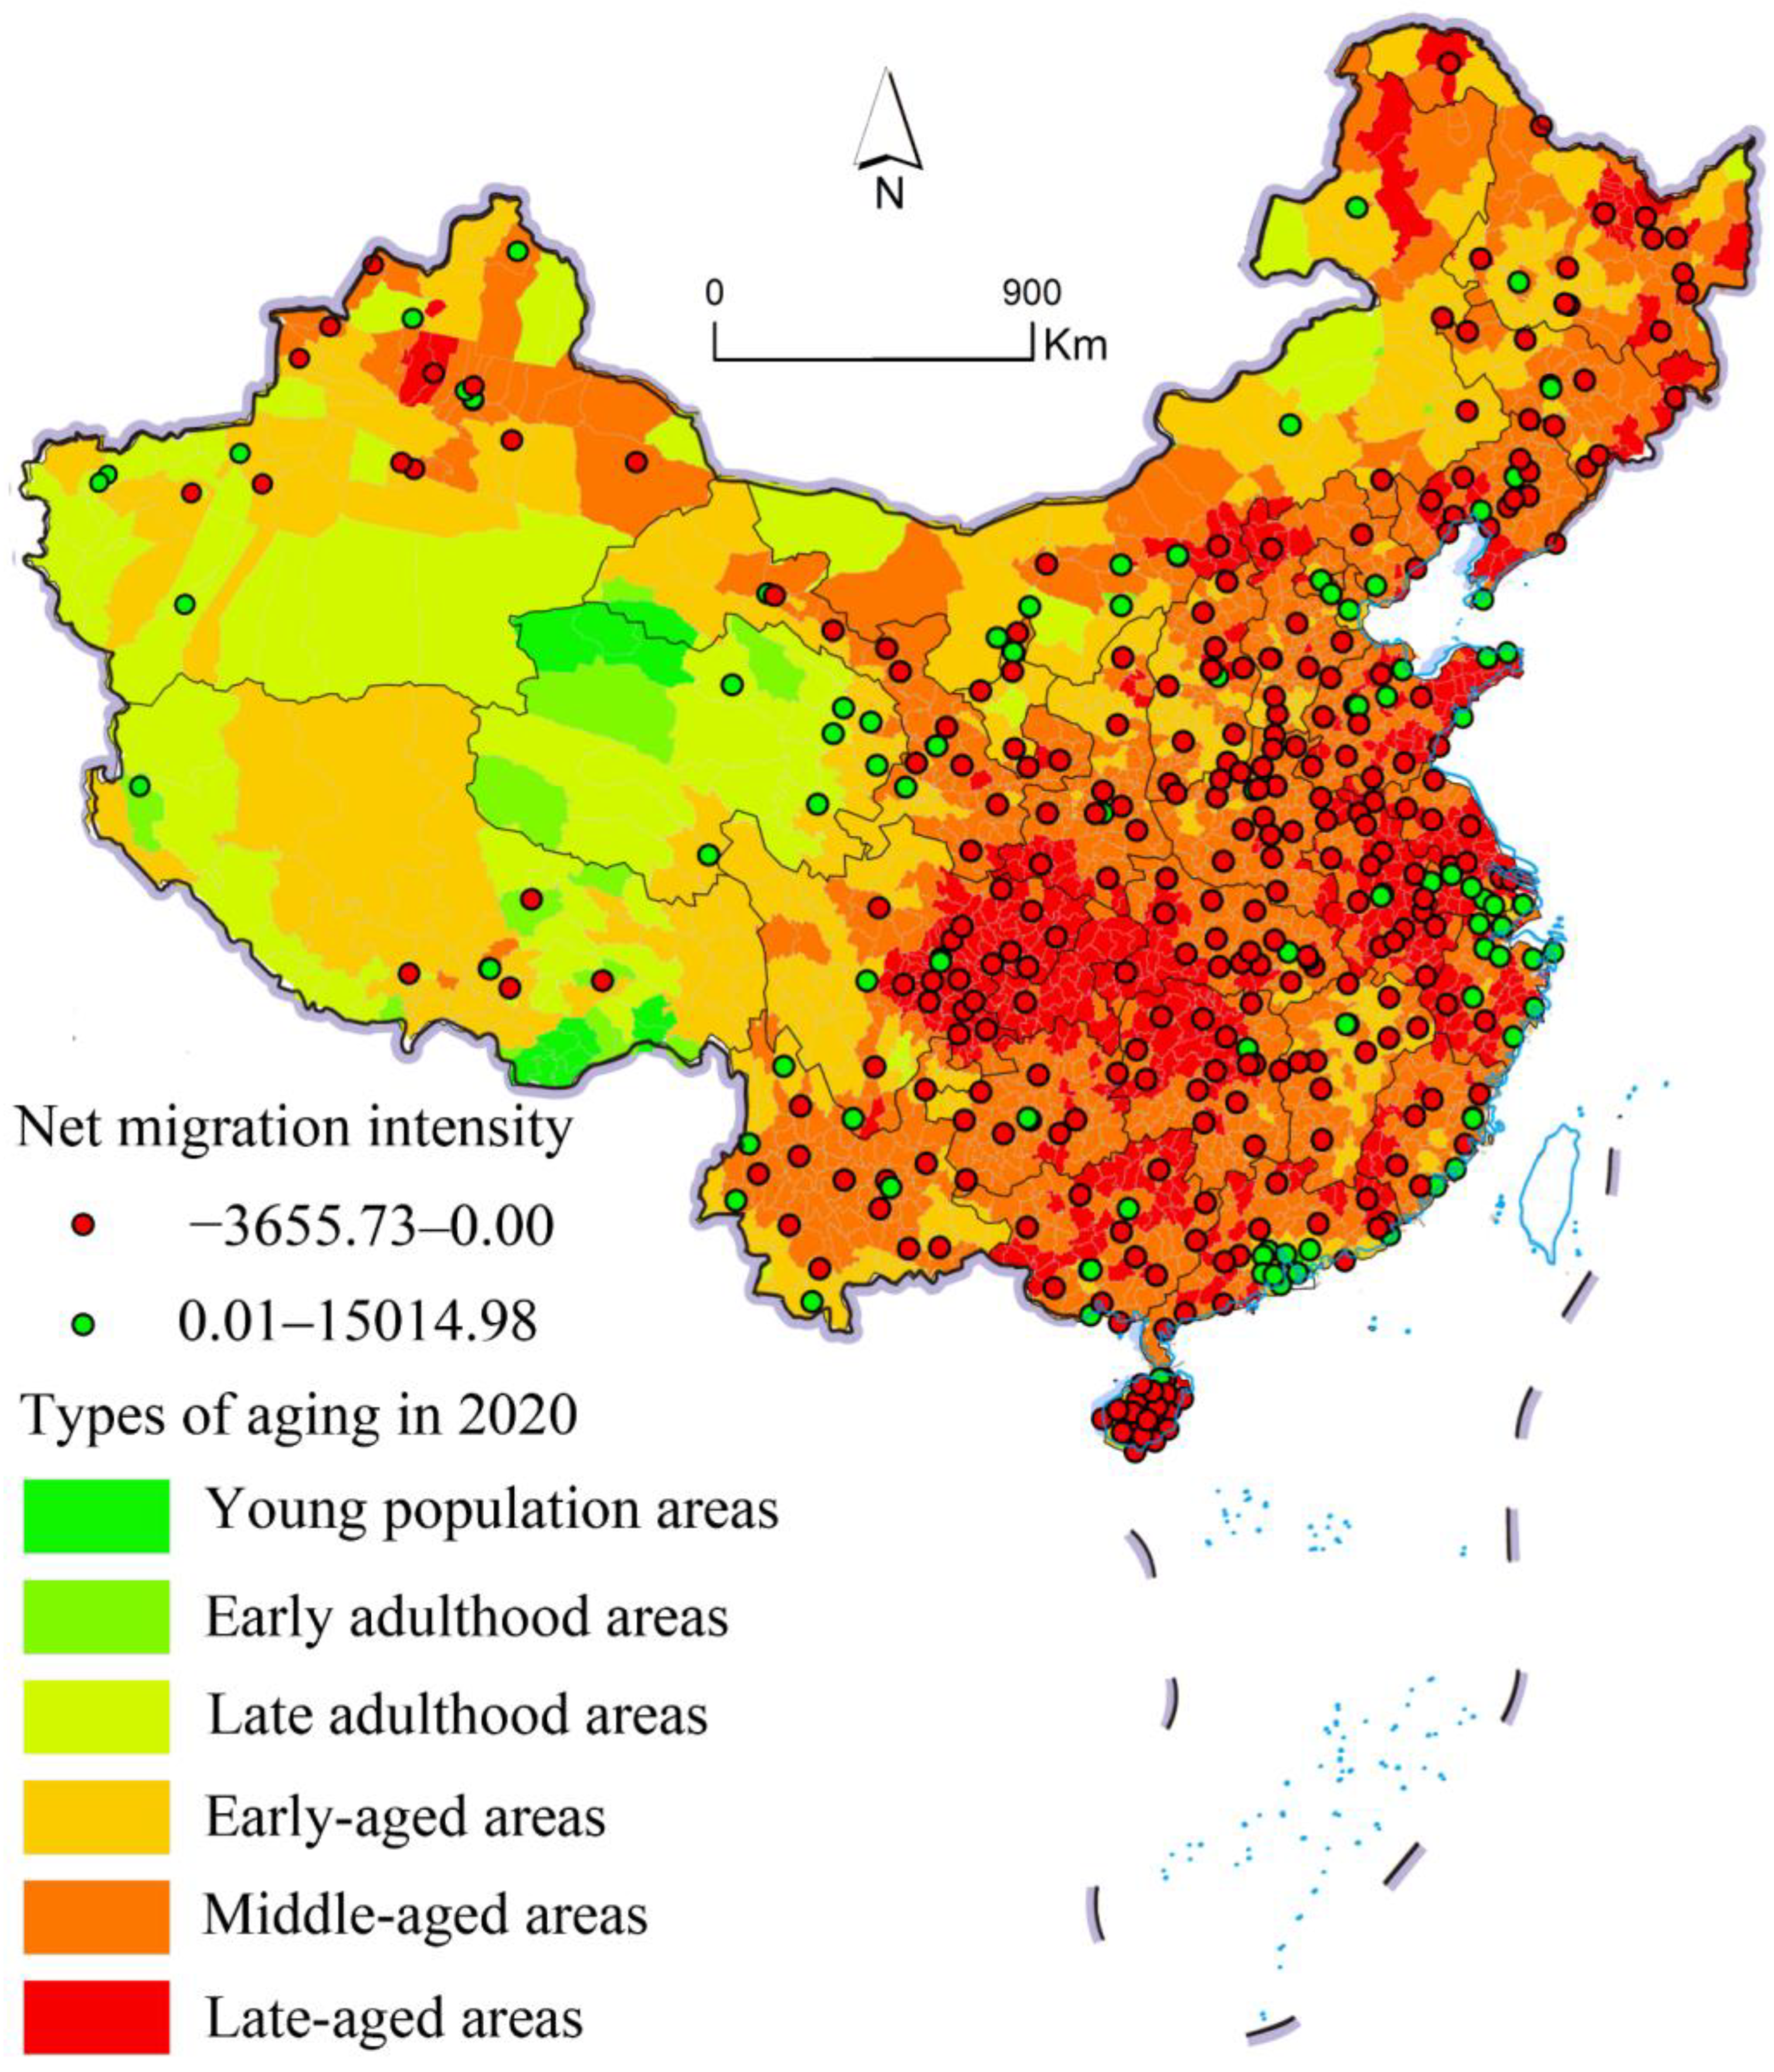
We compared the intensity of net urban migration and the spatial distribution of population aging during the Spring Festival in 2020, and it is not difficult to find that the two have an obvious promoting relationship (Figure 4). As more people move out of cities, the aging of the population increases. A large net inflow of the urban population inhibits the aging of the population. The main cities in developed urban agglomerations such as Pearl River Delta, Yangtze River Delta, and Beijing–Tianjin–Hebei show low-speed aging growth. However, the Chengdu–Chongqing urban agglomeration, the middle reaches of the Yangtze River urban agglomeration, the central plains urban agglomeration, and other areas with a net outflow of labor force show a rapid aging process. The large numbers of young and middle-aged people have accelerated the aging process in emigration areas. For example, most areas of Chengdu–Chongqing are located in deep hills and mountainous areas, with a large population density, a small per capita cultivated area, poor traffic conditions, and a poor economic level. In order to break out of poverty and survive, many young laborers have been forced to leave. According to the seventh census, the net outflow of Chongqing in 2020 was as high as 1.98 million, and the net outflow of Sichuan Province was as high as 7.76 million. The elderly stay where they are, further exacerbating the rapid aging of Chengdu–Chongqing.
At the provincial level, the spatial distribution characteristics of aging are also strongly related to population migration. For example, the aging degree in Yuzhong District and Yubei District of Chongqing City has maintained a low growth rate in the past 20 years. According to the results of the seventh census, large numbers of young and middle-aged people from other counties in Chongqing entered the core area, which reduced the aging degree in the core counties of Chongqing City. Developed provinces such as Guangdong and Zhejiang are also typical representatives. The main reason for the formation of the aging collapse structure is the inflow of large numbers of people from other provinces. In 2020, the population flowing into cities such as Shenzhen, Guangzhou, Dongguan, and Foshan reached 34.1 million. Large numbers of young and middle-aged people moved to Guangdong Province, making the aging degree of the province form a spatial trend of increasing from the core to the periphery.

4.2. Impact of Demographic Structure

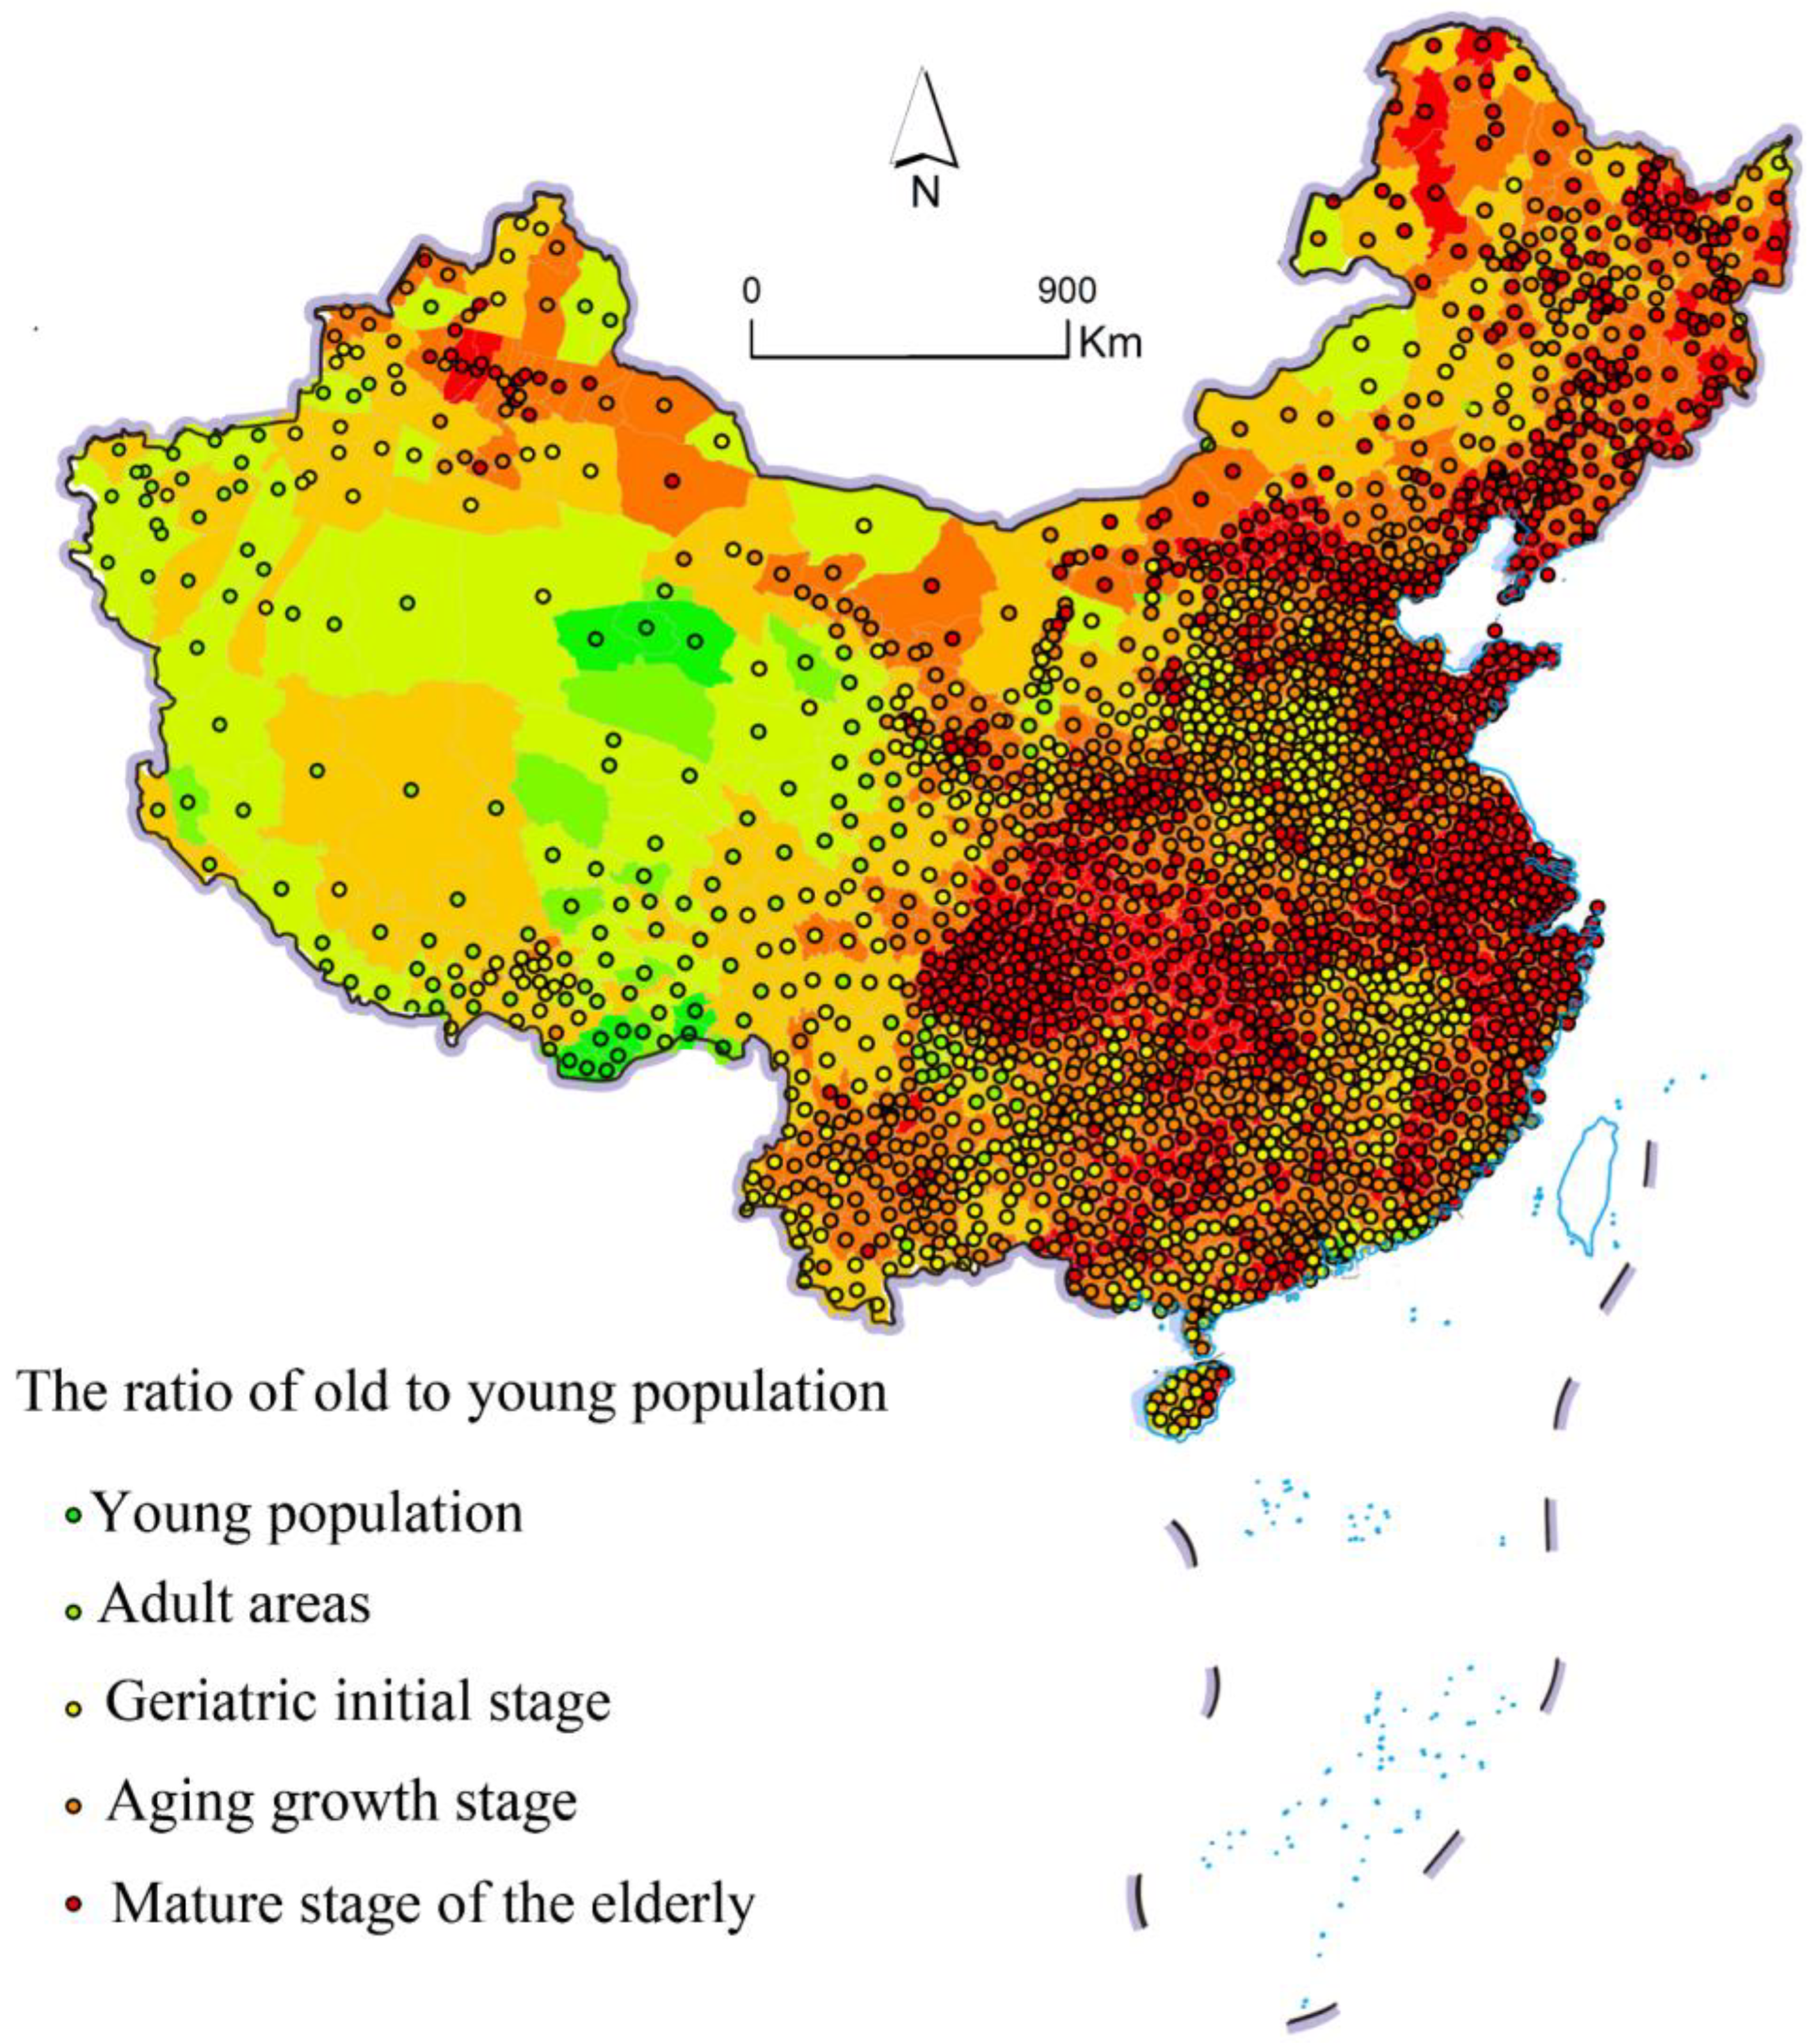
The ratio of old to young can take into account the characteristics of birth and mortality rates, and is often used to describe changes in the population age structure, on which it has an obvious influence [59]. Generally speaking, the lower the ratio of old to young, i.e., the more young people there are, the slower the aging trend of the population. We referred to the detailed standards of Guo [59], Wang [58], and others on the ratio of old to young, and divided it into five stages, so as to compare and analyze its influence on the population aging process. Areas with a ratio below 15.0% are young population areas, areas with a ratio of 15.0–30.0% are adult areas, areas with a ratio between 30.0 and 50.0% are in the initial geriatric stage, areas with a ratio between 50.0 and 70.0% are in the aging growth stage, and areas with a ratio above 70.0% are in the mature elderly state (Figure 5). Changes in the population structure as represented by the ratio of old to young present two kinds of core–periphery growth patterns: high core–low periphery and low core–high periphery, and there are more old-age counties in the periphery. At the same time, the ratio of old to young contributed to forming the Beijing–Shanghai and Shanghai–Chongqing lines, two mature aging areas. These characteristics coincide with the above-mentioned spatial distribution characteristics of population aging in various counties in China. This fully shows that the population structure is one of the main influencing factors of population aging, which is closely related to its spatial distribution. The more aging the population structure of the city, the more obvious the degree of population aging.

4.3. Impact of Traffic Arteries

The aging population nationally is clustered along the main traffic arteries (Figure 6). More than 91% of aging counties are located on both sides of the main traffic arteries. Because of the low level of economic development in some cities, large numbers of people leave along the main traffic lines, leading to rapid aging of the population in outflow areas and forming the phenomenon of getting old before getting rich. In terms of region, the main traffic lines of the Yangtze River Delta and the Beijing–Tianjin–Hebei and Chengdu–Chongqing urban agglomerations are dense, with high traffic accessibility and a high aging degree. With the rapid construction of major traffic arteries in the northwest and northeast, the center of gravity of population aging is gradually moving northward. The aging of the population also shows a trend of deep development along the main trunk lines, such as the Beijing–Hefei–Guangzhou, Urumqi–Xi’an–Zhengzhou, and Chengdu–Wuhan–Shanghai Railways.

4.4. Influence of Geographic Environment

The geographic environment directly affects the spatial distribution of the population, as comfortable climate conditions, good water quality, and soil rich in microbial elements affect human health. It is also directly related to people’s life expectancy, which in turn directly affects the speed and level of aging in different regions (Figure 7). In the past 20 years, 89% of the counties in the Chengdu–Chongqing metropolitan area have rapidly entered the middle and late aging periods, which is related to the sharp increase in the long-lived and elderly in the past 20 years. In 2000, the proportion of the elderly (over 80 years old) in Chongqing and Sichuan was 1.31 and 1.25%, respectively, and increased to 2.40 and 2.33% in 2020. The Chengdu–Chongqing urban agglomeration is located in the second step of China, south of the Qinling Mountains. The superior geographic environment and natural conditions contribute to prolonging people’s life expectancy, resulting in a sharp increase in the number of elderly people in the Chengdu–Chongqing area. The aging rates in Jing’an, Luwan, and Huangpu Districts of Shanghai in 2020 were the top three in China at 5.95, 5.88, and 5.11%, respectively; in 2000 the aging rate exceeded 3%, which was much higher than in other counties. Shanghai is located in the third step, at lower altitude, between Suzhou and Hangzhou, with pleasant climate conditions coupled with rapid economic development and abundant medical resources, which contribute to reducing the mortality rate of the elderly and providing a gathering area for the elderly population. The Chengdu–Chongqing and Yangtze River Delta urban agglomerations and other rapidly aging areas are located in the second and third steps of the subtropical region, with abundant rainfall and sunshine, mild climate, and low altitude. They are concentrated near the Qinling, Tianshan, Taihang, and Wuyi Mountains, which are conducive to crop growth and enhancing the lives of the elderly [60]. Superior geographic conditions have played an obvious role in promoting the aging of the region.

5. Conclusions and Discussion

5.1. Conclusions

The aging degree of the population in China’s counties has been at the upper-middle level globally. From 1953 to 2022, the number of elderly people aged 65 and over in China increased from 26.32 million to more than 200 million, accounting for 4.41 and 14.1% of the total population. It is obvious that most counties in China have begun the process of deep aging. Previous studies have mainly analyzed the causes of aging from the perspectives of birth rate, mortality rate, population migration, and population contraction [61]. The absolute aging of death-related factors was most dominant and birth-related factors secondary, with migration-related factors playing a crucial moderating effect. Excessive aging and low fertility will lead to urban contraction, urban contraction will lead to urban economic recession, and urban economic recession will deepen the aging of the population [62,63]. Few studies have studied the driving factors of population aging in China from the perspective of geospatial change. Based on this, this study finds that the changes in geographical environment, population migration, and traffic trunk lines have an impact on the formation of population aging. New findings were found beyond factors such as birth rates, mortality rates, and population migration. The main conclusions are as follows:
  • China’s population aging presents a point-line-area spread spatial pattern. Especially after 2015, aging has formed a planar structure with the Yangtze River Delta, Chengdu–Chongqing, and other urban agglomerations as the core, and a trend of spreading from the core to the surrounding areas. Three aging urban belts have been formed: Urumqi–Lanzhou–Chongqing–Nanning, Shenyang–Tianjin–Nanjing–Fuzhou, and Chongqing–Wuhan–Hefei. The number of counties with an aging population has increased quickly, and present a dual core–periphery aging model of high core–low periphery and low core–high periphery. The pattern of high core–low periphery is mainly concentrated in areas with a poor economic level, inconvenient transportation, and a bad ecological environment. The pattern of low core–high periphery is mainly concentrated in the Pearl River Delta, Yangtze River Delta, and Beijing–Tianjin–Hebei region, with a developed economy, convenient transportation, and an excellent ecological environment. In this core–periphery aging model, the polarization of population aging in counties is becoming increasingly obvious.
  • The aging rate of counties in China is growing rapidly at a large scale and to a deep degree. From 2000 to 2020, the growth rate of counties in the later stage of the elderly type was the fastest, with a rate of 100 times. In addition, 1491 counties entered the elderly stage, accounting for 91.58%. According to the current growth rate of aging, China will enter a super-aging stage with an elderly population of more than 20% in 20 years. It can be seen that China’s population aging is fast, extensive, and deep.
  • The aging areas have gradually spread to Northeast, Southwest, Northwest, and Central China. In the future, Heilongjiang, Liaoning, and Jilin in the northeast and Guizhou, Yunnan, Guangxi, and other provinces in the southwest will enter the aging stage at a large scale, along with Hunan, Hubei, Henan, Shanxi, and other provinces in central China. An aging trend spreading across the Hu Huan-Yong line is also shown. The main factors affecting population aging in China’s counties are population migration, population structure change, transportation facility construction, geographic environment concerns, and others.

5.2. Discussion

In recent years, China’s birth rate has fluctuated around 12 per thousand. There is no negative population growth, and the burden of old-age care is affordable. However, the population began to grow negatively in 2022, and the pressure on old-age care in many “old before rich” areas has increased [64]. Therefore, we wanted to analyze the trend of population aging in the past 20 years, find out the areas with great pressure on old-age care, and provide a reference for the planning and construction of old-age care as part of the next step. The degree of aging in China is growing day by day, but the aging process is not synchronized in terms of spatial distribution. The driving factors of population aging are not the same across different scales. At the national level, with a relatively low proportion of cross-border migration, the main factors contributing to aging are socioeconomic development and low birth rates [65]. On the provincial scale, interprovincial migration has an important impact on the aging of inflow and outflow areas [66]. However, the role of natural factors in the distribution pattern of aging has not been considered. On the urban scale, a consideration of natural elements, population structure, and population migration can be part of a comprehensive and systematic analysis of aging factors [67,68]. The conclusion of the study is that natural conditions underlie the basic spatial distribution pattern of aging, population structure changes and low birth rates are the main reasons for aging, and population mobility reshapes the spatial distribution characteristics of aging. This is consistent with previous research results.
Aging involves the transformation of population reproduction mode under economic and social progress. The rapid aging of urban populations will bring about problems such as great pressure on pension funds, insufficient labor force, mismatch of spatial resources, and disorder of supporting facilities for the aged. This could easily lead to unbalanced development of old-age care among regions, especially a lack of old-age care resources in some underdeveloped areas. Based on this, we aimed to determine the dynamic evolution characteristics of China’s population aging and put forward the following suggestions: First of all, the pension service industry should be arranged in advance to improve the overall level of endowment insurance. Appropriate policy preference should be given to “old before getting rich” areas and the problem of the pension burden in developed and underdeveloped areas should be alleviated. Second, the state should relax restrictions on reproduction; introduce preferential policies related to taxation, education, medical treatment, and housing to increase the fertility rate; reduce the cost of birth, maintenance, and education; and further promote the transformation of fertility willingness into fertility behavior. Finally, the policy of nearby population urbanization should be actively promoted, relying on urban agglomerations in the central and western regions; the government’s fiscal expenditures should be directed toward education and medical resources; the industrial chain should be optimized and adjusted; and the competitiveness of regional economies should be promoted. Actively guiding migrant populations to nearby urban areas and outflow populations to return to urban areas can help alleviate the phenomenon of excessive aging. There are many studies on the aging of urban populations, but few studies on population aging throughout the country. This study only performed a preliminary exploration and the main shortcoming is that we did not explore the causes of China’s population aging from the perspective of the economy, industry, and resources. This is another direction of further research.

Author Contributions

H.H. conceived and designed the study; X.Z. performed the experiments and analyzed the data. All authors have read and agreed to the published version of the manuscript.

Funding

This work was supported by the National Natural Science Foundation of China (no. 51778560). This research is supported by the Center for Balance Architecture of Zhejiang University (Project No: K Heng 20203512-02B, Index and planning methods of resilient cities).

Institutional Review Board Statement

Not applicable.

Informed Consent Statement

Not applicable.

Data Availability Statement

Not applicable.

Conflicts of Interest

The authors declare no conflict of interest.

References

  1. Dong, B.; Ding, Q. Aging in China: A challenge or an opportunity? J. Am. Med. Dir. Assoc. 2009, 10, 456–458. [Google Scholar] [CrossRef]
  2. Chen, F.; Liu, G. Population aging in China. In International Handbook of Population Aging; Springer: Berlin/Heidelberg, Germany, 2009; pp. 157–172. [Google Scholar]
  3. Xie, B.; Zhou, J.; Luo, X. Mapping spatial variation of population aging in China’s mega cities. J. Maps 2016, 12, 181–192. [Google Scholar] [CrossRef]
  4. Flynn, C.B. General versus Aged Interstate Migration, 1965–1970. Res. Aging 1980, 2, 165–176. [Google Scholar] [CrossRef]
  5. Glasgow, N.; Brown, D.L. Rural ageing in the United States: Trends and contexts. J. Rural Stud. 2012, 28, 422–431. [Google Scholar] [CrossRef]
  6. Burholt, V.; Dobbs, C. Research on rural ageing: Where have we got to and where are we going in Europe? J. Rural Stud. 2012, 28, 432–446. [Google Scholar] [CrossRef]
  7. Długosz, Z. Population ageing in Europe. Procedia-Soc. Behav. Sci. 2011, 19, 47–55. [Google Scholar] [CrossRef]
  8. Hartog, R. Europe’s Ageing Cities; Müller + Busmann: Wuppertal, Germany, 2005. [Google Scholar]
  9. Theou, O.; Cann, L.; Blodgett, J.; Wallace, L.M.; Brothers, T.D.; Rockwood, K. Modifications to the frailty phenotype criteria: Systematic review of the current literature and investigation of 262 frailty phenotypes in the Survey of Health, Ageing, and Retirement in Europe. Ageing Res. Rev. 2015, 21, 78–94. [Google Scholar] [CrossRef]
  10. Won, C.W. Elderly long-term care in Korea. J. Clin. Gerontol. Geriatr. 2013, 4, 4–6. [Google Scholar] [CrossRef]
  11. Chomik, R.; McDonald, P.; Piggott, J. Population ageing in Asia and the Pacific: Dependency metrics for policy. J. Econ. Ageing 2016, 8, 5–18. [Google Scholar] [CrossRef]
  12. Aday, R.H.; Miles, L.A. Long-Term Impacts of Rural Migration of the Elderly: Implications for Research1. Gerontologist 1982, 22, 331–336. [Google Scholar] [CrossRef]
  13. Botsman, D. Recovering Japan’s urban past: Yoshida Nobuyuki, Tsukada Takashi, and the cities of the Tokugawa period. City Cult. Soc. 2012, 3, 9–14. [Google Scholar] [CrossRef]
  14. Pan, Z.; Fukuda, H. Research on the Countermeasure of Housing for the Elderly in the Aging Background of Japan—A Case Study on Typical Welfare Facilities of Kitakyushu City in Japan. Procedia-Soc. Behav. Sci. 2016, 216, 119–128. [Google Scholar] [CrossRef]
  15. Buffel, T.; Phillipson, C. Can global cities be ‘age-friendly cities’? Urban development and ageing populations. Cities 2016, 55, 94–100. [Google Scholar] [CrossRef]
  16. Długosz, Z.; Raźniak, P. Risk of Population Aging in Asia. Procedia-Soc. Behav. Sci. 2014, 120, 36–45. [Google Scholar] [CrossRef]
  17. Hiltner, J.; Smith, B.W. Intraurban Residential Location of The Elderly. J. Geogr. 1974, 73, 23–33. [Google Scholar] [CrossRef]
  18. Goodman, A.C. Using Lorenz Curves to Characterise Urban Elderly Populations. Urban Stud. 1987, 24, 77–80. [Google Scholar] [CrossRef]
  19. Choi, K.-H.; Shin, S. Population aging, economic growth, and the social transmission of human capital: An analysis with an overlapping generations model. Econ. Model. 2015, 50, 138–147. [Google Scholar] [CrossRef]
  20. Wister, A.V.; Speechley, M. Inherent tensions between population aging and health care systems: What might the Canadian health care system look like in twenty years? J. Popul. Ageing 2015, 8, 227–243. [Google Scholar] [CrossRef]
  21. De Meijer, C.; Wouterse, B.; Polder, J.; Koopmanschap, M. The effect of population aging on health expenditure growth: A critical review. Eur. J. Ageing 2013, 10, 353–361. [Google Scholar] [CrossRef]
  22. Bodner, E.; Shrira, A.; Bergman, Y.S.; Cohen-Fridel, S.; Grossman, E.S. The interaction between aging and death anxieties predicts ageism. Pers. Individ. Differ. 2015, 86, 15–19. [Google Scholar] [CrossRef]
  23. Boschmann, E.E.; Brady, S.A. Travel behaviors, sustainable mobility, and transit-oriented developments: A travel counts analysis of older adults in the Denver, Colorado metropolitan area. J. Transp. Geogr. 2013, 33, 1–11. [Google Scholar] [CrossRef]
  24. Kemperman, A.; Timmermans, H. Green spaces in the direct living environment and social contacts of the aging population. Landsc. Urban Plan. 2014, 129, 44–54. [Google Scholar] [CrossRef]
  25. Rogers, A.; Watkins, J. General versus elderly interstate migration and population redistribution in the United States. Res. Aging 1987, 9, 483–529. [Google Scholar] [CrossRef] [PubMed]
  26. Zhan, P.; Ma, X.; Li, S. Migration, population aging, and income inequality in China. J. Asian Econ. 2021, 76, 101351. [Google Scholar] [CrossRef]
  27. Kim, D.-W.; Fabbiano, G. X-ray properties of young early-type galaxies. I. X-ray luminosity function of low-mass X-ray binaries. Astrophys. J. 2010, 721, 1523–1530. [Google Scholar] [CrossRef]
  28. Yin, C.; Meng, F.; Yang, X.; Yang, F.; Fu, P.; Yao, G.; Chen, R. Spatio-temporal evolution of urban built-up areas and analysis of driving factors —A comparison of typical cities in north and south China. Land Use Policy 2022, 117, 106114. [Google Scholar] [CrossRef]
  29. Lu, J.; Liu, Q. Four decades of studies on population aging in China. China Popul. Dev. Stud. 2019, 3, 24–36. [Google Scholar] [CrossRef]
  30. Cangping, W. The Aging Population in China. In International Institute on Ageing; Springer: Berlin/Heidelberg, Germany, 1991. [Google Scholar]
  31. Jie, Z. Spatial Distribution Characteristics and Evolution Trends of Urban Aging Population. China City Plan. Rev. 2017, 26, 6–15. [Google Scholar]
  32. Han, Y.; He, Y.; Lyu, J.; Yu, C.; Bian, M.; Lee, L. Aging in China: Perspectives on public health. Glob. Health J. 2020, 4, 11–17. [Google Scholar] [CrossRef]
  33. Wang, L.; Li, Y.; Li, H.; Holdaway, J.; Hao, Z.; Wang, W.; Krafft, T. Regional aging and longevity characteristics in China. Arch. Gerontol. Geriatr. 2016, 67, 153–159. [Google Scholar] [CrossRef]
  34. Chen, S. Aging with Chinese Characteristics: A Public Policy Perspective. Ageing Int. 2009, 34, 172–188. [Google Scholar] [CrossRef]
  35. Xu, F.; Huang, Y.; Wang, Q. Aging Industries in the Regional Economy: How to Support an Aging China? Land 2022, 11, 2096. [Google Scholar] [CrossRef]
  36. Chou, K.-L.; Chi, I. Successful Aging among the Young-Old, Old-Old, and Oldest-Old Chinese. Int. J. Aging Hum. Dev. 2002, 54, 1–14. [Google Scholar] [CrossRef] [PubMed]
  37. Zhou, Y.; Li, N.; Wu, W.; Wu, J.; Shi, P. Local Spatial and Temporal Factors Influencing Population and Societal Vulnerability to Natural Disasters. Risk Anal. 2014, 34, 614–639. [Google Scholar] [CrossRef] [PubMed]
  38. Duan, L.; Liu, Z.; Yu, W.; Chen, W.; Jin, D.; Feng, Y.; Wang, Y.; Liu, J.; Zhou, H.; Sun, S.; et al. The provincial trend of population aging in China–based on population expansion forecast formula. J. Comput. Methods Sci. Eng. 2022, 22, 349–359. [Google Scholar] [CrossRef]
  39. Qu, B.; Li, X.; Liu, J.; Mao, J. Analysis of the Current Situation Regarding the Aging Rural Population in China and Proposed Countermeasures. Popul. Health Manag. 2012, 15, 181–185. [Google Scholar] [CrossRef]
  40. Kang, J.J.; Ding, Z.W.; Zhang, G.s.S.; Wang, F.Z.; Wu, R.W. Multi scale spatial-temporal pattern of population aging in Central Plains. Econ. Geogr. 2016, 36, 29–37. [Google Scholar] [CrossRef]
  41. Feng, J.; Hong, G.; Qian, W.; Hu, R.; Shi, G. Aging in China: An International and Domestic Comparative Study. Sustainability 2020, 12, 5086. [Google Scholar] [CrossRef]
  42. Wu, Y.; Song, Y.; Yu, T. Spatial Differences in China’s Population Aging and Influencing Factors: The Perspectives of Spatial Dependence and Spatial Heterogeneity. Sustainability 2019, 11, 5959. [Google Scholar] [CrossRef]
  43. Guan, D.; Lei, L.; Han, Z. Spatial-Temporal Variation of Population Aging: A Case Study of China’s Liaoning Province. Complexity 2020, 2020, 5436061. [Google Scholar] [CrossRef]
  44. National Development and Reform Commission. Analysis of the situation and development of population and health in China. Macroecon. Manag. 2004, 5, 15–19. [Google Scholar] [CrossRef]
  45. Yin, W.Y. Future population change and sustainable development in Zhejiang. J. Zhejiang Univ. Humanit. Soc. Sci. Ed. 2000, 30, 142. [Google Scholar] [CrossRef]
  46. Hajkowicz, S.; Cook, H.; Wilhelmseder, L.; Boughen, N. The Future of Australian Sport: Megatrends Shaping the Sports Sector over Coming Decades; Australian Sports Commission: Bruce, Australia, 2013.
  47. Liu, C.M. Research on population aging standards. J. Popul. Sci. 1991, 3, 8–11. [Google Scholar] [CrossRef]
  48. Rogers, A.; Woodward, J.A. Tempos of Elderly Age and Geographical Concentration*. Prof. Geogr. 1992, 44, 72–83. [Google Scholar] [CrossRef]
  49. Djernes, J.K. Prevalence and predictors of depression in populations of elderly: A review. Acta Psychiatr. Scand. 2006, 113, 372–387. [Google Scholar] [CrossRef]
  50. Lan, T.; Yu, M.; Xu, Z.; Wu, Y. Temporal and Spatial Variation Characteristics of Catering Facilities Based on POI Data: A Case Study within 5th Ring Road in Beijing. Procedia Comput. Sci. 2018, 131, 1260–1268. [Google Scholar] [CrossRef]
  51. Kozak, I.; Kozak, H. Analysis of settlings of Lutoviska commune since 2nd half of 18th century using GIS. Visnyk Lviv Univ. Ser. Geogr. 2016, 50, 198–207. [Google Scholar] [CrossRef]
  52. Sorichetta, A.; Bird, T.J.; Ruktanonchai, N.W.; Erbach-Schoenberg, E.z.; Pezzulo, C.; Tejedor, N.; Waldock, I.C.; Sadler, J.D.; Garcia, A.J.; Sedda, L. Mapping internal connectivity through human migration in malaria endemic countries. Data 2016, 3, 160066. [Google Scholar] [CrossRef]
  53. Sorichetta, A.; Hornby, G.M.; Stevens, F.R.; Gaughan, A.E.; Linard, C.; Tatem, A.J. High-resolution gridded population datasets for Latin America and the Caribbean in 2010, 2015, and 2020. Sci. Data 2015, 2, 150045. [Google Scholar] [CrossRef]
  54. Fu, Y.; Lin, S.; Xu, Z. Research on Quantitative Analysis of Multiple Factors Affecting COVID-19 Spread. Int. J. Environ. Res. Public Health 2022, 19, 3187. [Google Scholar] [CrossRef]
  55. Wei, S.; Wang, L. Examining the population flow network in China and its implications for epidemic control based on Baidu migration data. Humanit. Soc. Sci. Commun. 2020, 7, 145. [Google Scholar] [CrossRef]
  56. Zhang, X.D.; Han, H.Y.; Tang, Y.J.; Luo, G.N. Research on the characteristics of urban network structure in China based on baidu migration data. J. Geo-Inf. Sci. 2021, 23, 1798–1808. [Google Scholar] [CrossRef]
  57. Ruan, J.; Chen, Y.; Yang, Z. Assessment of temporal and spatial progress of urban resilience in Guangzhou under rainstorm scenarios. Int. J. Disaster Risk Reduct. 2021, 66, 102578. [Google Scholar] [CrossRef]
  58. Wang, S. Spatial patterns and social-economic influential factors of population aging: A global assessment from 1990 to 2010. Soc. Sci. Med. 2020, 253, 112963. [Google Scholar] [CrossRef]
  59. Xue, P.; Liu, J.; Liu, B.; Zhu, C. Impact of Urbanisation on the Spatial and Temporal Evolution of Carbon Emissions and the Potential for Emission Reduction in a Dual-Carbon Reduction Context. Sustainability 2023, 15, 4715. [Google Scholar] [CrossRef]
  60. Gu, J. Excellent living environment is the basic condition for nurturing centenarians—Analysis of the origin of the phenomenon of longevity in Nantong. Chin. J. Mouth Sci. 2001, 1, 89–91. [Google Scholar]
  61. Wu, L.; Huang, Z.; Pan, Z. The spatiality and driving forces of population ageing in China. PLoS ONE 2021, 16, e0243559. [Google Scholar] [CrossRef] [PubMed]
  62. Kato, H. Urban modeling of shrinking cities through Bayesian network analysis using economic, social, and educational indicators: Case of Japanese cities. PLoS ONE 2023, 18, e0284134. [Google Scholar] [CrossRef] [PubMed]
  63. Peng, W.; Wu, Z.; Duan, J.; Gao, W.; Wang, R.; Fan, Z.; Liu, N. Identifying and quantizing the non-linear correlates of city shrinkage in Japan. Cities 2023, 137, 104292. [Google Scholar] [CrossRef]
  64. Campbell, J.Y.; Ramadorai, T.; Ranish, B. Do the rich get richer in the stock market? Evidence from India. Am. Econ. Rev. Insights 2019, 1, 225–240. [Google Scholar] [CrossRef]
  65. Engelhardt, H. Recent Changes in Family Policies in Austria and Germany-A Response to Very Low Fertility. Entre Nous 2006. Available online: https://opus4.kobv.de/opus4-bamberg/frontdoor/index/index/docId/ (accessed on 14 March 2023).
  66. Liu, D.; Pu, Y.; Han, H.; Wang, Y.; Song, X. Study on the Changing Spatial Focusing of Inter-Provincial Migration in China Based on Gini Index International Conference on Geoinformatics. IEEE, 2015. Available online: https://www.zhangqiaokeyan.com/academic-conference-foreign_meeting_thesis/0705011088107.html (accessed on 14 March 2023).
  67. Yu, T. China’s aging population and its spatial features in city areas (2000—2010). Urban Plan. Forum 2013, 6, 58–66. [Google Scholar]
  68. Zhao, D.; Han, Z.; Wang, L. The spatial pattern of aging population distribution and its generating mechanism in China. Acta Geo-Graph. Sin. 2017, 72, 1762–1775. [Google Scholar]
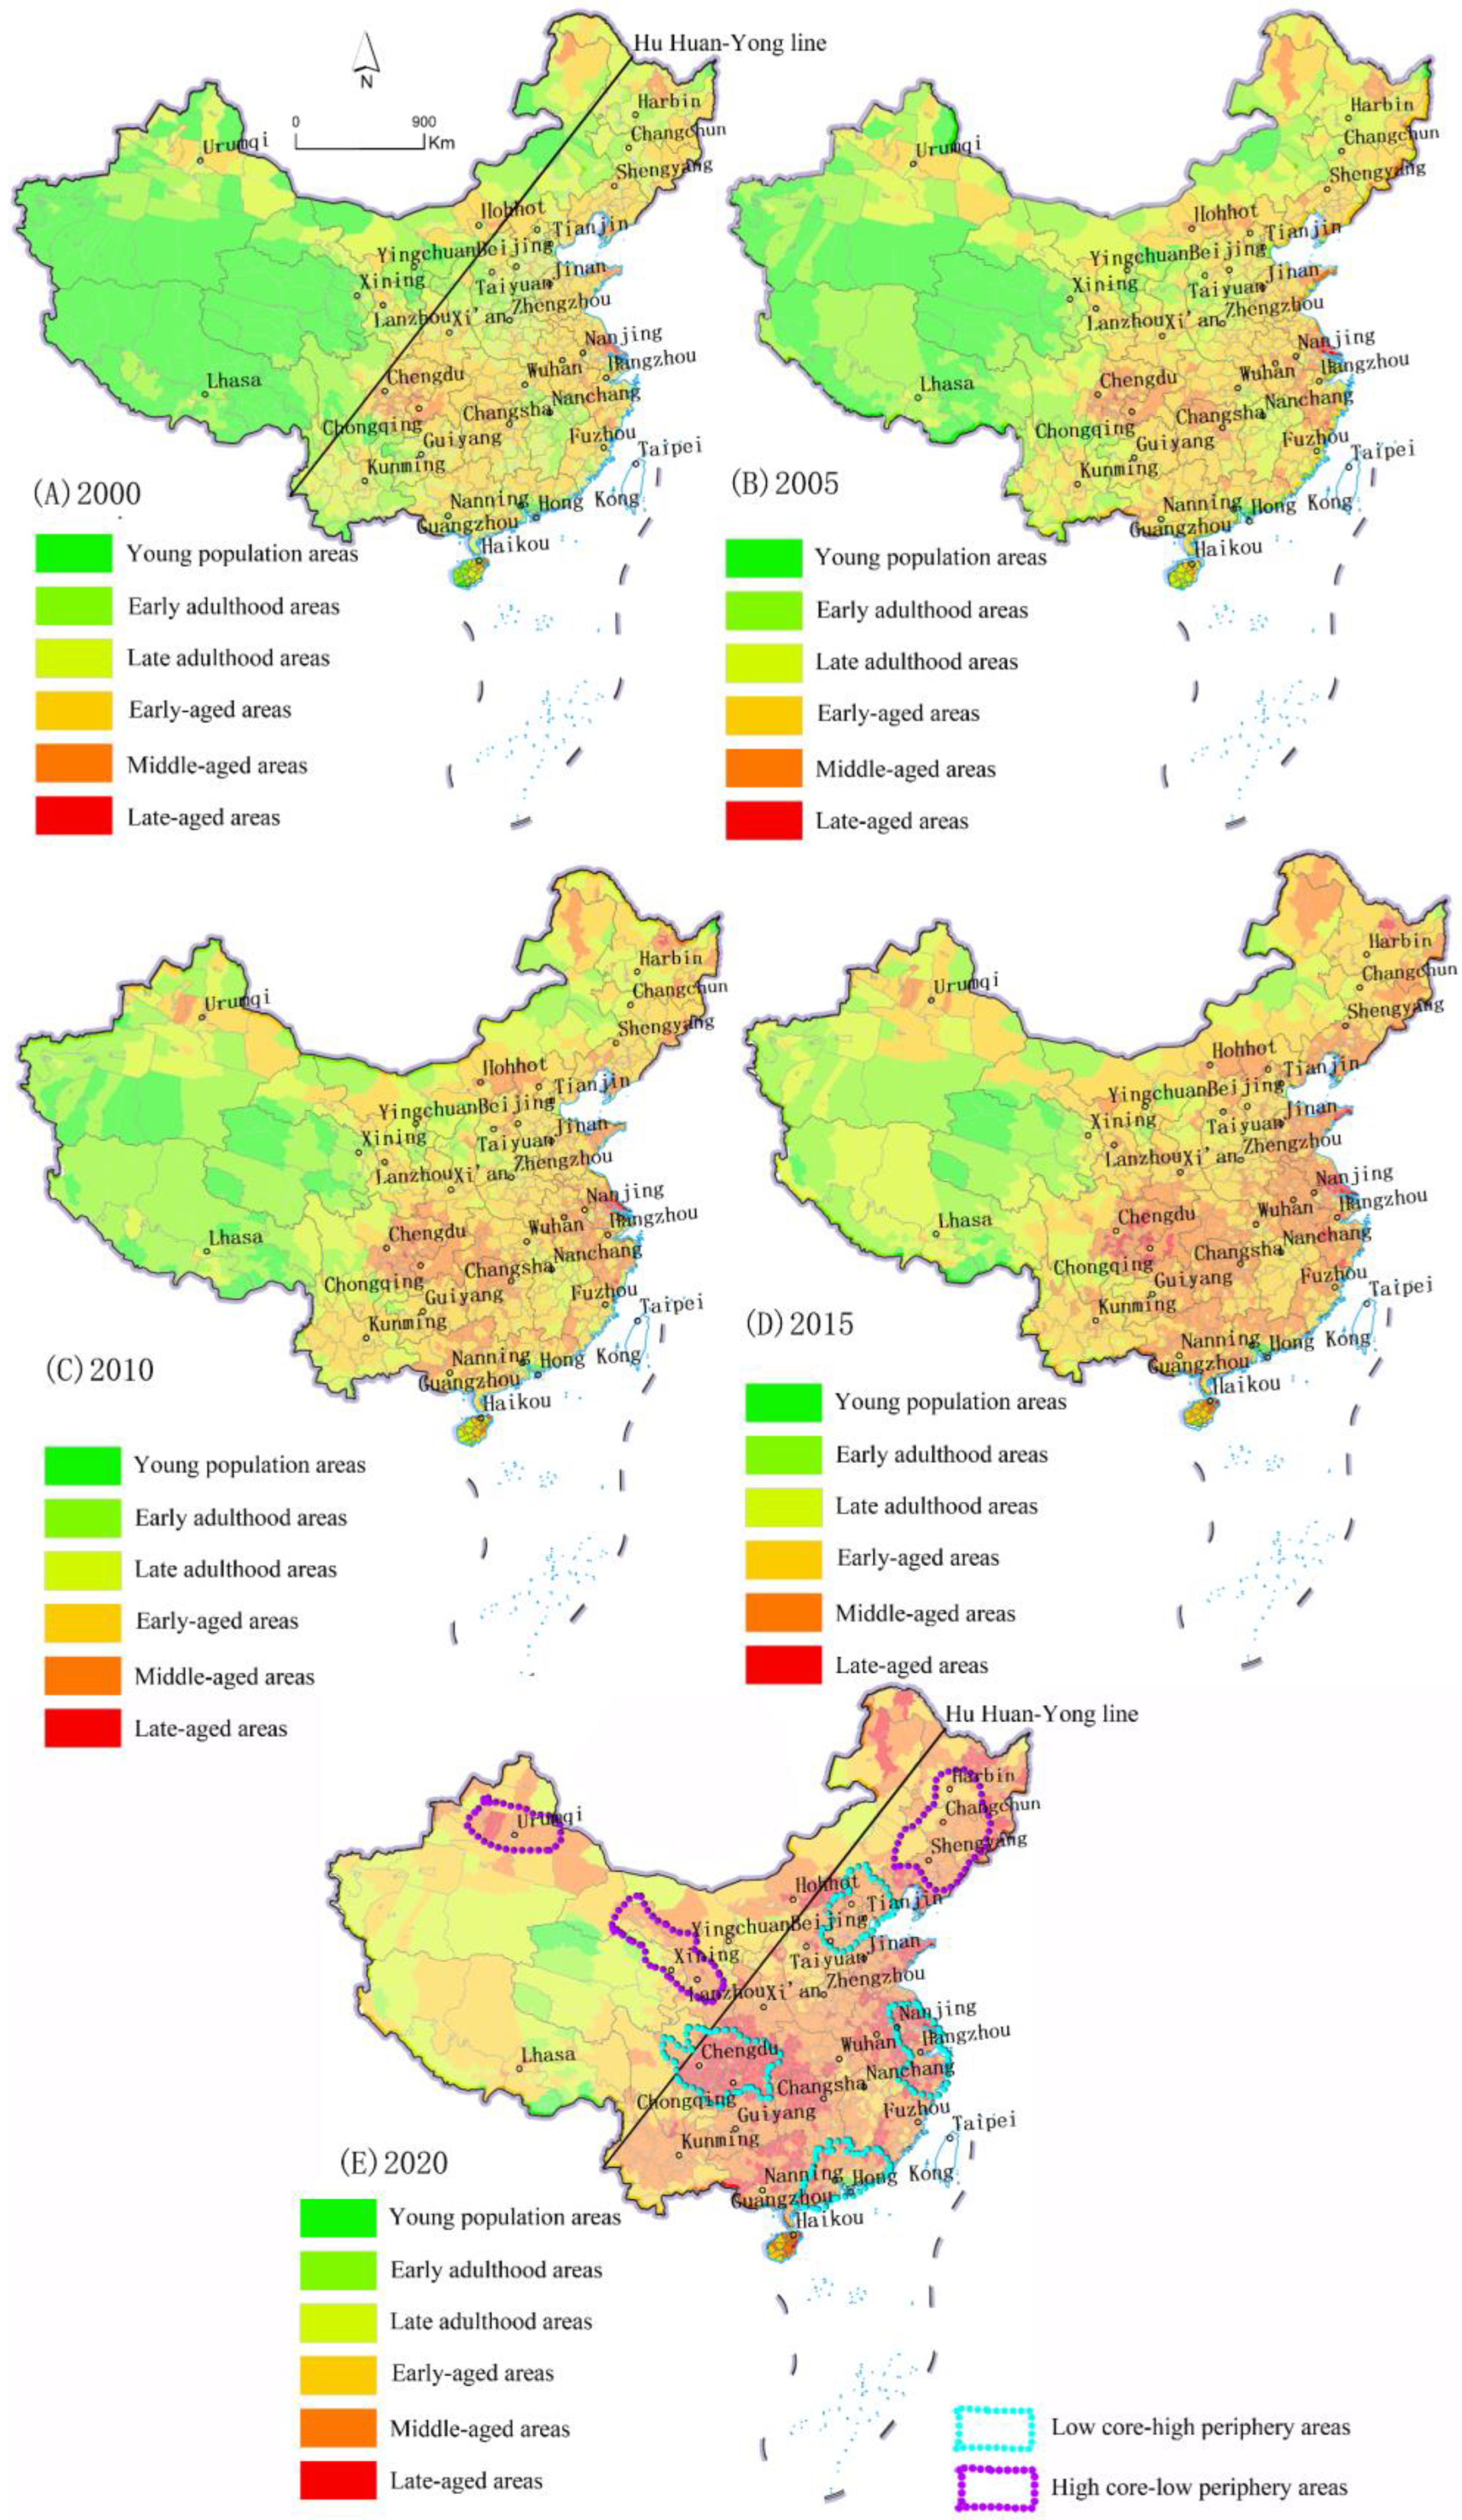
Figure 1. Spatial distribution of population aging in (A) 2000, (B) 2005, (C) 2010, (D) 2015, and (E) 2020.
Sustainability 15 07212 g001
Figure 2. Average growth rate of elderly population in China’s counties from 2000 to 2020.
Sustainability 15 07212 g002
Figure 3. Dynamic track of China’s counties entering later stage of aging from 2000 to 2020.
Sustainability 15 07212 g003
Figure 4. Relationship between aging distribution and population migration.
Sustainability 15 07212 g004
Figure 5. Relationship between population structure and aging population distribution.
Sustainability 15 07212 g005
Figure 6. Relationship between aging distribution and traffic trunk lines.
Sustainability 15 07212 g006
Figure 7. Relationship between spatial distribution of aging and topography.
Sustainability 15 07212 g007
Table 1. Type change and degree of population aging in counties of China from 2000 to 2020.
Population Type20002005201020152020
Number of CountiesNumber of CountiesGrowth Rate (%)Number of CountiesGrowth Rate (%)Number of CountiesGrowth Rate (%)Number of CountiesGrowth Rate (%)
Young population type205124−39.51%65−47.58%31−52.31%18−41.94%
Early adulthood type467282−39.61%204−27.66%118−42.16%20−83.05%
Late adulthood type956767−19.77%513−33.12%247−51.85%99−59.92%
Early-aged type1107137123.84%152010.87%1345−11.51%539−59.93%
Middle-aged type164345110.37%57466.38%107086.41%156245.98%
Late-aged type616166.67%2981.25%94224.14%667609.57%
Disclaimer/Publisher’s Note: The statements, opinions and data contained in all publications are solely those of the individual author(s) and contributor(s) and not of MDPI and/or the editor(s). MDPI and/or the editor(s) disclaim responsibility for any injury to people or property resulting from any ideas, methods, instructions or products referred to in the content.