Abstract
In the past 20 years, the integration process of the Chang-Zhu-Tan region has been accelerating, and land use has undergone significant changes. Land use change is a fundamental factor causing changes in the quality of the ecological environment. It is crucial to analyze land use change in the context of rapid urbanization and its impact on the ecological environment to promote sustainable and high-quality regional development. This study takes the Chang-Zhu-Tan core area, which has the highest development and construction intensity, as the study area. Based on the Google Earth Engine (GEE) platform, the land use information is extracted using Landsat remote sensing image data and the random forest method. The remote sensing ecological index (RSEI) is constructed to analyze the ecological and environmental effects of land use change based on the spatial and temporal changes of land use types and ecological and environmental quality in the Chang-Zhu-Tan core area from 2000 to 2020. The results show that the most critical land use change in the study area from 2000 to 2020 is mainly the sharp increase in construction land, accompanied by a continuous decrease in forest and cropland. During this period, the eco-environmental quality of the study area showed a declining trend, with significant differences in spatial distribution, generally showing a distribution pattern of suburban counties outperforming central urban areas. In addition, the distribution and changes in land use and ecological environment quality coincide spatially. Different land use types have different impacts on ecological environment quality, with the conversion of forest and cropland to construction land being the main reason for the deterioration of eco-environmental quality in the study area. This study provides a basis for the coordinated development of the ecological environment and social economy in the Chang-Zhu-Tan area.
1. Introduction
Since the beginning of the new century, with the advancement of urbanization [1], the proportion of the urban population has continued to grow [2], and the demand for urban land has continued to increase, resulting in drastic changes in the land use pattern. Ecological and environmental problems such as air pollution, the heat island effect, and soil erosion have frequently appeared [3,4,5,6], and seriously hinder the city’s sustainable development. Therefore, for rapidly urbanizing regions, revealing the characteristics of land use change and ecological environment effects has become an essential means of easing land development and environmental protection [7,8], and is of great significance for the construction of regional ecological civilization and sustainable development.
With the rapid development of remote sensing technology, it has been widely used in ecological environment research because of its fast, real-time and wide-ranging monitoring advantages [9,10,11]. In preceding studies, a single remote sensing index or highly subjective method has been used to monitor the ecological environment [12], which could not objectively and comprehensively reflect the quality of the regional ecological environment. Jiang [13] used the Normalized Difference Vegetation Index (NDVI) to evaluate China’s environmental change from 1998 to 2018. Zhuang [14] analyzed the LST effect under the background of landscape patterns in the Aksu river basin. Qu [15] used the Enhanced Vegetation Index (EVI) to investigate the dynamic changes in the vegetation of the Yangtze River Basin. Berta Aneseyee [16] used the InVEST model to analyze the spatiotemporal habitat quality changes from 1988 to 2018 in the Winike watershed. For this reason, scholars proposed the construction of comprehensive ecological indicators to reflect the regional comprehensive ecological status, mainly including the Ecological Index (EI) and Remote Sensing Ecological Index (RSEI) [17,18]. Shan [19] compared the RSEI with EI and found that the RSEI is comparable to EI, and that the RSEI is more effective in monitoring the eco-environmental quality. The RSEI is an ecological index based entirely on remote sensing. This index integrates four leading natural ecological factor indicators: greenness, wetness, heat and dryness, easy access to indicators, objective and reliable evaluation results, and the ability to visualize the eco-environmental quality. In recent years, the RSEI has been widely used for ecological and environmental quality assessment at the urban [8,20,21], mining [22,23,24] and watershed scales [25,26]. Currently, studies on the eco-environmental quality of urban agglomerations are mainly concentrated in the Beijing-Tianjin-Hebei region and the Guangdong-Hong Kong-Macao region. Most of them only analyzed the spatial and temporal changes in eco-environmental quality without further exploring the environmental effects of land use change.
Since 2000, with the strong support of national policies, the Chang-Zhu-Tan urban agglomeration has experienced rapid economic and social development, with the urbanization level increasing from 40.3% in 2000 to 76.97% in 2020, making it the most typical and representative urban agglomeration in the rapid urbanization process in central China [27]. In 2020, the Hunan provincial government officially released the Outline of the Chang-Zhu-Tan Regional Integration Development Plan, which means that the integration process of the Chang-Zhu-Tan region will be further advanced, which will inevitably cause damage to the ecological environment. As the most intensely developed area in the urban agglomeration, it is necessary to analyze the characteristics of land use change and eco-environmental quality in the Chang-Zhu-Tan core area (abbreviated as CZTCA). The objectives of this paper were to: (1) analyze the spatial and temporal evolution characteristics of land use types in CZTCA from 2000 to 2020; (2) construct RSEI based on the Google Earth Engine platform, and analyze the spatial and temporal variation characteristics of eco-environment quality in CZTCA from 2000 to 2020; and (3) explore the impact of land use change on the quality of the ecological environment in the integration process, and reveal the eco-environment effects caused by land use change. The results of this paper can provide a theoretical basis for the construction and high-quality development of a resource-saving and environment-friendly society in the Chang-Zhu-Tan region and provide a reference for optimizing land use patterns and improving the regional ecological environment in other fast-growing urban areas.
2. Materials and Methods
2.1. Study Area
The CZTCA is located in the central-eastern part of the Hunan Province (Figure 1), between 112°03′ E—113°40′ E and 27°06′ N—28°50′ N. It is the key growth area for Hunan Province’s economic development and a significant driver for the rise of central China [28]. The study area is 8629 km2, including the urban areas of Changsha, Zhuzhou, and Xiangtan cities (Yuelu District, Kaifu District, Furong District, Tianxin District, Yuhua District, Wangcheng District, Shifeng District, Hetang District, Tianyuan District, Lusong District, Yuhu District, and Yutang District) as well as Changsha County, Zhuzhou County, and Lukou District, with 15 districts and counties in total. The study area belongs to the typical humid subtropical monsoon climate, with an average annual temperature of about 16~18 °C. The average yearly precipitation in the study area is 1400 mm. The study area is dominated by mountains, hills, and mountainside plains, with good natural conditions.
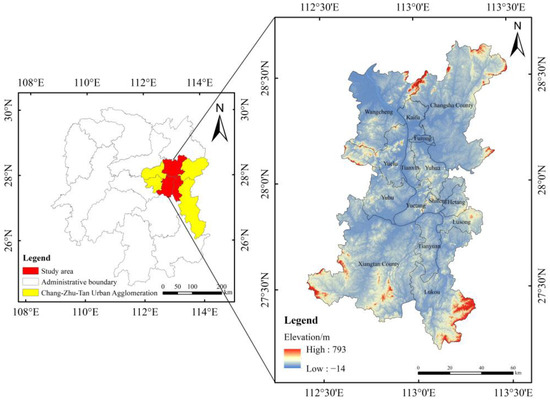
Figure 1.
Location of the study area.
Since the beginning of the new century, the critical events in the process of Chang-Zhu-Tan (CZT) integration construction include the following events. In 2000, Hunan Province promulgated the “Tenth Five-Year Plan for CZT Economic Integration.” In 2005, the Hunan Provincial Government issued the “CZT Urban Agglomeration Regional Development Plan”, China’s first urban agglomeration regional plan, marking the significant progress has been made in the construction of the CZT urban agglomeration. In 2011, the People’s Government of Hunan Province approved the “Master Plan for CZT Ecological Green Center (2010–2030)”, marking the beginning of the construction of CZT’s ecological civilization. In 2016, The “Thirteenth Five-Year Plan for National Economic and Social Development of Hunan Province” issued by Hunan Province pointed out that it was necessary to promote the development of the CZT region and strengthen the core growth poles of the CZT. In 2020, Hunan Province officially released the “Outline of CZT Regional Integrated Development Plan”, which established a new pattern of high-quality integrated development of CZT. For this reason, this study selected 2000, 2005, 2011, 2016 and 2020 as the critical time points of land use change in the CZTCA.
2.2. Materials and Processing
Landsat5 TM for 2000, 2005 and 2011 and Landsat8 OLI for 2016 and 2020 were selected as data sources, which had been processed by Google Earth Engine (https://developers.google.com/earth-engine/datasets, accessed on 1 June 2021) and can be directly used. Since the eco-environmental quality varies considerably between seasons in the study area, only the Landsat data with a cloud cover of less than 10% from June to September were selected. The study used CFMASK for removing clouds and the median synthesis method to obtain the final basic data sources. Based on the GEE platform, the random forest (RF) algorithm was used to classify the land use types in the study area into six categories: forest, cropland, grassland, water, construction land and unused land. The overall accuracy of the land use classification for all periods was tested to be greater than 85%, and the Kappa coefficient was all above 0.8, meeting the accuracy requirements for remote sensing interpretation.
2.3. Land Use Transfer Analysis
The land use transfer matrix method is a Markov model applied to land use change, which can quantify the transfer between different land use types [29]. The mathematical expression is shown below:
where is the area of the study area initially converted from land use type i to land use type j; n is the number of land use types. In this paper, the ArcGIS 10.8 software was used to spatially overlay land use classification data for each period in order to create land use transfer matrix, and then construct landscape transfer Sankey diagram with Origin software to visualize the transformation of each landscape type in order to analysis the dynamic changes of each landscape type in the study area over the past 20 years.
2.4. Dynamic Degree of Land Use Type
The dynamic degree of land use types is an index used to measure the degree of land use transformation caused by human activities in different periods, and it can reflect the change speed of the number of land use types in the study area, including the dynamic degree of single land use types and the dynamic degree of comprehensive land use types [30,31].
2.4.1. Single Land Use Dynamic Degree
The single land use type dynamic degree refers to the quantity change of a certain land use type in the study area during the study period [32]. The formula is as follows:
where (km2) and (km2) are the quantities of a certain soil land use type at the initial stage and later stage of the study, respectively; is the research period; and (%) is the dynamic degree of a certain land use type in the research period.
2.4.2. Comprehensive Land Use Dynamic Degree
The comprehensive land use type dynamic degree refers to the annual change rate of all land use types in the study area [33]; the formula is:
where (km2) is the area of land use type in the initial stage of the study; (km2) is the absolute value of the area converted from land use type to other land use type j within the study period; is the research period; and the value of (%) is the annual change rate of land use types in the study area.
2.5. Eco-Environmental Quality Evaluation
The existing studies have shown that the RSEI can effectively assess the status of regional ecological environment [26,34,35]. The RSEI was constructed from four ecological indicators that are closely related to the quality of the ecological environment: greenness, wetness, heat, and dryness [36,37]. The normalized difference vegetation index, wetness component, land surface temperature, and normalized difference soil index can represent the greenness, wetness, heat, and dryness. The formula for each indicator is detailed below.
2.5.1. Greenness (NDVI)
The NDVI is a widely used indicator for the quantitative characterization of vegetation growth [38]. The formula is as follows:
where represents the reflectance value of the near-infrared band; represents the reflectance value of the red band.
2.5.2. Wetness Component (WET)
The WET obtained by the tasseled cap transformation can better characterize the moisture conditions of ground vegetation and soil [39]. The equation is:
where , , , , , and represent the reflectance values in the remote sensing band images. – represent the reflectance of each corresponding band of the remote sensing images.
2.5.3. Heat (LST)
The LST is a common indicator to measure the degree of regional heat [40]. The specific formula is:
where represents the temperature value of the sensor; represents the central wavelength; represents the band reflectivity; and represents the specific emissivity.
2.5.4. Dryness (NDBSI)
The NDBSI is based on a combination of the soil index (SI) and build-up index (IBI), which can represent regional dryness [41].
2.5.5. Constructing the RSEI
The RSEI is constructed by principal component analysis of four ecological indicators based on the GEE platform. As the units and magnitudes of the four indicators are not uniform, if the principal component analysis is performed directly, the weights of each ecological factor indicator will be unbalanced. Therefore, the four indicators need to be normalized before PCA. Moreover, considering the large water area of the study area, it is essential to mask the water before normalizing each ecological indicator. The formula for water mask and normalization are shown in the following, respectively.
where represents the band of green; represents the band of shortwave infrared 1; is the normalized value of indicator ; is the original value of indicator ; is the maximum value of indicator ; and is the minimum value of indicator . Then, the initial value of the RSEI is calculated using PCA with the following formula [42]:
where is the initial value of the RSEI; is the first principal component in the PCA analysis; is the normalization of the four ecological factor indicators: NDVI, WET, LST, and NDBSI. The final RSEI value is obtained by normalizing . The RSEI ranges from 0 to 1, and the larger the value, the better the quality of the ecological environment is.
2.6. Analysis of the Impact of Land Use Change on Ecological Quality
In order to quantitatively analyze the ecological effects of land use change, based on the spatial distribution data of land use types and RSEI for the five periods of 2000, 2005, 2011, 2016, and 2020, the changes in land use types and ecological environment quality classes in the study area from 2000 to 2020 were analyzed, and the eco-environmental quality levels were divided into three categories: improved, deteriorated, and unchanged. The Fishnet tool was then used to separate the study area into grids of size 3 km × 3 km, and the SPSS was used to analyze the correlation between the improved/deteriorated area in each grid and the area of significant land use transfer modes to reveal the eco-environmental quality response of land use change.
3. Results
3.1. Spatiotemporal Change of Land Use Types
It can be seen from the spatial distribution of landscape types in CZTCA (Figure 2), that forest is the dominant landscape type in the study area, and cultivated land is the second largest landscape type, followed by construction land and water. In terms of spatial distribution, the forest type was mainly distributed in the southeastern and southern mountainous and hilly areas of the study area; cropland was mainly distributed along relatively flat rivers and intermountain basins. Construction land was mainly distributed in the downtown areas of the three cities of CZT. Its spatial expansion showed a trend of radiation from the urban areas to the surrounding areas. The spatial distribution of water was mainly represented by the distribution of rivers, lakes, and reservoirs. The distribution of grassland and unused land was relatively scattered.
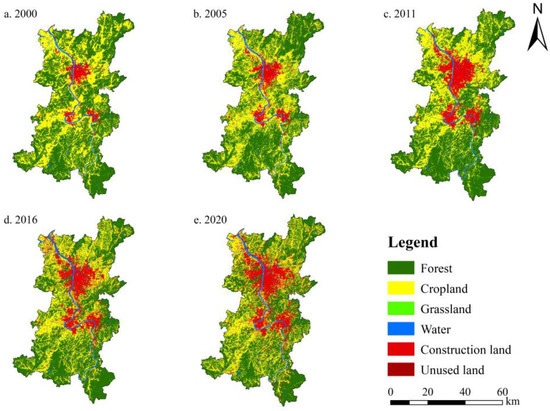
Figure 2.
The spatial distribution of land use types in study area from 2000 to 2020.
As shown in Table 1, the changes in the area of each landscape type were mainly reflected in the reduction in forest and cropland and the continuous increase in construction land. From 2000 to 2020, the forest area decreased from 4633.08 km2 to 4150.95 km2, with an annual change rate of 0.52%; the cropland area decreased by an average of 0.79% per year, with a total decrease of 505.21 km2. The construction land has the most significant growth rate among all landscape types, with an annual growth rate of 10.26%, and its area has increased from 474.79 km2 in 2000 to 1448.66 km2 in 2020. As shown in Table 2, the transfer characteristics of forest, cropland, and construction land in the study area were significant from 2000 to 2020. The conversion areas of forest and cropland to construction land were 301.90 km2 and 725.23 km2 respectively. The results reflected the rapid development of the integration of the CZTCA at the expense of forest land and cultivated land.

Table 1.
Statistical table of land use types area in CZTCA from 2000 to 2020.
Table 2.
Land use transfer matrix of CZTCA from 2000 to 2020.
The spatial distribution maps of land use types in the five periods were superimposed and analyzed in ArcGIS10.8, and the land use transfer matrix of each period was constructed. In order to display the analysis results of the land use transfer matrix more intuitively, the Sankey diagram of landscape transfer was constructed with the Origin software to visualize the transfer of each landscape type in the study area, as shown in Figure 3.
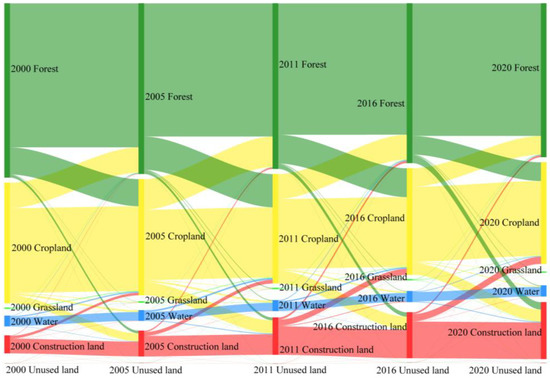
Figure 3.
The spatial distribution of land use types in Chang-Zhu-Tan core area from 2000 to 2020.
In Figure 3, the color bandwidth is the proportion of landscape types. It can be seen from the figure that, in the past 20 years, the landscape types of forest land and cultivated land in CZTCA have been mainly transferred out, and construction land has been mainly transferred in. Grassland, water bodies, and the amount of change in the transfer of unused land area are relatively small. The conversion between forest and cultivated land landscape types in the study area was reasonably frequent. With the implementation of ecological construction protection measures such as developed land protection and returning farmland to forest, the transfer between the two gradually decreased. Overall, with the acceleration of the integration process of the study area, the continuous expansion of construction land has led to the encroachment of urban ecological land, intensifying the contradiction between land use and environmental protection.
3.2. Analysis of Land Use Dynamics
It can be seen from the change in the dynamic degree of single land use (Table 3) that the changes in the active degree of land use types were quite different in the past 20 years. In 2000–2005, the dynamic degree of construction land, unused land, and grassland changed rapidly, while the active degree of other land use types changed relatively slowly. From 2005 to 2011, the change rates of forest, cropland, construction land, and water were faster than those from 2000 to 2005. In 2011–2016, except for forest and grassland, the rate of change of other land use types decreased. In 2016–2020, the change rate of cropland, water, and unused land dynamic showed an upward trend compared to the previous period. Construction land had the most significant dynamic change in the past 20 years, reaching a maximum value of 9% between 2005 and 2011.
Table 3.
Dynamic changes of single land use in CZTCA from 2000 to 2020.
The comprehensive land use dynamic degree can reflect the overall dynamic change trend for regional land use types. In this study, the comprehensive dynamic degrees of land use in the study area during 2000–2005, 2005–2011, 2011–2016, and 2016–2020 were 2.21%, 2.82%, 2.67%, and 2.70%, respectively. Generally, it showed a trend of first rising followed by a slow decline and an overall rising trend (Figure 4). The comprehensive land use dynamic degree in the study area was the highest between 2005 and 2011, with a value of 2.82%, indicating that the most frequent conversion among land use types occurred during this period.
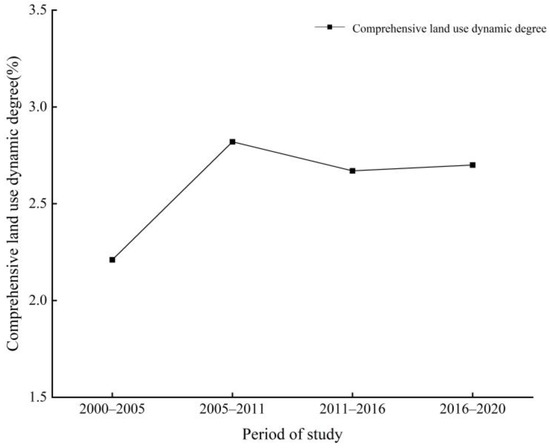
Figure 4.
Dynamic degree of comprehensive land use in CZTCA in four periods.
3.3. Dynamic Changes of Eco-Environmental Quality
The normalized NDVI, WET, LST, and NDBSI were subjected to principal component analysis by calling the principal component analysis code in the GEE platform, and the results were exhibited in Table 4. As shown in Table 4, the contribution rate of the first principal component (PC1) in 2000, 2005, 2011, 2016, and 2020 were 72.78%, 72.31%, 76.82%, 84.22%, and 87.03%, respectively, with an average of more than 78%, indicating that most of the characteristic information of the four ecological indicators are integrated into PC1. Therefore, it is reasonable to characterize the quality of the regional eco-environment based on the data extracted from the first principal component. The NDVI and WET in PC1 were positive indicators, indicating that they positively affected the eco-environmental quality. The LST and NDBSI were negative indicators that harmed the eco-environmental quality. These results were in line with reality.
Table 4.
Contributions of the four ecological indicators and the RSEI in 2000–2020.
The value of the RSEI decreased from 0.722 in 2000 to 0.634 in 2020, indicating that the eco-environmental quality in CZTCA had deteriorated. From 2000 to 2011, the RSEI value in the study area showed a continuous downward trend, with the most significant decrease of 8.19% between 2005 and 2011. The RSEI value decreased from 0.664 in 2016 to 0.634 in 2020, with a decline of 4.52%. In the contribution rate of four ecological indicators of PC1, the NDVI and NDBSI had more significant effects on the RSEI than other indicators, indicating that greenness and dryness were closely related to the quality of the eco-environmental quality in CZTCA.
In order to show the eco-environment quality of the study area more clearly, the RSEI was classified into five classes with an interval of 0.2 [43,44]: worst (0, 0.2), poor (0.2, 0.4), medium (0.4, 0.6), good (0.6, 0.8), and excellent (0.8,1), and counted the area proportion of each RSEI level in 2000, 2005, 2011, 2016, and 2020; the result was shown in Figure 5. In 2000–2020, the RSEI level of CZTCA was mainly excellent and good, and the proportions of these two levels in 2000, 2005, 2011, 2016, and 2020 were 77.43%, 77.13%, 62.28%, 69.61%, and 60.26%, respectively. The portion of areas with the worst and poor eco-environmental quality increased from 7.34% in 2000 to 16.79% in 2020. The percentage of areas with excellent eco-environmental quality fluctuated from 2000 to 2020, reaching its lowest value in 2011 and increasing significantly between 2011 and 2016, and then leveled off.
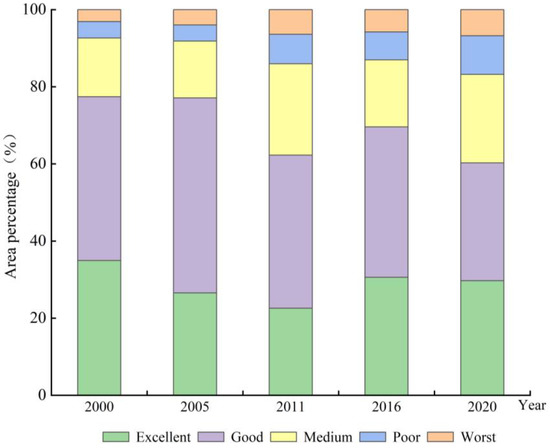
Figure 5.
The percentage of RSEI levels in the study area from 2000 to 2020.
As shown in Figure 6, the areas with good and excellent eco-environmental quality in CZTCA were most widely distributed, with prominent spatial differentiation characteristics. The good and excellent eco-environmental quality areas were distributed in a weave pattern, mainly in the study area’s northeastern and southern mountainous and hilly regions. These areas primarily were forestland with high altitudes and were less affected by human activities. The areas with the worst and poor eco-environmental quality were mainly distributed in the urban regions of CZT, which were principally construction land and were significantly affected by human activities. From 2000 to 2020, the areas with the worst and poor eco-environment quality spread radially outwards as a whole, indicating that the expansion of construction land in CZTCA had led to the deterioration of the ecological quality in the surrounding areas. In addition, the spatial distribution of eco-environmental quality (Figure 6) largely coincided with the spatial distribution of land use types (Figure 2).
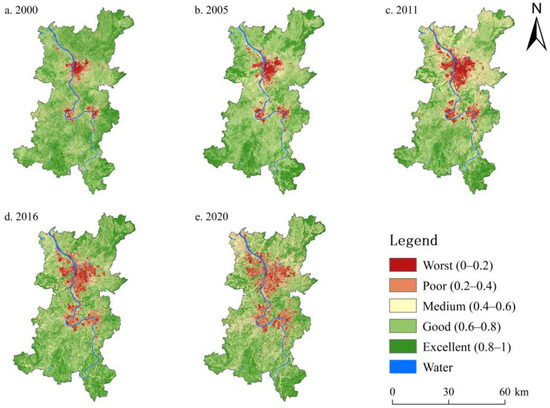
Figure 6.
Spatial distribution of the RSEI levels in study areas from 2000 to 2020.
In order to analyze the characteristics of the ecological environment quality change in different periods, this study used the difference method to detect the dynamic changes in the eco-environmental quality in CZTCA. The percentage changes in the RSEI levels are shown in Table 5. In the past 20 years, the ratio of areas with improved eco-environmental quality (29.88%) was more significant than those with deteriorated eco-environmental quality (13.43%) only in 2011–2016. The results were mainly because, since 2011, the construction of regional ecological civilization had gradually received attention. Generally, the eco-environmental quality in CZTCA showed a deteriorating trend from 2000 to 2020. The ratio of areas with deteriorated eco-environmental quality was 37.45%, and the percentage of areas with improved eco-environmental quality was only 19.6%.
Table 5.
Statistic of the RSEI levels change in the study area from 2000 to 2020.
3.4. Eco-Environmental Effects of Land Use Change
In order to further explore the relationship between land use types and ecological environment, the land use type information and remote sensing ecological index were analyzed and processed to obtain the value of the remote sensing ecological index for each land use type. The result showed differences in the eco-environmental quality under different land use types (Figure 7), which was consistent with the analysis result obtained by Zhu [45]. From 2000 to 2020, the eco-environmental quality of forest and cropland was good, and where forest played an essential role in maintaining a sound ecological environment in the study area. The eco-environmental quality of construction land and unused land was poor.
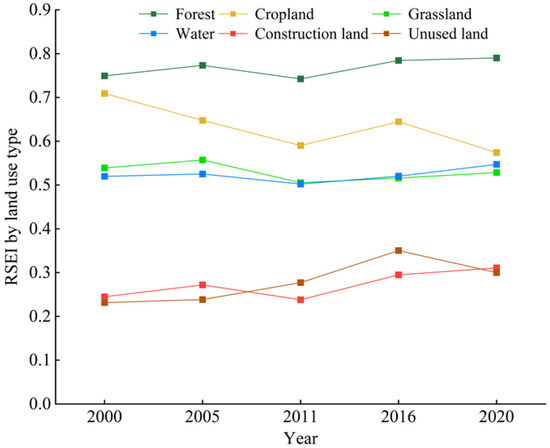
Figure 7.
The RSEI of each land use type from 2000 to 2020.
From the analysis results of the land use transfer matrix, the land use transfer in the study area in 2000–2020 was dominated by the conversion between cropland and forest, as well as the conversion of cropland to construction land and forest to construction land. Therefore, Spearman analysis was applied to correlate these three land use transfer patterns with the improvement/deterioration in ecological quality. The results of the correlation analysis are shown in Table 6.
Table 6.
Dynamic changes of single land use in CZTCA from 2000 to 2020.
As seen in Table 6, the conversion of cropland to forest and the conversion of construction land to the forest had a significant positive effect on the improvement of the eco-environmental quality of the study area. The result indicated that the increase in the forest was the main reason for improving eco-environmental quality in CZTCA. In 2005–2011, the conversion of forest to construction land significantly impacted the deterioration of eco-environmental quality. Combined with the preceding, it was clear that the ratio of areas with a deteriorated eco-environmental rate (30.33%) was more significant than the ratio of areas with improved eco-environmental quality (10.11%) during 2005–2011. The results showed that the expansion of construction land had exacerbated the encroachment of forest, which was the main reason for the decline in the eco-environmental quality of CZTCA. Therefore, it is of great significance to rationally adjust the land use structure and optimize the spatial distribution of land use to improve the ecological environment and promote the region’s sustainable development.
4. Discussion
4.1. Causes of Land Use Change in the Past 20 Years
In the past 20 years, forest, cropland, and construction land were the primary land use types that had changed in CZTCA. The most dramatic land use change occurred between 2005 and 2011, with a relationship between policy and economic development. Since the Chang-Zhu-Tan urban agglomeration was included in the national “Eleventh Five-Year Plan” in 2005, the regional economy had developed rapidly. Then, in 2007, it was approved as a “resource-saving and environment-friendly society construction reform pilot zone”. With the support of this series of national policies [46], the integration process of CZTCA continues to accelerate. The ensuing population growth and highly active economic activities had led to an increasing demand for construction land, which intensified the encroachment of forest and cropland. Since 2011, the government has paid increasing attention for constructing CZT’s ecological civilization, so the area of forest converted to construction land, cropland, and cropland to construction land in the core area of CZT had decreased. The results of this study are consistent with those of previous studies on land use change in the CZT region. Zhu [47] discovered that the construction land increased explosively from 2000 to 2010, and the growth rate decreased from 2015 to 2019. In the future development and construction process of the CZT region, scientific and reasonable land use planning should be formulated to strengthen the protection of the ecological environment and achieve sustainable land use development.
4.2. Evolution of Eco-Environmental Effects in the Past 20 Years
The spatial differentiation of eco-environmental quality was consistent with the results of previous studies [8,48], and the spatial distribution of ecological and environmental quality largely coincides with the distribution of land use. The conversion of forest and cropland to construction land and the mutual conversion between forest and cropland are the reasons for the deterioration of the eco-environment quality of CZTCA. The GDP of the CZT region increased from 116.153 billion CNY in 2000 to 1759.146 billion CNY in 2020. The rapid economic development had a particularly negative impact on the eco-environment quality. Therefore, it is imperative to alleviate the conflict between economic growth and ecological protection. In the future development of the CZT region, for areas with excellent/ good eco-environmental quality, we should fully play to the advantages of ecological resources and develop ecological economy. For areas with a medium-quality ecological environment, we should implement ecological policies such as returning farmland to forest and grass. For areas with a poor quality ecological environment, the scope and speed of construction land expansion should be controlled, the basic farmland protection system should be strictly enforced, and the policy of occupying and replenishing cropland should be implemented. For areas with the worst quality ecological environment, a stricter red line for ecological protection should be drawn, and ecological protection should be performed resolutely to ensure that environmental resources continue to improve and the quality of the ecological environment is continuously enhanced.
4.3. Limitation and Future Work
This study was based entirely on Landsat remote sensing imagery, and due to the resolution of the images, there were inevitable errors in the RSEI construction. Nevertheless, the study’s results indicated that using the RSEI to evaluate the eco-environmental quality of the study area was objective and comprehensive. In future studies, we should strengthen the research on the influencing factors of eco-environment quality so that the regional ecological environment effect analysis can be more comprehensive.
5. Conclusions
This study analyzed the characteristics of land use change and its ecological environment effects in CZTCA during the integration process since the 21st century. It can provide practical significance for the sustainable development of regional society, economy, and ecology. The main conclusions are as follows:
- From 2000 to 2020, the change of land use area in CZTCA showed a continuous decrease in the area of forest and cropland, a substantial increase in the area of construction land, an increase in the area of water, and a relatively small changes in other land use types. From 2005 to 2011, the intensity of land use change was the largest, and the trend of land use change slowed down from 2011 to 2016. In the past 20 years, the transfer of land use has mainly manifested in the conversion of forest land and cropland to construction land, and the mutual conversion between forest and cultivated land. Among them, the conversion of forest and cropland to construction land mainly occurred near the urban areas.
- The eco-environmental quality showed a downward trend from 2000–2020, and the regional RSEI value dropped from 0.722 to 0.634. In addition, the spatial distribution of eco-environmental quality in CZTCA was significantly different. The eco-environmental quality of forest land and cropland is relatively high. The areas with excellent and good eco-environmental quality were mainly distributed in the northeast and southern mountains with high altitudes; construction land and unused land had poor eco-environmental quality and were primarily distributed in downtown areas.
- The conversion of different land use types had different impacts on the eco-environmental quality. The conversion of cropland and construction land to forest was essential for improving eco-environmental quality in CZTCA. In contrast, the conversion of forest and cultivated land to construction land was an essential reason for the deterioration of the ecological environment quality.
Author Contributions
Conceptualization, S.M.; methodology, S.M.; software, S.M.; formal analysis, S.M.; investigation, S.M. and Y.Z.; writing—original draft preparation, S.M.; writing—review and editing, S.M. and J.S.; supervision, J.S.; project administration, J.S.; funding acquisition, J.S. All authors have read and agreed to the published version of the manuscript.
Funding
This research was funded by the project of Science Technology Plan of Changsha, grant number kq1801082.
Institutional Review Board Statement
Not applicable.
Informed Consent Statement
Not applicable.
Data Availability Statement
Not applicable.
Acknowledgments
The authors would like to thank the anonymous referees for their valuable comments and suggestions in the earlier manuscript.
Conflicts of Interest
The authors declare no conflict of interest.
References
- Yang, Y.; Bao, W.; Wang, Y.; Liu, Y. Measurement of urban-rural integration level and its spatial differentiation in China in the new century. Habitat Int. 2021, 117, 102420. [Google Scholar] [CrossRef]
- Xie, Y.; Liu, C.; Chang, S.; Jiang, B. Urban Sustainability: Integrating Socioeconomic and Environmental Data for Multi-Objective Assessment. Sustainability 2022, 14, 9142. [Google Scholar] [CrossRef]
- Ouyang, X.; Tang, L.; Wei, X.; Li, Y. Spatial interaction between urbanization and ecosystem services in Chinese urban agglomerations. Land Use Policy 2021, 109, 105587. [Google Scholar] [CrossRef]
- Jeong, A.; Dorn, R.I. Soil erosion from urbanization processes in the Sonoran Desert, Arizona, USA. Land Degrad. Dev. 2019, 30, 226–238. [Google Scholar] [CrossRef]
- Li, X.; Suoerdahan, G.; Shi, Z.; Xing, Z.; Ren, Y.; Yang, R. Spatial–Temporal Impacts of Urban Sprawl on Ecosystem Services: Implications for Urban Planning in the Process of Rapid Urbanization. Land 2021, 10, 1210. [Google Scholar] [CrossRef]
- Liang, W.; Yang, M. Urbanization, economic growth and environmental pollution: Evidence from China. Sustain. Comput. Inform. Syst. 2019, 21, 1–9. [Google Scholar] [CrossRef]
- Dadashpoor, H.; Azizi, P.; Moghadasi, M. Land use change, urbanization, and change in landscape pattern in a metropolitan area. Sci. Total Environ. 2019, 655, 707–719. [Google Scholar] [CrossRef]
- Airiken, M.; Zhang, F.; Chan, N.W.; Kung, H.T. Assessment of spatial and temporal ecological environment quality under land use change of urban agglomeration in the North Slope of Tianshan, China. Enviro. Sci. Pollut Res. 2022, 29, 12282–12299. [Google Scholar] [CrossRef]
- Xu, D.; Cheng, J.; Xu, S.; Geng, J.; Yang, F.; Fang, H.; Li, H. Understanding the Relationship between China’s Eco-Environmental Quality and Urbanization Using Multisource Remote Sensing Data. Remote Sens. 2022, 14, 198. [Google Scholar] [CrossRef]
- Regos, A.; Gonçalves, J.; Arenas-Castro, S.; Alcaraz-Segura, D.; Guisan, A.; Honrado, J.P. Mainstreaming remotely sensed ecosystem functioning in ecological niche models. Remote Sens. Ecol. Conserv. 2022, 8, 431–447. [Google Scholar] [CrossRef]
- Zheng, Z.; Wu, Z.; Chen, Y.; Guo, C.; Marinello, F. Instability of remote sensing based ecological index (RSEI) and its improvement for time series analysis. Sci. Total Environ. 2022, 814, 152595. [Google Scholar] [CrossRef]
- Karakuş, C.B. The impact of land use/land cover (LULC) changes on land surface temperature in Sivas City Center and its surroundings and assessment of Urban Heat Island. Asia Pac. J. Atmos. Sci. 2019, 55, 669–684. [Google Scholar] [CrossRef]
- Jiang, L.; Liu, Y.; Wu, S.; Yang, C. Analyzing ecological environment change and associated driving factors in China based on NDVI time series data. Ecol. Indic. 2021, 129, 107933. [Google Scholar] [CrossRef]
- Zhuang, Q.; Wu, S.; Yan, Y.; Niu, Y.; Yang, F.; Xie, C. Monitoring land surface thermal environments under the background of landscape patterns in arid regions: A case study in Aksu river basin. Sci. Total Environ. 2020, 710, 136336. [Google Scholar] [CrossRef]
- Qu, S.; Wang, L.; Lin, A.; Yu, D.; Yuan, M. Distinguishing the impacts of climate change and anthropogenic factors on vegetation dynamics in the Yangtze River Basin, China. Ecol. Indic. 2020, 108, 105724. [Google Scholar] [CrossRef]
- Berta Aneseyee, A.; Noszczyk, T.; Soromessa, T.; Elias, E. The InVEST habitat quality model associated with land use/cover changes: A qualitative case study of the Winike Watershed in the Omo-Gibe Basin, Southwest Ethiopia. Remote Sens. 2020, 12, 1103. [Google Scholar] [CrossRef]
- Xu, H.; Wang, Y.; Guan, H.; Shi, T.; Hu, X. Detecting ecological changes with a remote sensing based ecological index (RSEI) produced time series and change vector analysis. Remote Sens. 2019, 11, 2345. [Google Scholar] [CrossRef]
- Karbalaei Saleh, S.; Amoushahi, S.; Gholipour, M. Spatiotemporal ecological quality assessment of metropolitan cities: A case study of central Iran. Environ. Monit. Assess. 2021, 193, 305. [Google Scholar] [CrossRef]
- Shan, W.; Jin, X.; Ren, J.; Wang, Y.; Xu, Z.; Fan, Y.; Zhou, Y. Ecological environment quality assessment based on remote sensing data for land consolidation. J. Clean. Prod. 2019, 239, 118126. [Google Scholar] [CrossRef]
- Boori, M.S.; Choudhary, K.; Paringer, R.; Kupriyanov, A. Spatiotemporal ecological vulnerability analysis with statistical correlation based on satellite remote sensing in Samara, Russia. J. Environ. Manag. 2021, 285, 112138. [Google Scholar] [CrossRef] [PubMed]
- Ji, J.; Tang, Z.; Zhang, W.; Liu, W.; Jin, B.; Xi, X.; Wang, Z. Spatiotemporal and multiscale analysis of the coupling coordination degree between economic development equality and eco-environmental quality in China from 2001 to 2020. Remote Sens. 2022, 14, 737. [Google Scholar] [CrossRef]
- Zhao, F.F.; He, M.C.; Wang, Y.T.; Tao, Z.G.; Li, C. Eco-geological environment quality assessment based on multi-source data of the mining city in red soil hilly region, China. J. Mountain Sci. 2022, 19, 253–275. [Google Scholar] [CrossRef]
- Tang, H.; Fang, J.; Xie, R.; Ji, X.; Li, D.; Yuan, J. Impact of Land Cover Change on a Typical Mining Region and Its Ecological Environment Quality Evaluation Using Remote Sensing Based Ecological Index (RSEI). Sustainability 2022, 14, 12694. [Google Scholar] [CrossRef]
- Pan, J.; Li, H.; Li, Y. Spatiotemporal change analysis of environmental quality in mining areas based on long-term Landsat images. Geocarto Int. 2022, 37, 11052–11067. [Google Scholar] [CrossRef]
- Yang, X.; Meng, F.; Fu, P.; Zhang, Y.; Liu, Y. Spatiotemporal change and driving factors of the Eco-Environment quality in the Yangtze River Basin from 2001 to 2019. Ecol. Indic. 2021, 131, 108214. [Google Scholar] [CrossRef]
- Zhou, J.; Liu, W. Monitoring and evaluation of eco-environment quality based on remote sensing-based ecological index (RSEI) in Taihu Lake Basin, China. Sustainability 2022, 14, 5642. [Google Scholar] [CrossRef]
- He, Y.; Lin, Y.; Zhou, G.; Zhu, Y.; Tang, K. Spatial pattern and drivers of urbanization in China’s mid-level developing urban agglomeration: A case study of Chang-Zhu-Tan. Reg. Sustain. 2021, 2, 83–97. [Google Scholar] [CrossRef]
- Ma, S.; Zhao, Y.; Tan, X. Exploring smart growth boundaries of urban agglomeration with land use spatial optimization: A case study of Changsha-Zhuzhou-Xiangtan city group, China. Chin. Geogr. Sci. 2020, 30, 665–676. [Google Scholar] [CrossRef]
- Zhang, C.Y.; Zhao, L.; Zhang, H.T.; Chen, M.N.; Fang, R.Y.; Yao, Y.; Zhang, Q.P.; Wang, Q. Spatial-temporal characteristics of carbon emissions from land use change in Yellow River Delta region, China. Ecol. Indic. 2022, 136, 108623. [Google Scholar] [CrossRef]
- Talukdar, S.; Singha, P.; Mahato, S.; Praveen, B.; Rahman, A. Dynamics of ecosystem services (ESs) in response to land use land cover (LU/LC) changes in the lower Gangetic plain of India. Ecol. Indic. 2020, 112, 106121. [Google Scholar] [CrossRef]
- Wei, J.; Wen, Y.; Gong, Z.; Wang, X.; Cai, Y. Land use changes and ecosystem service value in the buffer zone of Poyang Lake in recent 30 years. Acta Ecol. Sin. 2022, 42, 1–13. [Google Scholar]
- Chen, W.; Chi, G.; Li, J. The spatial association of ecosystem services with land use and land cover change at the county level in China, 1995–2015. Sci. Total Environ. 2019, 669, 459–470. [Google Scholar] [CrossRef]
- Liu, W.; Zhan, J.; Zhao, F.; Yan, H.; Zhang, F.; Wei, X. Impacts of urbanization-induced land-use changes on ecosystem services: A case study of the Pearl River Delta Metropolitan Region, China. Ecol. Indic. 2019, 98, 228–238. [Google Scholar] [CrossRef]
- Wang, S.; Ge, Y. Ecological Quality Response to Multi-Scenario Land-Use Changes in the Heihe River Basin. Sustainability 2022, 14, 2716. [Google Scholar] [CrossRef]
- Wang, X.; Gong, W.; Huang, X.; Liu, T.; Zhou, Y.; Li, H. Assessment of eco-environmental quality on land use and land cover changes using remote sensing and GIS: A case study of Miyun county. Nat. Environ. Pollut. Technol. 2018, 17, 739–746. [Google Scholar]
- Geng, J.; Yu, K.; Xie, Z.; Zhao, G.; Ai, J.; Yang, L.; Liu, J. Analysis of spatiotemporal variation and drivers of ecological quality in Fuzhou based on RSEI. Remote Sens. 2022, 14, 4900. [Google Scholar] [CrossRef]
- Xiong, Y.; Xu, W.; Lu, N.; Huang, S.; Wu, C.; Wang, L.; Kou, W. Assessment of spatial–temporal changes of ecological environment quality based on RSEI and GEE: A case study in Erhai Lake Basin, Yunnan province, China. Ecol. Indic. 2021, 125, 107518. [Google Scholar] [CrossRef]
- Chu, H.; Venevsky, S.; Wu, C.; Wang, M. NDVI-based vegetation dynamics and its response to climate changes at Amur-Heilongjiang River Basin from 1982 to 2015. Sci. Total Environ. 2019, 650, 2051–2062. [Google Scholar] [CrossRef] [PubMed]
- Zhai, Y.; Roy, D.P.; Martins, V.S.; Zhang, H.K.; Yan, L.; Li, Z. Conterminous United States Landsat-8 top of atmosphere and surface reflectance tasseled cap transformation coefficients. Remote Sens. Environ. 2022, 274, 112992. [Google Scholar] [CrossRef]
- Alexander, C. Normalised difference spectral indices and urban land cover as indicators of land surface temperature (LST). Int. J. Appl. Earth Obs. Geoinf. 2020, 86, 102013. [Google Scholar] [CrossRef]
- Yang, C.; Zhang, C.; Li, Q.; Liu, H.; Gao, W.; Shi, T.; Wu, G. Rapid urbanization and policy variation greatly drive ecological quality evolution in Guangdong-Hong Kong-Macau Greater Bay Area of China: A remote sensing perspective. Ecol. Indic. 2020, 115, 106373. [Google Scholar] [CrossRef]
- Han, N.; Hu, K.; Yu, M.; Jia, P.; Zhang, Y. Incorporating Ecological Constraints into the Simulations of Tropical Urban Growth Boundaries: A Case Study of Sanya City on Hainan Island, China. Appl. Sci. 2022, 12, 6409. [Google Scholar] [CrossRef]
- Yang, X.; Bai, Y.; Che, L.; Qiao, F.; Xie, L. Incorporating ecological constraints into urban growth boundaries: A case study of ecologically fragile areas in the Upper Yellow River. Ecol. Indic. 2021, 124, 107436. [Google Scholar] [CrossRef]
- Yuan, B.; Fu, L.; Zou, Y.; Zhang, S.; Chen, X.; Li, F.; Xie, Y. Spatiotemporal change detection of ecological quality and the associated affecting factors in Dongting Lake Basin, based on RSEI. J. Clean. Prod. 2021, 302, 126995. [Google Scholar] [CrossRef]
- Zhu, D.; Chen, T.; Wang, Z.; Niu, R. Detecting ecological spatial-temporal changes by Remote Sensing Ecological Index with local adaptability. J. Environ. Manag. 2021, 299, 113655. [Google Scholar] [CrossRef]
- Wang, Z.; Zhang, X.; Zhang, C.; Yang, Q. How regional integration affects urban green development efficiency: Evidence from urban agglomeration in the middle reaches of the Yangtze River. Int. J. Environ. Res. Public Health 2022, 19, 7937. [Google Scholar] [CrossRef] [PubMed]
- Zhu, Z.; Zhu, X.; Zhang, X.Y. Study on the spatial and temporal changes of various types of urban construction land in ChangZhuTan urban agglomeration metropolitan area. Hum. Geogr. 2021, 36, 145–154. [Google Scholar]
- Zheng, H.; Li, H. Spatial–temporal evolution characteristics of land use and habitat quality in Shandong Province, China. Sci. Rep. 2022, 12, 15422. [Google Scholar] [CrossRef] [PubMed]


Disclaimer/Publisher’s Note: The statements, opinions and data contained in all publications are solely those of the individual author(s) and contributor(s) and not of MDPI and/or the editor(s). MDPI and/or the editor(s) disclaim responsibility for any injury to people or property resulting from any ideas, methods, instructions or products referred to in the content. |
© 2023 by the authors. Licensee MDPI, Basel, Switzerland. This article is an open access article distributed under the terms and conditions of the Creative Commons Attribution (CC BY) license (https://creativecommons.org/licenses/by/4.0/).