Abstract
In rural planning, ensuring sustainable water management is pivotal, particularly in addressing the challenges posed by the absence of comprehensive rural water security assessments. Despite the abundance of water resources in mountainous regions, their accessibility and utilization remain significant hurdles for local populations, often hindering sustainable development. This study proposed a rural water accessibility (RWA) model, focusing on village settlements (VSs) as fundamental units for water utilization. The model examines two critical aspects of mountainous water security that are essential for sustainability: the supply–demand relation between VSs and their water sources, and the water availability to characterize difficulties in obtaining water sources in complex terrain. Using data from 1156 natural VSs in Dongchuan District, Kunming, water demand was calculated based on population and local average rural water demand per person. Springs and streams were identified as main and standby water sources, respectively. The RWA model evaluates the supply–demand balance and assesses water availability using the least-cost path (LCP) method. The results establish RWA grades, indicating water security conditions for VSs. This approach effectively identifies supply–demand relations and determines water demand gaps, facilitating targeted water management in rural areas, especially during droughts. It enables managers to accurately gauge the grade of water accessibility for each VS, allowing for prompt and tailored emergency water supply interventions. Furthermore, aggregating the RWA of each VS can provide valuable insights for devising sustainable water management strategies in mountainous regions.
1. Introduction
Water scarcity, especially under the influence of climate change, has emerged as a critical factor for human survival and sustainable development [1,2]. Rural areas face even more significant challenges as they experience water scarcity compared to urban centers [3], especially when confronted with droughts and other climate extremes, leading to the amplification of secondary disasters [4,5]. Rural water planning should take these risks into account and develop risk response measures. However, because it is difficult for managers to have an in-depth understanding of the water supply–demand relation and water utilization difficulties in each village settlement (VS), which is seen as the most basic management unit in rural areas, the above planning generally lacks pertinence and rationality in terms of water resource allocation and the emergency management of water scarcity in rural areas.
In addition, in the less developed mountainous areas, the complex terrain challenges reasonable rural water planning. While it is true that mountains can be rich in water resources, the accessibility and utilization of these resources can be a significant challenge for local populations. Numerous studies have indicated that despite the abundance of water, mountain residents often face difficulties in effectively utilizing these resources due to the lack of infrastructure [6,7]. First, the distribution of water resources in mountainous areas is unbalanced spatially and quantitively [8]. Second, it is more difficult for rural residents to obtain water resources in mountainous areas than in plain areas. Third, the construction of water conservancy facilities in mountainous areas is weak [9]. Mountainous areas constitute nearly one-fourth of the Earth’s terrestrial land surface, providing a home directly for 12% and indirectly for 40% of the world population [10], and encompassing a significant portion of global biodiversity and cultural diversity [11], presenting challenges that are not unique to any single area.
Therefore, developing a method for assessing water security in rural mountainous areas is not only essential but also a cornerstone for sustainable development. This method should be able to determine the supply–demand relation between each village and its corresponding water source, as well as quantify the challenges associated with taking water in these areas. Doing so will allow the more effective and rational planning of rural water resources, ensuring their sustainable use and management in mountainous areas.
Although regional indicators (indicators of city or county level, the term “region” refers to administrative divisions at or above the county level) play a crucial role in supporting regional water resource allocation decisions [12,13], they often lack the necessary guidance for implementing VSs, which are considered the fundamental units for both agricultural production and domestic use, as well as water utilization. This becomes a technical bottleneck for deploying water facilities and formulating water security contingency plans at the infrastructure level, particularly in rural planning [8,14].
Research methods have been developed to evaluate water accessibility. One such approach is establishing a multi-index evaluation system, as described by Nie et al. [15] and Romero-Lankao and Gnatz [16]. Another approach involves simulating the spatial characteristics of water accessibility. This is performed by establishing the relation between the distance of each grid and the water source within the watershed and combining it with information on the hydrological factors of the water source (usually the river) [17,18]. While these approaches do capture some aspects of water accessibility at both the macroscopic and local levels, accurately representing water extraction and use by VSs remains challenging. Additionally, regional indicators tend to emphasize common characteristics rather than accounting for the differentiated needs of VSs. Consequently, they may ignore the needs of VSs and cannot effectively provide guidance for infrastructure planning where tailored approaches are essential [19]. Only by focusing on rural residential areas as the research object and perspective can we deeply understand and solve the practical problems, such as where the water source used by each rural residential area is, what the demand is, and whether the demand can be met.
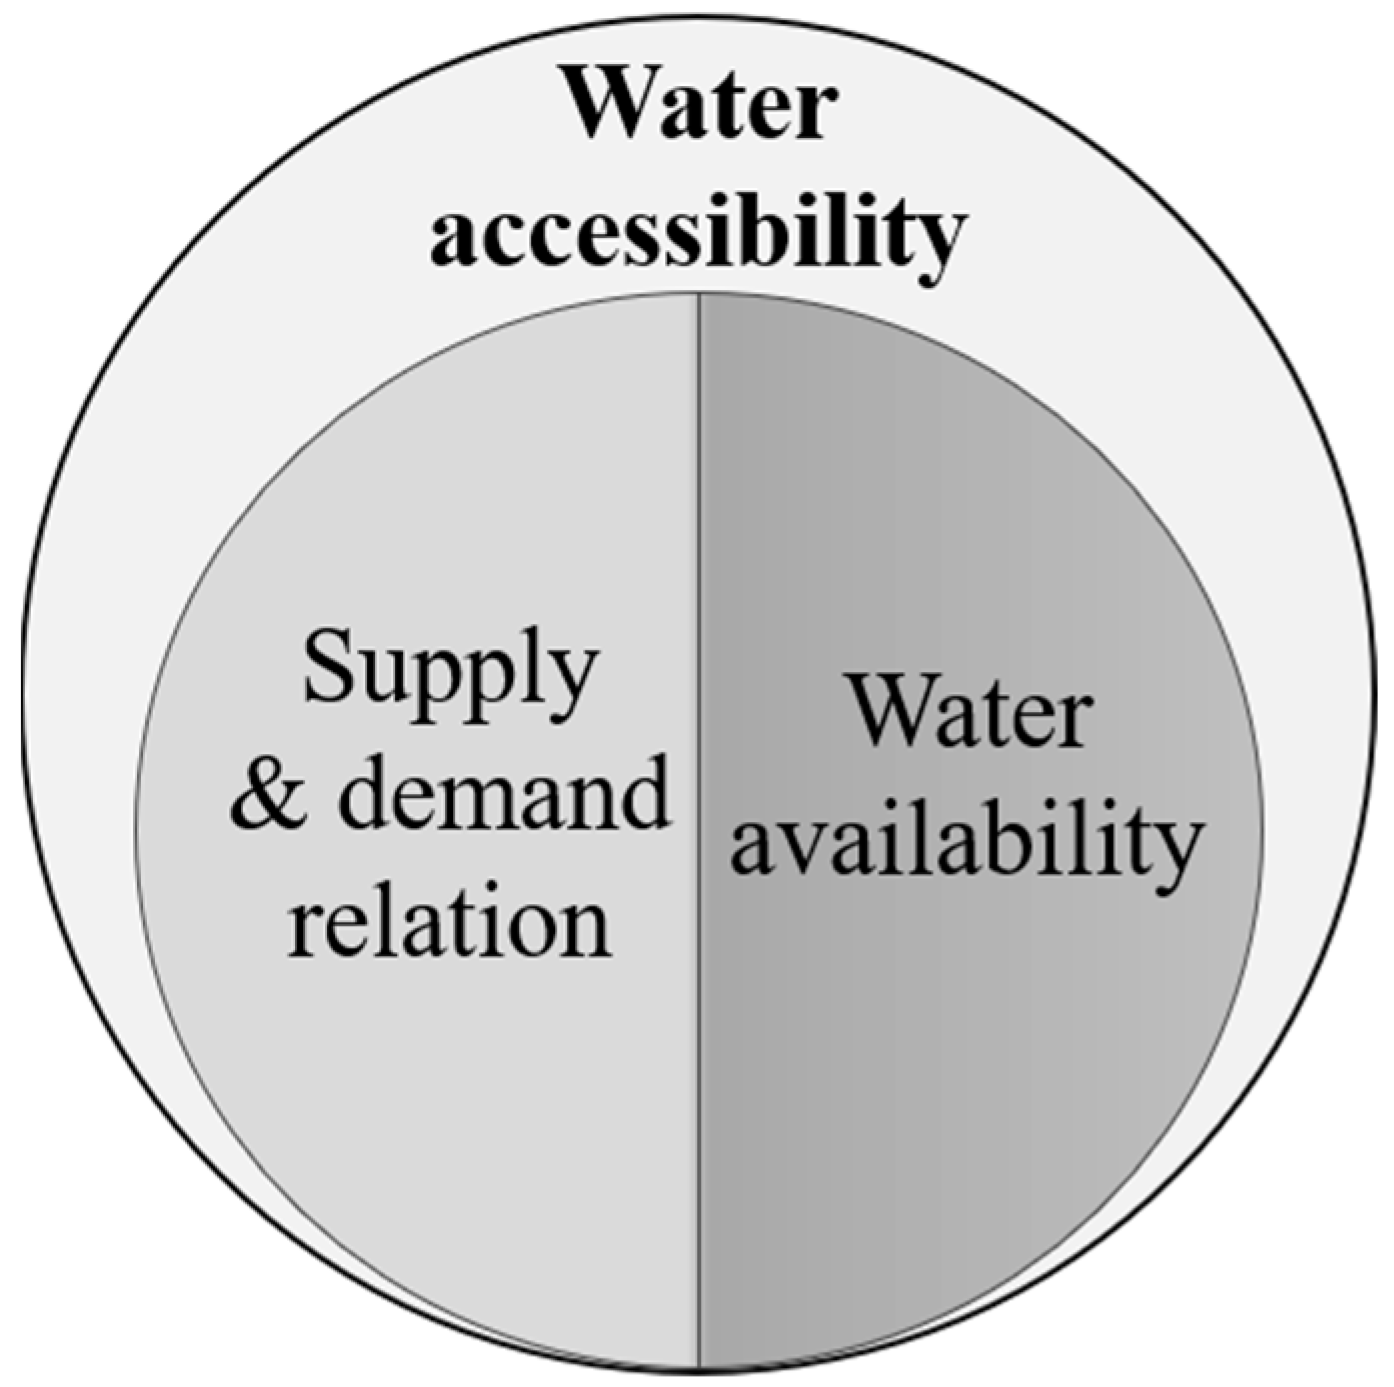
Therefore, two main issues need to be addressed to detect the water accessibility of each VS: Firstly, whether the supply from a water source can meet the water demand of VSs which share the same water source. The supply–demand relation between the VSs and their water source is the primary issue in evaluating rural water accessibility (RWA) in mountainous rural areas [20,21]. Secondly, this study examines the difficulty faced by each VS in reaching its water source (emphasis on the length of the path from VSs to their water sources in mountainous terrains), which characterizes the water availability of VSs [7]. Together, these factors determine the RWA of VSs (Figure 1).

Figure 1.
Concept diagram of the RWA.
Under extreme climatic conditions, such as droughts, when the proportion of the total water supply decreases, the availability of standby water sources plays a significant role in determining water accessibility. This aspect often becomes the central issue in addressing water scarcity for production and domestic use in less developed regions, especially in remote mountainous areas where sustainable water management is imperative for ensuring the adaptability and longevity of water resources.
During the persistent drought in northeastern Yunnan from 2009 to 2013, the phenomena of “picking up water with a stretcher” and “delivering water by fire trucks” were very common [22]. Although the situation has improved over the past ten years, water scarcity remains a pressing challenge that requires sustainable solutions from water managers in the region. For example, in the spring of 2023, Yunnan experienced a drought with a significant impact and a broad scope, which posed a major obstacle to the local economy and rural development [23].
In this study, we selected Dongchuan District of Kunming, a typical mountainous county in northeastern Yunnan, China, as our case study area. Under the VS perspective, the two core issues mentioned above were both considered to evaluate the water accessibility of VSs, enhancing the rationality and effectiveness of rural water planning in mountainous areas through sustainable practices.
2. Materials and Methods
2.1. Study Area
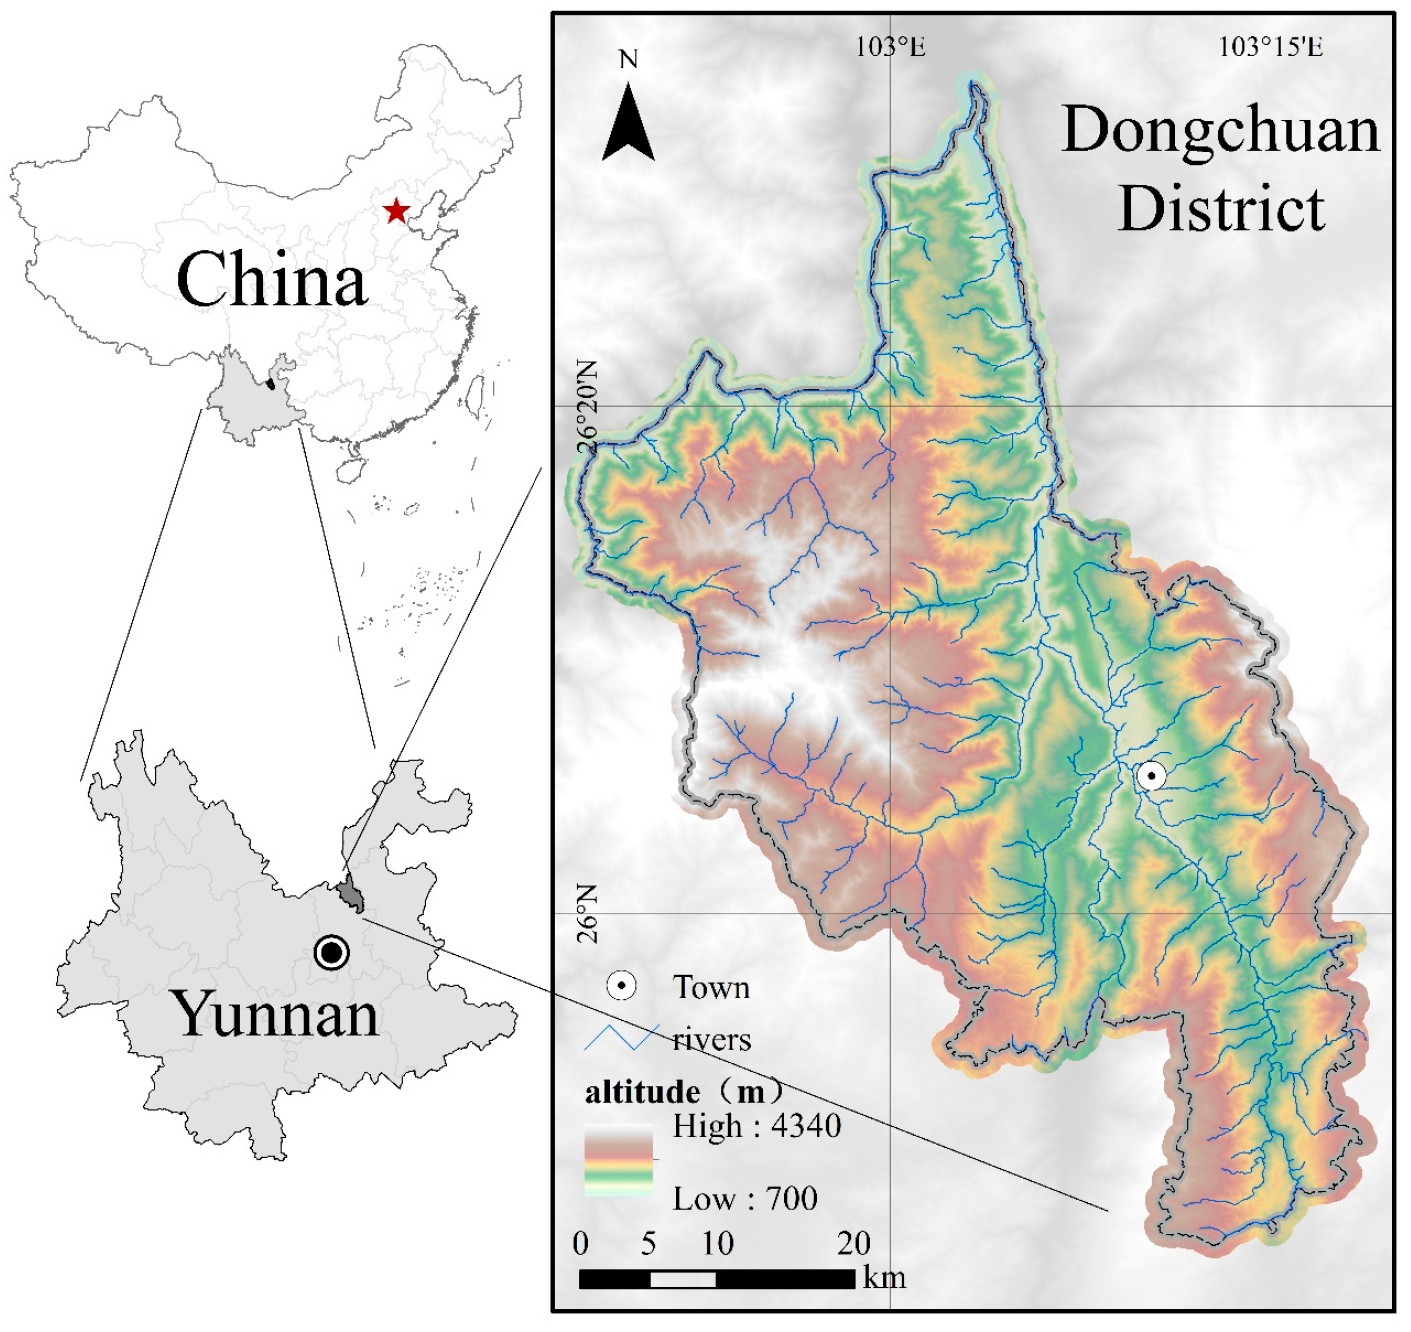
Dongchuan District, located in Kunming City, is part of the Wumeng Mountains in the Yunnan–Guizhou Plateau (Figure 2). The area is characterized by its rugged terrain, with high mountains, deep valleys, and steep slopes. The highest elevation reaches 4340 m, while the lowest point is 700 m above sea level. Approximately 55.5% of the total area consists of steep slopes (>25°), leading to significant soil erosion and frequent geological disasters. The district experiences a subtropical monsoon climate, with a particular dry heat (dry warm) river valley effect [7]. The river system in the area is well developed, providing a relatively high total water resource of approximately 574 million m3. However, the utilization rate of these water resources is low, standing at only 13.4%. Due to the complexity of the mountainous terrains and the poor water quality (according to the 2020 Kunming Water Resources Bulletin and Kunming Dongchuan District Water Resources Comprehensive Utilization Planning Report), the river water is unsuitable for direct residential use. Given the limited presence of reservoirs and other water conservation facilities, groundwater serves as the main source of domestic water for rural residents in the area. Dongchuan District boasts 268 available groundwater springs, some of which have been utilized as rural communities’ main domestic water sources (according to the Kunming Groundwater Resource Plan).
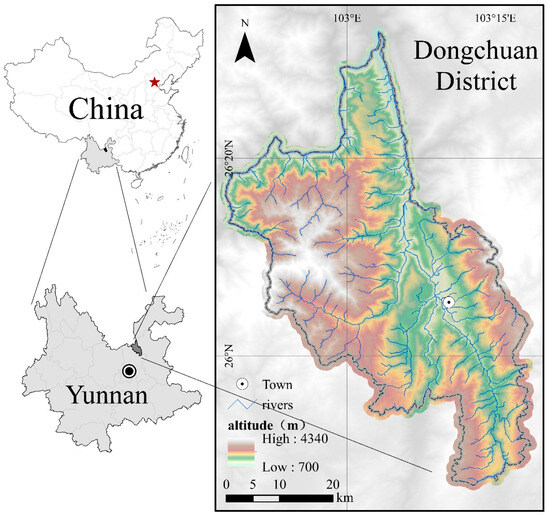
Figure 2.
Location of Dongchuan District. The star in figure represents Beijing, the capital of China.
Dongchuan District has a total resident population of 241,000, with 43.7% living in rural areas (Kunming Dongchuan District 2020 National Economic and Social Development Statistics Bulletin). The district covers a land area of 1858.79 km2. Based on a preliminary questionnaire survey, 74% of rural residents reported experiencing water scarcity for domestic use during drought from 2009 to 2013 [7]. In 2023, the spring drought in northern, central, and eastern Yunnan Province was more severe than usual. Despite gradual improvements in water facility construction in rural areas, there remains a lack of effective methods to evaluate water security in mountainous terrains. This gap poses challenges in implementing a targeted water management strategy to address the water security issues in the region.
2.2. The Flowchart of RWA Model
VSs are considered the fundamental units for water utilization. In the study area, rural residents always choose springs (underground water) as their main domestic water sources. When in drought, the main sources may not provide sufficient water. The residents could only use the stream (surrounding river) as their standby domestic water sources.
In this study, we obtained the discharge of each spring as the main water supply in flat- and low-water periods. The population of each VS was obtained to calculate a VS’s water demand by multiplying the residents’ average domestic water. Then, we used the least-cost path (LCP) method to estimate the supply–demand relation of VSs and their main or standby water resource when supply–demand was balanced or a water demand gap could be detected and calculated.
Due to the complex terrain in mountainous rural areas, the LCP method can also help residents better understand how to choose the most economical and reasonable water source (main or standby source). It should be noted that the length of the LCP from a VS to its corresponding water source can also characterize the difficulty in VS residents’ access to the water source, represented in this study as the water availability [24].
We evaluated the RWA grade of each VS by considering whether there was a water demand gap and determining the size of the gap, which made it possible to determine the water availability of the corresponding water sources to VSs. It should be noted that when the water supply of the main water source was short, the water availability of the standby water source to VSs was also included in the evaluation of water accessibility.
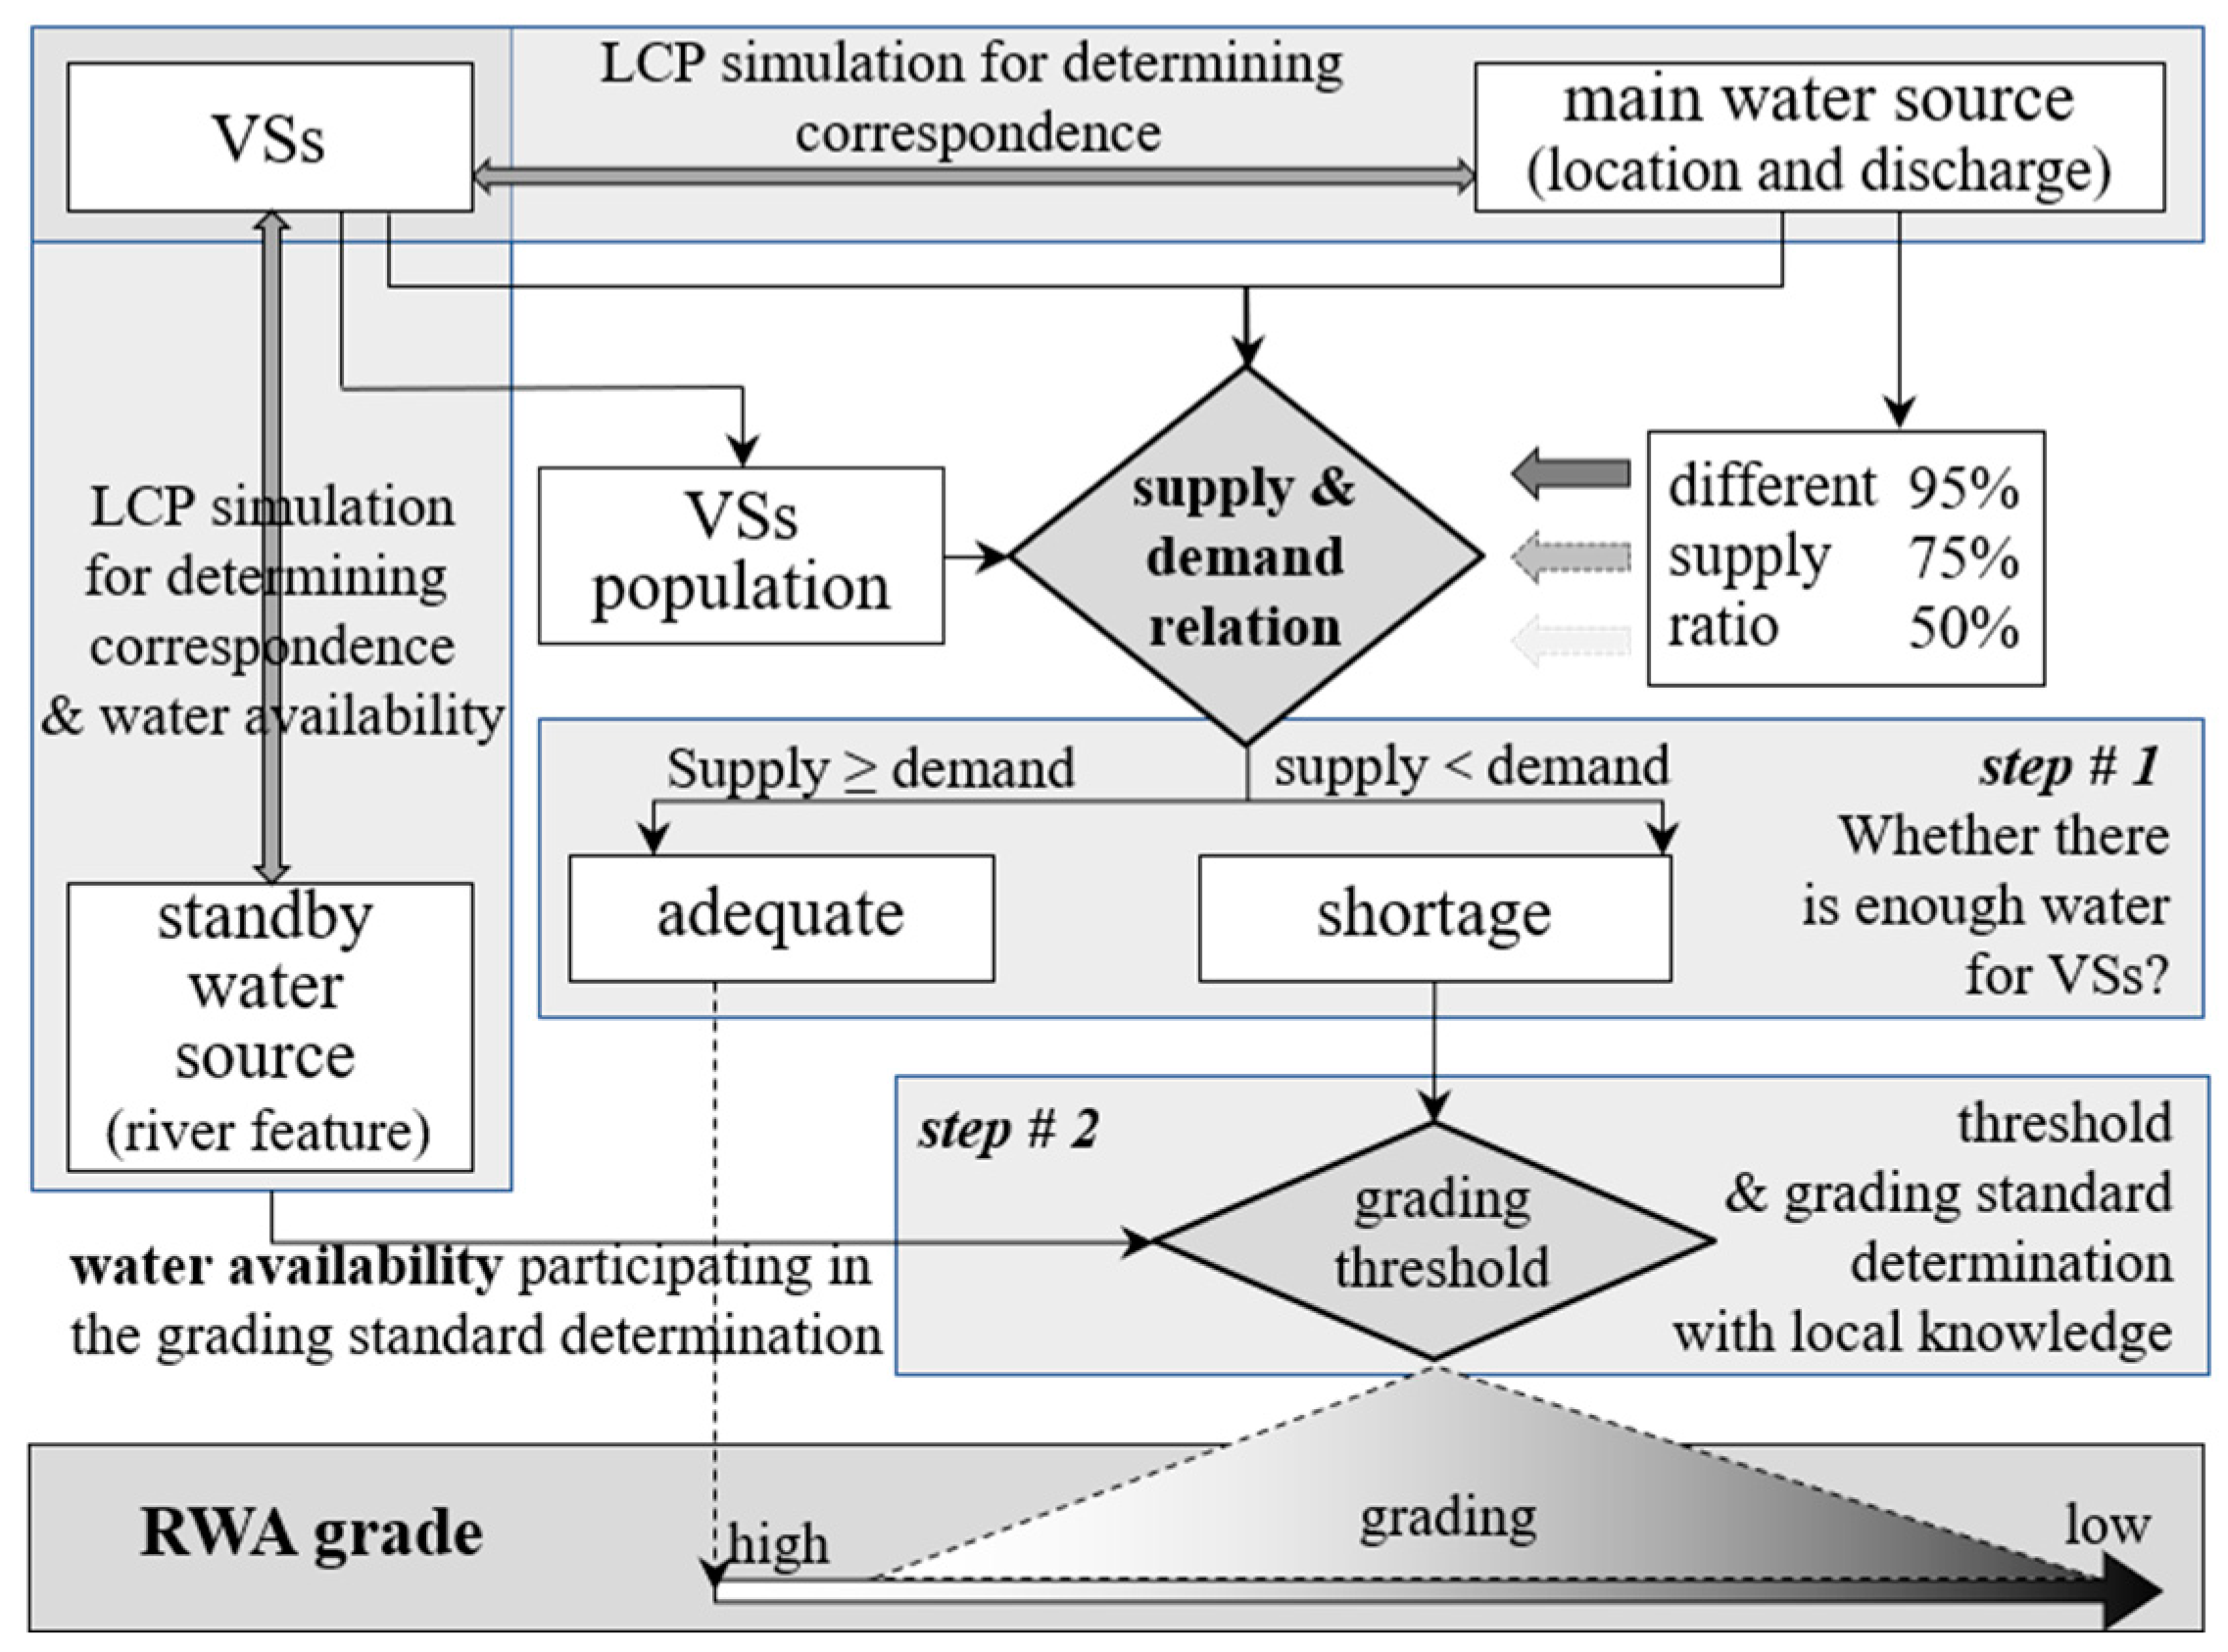
The flowchart of RWA model is as follows (Figure 3).
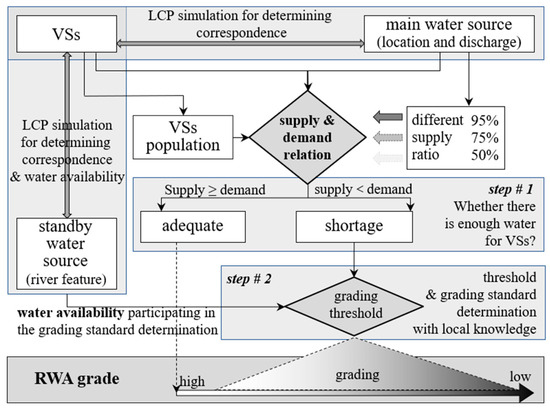
Figure 3.
RWA model technique flowchart.
To begin, we simulated the correspondence of VSs and their main water sources by calculating the LCP of the VS to its nearest available main water source. Next, we estimated the supply–demand balance of VSs and their corresponding main water source under different water supply ratios. This estimation considers the population size of VSs and the available water discharge of the main water source in a flat- or low-water period. If supply is adequate to demand, the VS has no water scarcity and would be evaluated as the highest RWA grade. If supply does not meet the demand, the water availability of the VSs and its standby water source, which is also determined by calculating the LCP from a VS to its nearest stream, would participate in evaluating the water accessibility of the VSs.
2.3. Dataset
All data used in this study were meticulously compiled and are presented in Table 1. To enhance the clarity of our methodology, we utilized Digital Elevation Model data with a spatial resolution of 30 m. Considering that Dongchuan District covers a land area of 1858.79 km2, this resolution is deemed sufficient for the requirements of our study.

Table 1.
The datasets used in this study.
2.4. Methods
2.4.1. The Supply–Demand Relation Detection
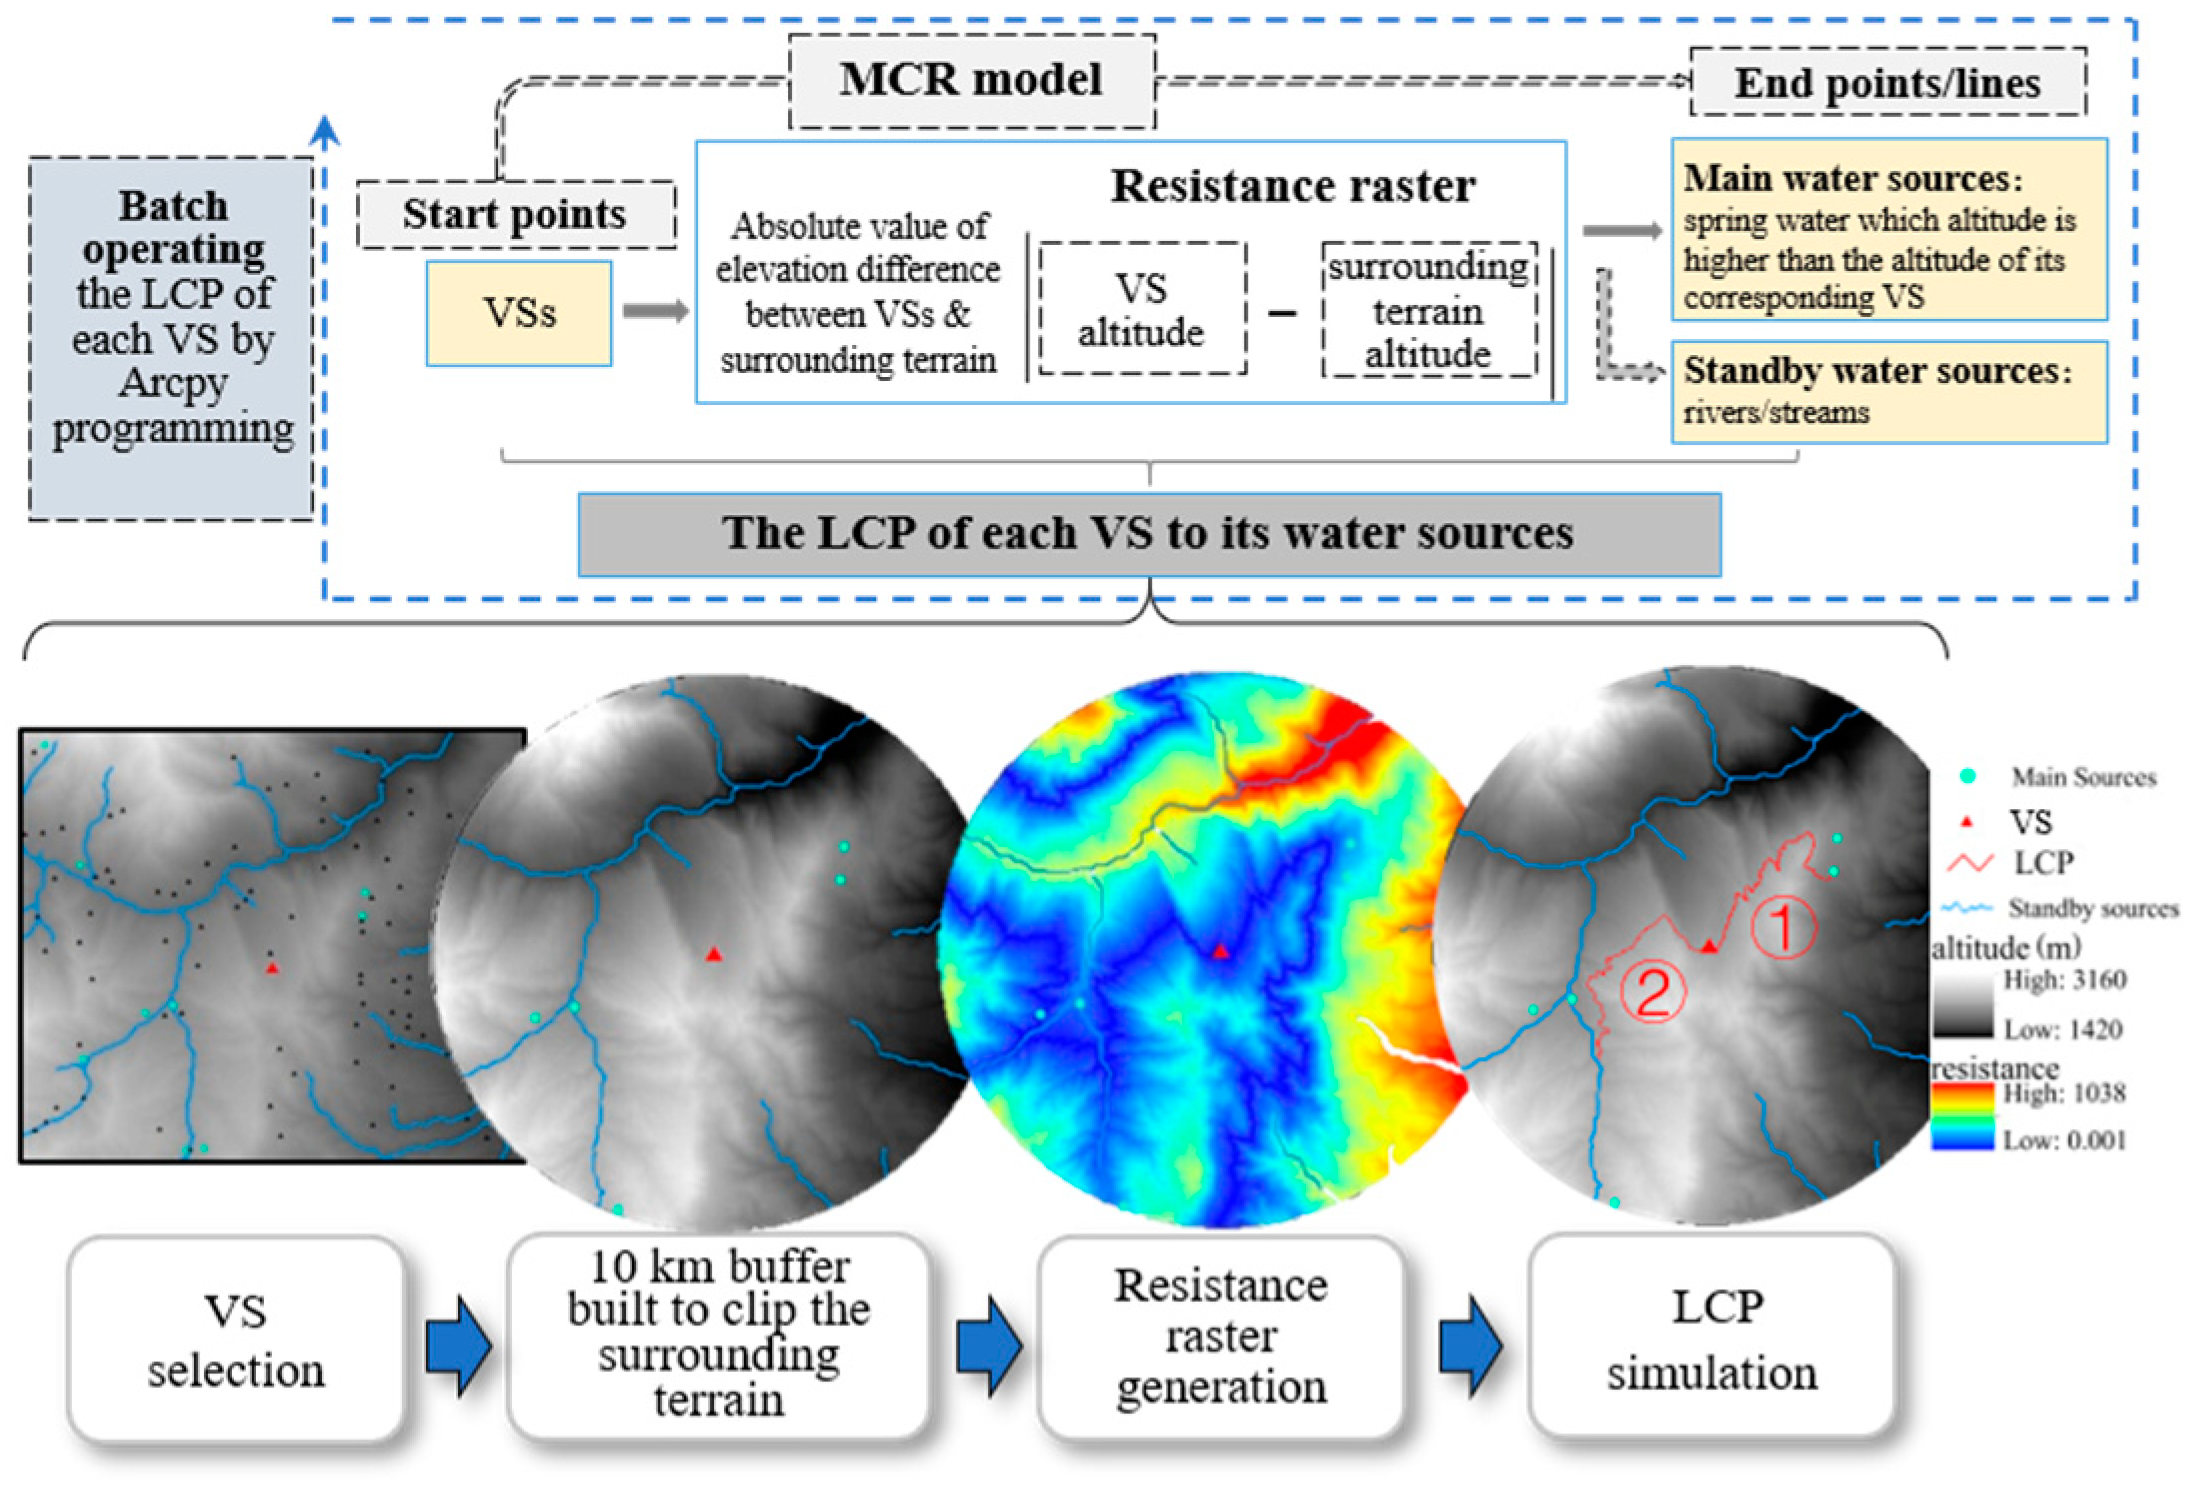
The LCP model [25,26,27] was used to indicate the correspondence between VS and its main water sources. It was the fundamental method of detecting the supply–demand relation between VSs and their main water sources. The LCP of the VSs to their corresponding water source was obtained through batch calculations for all VSs in Dongchuan District, using the Cost Distance module in ArcGIS 10.6 combined with ArcPy (Figure 4).
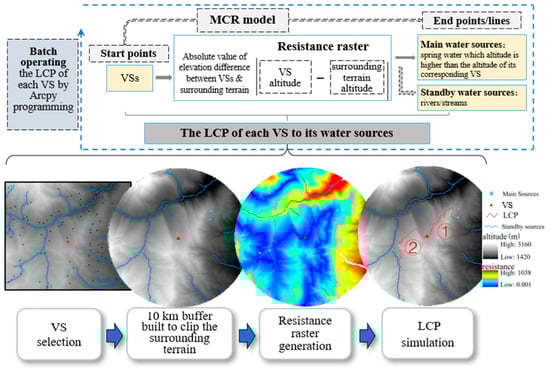
Figure 4.
The LCP simulation procedure of the VSs to their water source. ① is the LCP of the VS to the main water source; ② is the LCP of the VS to the standby water source.
- The procedure of LCP simulation
Firstly, a VS was chosen, and a 10 km circle buffer was generated to extract the surrounding terrain of the corresponding VS. The main or standby water sources in this circle would be the candidate water sources of the corresponding VS. Then, the resistance raster was generated to modulate the energy expenditure of individual movements in mountainous terrain. Next, with the Cost Distance module in ArcGIS, the LCP of the VS to its main or standby water source would be simulated. Last, the batch program was executed to loop all the VSs in the study area to obtain the LCP of all VSs (Figure 4, the below part).
- Resistance raster establishment for LCP
Resistance raster establishment is the core of the LCP simulation. It determined the accuracy of the simulation of an individual’s access to water resources. Considering the energy expenditure of individual movements in mountainous terrain, both going uphill or downhill would take more energy than going flat, as the individual must go back to VS when the water was obtained. So, in this study, we used the absolute value of elevation difference between VSs and the surrounding terrain as the resistance raster (Figure 4, the above part).
- Candidate main/standby water sources
The VS individuals usually established relatively well-developed (e.g., fixed canals) or simple (pipes) water transfer facilities [28]. These facilities used the water potential energy to deliver domestic water. Therefore, in this study, only the springs with a higher elevation than the corresponding VS would be chosen as the candidate main water source. It helps to improve the authenticity of the simulation.
To cover all water sources around the VSs, we specifically set the range of candidate standby water sources to be rivers and streams within a 10 km radius of the corresponding village. This design considers that residents need to fetch water by going downhill to the riverside and going back to the VS when finishing on foot [17], while maintaining a certain degree of spatial redundancy to ensure the effective operation of the model.
2.4.2. The Water Demand Gap Estimation
In this study, we used the discharge volume of the main water source (the 3rd dataset shown in Table 1) in a flat- or low-water period (Figure 5b,c) to represent the supply side.
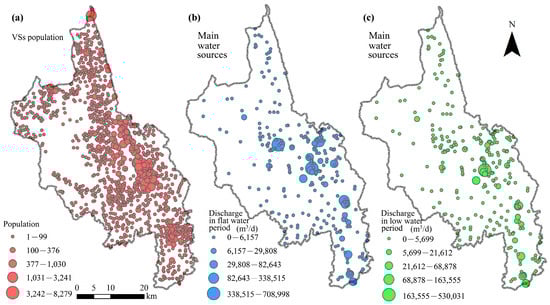
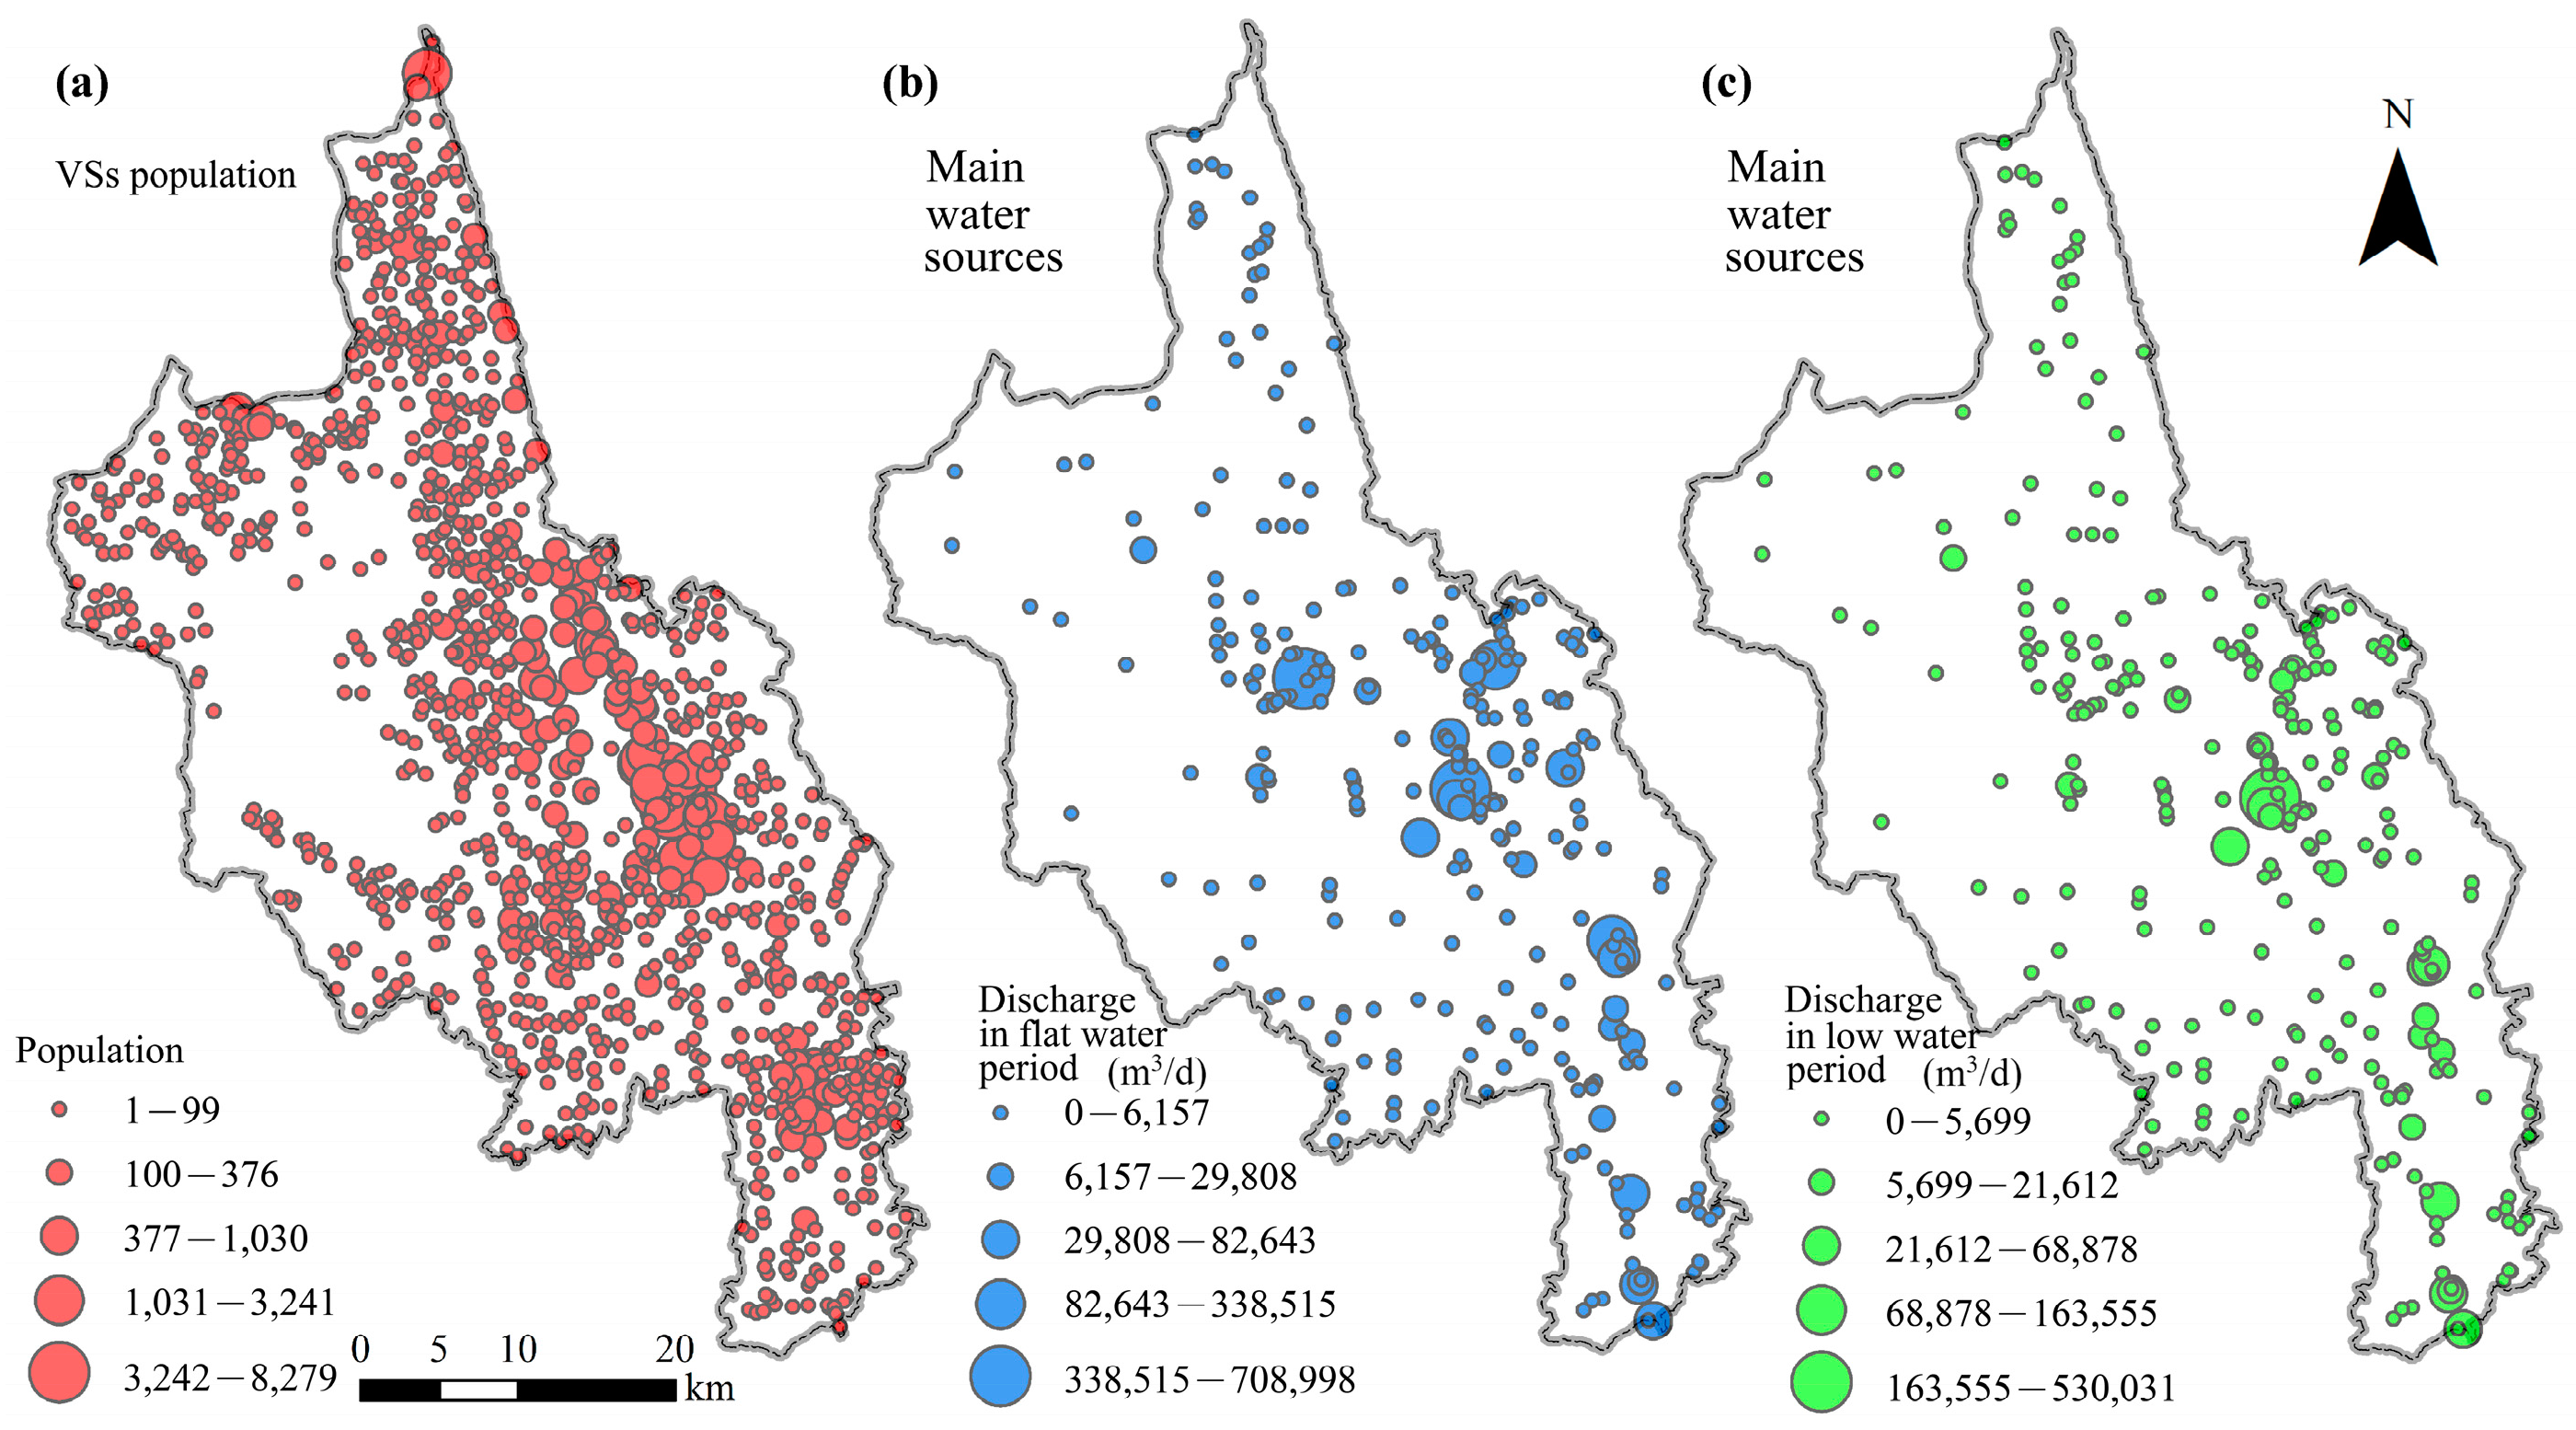
Figure 5.
Population of the VSs (a) and discharges of the main water sources in flat-water period (b) and low-water period (c).
We used the population density (the 5th dataset shown in Table 1) and the construction land area (the 6th dataset shown in Table 1) of each VS to determine the population size of each VS (Figure 5a). Then, we determined the demand side with the population size of each VS and the per-capita domestic water consumption of 0.11 m3/d (this dataset is referred from the rural water utilization of Kunming, 2019 Yunnan Provincial Water Resources Bulletin).
We also set up three water supply ratios of 95%, 75%, and 50% to calculate the difference in demand gap between the VS of the main water sources under these supply conditions (Figure 3).
2.4.3. Water Availability
Water availability represents the difficulty VSs face with water requirements. The longer the LCP between VSs and their water source in the complex mountain environment, the lower the water availability, which strongly contributes to the grading of RWA.
2.4.4. Grading the RWA
Under normal conditions, there is a one-to-many relationship between one spring as a domestic water source and many VSs that take it as their main water source. If the main water resource can meet these corresponding VSs’ needs in both flat- and low-water periods, these VSs have no water scarcity and the highest water accessibility (Figure 3).
If the main water resource is not able to meet all the needs of these corresponding VSs in flat- or low-water periods, then the size of the demand gap and the water availability of the standby water source to the VSs were used to determine their RWA grades (Figure 3).
The RWA grades in Dongchuan District are shown in Table 2. We set the demand gap threshold to 30 m3/d and the water availability threshold to 3 km, according to the actual water demand characteristics of VSs in Dongchuan District. The RWA grade was divided into seven grades; the greater the value, the higher the RWA.
Table 2.
The RWA grade in Dongchuan District.
3. Results
3.1. Demand Gap of VSs under Different Supply Ratios
On the demand side, there are large population size differences of VSs. VSs with large populations are mainly concentrated in the small plains near the administrative center of Dongchuan District (Figure 5a, Table 3). On the supply side, the main water sources that can supply water are 209 in the flat-water period and 208 in the low-water period. The main water sources with large discharge are mainly distributed in the south-central part of Dongchuan, while in the northwest and southwest, the main water sources are sparsely distributed and have relatively small amounts of discharge. Both main water sources and VSs have firm spatial heterogeneity.
Table 3.
Statistical characteristics of VS–main water sources (population unit: per, water unit: m3/d, proportion: %).
According to Table 3, it is evident that the total supply of main water sources significantly exceeds the total demand of VSs in both flat- and low-water periods. However, due to the spatial heterogeneity of the unequal distribution of water resources, the supply of some main water sources exceeds the demand, while some VSs have a demand gap; especially, a small number of VSs have a large demand gap, as depicted in Table S1 (see Supplementary Material). Furthermore, as indicated in Table S1, under a 50% water supply ratio during the flat-water period, 57 main water sources had insufficient water supply, resulting in water scarcity for 407 VSs. Similarly, under a 50% water supply ratio, 68 main water sources experienced inadequate water supply during the low-water period, leading to water scarcity for 525 VSs.
Table S1 presents the VSs’ water demand shortfalls of the main water sources under various supply ratio conditions. During the flat-water period, under the three supply ratios, the numbers of main water sources with demand shortfalls more outstanding than 100 m3/d were 10 (95%), 10 (75%), and 12 (50%), corresponding to 92 (95%), 107 (75%), and 107 (50%) VSs, respectively. Additionally, the number of main water sources with water demand gaps less than 30 m3/d were 23 (95%), 23 (75%), and 25 (50%), corresponding to 131 (95%), 132 (75%), and 130 (50%) VSs, respectively. In low-water period, the number of main water sources with demand shortfalls more outstanding than 100 m3/d were 12 (95%), 12 (75%), and 12 (50%), corresponding to 107 (95%), 107 (75%), and 107 (50%) VSs, respectively. Furthermore, the number of main water sources with water demand gaps less than 30 m3/d were 27 (95%), 31 (75%), and 37 (50%), corresponding to 118 (95%), 132 (75%), and 193 (50%) VSs, respectively.
These observations indicate that the differences in supply proportions do not significantly contribute to the variations in VSs’ water scarcity. Instead, it appears that VSs with a larger demand gap (>100 m3/d) experience relatively stable water scarcity across different supply ratio conditions. Conversely, VSs with more minor water demand shortfalls (<30 m3/d) are more susceptible to changes in the supply ratio, especially under extreme drought conditions.
Moreover, the previous survey observed that when multiple VSs shared a main water source, an upstream–downstream relation existed in water usage if the water source was inadequately supplied (data in column 7 of Table S1 in Supplementary Material). Specifically, VSs with a higher water availability of the main water source were given priority in utilizing it. On the other hand, VSs with a lower water availability of the main water source were more likely to face water scarcity in the case of insufficient water supply. Therefore, by examining the data in column 7 of Table S1, which shows the identity number of VSs corresponding to each main water source (arranged in order of the distance from their main water sources, based on their water availability, indicating the upstream–downstream relation of water use), we can determine the sequence of VS water scarcity associated with a particular main water source in the event of water supply insufficiency. During the actual investigation in existing studies, it was also noted that when multiple VSs relied on a shared main water source, those situated downstream were more susceptible to water scarcity situations [29,30].
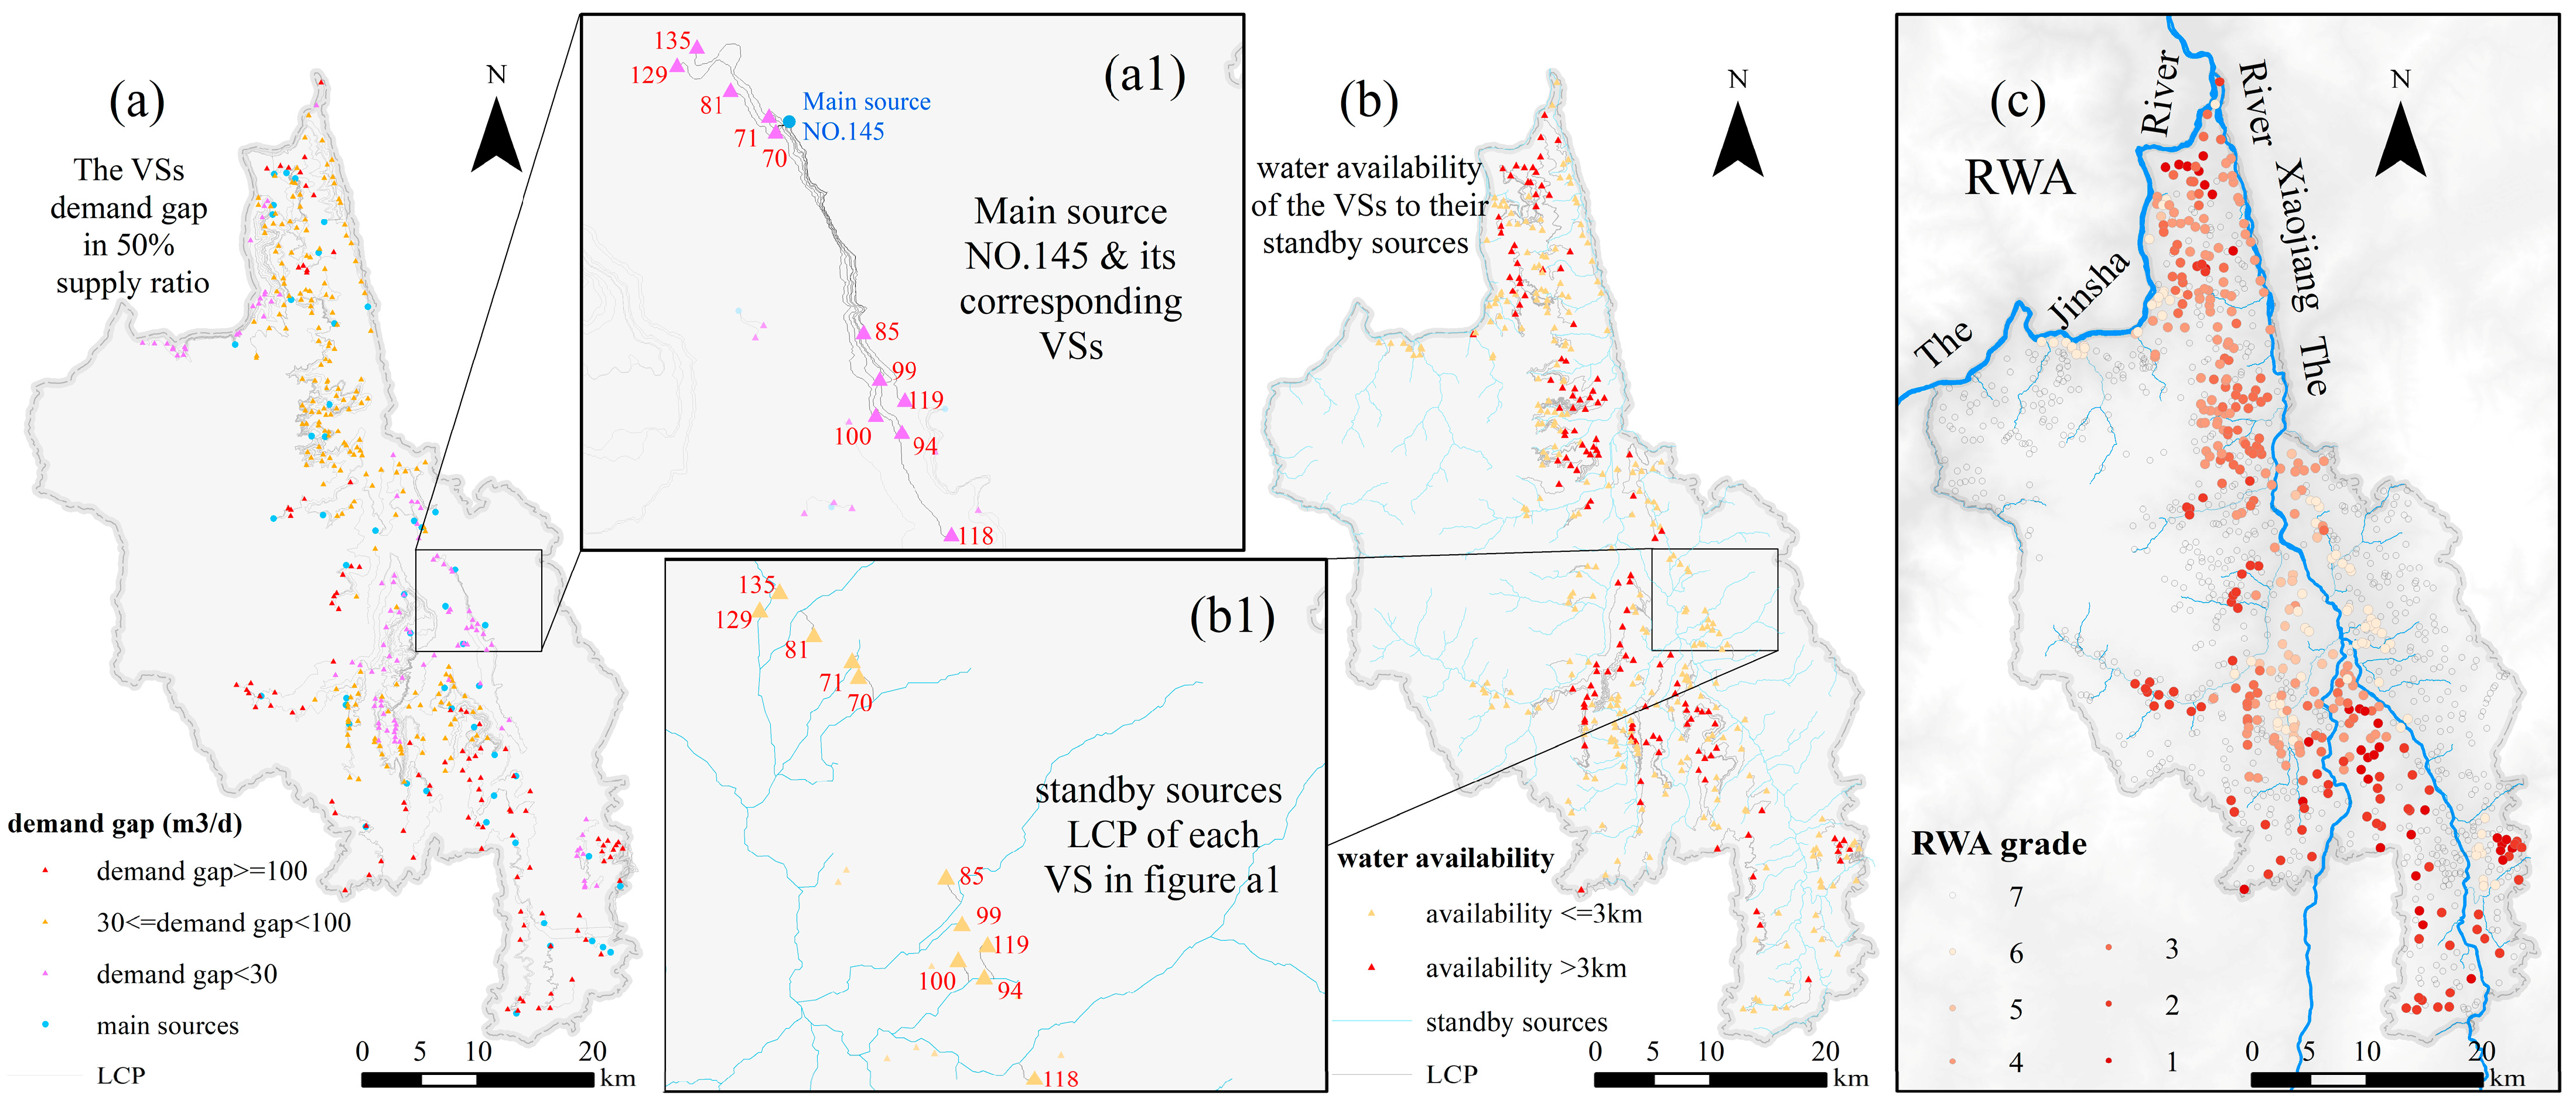
Figure 6a illustrates the demand gap of VSs to its main water source. Figure 6(a1) provides a magnified view of the local features from Figure 6a, focusing on main water source No. 145, which experiences significant water scarcity and corresponds to a larger number of VSs. This example highlights the location of main water source No. 145 and its connection with 11 VSs. It also features the LCP of the VSs to their main water source. As depicted in the figure, the LCP features exhibit a curved pattern, effectively capturing the variations in resistance induced by the surrounding terrain (e.g., the two VSs, No. 129 and 135). These variations in resistance are consistent with the inherent characteristics of mountainous rural environments.
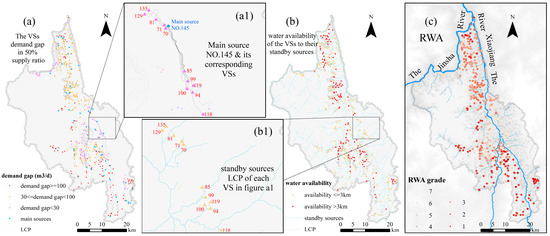
Figure 6.
The RWA grade of VSs in flat-water period. (a) The VSs demand gap in 50% supply ratio. (a1) Main source NO.145 & its corresponding VSs. (b) Water availability of the VSs to their standby sources. (b1) Standby sources LCP of each VS in figure (a1). (c) The RWA grade of VSs in flat-water period.
3.2. Water Availability of Standby Water Sources to VSs
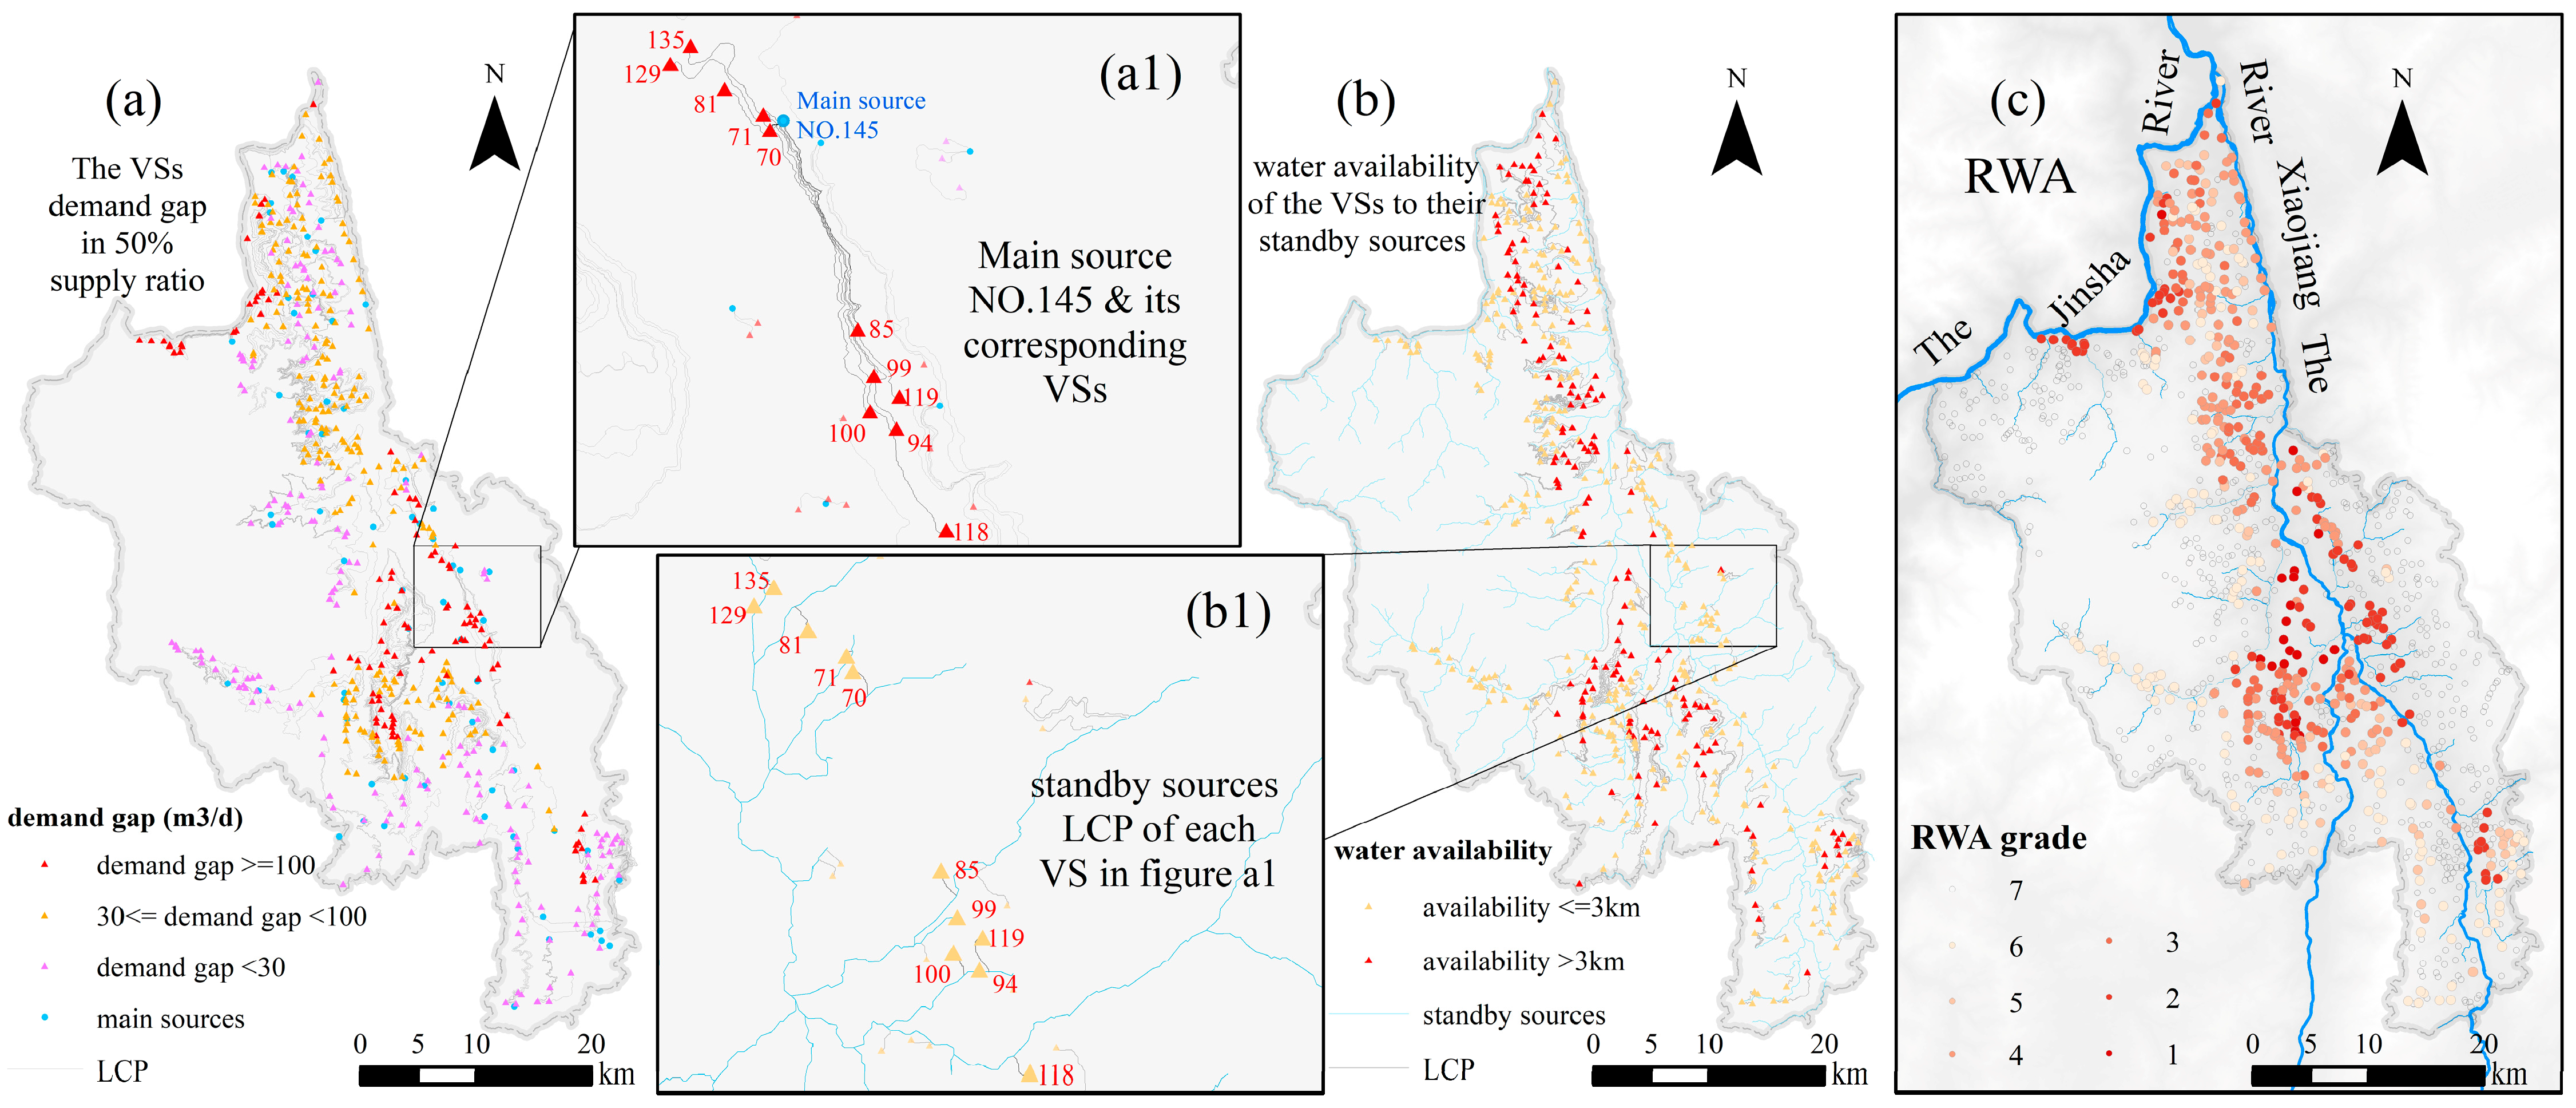
During extreme climatic conditions, particularly extreme drought, the main water supply source may become insufficient, prompting VSs to seek standby water sources for their water needs. The difficulty of obtaining water is affected directly by the distance required to access standby sources. In this study, we simulated the LCPs of VSs to their standby water sources to represent the water availability of the standby water sources to VSs. Figure 6b and Figure 7b display these LCP simulations, revealing that some VSs have a weak water availability of their standby water sources. As depicted in Figure 6(b1) (a zoomed-in schematic of the local area presented in Figure 6b), the spatial location corresponds to that of Figure 6(a1). Here, we can observe that the 11 VSs associated with main water source No. 145 have relatively short LCPs, which means that these VSs had a relatively strong water availability of their standby water sources.
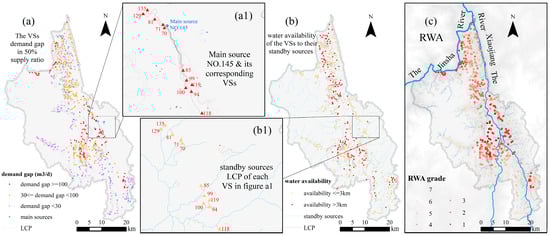
Figure 7.
The RWA grade of VSs in low-water period. (a) The VSs demand gap in 50% supply ratio. (a1) Main source NO.145 & its corresponding VSs. (b) Water availability of the VSs to their standby sources. (b1) Standby sources LCP of each VS in figure (a1). (c) The RWA grade of VSs in low-water period.
3.3. RWA of VSs
According to the grading rules listed in Table 2, this study categorizes RWA in Dongchuan District into seven grades, as shown in Table 4. VSs with RWA grade 7 can rely on their main water source to satisfy their domestic water needs, even if the supply ratio of the main water source is 50%. VSs with RWA grade 6 can obtain standby water sources through shorter distances even though a small water demand gap from the main water source under the supply ratio is 50%. VSs with RWA grade 5 have a small water demand gap with a 50% supply from the main water source. Still, they have a lower water availability of their standby water sources, meaning these VSs may face a particular risk of water scarcity. VSs with RWA grade 4 have a significant risk of water scarcity but higher water availability of their standby water sources. VSs with RWA grade 3 are at greater risk of water scarcity, and the water availability of their standby water sources is relatively low. VSs with RWA grade 2 have an even increased risk of water scarcity but relatively high availability of their standby water sources. VSs with RWA grade 1 have the most significant risk of water scarcity and a lower water availability of their standby water sources.
Table 4.
Number of VSs under each RWA grade in Dongchuan District.
As shown in Figure 6c and Figure 7c, during the flat-water period, the total number of VSs with RWA grades of 3, 2, and 1 is 182, accounting for 15.7% of the total number of VSs. Similarly, during the low-water period, the total number of VSs with RWA grades of 3, 2, and 1 is 184, accounting for 15.8% of the total number of VSs. These VSs are primarily concentrated near the Xiaojiang River (and its main tributaries) and the Jinsha River valley, aligning more closely with the fact in Dongchuan District. The Xiaojiang River and Jinsha River are major geological fault zones, resulting in deep river valleys with limited available water resources. Additionally, the steep and high slopes of the terrain make passage difficult, and this region is also susceptible to geologic disasters. As a result, the RWA grades of the VSs in these areas reflect the challenges posed by the natural environment in Dongchuan District.
There was some spatial differentiation of the RWA between the two water periods (Figure 6c and Figure 7c). In the flat-water period, VSs with lower RWA grades were more evenly distributed in the Xiaojiang River valley, whereas those residing near the Dongchuan urban area had higher RWA grades (Figure 6c). Conversely, in the low-water period, VSs with lower RWA grades were concentrated in the Dongchuan urban area and the middle and lower reaches of the Xiaojiang River.
To verify our proposed RWA model, we conducted a survey to collect accurate data from the residents. This survey will help us in directly assessing the model’s performance by gathering firsthand information on water usage patterns, preferences, and accessibility. The collected data will serve as a practical benchmark to validate the model’s predictions and ensure its relevance to the community’s water resource needs. Out of the 80 villages revisited, 66 villages met the RWA grading standards, and the degree of fit between the water shortage situation and the model simulation results reached 82.5%, indicating a high degree of consistency between our model and the actual situation. The proportion of villages with significant deviations was 10%, reflecting that the model may require further adjustments in specific scenarios.
4. Discussion
4.1. Accurate Assessment and Strategic Support of Rural Water Security
Considering the water security from the VSs’ perspective offers the advantage of gaining insights into the specific water requirements of each VS and whether their corresponding water sources can provide an ample supply. Additionally, by combining the supply–demand relationship into the RWA model, a comprehensive representation of the water challenges faced by VSs in mountainous rural areas can be achieved [31,32,33]. Relying solely on regional-scale data and indicators to evaluate the water security characteristics of a given region would fail to diagnose these issues [34,35]. In addition, this perspective allows for a closer representation of the actual water access process experienced by VSs, making the research method more realistic. Moreover, the resistance grid simulation, based on relative height differences, aligns closely with the environmental characteristics of mountainous villages [36]. This simulation method better reflects the VS’s water access paths, capturing the complexities and challenges faced in these terrains. VSs serve as the fundamental part of China’s population and play a crucial role in rural and infrastructure planning. Therefore, simulating the RWA of each VS within the region holds significant importance for the rational allocation of water sources in planning endeavors. By simulating the RWA of each VS, this study offers valuable insights for informed decision making and efficient resource allocation in planning efforts.
This study also considered the upstream–downstream sequence of the multiple usages of the main water source when VSs shared the same main water source (data represented in column 7 of Table S1). It was the case that a VS with a lower main water source water availability experienced insufficient water supply, as the water of the corresponding main water resource was used up by upstream VSs during drought. Therefore, the sequence analysis can guide the identification of VSs with main water resource scarcity during drought, especially in sensitive areas where climate change often leads to increased drought levels.
The supply–demand relation remains a fundamental consideration in the rational allocation and utilization of water resources [37]. However, if the RWA of each location is extrapolated solely from the perspective of water sources, the specific needs and characteristics of VS water users are often overlooked [38]. Hence, to address water security more comprehensively, we consider not only water availability but also population size, which to some extent reflects rural dimensions, thereby yielding a more accurate estimate of water demand. Furthermore, our analysis is accurate to the village scale rather than limited to the level of specific regions. This method accurately simulates RWA for each rural water user at the village scale and offers water management decision support at the region level using geostatistics and other techniques (Figure 8). Due to the spatial distribution characteristics of VSs, it can generate more accurate spatial interpolated data [7]. Fig. C8 displays the spatial heterogeneity of RWA in Dongchuan using the universal kriging interpolation with the RWA grade of all VSs in two water periods. It shows the difference in RWA characteristics of different rural townships in Dongchuan District, which plays a vital role in guiding the water management strategies of different administrative regions.
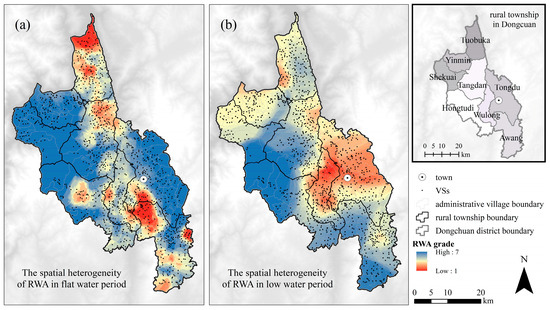
Figure 8.
The spatial heterogeneity of RWA in Dongchuan. (a) The spatial heterogeneity of RWA in flat water period. (b) The spatial heterogeneity of RWA in low water period.
4.2. Water Scarcity Prevention and Control in Rural Areas under Extreme Drought
The water availability of the water sources to VSs is considered in this study. It ensures reasonable and efficient water management measures, especially when it becomes evident which villages are susceptible to water scarcity during extreme drought disasters [39]. As a result, it significantly enhances the accuracy of water security regulation and risk management in mountainous rural areas.
The reoccurrence of significant drought in northeastern Yunnan in 2023 has brought the issue of rural water security in this region to the forefront [40,41]. The utilization of standby water sources, as presented in this study, is a necessary survival strategy to cope with the risks posed by such extreme conditions. The water management department can employ a targeted water scarcity risk contingency plan based on this study to address the increased water scarcity risks resulting from extreme climate events. It will enhance VSs’ ability to withstand water scarcity risks and significantly improve management efficiency.
4.3. Uncertainty of the Measurement
The simulation idea of this study is that the VSs preferentially choose the main water source with the smallest LCP, and when the main water source is insufficient, they will choose the standby water source [42]. However, it is not excluded that when the supply of the main water source is not able to meet the demand of the VSs, the VSs may choose other readily available main water sources according to their understanding of the surrounding water resources [42], which is one of the solutions to the risk of water scarcity. This is the most significant uncertainty in the current approach used in this study. Especially, when the overall water supply in the study area is much greater than the overall demand, the core problem of water scarcity caused by the spatial heterogeneity of the water resource distribution is the rational allocation and effective transportation of water resources [43,44]. However, weak water supply infrastructure is the main bottleneck limiting the solution of these problems.
Meanwhile, considering the weak infrastructure and complex terrain in Dongchuan [7], the VS–main water source correspondence for cases where “supply exceeds demand” was partially overlooked [45], making the analysis of the main water source with abundant water resources insufficient.
In addition, this study did not consider the role of water supply facilities such as small water cellars in rural areas. Such facilities do exist in Dongchuan and play a positive role in reducing the risk of water scarcity. Detailed field investigations of small water cellars can improve the understanding of VSs’ risk prevention and control ability regarding water scarcity, as well as improve the accuracy of the model used in this study. In particular, there are obvious differences in human–land relationships (land use and settlement patterns) in transitional geospatial villages, and it is more necessary to take targeted measures to ensure water security.
5. Conclusions
The RWA is a comprehensive model to evaluate the water security level of each VS in rural areas with a keen focus on sustainable water management. From the perspective of the VSs, it not only considers the supply–demand relation of VSs and their main water resources, but also involves the water availability of the standby water resource to VSs. With this model, water managers can gain insight into the RWA grade of each VS in the management area and develop accurate water replenishment and emergency plans through quantified water demand gap analysis, thereby improving the risk response capacity of each VS with low RWA.
The water availability of the standby water resource to VSs can indicate the difficulty of VSs in accessing their standby water sources in complex mountainous terrain if the main water source cannot meet the needs of the corresponding VSs. The method can provide a good guideline for carrying out targeted emergency rescue in VSs with low RWA grades when drought occurs.
Moreover, identifying vulnerable sites with scarce water resources during droughts requires analyzing the upstream–downstream sequence of water sources. Consequently, the method used in this study can support the sustainable rational allocation of water supply in rural planning.
The RWA grade of each VS can represent the current water security situation in the local space where the VS is located. It is a local water security indicator from the VSs’ perspective. However, summarizing the water security situation of all VSs, especially spatially, can express the spatial pattern characteristics of water security in the management area. That is the basic information needed to understand the regional water security situation from a macro-perspective, thereby contributing to the overarching goal of sustainable water management.
Supplementary Materials
The following supporting information can be downloaded at: https://www.mdpi.com/article/10.3390/su16114372/s1, Table S1: The main water sources with demand gaps in different water resources supply ratios and the characteristics of corresponding VSs.
Author Contributions
Conceptualization, J.L. and R.Q.; methodology, J.L. and R.Q.; software, R.Q.; validation, J.L. and W.D.; formal analysis, J.L.; investigation, L.L.; resources, J.L.; data curation, L.L.; writing—original draft preparation, J.L. and R.Q.; writing—review and editing, K.W., P.D. and K.Y.; visualization, J.L. and R.Q.; supervision, J.L.; project administration, J.L. and W.D.; funding acquisition, J.L. and W.D. All authors have read and agreed to the published version of the manuscript.
Funding
This work was supported by the National Natural Science Foundation of China (No: 41930651), the Humanities and Social Sciences Youth Foundation, the Ministry of Education of the People’s Republic of China (Western and Border Areas Project) (No. 20XJAZH005), and the Special Project for Basic Research in Yunnan Province (Key Project) (No. 202001BB050073).
Institutional Review Board Statement
Not applicable.
Informed Consent Statement
Not applicable.
Data Availability Statement
The data presented in this study are available on request from the corresponding author.
Conflicts of Interest
The authors declare that they have no known competing financial interests or personal relationships that could have appeared to influence the work reported in this paper.
References
- Dolan, F.; Lamontagne, J.; Link, R.; Hejazi, M.; Reed, P.; Edmonds, J. Evaluating the Economic Impact of Water Scarcity in a Changing World. Nat. Commun. 2021, 12, 1915. [Google Scholar] [CrossRef]
- Liu, J.; Yang, H.; Gosling, S.N.; Kummu, M.; Flörke, M.; Pfister, S.; Hanasaki, N.; Wada, Y.; Zhang, X.; Zheng, C. Water Scarcity Assessments in the Past, Present, and Future. Earth’s Future 2017, 5, 545–559. [Google Scholar] [CrossRef] [PubMed]
- Yang, H.; Wright, J.A.; Gundry, S.W. Boost Water Safety in Rural China. Nature 2012, 484, 318. [Google Scholar] [CrossRef]
- Piao, S.; Ciais, P.; Huang, Y.; Shen, Z.; Peng, S.; Li, J.; Zhou, L.; Liu, H.; Ma, Y.; Ding, Y. The Impacts of Climate Change on Water Resources and Agriculture in China. Nature 2010, 467, 43–51. [Google Scholar] [CrossRef]
- Wang, Y.; Wang, Y.; Su, X.; Qi, L.; Liu, M. Evaluation of the Comprehensive Carrying Capacity of Interprovincial Water Resources in China and the Spatial Effect. J. Hydrol. 2019, 575, 794–809. [Google Scholar] [CrossRef]
- Drenkhan, F.; Buytaert, W.; Mackay, J.D.; Barrand, N.E.; Hannah, D.M.; Huggel, C. Looking beyond Glaciers to Understand Mountain Water Security. Nat. Sustain. 2023, 6, 130–138. [Google Scholar] [CrossRef]
- Li, J.; Deng, W.; Zhang, J. Evaluating Mountain Water Scarcity on the County Scale: A Case Study of Dongchuan District, Kunming, China. J. Mt. Sci. 2019, 16, 744–754. [Google Scholar] [CrossRef]
- Zhou, F.; Zhang, W.; Su, W.; Peng, H.; Zhou, S. Spatial Differentiation and Driving Mechanism of Rural Water Security in Typical “Engineering Water Depletion” of Karst Mountainous Area—A Lesson of Guizhou, China. Sci. Total Environ. 2021, 793, 148387. [Google Scholar] [CrossRef]
- Wang, W.; Zhao, X.; Cao, J.; Li, H.; Zhang, Q. Barriers and Requirements to Climate Change Adaptation of Mountainous Rural Communities in Developing Countries: The Case of the Eastern Qinghai-Tibetan Plateau of China. Land Use Policy 2020, 95, 104354. [Google Scholar] [CrossRef]
- Mengist, W.; Soromessa, T.; Legese, G. Ecosystem Services Research in Mountainous Regions: A Systematic Literature Review on Current Knowledge and Research Gaps. Sci. Total Environ. 2020, 702, 134581. [Google Scholar] [CrossRef]
- Chaudhary, S.; Tshering, D.; Phuntsho, T.; Uddin, K.; Shakya, B.; Chettri, N. Impact of Land Cover Change on a Mountain Ecosystem and Its Services: Case Study from the Phobjikha Valley, Bhutan. Ecosyst. Health Sustain. 2017, 3, 1393314. [Google Scholar] [CrossRef]
- Li, D.; Wu, S.; Liu, L.; Liang, Z.; Li, S. Evaluating Regional Water Security through a Freshwater Ecosystem Service Flow Model: A Case Study in Beijing-Tianjian-Hebei Region, China. Ecol. Indic. 2017, 81, 159–170. [Google Scholar] [CrossRef]
- Tu, Y.; Wang, H.; Zhou, X.; Shen, W.; Lev, B. Comprehensive Evaluation of Security, Equity, and Efficiency on Regional Water Resources Coordination Using a Hybrid Multi-Criteria Decision-Making Method with Different Hesitant Fuzzy Linguistic Term Sets. J. Clean. Prod. 2021, 310, 127447. [Google Scholar] [CrossRef]
- World Health Organization. Guidelines for Drinking-Water Quality: Incorporating the First and Second Addenda; World Health Organization: Geneva, Switzerland, 2022; ISBN 92-4-004506-6. [Google Scholar]
- Nie, R.; Tian, Z.; Wang, J.; Zhang, H.; Wang, T. Water Security Sustainability Evaluation: Applying a Multistage Decision Support Framework in Industrial Region. J. Clean. Prod. 2018, 196, 1681–1704. [Google Scholar] [CrossRef]
- Romero-Lankao, P.; Gnatz, D.M. Conceptualizing Urban Water Security in an Urbanizing World. Curr. Opin. Environ. Sustain. 2016, 21, 45–51. [Google Scholar] [CrossRef]
- Li, F.; Liu, H.; Chen, X.; Yu, D. Trivariate Copula Based Evaluation Model of Water Accessibility. Water Resour. Manag. 2019, 33, 3211–3225. [Google Scholar] [CrossRef]
- Li, H.; Fan, Y.; Gong, Z.; Zhou, D. Water Accessibility Assessment of Freshwater Wetlands in the Yellow River Delta National Nature Reserve, China. Ecohydrol. Hydrobiol. 2019, 20, 21–30. [Google Scholar] [CrossRef]
- Bross, L.; Krause, S.; Wannewitz, M.; Stock, E.; Sandholz, S.; Wienand, I. Insecure Security: Emergency Water Supply and Minimum Standards in Countries with a High Supply Reliability. Water 2019, 11, 732. [Google Scholar] [CrossRef]
- Berrouet, L.; Villegas-Palacio, C.; Botero, V. Vulnerability of Rural Communities to Change in an Ecosystem Service Provision: Surface Water Supply. A Case Study in the Northern Andes, Colombia. Land Use Policy 2020, 97, 104737. [Google Scholar] [CrossRef]
- Duan, Y.; Yan, L.; Lai, Z.; Chen, Q.; Sun, Y.; Zhang, L. The Spatial Form of Traditional Villages in Fuzhou Area of Jiangxi Province Determined via GIS Methods. Front. Earth Sci. 2022, 1–13. [Google Scholar] [CrossRef]
- Cheng, Q.; Gao, L.; Zhong, F.; Zuo, X.; Ma, M. Spatiotemporal Variations of Drought in the Yunnan-Guizhou Plateau, Southwest China, during 1960–2013 and Their Association with Large-Scale Circulations and Historical Records. Ecol. Indic. 2020, 112, 106041. [Google Scholar] [CrossRef]
- Meza, I.; Eyshi Rezaei, E.; Siebert, S.; Ghazaryan, G.; Nouri, H.; Dubovyk, O.; Gerdener, H.; Herbert, C.; Kusche, J.; Popat, E.; et al. Drought Risk for Agricultural Systems in South Africa: Drivers, Spatial Patterns, and Implications for Drought Risk Management. Sci. Total Environ. 2021, 799, 149505. [Google Scholar] [CrossRef] [PubMed]
- Balbi, M.; Petit, E.J.; Croci, S.; Nabucet, J.; Georges, R.; Madec, L.; Ernoult, A. Ecological Relevance of Least Cost Path Analysis: An Easy Implementation Method for Landscape Urban Planning. J. Environ. Manag. 2019, 244, 61–68. [Google Scholar] [CrossRef] [PubMed]
- Li, S.; Xiao, W.; Zhao, Y.; Lv, X. Incorporating Ecological Risk Index in the Multi-Process MCRE Model to Optimize the Ecological Security Pattern in a Semi-Arid Area with Intensive Coal Mining: A Case Study in Northern China. J. Clean. Prod. 2020, 247, 119143. [Google Scholar] [CrossRef]
- Davarpanah, A.; Vahidnia, M.H. Optimal Route Finding of Water Transmission Lines by Comparing Different MCDM Methods and the Least-Cost Path Algorithm in a Raster (Case Study: From Ardak to Mashhad). Water Resour. Eng. 2022, 14, 39–56. [Google Scholar]
- Yang, J.; Wan, Q.; Han, J.; Xing, S. An Evaluation Model for Automobile Intelligent Cockpit Comfort Based on Improved Combination Weighting-Cloud Model. PLoS ONE 2023, 18, e0282602. [Google Scholar] [CrossRef]
- Guo, S.; Lin, L.; Liu, S.; Wei, Y.; Xu, D.; Li, Q.; Su, S. Interactions between Sustainable Livelihood of Rural Household and Agricultural Land Transfer in the Mountainous and Hilly Regions of Sichuan, China. Sustain. Dev. 2019, 27, 725–742. [Google Scholar] [CrossRef]
- Li, J.; Yang, J.; Liu, M.; Ma, Z.; Fang, W.; Bi, J. Quality Matters: Pollution Exacerbates Water Scarcity and Sectoral Output Risks in China. Water Res. 2022, 224, 119059. [Google Scholar] [CrossRef] [PubMed]
- Yousef, S.F. Water Scarcity and Conflict between Upstream and Downstream Riparian Countries. Water Econ. Policy 2021, 7, 2150012. [Google Scholar] [CrossRef]
- An, M.; Fan, L.; Huang, J.; Yang, W.; Wu, H.; Wang, X.; Khanal, R. The Gap of Water Supply—Demand and Its Driving Factors: From Water Footprint View in Huaihe River Basin. PLoS ONE 2021, 16, e0247604. [Google Scholar] [CrossRef]
- Li, X.; Sun, W.; Zhang, D.; Huang, J.; Li, D.; Ding, N.; Zhu, J.; Xie, Y.; Wang, X. Evaluating Water Provision Service at the Sub-Watershed Scale by Combining Supply, Demand, and Spatial Flow. Ecol. Indic. 2021, 127, 107745. [Google Scholar] [CrossRef]
- Liu, G.; Fu, X.; Han, Q.; Huang, R.; Zhuang, T. Research on the Collaborative Governance of Urban Regeneration Based on a Bayesian Network: The Case of Chongqing. Land Use Policy 2021, 109, 105640. [Google Scholar] [CrossRef]
- Adams, E.A.; Zulu, L.; Ouellette-Kray, Q. Community Water Governance for Urban Water Security in the Global South: Status, Lessons, and Prospects. Wiley Interdiscip. Rev. Water 2020, 7, e1466. [Google Scholar] [CrossRef]
- Chawla, I.; Karthikeyan, L.; Mishra, A.K. A Review of Remote Sensing Applications for Water Security: Quantity, Quality, and Extremes. J. Hydrol. 2020, 585, 124826. [Google Scholar] [CrossRef]
- Lievens, H.; Demuzere, M.; Marshall, H.-P.; Reichle, R.H.; Brucker, L.; Brangers, I.; de Rosnay, P.; Dumont, M.; Girotto, M.; Immerzeel, W.W. Snow Depth Variability in the Northern Hemisphere Mountains Observed from Space. Nat. Commun. 2019, 10, 4629. [Google Scholar] [CrossRef] [PubMed]
- Heidari, H.; Arabi, M.; Warziniack, T. Vulnerability to Water Shortage under Current and Future Water Supply-Demand Conditions across US River Basins. Earth’s Future 2021, 9, e2021EF002278. [Google Scholar] [CrossRef]
- Balaei, B.; Noy, I.; Wilkinson, S.; Potangaroa, R. Economic Factors Affecting Water Supply Resilience to Disasters. Socio-Econ. Plan. Sci. 2021, 76, 100961. [Google Scholar] [CrossRef]
- Mishra, B.K.; Kumar, P.; Saraswat, C.; Chakraborty, S.; Gautam, A. Water Security in a Changing Environment: Concept, Challenges and Solutions. Water 2021, 13, 490. [Google Scholar] [CrossRef]
- He, J.; Li, Y.; Li, X.; Huang, J. Temporal and spatial characteristics of droughts over Yunnan Province during 1961–2012. Mt. Res. 2016, 34, 19–27. [Google Scholar]
- Wang, X.; Zhang, L.; Wang, F. Feasibility study of five drought indices for use in Yunnan Province. J. Irrig. Drain. 2017, 36, 117–124. [Google Scholar]
- Yu, Y.; Chen, X.; Wang, Y.; Mao, J.; Ding, Z.; Lu, Y.; Wang, X.; Lian, X.; Shi, Y. Producing and Storing Self-Sustaining Drinking Water from Rainwater for Emergency Response on Isolated Island. Sci. Total Environ. 2021, 768, 144513. [Google Scholar] [CrossRef] [PubMed]
- Wang, H.; Huang, S.; Di, D.; Wang, Y.; Zhang, F. Study on the Spatial Distribution of Water Resource Value in the Agricultural System of the Yellow River Basin. Water Policy 2021, 23, 1044–1058. [Google Scholar] [CrossRef]
- Wu, Y.; Li, X.; Yu, L.; Wang, T.; Wang, J.; Liu, T. Review of Soil Heavy Metal Pollution in China: Spatial Distribution, Primary Sources, and Remediation Alternatives. Resour. Conserv. Recycl. 2022, 181, 106261. [Google Scholar] [CrossRef]
- Sun, S.; Zhou, X.; Liu, H.; Jiang, Y.; Zhou, H.; Zhang, C.; Fu, G. Unraveling the Effect of Inter-Basin Water Transfer on Reducing Water Scarcity and Its Inequality in China. Water Res. 2021, 194, 116931. [Google Scholar] [CrossRef] [PubMed]

Disclaimer/Publisher’s Note: The statements, opinions and data contained in all publications are solely those of the individual author(s) and contributor(s) and not of MDPI and/or the editor(s). MDPI and/or the editor(s) disclaim responsibility for any injury to people or property resulting from any ideas, methods, instructions or products referred to in the content. |
© 2024 by the authors. Licensee MDPI, Basel, Switzerland. This article is an open access article distributed under the terms and conditions of the Creative Commons Attribution (CC BY) license (https://creativecommons.org/licenses/by/4.0/).