1. Introduction
Shopping trips are considered one of society’s most essential non-working activities. However, outdoor shopping trips can lead to increased congestion in city centers, resulting in higher fuel consumption and emissions [
1]. The impact of shopping trips on road traffic congestion is even more pronounced on weekends and during holidays [
2]. Further, it has been reported that the use of private vehicles is higher for shopping trips compared to other trips [
3]. These trips cause several negative impacts, including traffic congestion, higher fuel consumption, noise pollution, air pollution, etc. Online shopping (e-shopping) can be a potential sustainable alternative that can replace some outdoor shopping trips [
4]. E-shopping has been gradually growing over the last couple of years as a result of advancements in communication and internet infrastructure [
5]. This growth of e-shopping has dramatically impacted household travel behavior, particularly outdoor shopping trips. According to the World Bank, the shares of e-shopping in the world retail trade between 2015 and 2019 increased by an average of 10.4% over these five years. In 2020 and 2021, due to the COVID-19 pandemic, online shopping shares increased to 18% and 19.5%, respectively [
6]. This increase in demand was a short-term increase due to the imposed COVID-19 restrictions, and once these restrictions were weakened, consumers began to return to their regular in-store shopping behavior. Thus, the e-shopping growth rates reduced to 10% in 2022 [
7]. Nonetheless, e-shopping and its effect on outdoor shopping trips have been the focus of transportation researchers [
8,
9].
Transportation planners are highly concerned about the impact of e-shopping on outdoor shopping trips and how these could affect the transportation system [
10]. Most of the existing studies in the literature focused on understanding the effects of e-shopping on outdoor shopping trips in western countries like the Netherlands [
11,
12,
13,
14,
15,
16,
17] and the United States [
4,
12,
18,
19,
20], and some in China [
9,
21,
22]. Whereas, research shows that e-shopping’s impact might differ considerably between countries [
9]. Moreover, it is also important to understand how in-store shopping and e-shopping frequencies changed before, during, and after the COVID-19 pandemic. Thus, this study aims to address this gap in the literature by analyzing the frequency and determinants of e-shopping while considering the possible imposed effect of the COVID-19 pandemic. The objectives of this study are as follows:
- (a)
To determine the difference between in-store shopping and e-shopping frequencies within each time period: before, during, and after the COVID-19 pandemic.
- (b)
To assess the differences in e-shopping frequency across the three time periods: before, during, and after the COVID-19 pandemic.
- (c)
To assess the determinants of e-shopping within each time period: before, during, and after the COVID-19 pandemic.
A questionnaire-based survey was conducted to collect data on in-store shopping as well as e-shopping frequencies before, during, and after the COVID-19 pandemic. The survey also collected the demographic information of the respondents. The results of this study will provide valuable insights to transportation planners and policymakers and enable them to make informed decisions regarding transportation system reliability and sustainability.
The rest of the paper is organized as follows: The next section reviews previous research papers to establish the basis for the survey design.
Section 3 presents the methodology followed for conducting the survey and collecting the data.
Section 4 details the analysis and discussion. Finally, the conclusions and recommendations are offered in
Section 5.
2. Literature Review
This section offers an overview of the existing literature concerning the determinants of e-shopping behavior. It examines various studies that explore the factors influencing e-shopping behavior. Moreover, it reviews some papers related to e-shopping in the specific context of the COVID-19 pandemic. Finally, the literature review provides some insights into e-shopping in Bahrain and the influence of the COVID-19 pandemic.
2.1. Determinants of E-Shopping
To date, many studies have examined the factors influencing e-shopping behavior, with a significant focus on sociodemographic factors. However, these studies yielded mixed results concerning the impact of sociodemographic factors.
The literature shows conflicting results related to the influence of gender on e-shopping. Some researchers found that gender significantly affects e-shopping [
9,
23,
24,
25,
26,
27,
28], while others found that gender is insignificant [
29,
30,
31,
32,
33,
34,
35]. Some research papers showed that women engage in e-shopping more than men [
9,
12,
24]. However, opposing results were found in other papers [
13,
25]. Some papers suggest that women and men prefer products purchased online; women tend to buy clothes more, while men shop for electronics [
21,
36].
Age has been found to negatively influence e-shopping behavior [
13,
25,
31,
34,
37,
38,
39]. Young people aged around 35 years or below have a higher probability of purchasing online [
9,
28,
31,
39]. However, some studies showed that age is not a predictor of e-shopping behavior [
32,
35].
Studies show that a high income is positively associated with e-shopping [
13,
21,
25,
26,
30,
31,
34,
35,
38,
39]. On the other hand, some researchers found that low-income groups tend to shop online more frequently [
9,
37]. Other researchers demonstrated that income is insignificant when it comes to e-shopping behavior [
29,
32,
40].
As for the educational level, a wealth of previous research suggests that the higher the level of education, the more likely people are to engage in e-shopping [
9,
12,
13,
31,
34,
38], while others argue that education is insignificant [
23,
29,
32,
41]. There is also an opposing opinion that suggests that more educated people are less likely to purchase online [
37].
Some researchers investigated the influence of family structure on e-shopping behavior. Uddin et al. found that family structure and employment influence e-shopping [
27]. The presence of children in households has a positive impact on e-shopping [
12,
21,
34,
42], as it constrains parents’ free time, and parents are more likely to shop online in response to lack of free time [
21,
42]. Moreover, employment is considered another determinant that impacts e-shopping positively [
27,
31]. On the other hand, Çebi Karaaslan found that unemployed household heads engage in more e-shopping than employed ones [
38].
Car ownership can be a significant determining factor that affects a person’s decision to shop online [
31]. It was found that households with automobiles engage in more e-shopping than those without [
12,
31,
38]. While other researchers reported that the effect of car ownership is not significant on e-shopping behavior [
12].
The availability of the Internet is the basis of e-shopping; thus, variables related to the Internet can influence e-shopping behavior. Internet experience and frequency of using the Internet are positively related to e-shopping [
12,
25,
27,
40]. However, Shi et al. found that people with considerable internet experience are less interested in e-shopping [
9].
The literature has yielded conflicting results related to e-shopping determinants, with different determinants impacting e-shopping in different studies. Although this variability could be due to limitations in research methodology and data quality, it also could be due to the circumstances of the study area, such as economic development, urbanization, informatization, and social culture. Therefore, it is essential to investigate e-shopping determinants in various regions to gain a more comprehensive understanding of their impact on e-shopping behavior [
9].
Table 1 summarizes the e-shopping determinants presented in the literature.
2.2. Studies Related to E-Shopping and the COVID-19 Pandemic
Nowadays, many research studies focus on investigating the effect of the COVID-19 pandemic on e-shopping and behavioral changes. Nguyen et al. explored the factors related to changes in e-shopping behavior during the COVID-19 pandemic for five product types (food, medical products, clothes, electronics, and books) [
43]. The results showed an 80% increase in respondents’ engagement in e-shopping when compared with before the pandemic, with females shopping online more frequently. In-store shopping enjoyment, income, working from home, and fear of disease are factors that influence e-shopping behavior.
Erjavec and Manfreda reviewed the adoption of e-shopping among older adults during the pandemic [
44]. They examined the theory of acceptance and use of technology for individuals aged 60 and older during the COVID-19 pandemic and social isolation circumstances. The results indicate that herd behavior influences behavioral intentions to adopt e-shopping during the pandemic more than social influence and fear of COVID-19.
Adibfar et al. analyzed and modeled changes in e-shopping behavior due to the COVID-19 pandemic [
45]. The research aims to understand changes in people’s behavior due to COVID-19 and to assess whether it has permanently changed the trends of in-store and e-shopping. The findings suggest that people tend to return to in-store shopping after the pandemic, that online and in-store shopping would be balanced out, and that typical trends as before the pandemic would be pursued. The study concludes that in-store and e-shopping should be considered in transportation planning.
Table 2 summarizes the studies discussed.
2.3. About Bahrain: Online Shopping and COVID-19 Pandemic
Bahrain is a technology-driven country that has witnessed an increase in e-commerce over the past few years. The high internet penetration rate helps with the expansion of online businesses [
46]. According to the Inclusive Internet Index issued by Meta and The Economist, Bahrain is ranked third globally in terms of Internet users, with 99.5% of households having Internet access [
47]. Bahrain is among the top 10 countries in West Asia for enabling business-to-consumer (B2C) e-commerce, with around 27% of internet users being online shoppers [
48]. According to the Bahrain Economic Development Board, e-retail was expected to have a penetration rate of 12.2% of offline retail in the Gulf Cooperation Council (GCC) region in 2025. This penetration rate was before the COVID-19 pandemic. After the pandemic, the forecasted penetration rate increased to about 16.3% [
49].
The e-shopping behavior in Bahrain remains an area of limited research, leading to an incomplete understanding of its dynamics. The available studies focused on understanding behavior from a limited perspective. The effect of age on the adoption of e-shopping was investigated by Jalal et al., and their findings showed that age is insignificant, indicating no difference between age groups regarding the willingness to shop online [
50]. However, a study by Geetha found that age is significant, with young and middle-aged groups being more engaged in e-shopping. Moreover, this study also analyzed educational level and income, highlighting the fact that educational level does not affect e-shopping behavior, while income level influences purchase decisions to a great extent [
51].
Addressing the current gap in the literature, this study offers a thorough understanding of e-shopping behavior in Bahrain, which could also be reflected in other countries of the GCC. This paper offers a holistic approach to analyzing e-shopping behavior by considering multiple product categories and determinants through three periods of time (i.e., before, during, and after the COVID-19 pandemic). To the authors’ knowledge, the literature lacks a comprehensive study that offers knowledge about e-shopping behavior related to groceries, household essentials, electronics, and clothes shopping, and focuses on the change in the behavior in terms of the pandemic along with the determinants influencing such a behavior.
3. Methodology
3.1. Questionnaire Design and Administration
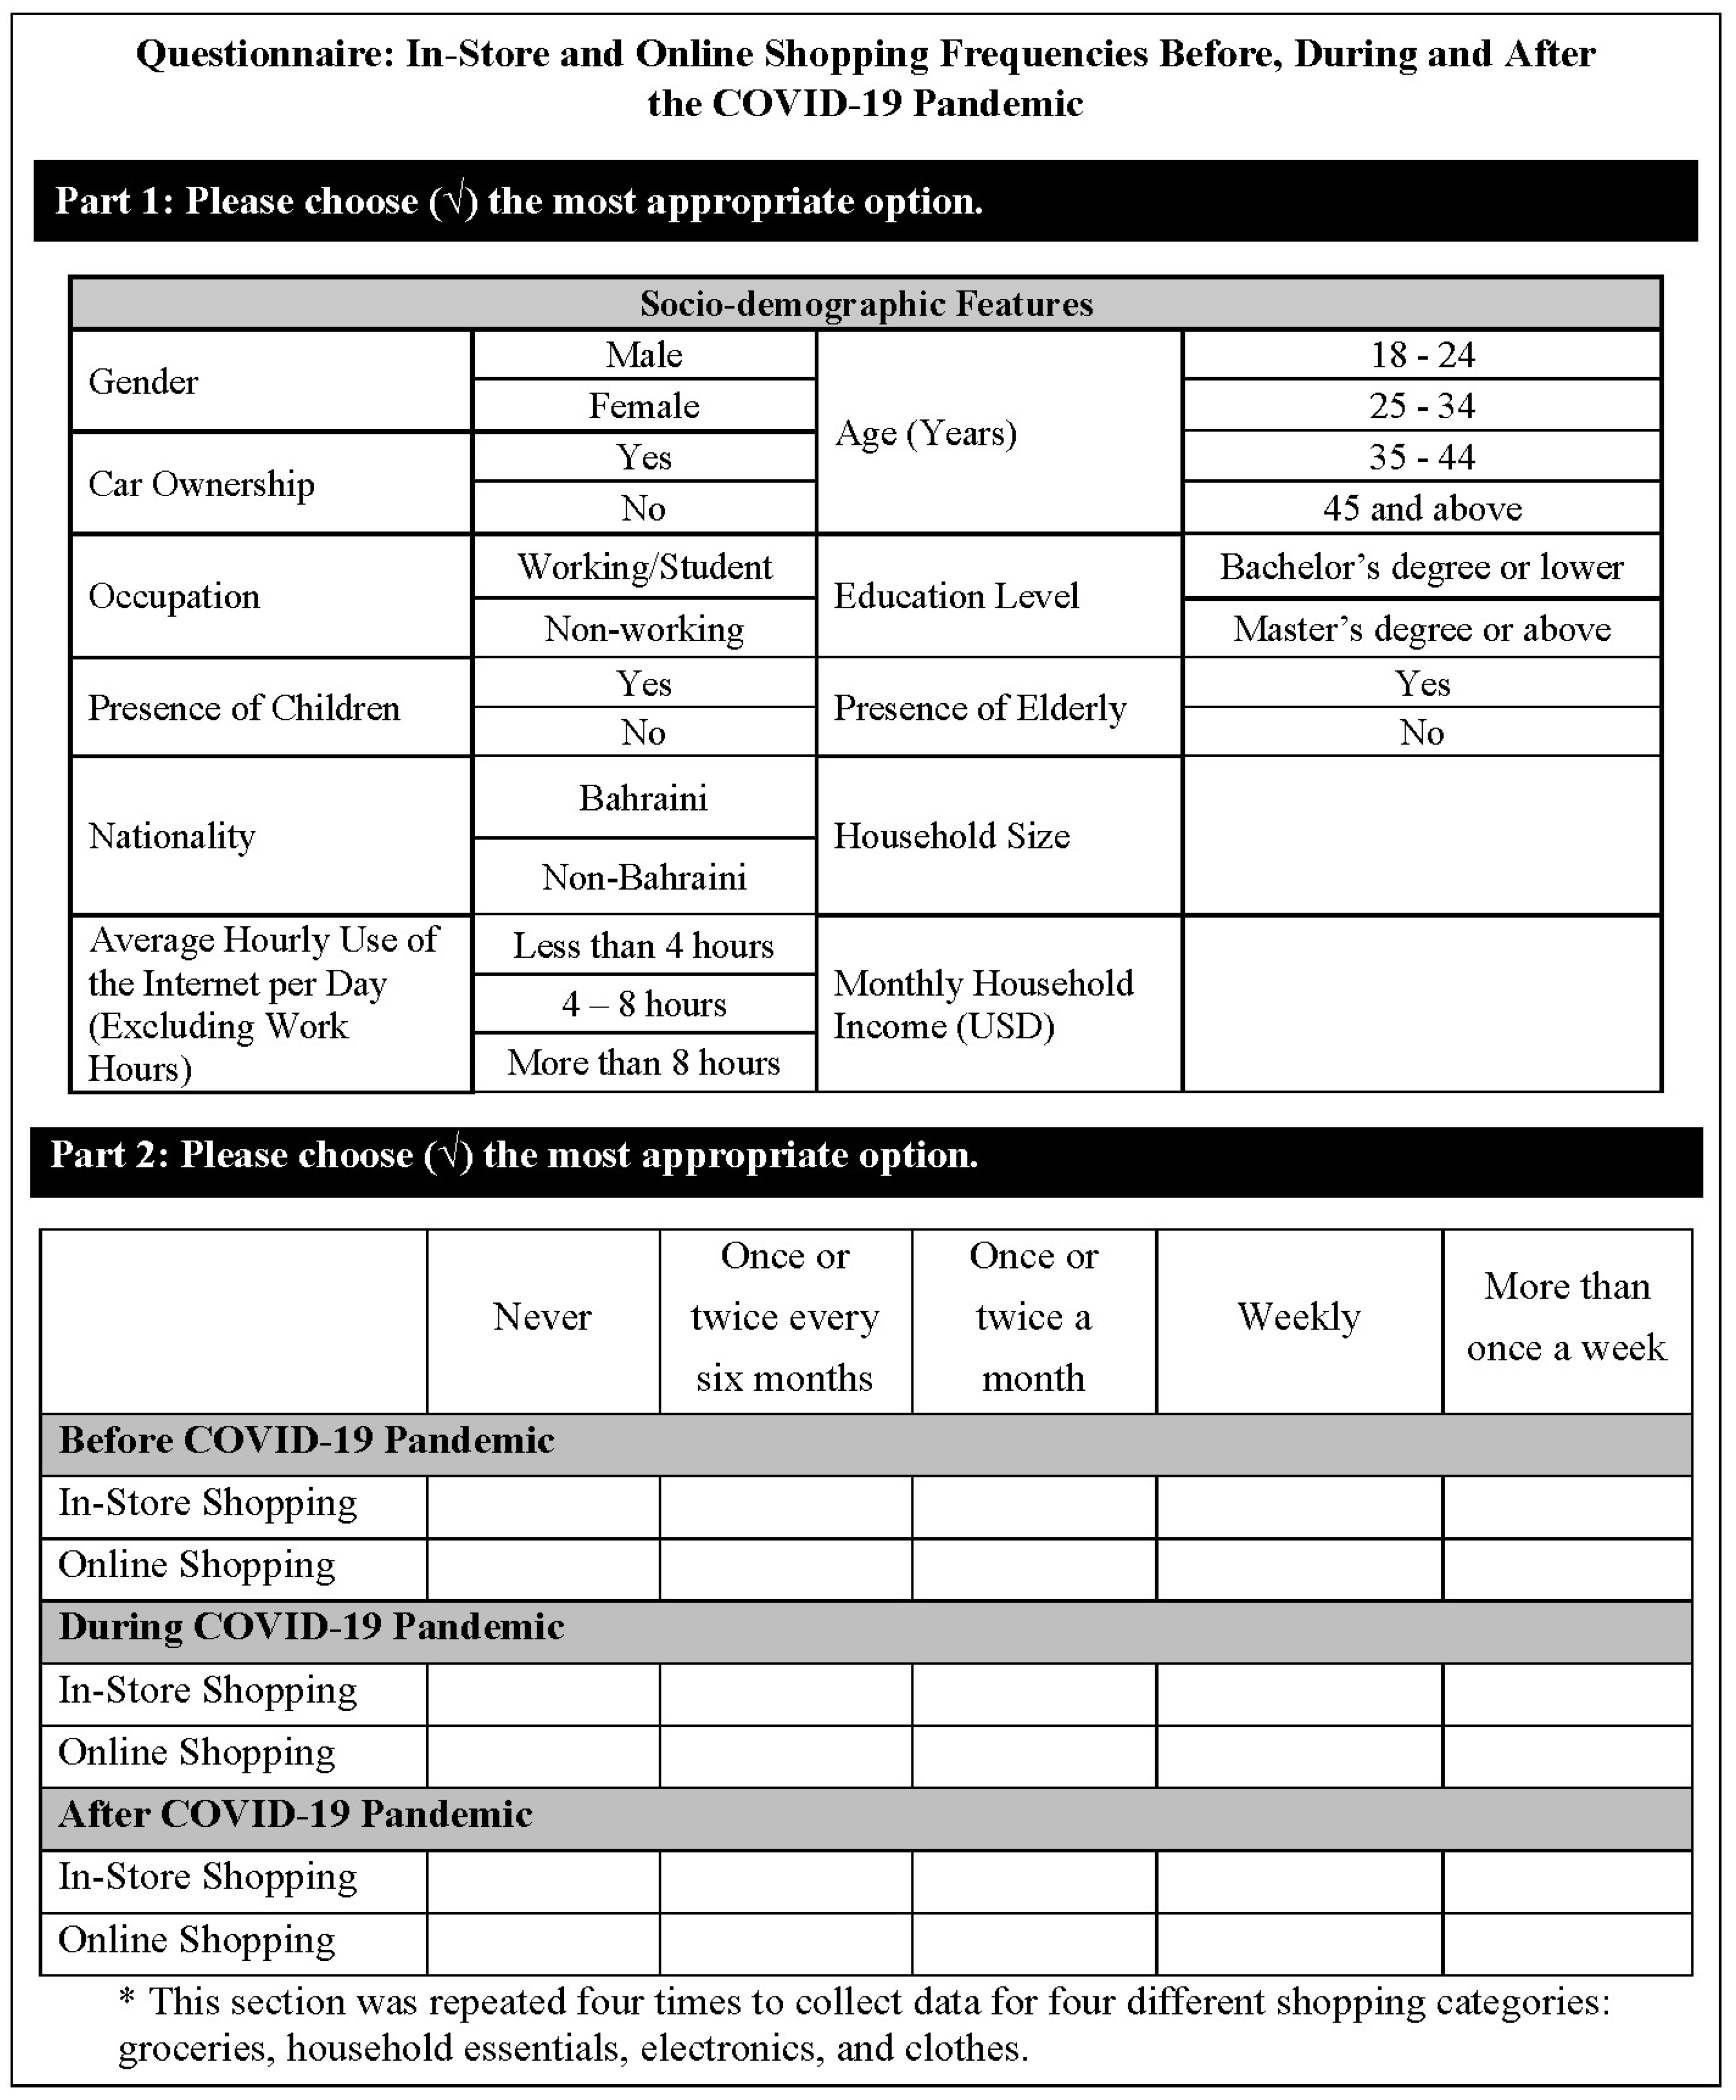
Based on the literature review, a questionnaire was designed to collect data related to e-shopping for four types of products: groceries, household essentials, electronics, and clothes (
Figure 1). The questionnaire was divided into two sections. The first section focused on gathering sociodemographic data, aiming to identify the determinants of e-shopping behavior. Participants were asked to provide details about their age, gender, education level, occupation, household size, presence of children and elderly individuals, car ownership, internet usage, and monthly household income. The second section of the questionnaire assessed the frequency of e-shopping for each type of product before, during, and after the COVID-19 pandemic. This section was designed to examine changes in consumer behavior over time and provide insights into the impact of the pandemic on the frequency of e-shopping. The in-store shopping and e-shopping frequencies were recorded on a five-point Likert scalethat was later combined into three categories for analysis purposes.
The survey was conducted online between 16 March 2023 and 1 April 2023. The questionnaire included a question about the country of residence to filter out the responses and select only those related to Bahrain. A total of 401 valid responses were collected, forming the sample for analysis. According to the literature, the sample size was considered adequate and appropriate for the analysis [
52,
53].
3.2. Analyses Methods
Initially, a descriptive analysis of the collected data was conducted to summarize the key characteristics of the respondents and their in-store and online shopping behavior. Then, the in-store and e-shopping frequencies were compared for each period. The changes in e-shopping frequency across these periods were also examined. The comparison is done in terms of pairs to provide a comprehensive understanding of the impact of the pandemic on shopping frequencies. The Wilcoxon signed-rank test, a non-parametric statistical test, was used to compare the frequency of in-store shopping and e-shopping within each period, i.e., before, during, and after the COVID-19 pandemic. Further, the changes in the frequency of e-shopping across the three periods were also tested using the Wilcoxon signed-rank test.
The chi-square test was performed to evaluate the effects of various socio-demographic determinants on e-shopping frequencies for each product type within all three time periods (i.e., before, during, and after COVID-19). The chi-square test is suitable for analyzing categorical data and determining the significance of associations between variables. By applying this test, the study aimed to identify the determinants that had a significant impact on e-shopping behavior for specific product types within different time periods. The hypotheses’ testing plan is shown in
Figure 2.
The Wilcoxon signed-rank test and chi-square test were performed using the R programming language, a widely used tool for statistical analysis and data visualization. All statistical tests were conducted at a 95% confidence level (i.e., significance level α = 0.05), indicating that results with a p-value less than 0.05 were considered statistically significant and the null hypothesis (H0) was rejected.
4. Results and Discussion
4.1. Descriptive Analysis
Descriptive analysis provides a comprehensive overview of the respondents, allowing for an understanding of the distribution of variables and gaining insights into the characteristics of the respondents. In this survey, the dominant group of participants was female (61%), with Bahraini individuals accounting for the majority of the sample. The age groups below 25 and 25–34 were more frequently represented, while the educational level mainly comprised a bachelor’s degree or lower. Almost half of the respondents were employed, and households with a size of five or less accounted for 56% of responses. The presence of children in the house was more prevalent than the presence of elderly individuals. Additionally, 80% of the survey population owned a car, and the average daily usage of the Internet ranged between 4 and 8 h daily for purposes other than work or university. Finally, in terms of household monthly income, 32% of the respondents earn less than BHD 600 (approximately USD 1600), and 34% earn between BHD 600 and 1199 (approximately between USD 1600 and 3180). The sociodemographic information about the respondents is presented in
Table 3.
The survey investigated the frequency of both in-store shopping and e-shopping for four categories (grocery, household essentials, electronics, and clothes) before, during, and after the COVID-19 pandemic. The frequencies of both in-store and e-shopping for each product category are shown in
Figure 3 for each period. For all product categories, the responses showed an increase in e-shopping during the pandemic, indicating a change in consumer behavior. This change continued even after the pandemic, although in-store shopping remained more prevalent overall.
4.2. In-Store Shopping and E-Shopping Frequencies before, during, and after COVID-19
The following hypotheses were formed to compare the frequencies of in-store shopping and e-shopping before, during, and after the COVID-19 pandemic:
H0: There is no difference between in-store and e-shopping frequencies before COVID-19.
H1: There is a difference between in-store and e-shopping frequencies before COVID-19.
H0: There is no difference between in-store and e-shopping frequencies during COVID-19.
H1: There is a difference between in-store and e-shopping frequencies during COVID-19.
H0: There is no difference between in-store and e-shopping frequencies after COVID-19.
H1: There is a difference between in-store and e-shopping frequencies after COVID-19.
The results of the Wilcoxon signed-rank tests are summarized in
Table 4. The analysis of shopping frequencies for groceries, household essentials, electronics, and clothes before, during, and after the pandemic yielded several significant findings. Before and after the pandemic, in-store shopping was significantly more frequent than e-shopping for grocery items. This is in line with the results reported by [
45] that people tend to return to in-store shopping after the pandemic. Nevertheless, during the pandemic, no significant difference was observed between the two. A similar pattern was observed for household essentials and electronics. As for clothes, in-store shopping frequencies were significantly higher than e-shopping before the pandemic. During the pandemic, e-shopping frequencies became higher than in-store shopping. Similar findings were reported by [
43]. But this increase was not long-lasting, as in-store shopping regained its predominance after the pandemic.
4.3. E-Shopping Frequencies before, during, and after COVID-19
The following hypotheses were defined to compare e-shopping frequencies before, during, and after the COVID-19 pandemic:
- 4.
H0: There is no difference between e-shopping frequencies before and during COVID-19.
H1: There is a difference between e-shopping frequencies during and after COVID-19.
- 5.
H0: There is no difference between e-shopping frequencies during and after COVID-19.
H1: There is a difference between e-shopping frequencies during and after COVID-19.
The results of the Wilcoxon signed-rank tests comparing the e-shopping frequencies before, during, and after the COVID-19 pandemic are summarized in
Table 5. For each product category, there was a significant increase in e-shopping during the pandemic when compared with before. However, no significant difference was found between during and after the pandemic.
4.4. Determinants of Online Shopping
The effects of socio-demographic determinants such as gender, age, level of education, occupation, household size, presence of children, presence of elderly individuals, car ownership, average hourly internet use, and household monthly income on e-shopping frequencies before, during, and after the COVID-19 pandemic were tested using the chi-square test. For this purpose, the following hypothesis was formulated, and the results of the chi-square tests are shown in
Table 6.
H0. There is no relationship between the determinants and the shopping category.
H1. There is a relationship between the determinants and the shopping category.
4.4.1. Determinants of Grocery Shopping
The analysis indicated that gender, age, household size, presence of children, presence of the elderly, car ownership, average hourly use of the Internet, and household monthly income did not influence online grocery shopping before, during, or after the pandemic. However, during the pandemic, individuals with master’s or Ph.D. degrees were more likely to engage in online grocery shopping compared to those with a bachelor’s degree or lower. This is in line with the existing literature [
9,
12,
13,
31,
34,
38]. Additionally, working individuals showed higher e-shopping activity during the pandemic.
4.4.2. Determinants of Household Essentials Shopping
The analysis showed that gender, level of education, occupation, household size, presence of children, presence of the elderly, car ownership, average hourly use of the Internet, and household monthly income did not significantly impact e-shopping behavior for periods before, during, or after the pandemic. However, before the pandemic, the age group of 25–34 showed higher engagement in e-shopping compared to other age groups. This finding that younger people were more involved in e-shopping is supported by the existing literature [
9,
28,
31,
39]. However, contrary evidence also exists, indicating that age negatively influences e-shopping behavior [
9,
28,
31,
39].
4.4.3. Determinants of Electronics Shopping
The analysis revealed that before the pandemic, gender and age were found to be significant determinants, with males and the age group of 35–44 showing higher engagement in e-shopping. During the pandemic, individuals with master’s or Ph.D. degrees engaged in more e-shopping. Additionally, working individuals were more involved in online electronics shopping. The remaining determinants, including household size, presence of children, presence of the elderly, car ownership, average hourly use of the Internet, and household monthly income, did not significantly influence e-shopping in any of the analyzed periods.
4.4.4. Determinants of Clothes Shopping
The analysis showed that gender was a significant determinant before, during, and after the pandemic, with females engaging in more e-shopping compared to males. These findings align with prior research by indicating that females exhibit a higher frequency of online clothing purchases compared to males [
21,
36]. Moreover, the average hourly use of the Internet was a significant determinant for e-shopping in all periods, with individuals using the Internet for 8 h or more daily showing greater engagement. After the pandemic, the age group of 35–44 was more involved in e-shopping. Household size was significant before the pandemic, with households of 6 or more being more engaged in e-shopping. The presence of the elderly was significant only before the pandemic, with online clothes shopping being more prevalent in households without elderly members. Car ownership was significant after the pandemic, indicating that individuals with cars were more likely to do e-shopping. Finally, household monthly income is not significant for all periods. This is in contrast to a large body of prior research that indicates a positive link between income and e-shopping frequency [
30,
31,
34,
35,
38].
The determinants of e-shopping behavior varied across different categories and time periods. Gender and age showed consistent associations in some categories compared to other determinants such as level of education, occupation, household size, presence of children or the elderly, and household monthly income.
5. Conclusions and Recommendations
Online shopping has been growing over the past years, and its use was accelerated during the COVID-19 pandemic. This increase was short-term due to the pandemic-related restrictions imposed by the authorities, and e-shopping frequencies returned to their average values once these restrictions were lifted. E-shopping frequency is affected by various determinants including sociodemographic variables, and internet access and usage.
This study focused on evaluating e-shopping frequency and its determinants in Bahrain. The analysis showed that e-shopping frequencies varied within each time period: before, during, and after the pandemic. Before the pandemic, in-store shopping was more prevalent than e-shopping for groceries, household essentials, electronics, and clothes. During the pandemic, the difference between the two disappeared for groceries, household essentials, and electronics. However, it showed an increase in e-shopping for clothes. After the pandemic, a higher frequency of in-store shopping was observed for all the product categories compared to e-shopping. Further, the analysis showed that e-shopping frequencies changed across the three time periods. It was found that e-shopping frequency during the pandemic was higher than before the pandemic, but there was no significant difference between during and after the pandemic.
As for the determinants of e-shopping frequency in Bahrain, the analysis showed varying results for the shopping categories across the three time periods. Males showed a preference for electronics e-shopping before the pandemic, while females consistently exhibited higher engagement in online clothes shopping. Age also played a role, with the 25–34 age group showing more e-shopping for household essentials before the pandemic, and the 35–44 age group showing increased e-shopping for electronics and clothes after the pandemic. Education level influenced online electronics shopping during the pandemic, with individuals holding master’s or Ph.D. degrees engaging more in online purchases. Working individuals showed a high engagement in electronics e-shopping before and during the pandemic, while household size only affected online clothes shopping before the pandemic. The presence of the elderly was significant for clothes shopping only before the pandemic, with online clothes shopping being more prevalent in households without elderly members. The presence of children did not show significant associations with e-shopping behavior. Car ownership was significant for clothes e-shopping after the pandemic, while the average hourly use of the Internet significantly influenced online clothes shopping across all periods. Household monthly income did not consistently demonstrate significant associations with e-shopping behavior.
Several practical implications can be derived from the results of this study. Firstly, the e-shopping frequency after the pandemic returned to pre-pandemic levels, indicating the short-term nature of the surge in e-shopping during the pandemic. Therefore, transport and urban planners must be ready to manage the traffic demand resulting from shopping trips after the pandemic is over. Further, the authorities and e-commerce businesses should consider incentives to retain the users who shifted to e-shopping during the pandemic. This could reduce road traffic congestion caused by shopping trips. Moreover, the results indicated that males were less likely to buy clothes online compared to females. Online retailers often consider female customers as their target market, whereas they should also target male users [
54]. In addition, addressing factors that deter male consumers, such as privacy risks, could help attract more male consumers to e-shopping [
55].
This study had some methodological limitations. The data were collected through an online questionnaire; therefore, those with internet access may be overrepresented in the sample. Further, the respondents were asked to report their shopping frequencies before the COVID-19 pandemic, raising the possibility that some respondents may not accurately recall their shopping frequencies before the pandemic. Although this study provides valuable insights into the frequencies and determinants of e-shopping, it does not consider attitudes that drive consumers to perform e-shopping. Understanding consumer attitudes is essential to gain a deeper understanding of their preferences and the influence of the pandemic on their behavior. Therefore, further future investigation could specifically address the attitudes toward e-shopping to provide a more comprehensive analysis of consumers’ e-shopping behavior. This would contribute to a more holistic understanding of the factors influencing e-shopping behavior and enable businesses and policymakers to adapt strategies that align with consumers’ attitudes and preferences.
Author Contributions
Conceptualization, E.A.A., H.I.H. and H.M.A.-A.; methodology, E.A.A. and H.I.H.; software, E.A.A. and H.I.H.; formal analysis, E.A.A. and H.I.H.; investigation, E.A.A., H.I.H., H.M.A.-A. and M.A.; resources, H.M.A.-A.; writing—original draft preparation, E.A.A., H.I.H. and H.M.A.-A.; writing—review and editing, E.A.A., H.I.H., H.M.A.-A. and M.A.; visualization, E.A.A., H.I.H. and M.A.; supervision, H.M.A.-A. and M.A. All authors have read and agreed to the published version of the manuscript.
Funding
The APC of the article were funded by the Deanship of Scientific Research (DSR), at King Fahd University of Petroleum and Minerals, (KFUPM), Saudi Arabia.
Institutional Review Board Statement
Not applicable. No personal identifying details were collected.
Informed Consent Statement
Informed consent was obtained from all subjects involved in the study.
Data Availability Statement
Data available upon request.
Acknowledgments
The authors appreciate and acknowledge the support provided by King Fahd University of Petroleum and Minerals (KFUPM) by providing all the essential resources to conduct this study.
Conflicts of Interest
The authors declare no conflicts of interest.
References
- Wadud, Z.; Chen, D. Congestion Impacts of Shopping Using Vehicle Tracking Data. J. Transp. Geogr. 2018, 70, 123–130. [Google Scholar] [CrossRef]
- Zhao, P.; Hu, H. Geographical Patterns of Traffic Congestion in Growing Megacities: Big Data Analytics from Beijing. Cities 2019, 92, 164–174. [Google Scholar] [CrossRef]
- Meena, S.; Patil, G.R.; Mondal, A. Understanding Mode Choice Decisions for Shopping Mall Trips in Metro Cities of Developing Countries. Transp. Res. Part F Traffic Psychol. Behav. 2019, 64, 133–146. [Google Scholar] [CrossRef]
- Cao, X.J.; Xu, Z.; Douma, F. The Interactions between E-Shopping and Traditional in-Store Shopping: An Application of Structural Equations Model. Transportation 2012, 39, 957–974. [Google Scholar] [CrossRef]
- Khodzhamuratova, G.; Aripov, U. E-commerce and its future development. Eurasian J. Law Financ. Appl. Sci. 2023, 3, 89–92. [Google Scholar]
- Hushko, S.; Mamanazarov, A.; Khudaybergenov, A.; Jiyemuratov, T.; Kudiyarov, K. E-Commerce Market Pulse in Global Economic Development. In Proceedings of the 5th International Scientific Congress Society of Ambient Intelligence; SCITEPRESS—Science and Technology Publications: Kryvyi Rih, Ukraine, 2022; pp. 100–107. [Google Scholar]
- Oxford Analytica. E-Commerce Market Will Settle to Steady Growth. Emerald Expert Brief. 2022, oxan-db. [Google Scholar] [CrossRef]
- Le, H.T.K.; Carrel, A.L.; Shah, H. Impacts of Online Shopping on Travel Demand: A Systematic Review. Transp. Rev. 2022, 42, 273–295. [Google Scholar] [CrossRef]
- Shi, K.; De Vos, J.; Yang, Y.; Witlox, F. Does E-Shopping Replace Shopping Trips? Empirical Evidence from Chengdu, China. Transp. Res. Part A Policy Pract. 2019, 122, 21–33. [Google Scholar] [CrossRef]
- Mwale, M.; Luke, R.; Pisa, N. Factors That Affect Travel Behaviour in Developing Cities: A Methodological Review. Transp. Res. Interdiscip. Perspect. 2022, 16, 100683. [Google Scholar] [CrossRef]
- Farag, S.; Schwanen, T.; Dijst, M. Empirical Investigation of Online Searching and Buying and Their Relationship to Shopping Trips. Transp. Res. Rec. 2005, 1926, 242–251. [Google Scholar] [CrossRef]
- Farag, S.; Krizek, K.J.; Dijst, M. E-Shopping and Its Relationship with In-store Shopping: Empirical Evidence from The Netherlands and the USA. Transp. Rev. 2006, 26, 43–61. [Google Scholar] [CrossRef]
- Farag, S.; Schwanen, T.; Dijst, M.; Faber, J. Shopping Online and/or in-Store? A Structural Equation Model of the Relationships between e-Shopping and in-Store Shopping. Transp. Res. Part A Policy Pract. 2007, 41, 125–141. [Google Scholar] [CrossRef]
- Weltevreden, J.W.J. Substitution or Complementarity? How the Internet Changes City Centre Shopping. J. Retail. Consum. Serv. 2007, 14, 192–207. [Google Scholar] [CrossRef]
- Weltevreden, J.W.; Rietbergen, T.V. E-Shopping Versus City Centre Shopping: The Role of Perceived City Centre Attractiveness. Tijdschr. Voor Econ. Soc. Geogr. 2007, 98, 68–85. [Google Scholar] [CrossRef]
- Weltevreden, J.W.J.; van Rietbergen, T. The Implications of E-Shopping for in-Store Shopping at Various Shopping Locations in The Netherlands. Environ. Plan. B Plan. Des. 2009, 36, 279–299. [Google Scholar] [CrossRef]
- Maat, K.; Konings, R. Accessibility or Innovation? Store Shopping Trips versus Online Shopping. Transp. Res. Rec. 2018, 2672, 1–10. [Google Scholar] [CrossRef]
- Cao, X.; Douma, F.; Cleaveland, F. Influence of E-Shopping on Shopping Travel: Evidence from Minnesota’s Twin Cities. Transp. Res. Rec. 2010, 2157, 147–154. [Google Scholar] [CrossRef]
- Zhou, Y.; Wang, X. Explore the Relationship between Online Shopping and Shopping Trips: An Analysis with the 2009 NHTS Data. Transp. Res. Part A Policy Pract. 2014, 70, 1–9. [Google Scholar] [CrossRef]
- Lee, R.J.; Sener, I.N.; Mokhtarian, P.L.; Handy, S.L. Relationships between the Online and In-Store Shopping Frequency of Davis, California Residents. Transp. Res. Part A Policy Pract. 2017, 100, 40–52. [Google Scholar] [CrossRef]
- Zhen, F.; Cao, X.; Mokhtarian, P.L.; Xi, G. Associations Between Online Purchasing and Store Purchasing for Four Types of Products in Nanjing, China. Transp. Res. Rec. 2016, 2566, 93–101. [Google Scholar] [CrossRef]
- Ding, Y.; Lu, H. The Interactions between Online Shopping and Personal Activity Travel Behavior: An Analysis with a GPS-Based Activity Travel Diary. Transportation 2017, 44, 311–324. [Google Scholar] [CrossRef]
- Muthupriya, A. Online Shopping Attitude Among the Youth: A Study on Alagappa University Students in Karaikudi, Sivaganga District. Management 2019, 7, 43–47. [Google Scholar] [CrossRef]
- Pradhana, F.; Sastiono, P. Gender Differences in Online Shopping: Are Men More Shopaholic Online? Atlantis Press: Amsterdam, The Netherlands, 2019; pp. 123–128. [Google Scholar]
- Crocco, F.; Eboli, L.; Mazzulla, G. Individual Attitudes and Shopping Mode Characteristics Affecting the Use of E-Shopping and Related Travel. Transp. Telecommun. J. 2013, 14, 45–56. [Google Scholar] [CrossRef]
- Gagandeep, N.; Gopal, R. A Study of Factors Affecting the Online Shopping Behavior of Consumers. Int. J. Sci. Res. Publ. 2013, 3, 1–4. [Google Scholar]
- Uddin, M.J.; Sultana, T. Consumer Preference on Online Purchasing: An Attitudinal Survey in Bangladesh. Cost Manag. 2015, 43, 4–7. [Google Scholar]
- Baubonienė, Ž.; Gulevičiūtė, G. E-commerce factors influencing consumers’ online shopping decision. Soc. Technol. 2015, 5, 74–81. [Google Scholar]
- Makhitha, K.; van Scheers, L.; Mogashoa, C. Which Consumer Attributes Influence South African Consumers to Shop Online. J. Bus. Retail. Manag. Res. 2019, 13, 312–325. [Google Scholar] [CrossRef]
- Nampoothiri, A.; Pravitha, N.R. Online Shopping Behaviour: A Study on Exploring the Dependence of Demographics of the People in Kerala on Their Behaviour in Online Shopping. Turk. J. Comput. Math. Educ. (TURCOMAT) 2021, 12, 4153–4161. [Google Scholar]
- Lee, R.J.; Sener, I.N.; Handy, S.L. Picture of Online Shoppers: Specific Focus on Davis, California. Transp. Res. Rec. 2015, 2496, 55–63. [Google Scholar] [CrossRef]
- Hernández, B.; Jiménez, J.; José Martín, M. Age, Gender and Income: Do They Really Moderate Online Shopping Behaviour? Online Inf. Rev. 2011, 35, 113–133. [Google Scholar] [CrossRef]
- Buhaljoti, A.; Habili, M.; Abazi, A. The Impact of Knowing the Profile of Online Shoppers on Online Shopping: Evidence from City of Berat, Albania. Wseas Trans. Bus. Econ. 2022, 19, 1265–1270. [Google Scholar] [CrossRef]
- Gong, W.; Stump, R.L.; Maddox, L.M. Factors Influencing Consumers’ Online Shopping in China. J. Asia Bus. Stud. 2013, 7, 214–230. [Google Scholar] [CrossRef]
- Abdel Hamid Saleh, M. Assessing the Consumers’ Propensity for Online Shopping: A Demographic Perspective. J. Am. Acad. Bus. 2015, 21, 186–193. [Google Scholar]
- Hou, J.; Elliott, K. Gender Differences in Online Auctions. Electron. Commer. Res. Appl. 2016, 17, 123–133. [Google Scholar] [CrossRef]
- Irawan, M.Z.; Wirza, E. Understanding the Effect of Online Shopping Behavior on Shopping Travel Demand through Structural Equation Modeling. J. East. Asia Soc. Transp. Stud. 2015, 11, 614–625. [Google Scholar]
- Çebi Karaaslan, K. Determinants of Online Shopping Attitudes of Households in Turkey. J. Model. Manag. 2022, 17, 119–133. [Google Scholar] [CrossRef]
- Braimllari, A.; Nerjaku, S. Factors Influencing the Usage of Online Shopping in Albania. In Proceedings of the 4th International Conference on Business, Management and Finance, Oxford, UK, 26–28 November 2021; pp. 94–108. [Google Scholar]
- Xi, G.; Zhen, F.; Cao, X.; Xu, F. The Interaction between E-Shopping and Store Shopping: Empirical Evidence from Nanjing, China. Transp. Lett. 2020, 12, 157–165. [Google Scholar] [CrossRef]
- Mbah, C.C.; Akpan, A.O.; Odike, M. Effect of education on online shopping behaviour in nigeria. Adv. J. Econ. Mark. Res. 2019, 4, 24–31. [Google Scholar]
- Spurlock, C.A.; Todd-Blick, A.; Wong-Parodi, G.; Walker, V. Children, Income, and the Impact of Home Delivery on Household Shopping Trips. Transp. Res. Rec. 2020, 2674, 335–350. [Google Scholar] [CrossRef]
- Nguyen, M.H.; Armoogum, J.; Nguyen Thi, B. Factors Affecting the Growth of E-Shopping over the COVID-19 Era in Hanoi, Vietnam. Sustainability 2021, 13, 9205. [Google Scholar] [CrossRef]
- Erjavec, J.; Manfreda, A. Online Shopping Adoption during COVID-19 and Social Isolation: Extending the UTAUT Model with Herd Behavior. J. Retail. Consum. Serv. 2022, 65, 102867. [Google Scholar] [CrossRef]
- Adibfar, A.; Gulhare, S.; Srinivasan, S.; Costin, A. Analysis and Modeling of Changes in Online Shopping Behavior Due to COVID-19 Pandemic: A Florida Case Study. Transp. Policy 2022, 126, 162–176. [Google Scholar] [CrossRef]
- Salam Khattak, I.M.; Ul Haq, M.A.; Akram, F.; Malik, H.A. Contribution of E-Business in Economic Growth of Bahrain. In Proceedings of the 2020 International Conference on Data Analytics for Business and Industry: Way Towards a Sustainable Economy (ICDABI), Sakheer, Bahrain, 26–27 October 2020; pp. 1–6. [Google Scholar]
- Economist Impact: The Inclusive Internet Index, Supported by Meta. Available online: https://impact.economist.com/projects/inclusive-internet-index/2022/country/Bahrain (accessed on 25 September 2023).
- THE UNCTAD B2C E-COMMERCE INDEX 2020, Spotlight on Latin America and the Caribbean; United Nations: New York, NY, USA, 2020.
- Digital Content and E-Commerce Business Opportunities. Available online: https://www.bahrainedb.com/business-opportunities/information-communication-technology/digital-content-e-commerce (accessed on 25 September 2023).
- Jalal, D.A.; Al-Maskati, M.A.-M. Insight of Online Shopping Trend: An Empirical Study with Relevance to Bahrain. Glob. J. Enterp. Inf. Syst. 2010, 2, 5–14. [Google Scholar]
- Geetha, G. Exploring the Influential Factors of Online Consumer Shopping Habits and Intention in GCC. Special Reference to Kingdom of Bahrain. Int. J. Innov. Sci. Res. Technol. 2020, 5, 576–586. [Google Scholar]
- Taherdoost, H. Determining Sample Size; How to Calculate Survey Sample Size. Int. J. Econ. Manag. Syst. 2017, 2, 237–239. [Google Scholar]
- Ajay, S.S.; Micah, B.M. Sampling Techniques & Determination of Sample Size in Applied Statistics Research: An Overview. Int. J. Econ. Commer. Manag. 2014, 2, 1–2. [Google Scholar]
- Nirmala, R.P.; Dewi, I.J. The Effects of Shopping Orientations, Consumer Innovativeness, Purchase Experience, and Gender on Intention to Shop for Fashion Products Online. Gadjah Mada Int. J. Bus. 2011, 13, 65. [Google Scholar] [CrossRef]
- Dai, B. The Impact of Online Shopping Experience on Risk Perceptions and Online Purchase Intentions: The Moderating Role of Product Category and Gender. Ph.D. Thesis, Consumer Affairs, Tulsa, OK, USA, 2007. [Google Scholar]
| Disclaimer/Publisher’s Note: The statements, opinions and data contained in all publications are solely those of the individual author(s) and contributor(s) and not of MDPI and/or the editor(s). MDPI and/or the editor(s) disclaim responsibility for any injury to people or property resulting from any ideas, methods, instructions or products referred to in the content. |
© 2024 by the authors. Licensee MDPI, Basel, Switzerland. This article is an open access article distributed under the terms and conditions of the Creative Commons Attribution (CC BY) license (https://creativecommons.org/licenses/by/4.0/).


