Abstract
Sustainable development monitoring reveals the extent to which local and national territories are progressing towards sustainability goals. This study considered 105 indicators associated with the Equitable and Sustainable Wellbeing (BES) framework and 139 indicators associated with the Sustainable Development Goals (SDGs), using multicriteria decision analysis (MCDA) and cluster analysis to compare regional performance across the Italian territory in 2022. At the SDG level, Lombardia exhibited the highest performance, while the provinces of Trento and Bolzano led at the BES level. The results were further analyzed with respect to geographic macro-areas and the three dimensions of sustainability, via separate cluster analyses comparing the BES and SDG results. Northeast regions emerged as the top performers, and comparable performance was shown by regions in the center and northwest. The development of a sustainable innovation model, alongside territorial cooperation and synergy between regional specificities, may generate competitive advantages, especially when combined with resources and skills with an international profile.
1. Introduction
1.1. The Concept of Sustainability
The topic of sustainability requires in-depth exploration, as some aspects of the concept are not yet well understood [1,2]. The definition offered by the Brundtland Report in 1987 stressed the need to consider future generations, moving beyond a concept of sustainability anchored in a purely environmental perspective [3]. Thus, sustainability may be considered to encompass not only environmental protection but also the balancing of social welfare and economic opportunities. In this vein, Saint John Paul II, on World Youth Day 2000 in Rome, urged young people to be “sentinels of the morning”. Importantly, the concept of pragmatic sustainability may be contrasted with that of ideological sustainability, as Europe’s goal of climate neutrality by 2050 requires solutions that meet the needs of various stakeholders while also involving young people and fostering a sense of brotherhood among peoples [4].
1.2. Development Goals towards Sustainability
Compared to the last publication of the development goals towards sustainability (accessed on 19 April 2023), the number of published papers on the topic has increased to 31,757 (as of 15 April 2024). A keyword search was run on the Web of Science (WoS) using the search terms “SDGs” and/or “Sustainable Development Goals”. The data covered the past 4.5 years (2020–2024), and a 14% growth in the number of publications over this period was evident. Notably, 62.2% of the papers were published with open access, representing an increase of 60% with respect to the previous set.
- Table A1 lists the top 10 WoS categories, with “environmental sciences” leading, followed by “green sustainable science technology”.
- Table A2 indicates that approximately 83% of the work originated in the top 10 countries, with China contributing approximately 18%, followed by the USA (12.9%) and the UK (10.3%). South American countries were absent from the ranking, while India, Spain, Australia, Italy, Germany, South Africa and Canada were included.
- Table A3 presents the analysis by WoS index, showing the Science Citation Index Expanded (57.4%) as the most significant, followed by the Social Sciences Citation Index (39.4%).
- Table A4 describes the distribution of papers across the individual SDGs. The results indicated a shift from the previous ranking, where SDG 3 prevailed, followed by SDG 2 and SDG 1. In the new ranking, SDG 13 led, followed by SDG 3 and SDG 11; SDGs 14, 15 and 16 received the least attention.
1.3. The Role of SDG and BES Indicators
In 2015, all United Nations Member States adopted the 2030 Agenda for Sustainable Development. The reviewed literature analyzed the SDGs with respect to different goals, including food consumption [5], medical waste management [6], education institutions [7], tourism [8], digitalization [9], the circular economy [10], smart cities [11], fashion [12] and space [13]. Core research topics included the SDGs, Agenda 2030, climate change and sustainability indicators [14]. Since the launch of the SDGs, some environmental and social goals have shown significant improvement [15]. In this regard, the use of indicators to measure performance at the territorial level is crucial [16,17,18]. Globally defined targets are not easily transmitted to the national level [19], and the maintenance of ecosystem services and promotion of well-being in low-income countries must be made a priority [20].
SDG calculations benefit businesses by encouraging managers to adopt green solutions [21]. Additionally, they allow politicians and the public to measure performance at the territorial level [22]. Consequently, techniques for measuring and evaluating the SDGs are crucial for various categories of stakeholders [23]. Importantly, social welfare must be measured alongside SDG indicators [24], and several European countries have proposed specific tools for this purpose [25]. Italy, for instance, considers Equitable and Sustainable Wellbeing (BES) indicators across 12 dimensions [26]. It is considered a virtuous example [27], as it was the first OECD country to introduce supplementary measures to GDP at the economic planning stage [28].
Scholars have suggested regional evaluations incorporating both BES and SDG metrics [29] while stressing the importance of preserving the uniqueness of these indices [30]. The pursuit of equitable, sustainable development and a high standard of living requires the identification of SDG and BES overlap [31]. However, the aggregation of information (which may or may not be related) is a complex challenge [32], and composite indicators may be needed for this purpose [33]. The effectiveness of composite indicators relies on the weighting system used, which can be implicit (i.e., equally weighted) or explicit (i.e., based on expert judgment) [34]. Equal weighting methods are often preferred due to their simplicity and immediacy [35].
In the literature, the Italian territory has been analyzed with respect to the SDGs [22,31,36]. As both the SDGs [4] and the BES [37] have been classified for the Italian territory, this paper aims to address a gap in the literature by providing aggregate analyses of BES and SDG indicators (using MCDA and cluster analysis) to compare the territorial performance of Italian regions in 2022. The work not only provides a global comparison of the two sets of indicators but also develops the analysis at the macro-geographical level and for the three dimensions of sustainability (i.e., economic, environmental, social), generating a ranking for the different Italian regions.
2. Literature Analysis
The present literature analysis aimed at identifying the main topics and trends of authors and countries relative to the SDGs. Given the vast amount of literature on the SDGs, spanning both STEM (i.e., science, technology, engineering, mathematics) and non-STEM disciplines, the review adopted a high-level approach. As indicated in Section 1.2, WoS yielded a total of 31,757 papers, which was too extensive for this work and for analysis using bibliometric methods. Therefore, we employed a novel approach, conducting three separate searches on Scopus (accessed on 25 April 2024): one for publications related to economic sustainability from 2020–2024 (Section 2.1), one for publications related to social sustainability from 2020–2024 (Section 2.2) and one for publications related to environmental sustainability from 2020–2024 (Section 2.3). Finally, Section 2.4 proposes the results of a general search of papers related to the entire field of sustainability.
2.1. Economic Sustainability
We commenced with a search on Scopus for publications on economic sustainability. The search was conducted using keywords such as “SDGs”, “Sustainable Development Goals”, and “economic sustainability”, focused on the economic pillar of sustainability. The search was limited to articles written in the English language. Details of the advanced search are provided in Appendix A (Table A5). The search yielded 3940 documents. As depicted in Figure A1, there was a steady increase in scientific production from 2020 to 2023, with a decrease in 2024 due to the availability of only partial results. In terms of the most relevant sources (Table 1), Sustainability had the highest number of publications, followed by the Journal of Cleaner Production and Environmental Science and Pollution Research. Figure A2 shows the most relevant countries in terms of production, with the top five as follows: China (656), Italy (219), India (201), Spain (187) and the USA (164).

Table 1.
Three top journals: economic sustainability.
2.2. Environmental Sustainability
For the advanced Scopus search of environmental sustainability publications, details can again be found in Appendix A (Table A5). The 5162 retrieved papers focused on the environmental pillar of sustainability and were limited to articles written in English. As shown in Figure A3, there was a positive trend from 2020 to 2023, similar to the economic case. Table 2 shows that the most relevant sources were Sustainability, the Journal of Cleaner Production and Environmental Science and Pollution Research. The most relevant countries in terms of production (Figure A4) were again China (799), Italy (312), India (299), the USA (273) and Spain (238).
Table 2.
Three top journals: environmental sustainability.
2.3. Social Sustainability
In total, 3601 publications were related to social sustainability. Again, the search was limited to articles written in English and details of the advanced Scopus search can be found in Appendix A (Table A5). As in the previous cases, annual scientific production registered a positive trend, as seen in Figure A5. This time, the most relevant sources were Sustainability and the Journal of Cleaner Production, with Sustainable Development occupying the third position (Table 3). Figure A6 shows the most relevant countries in terms of production: China (404), Spain (238), Italy (233), the USA (211) and the UK (167).
Table 3.
Three top journals: social sustainability.
2.4. Global SDG Literature Analysis
Analyzing the current literature regarding the three pillars of sustainability, we found positive trends in academic research across these dimensions. At this point, we found it natural to conduct only a global assessment. Specifically, we conducted an advanced search on Scopus (Table A5) for articles related to the “SDGs” and “Sustainable Development Goals” from 2023 to 2024, which retrieved 12,080 articles in the English language. The most relevant sources were Sustainability, the Journal of Cleaner Production and Environmental Science and Pollution Research (Table 4).
Table 4.
Three top journals: environmental sustainability.
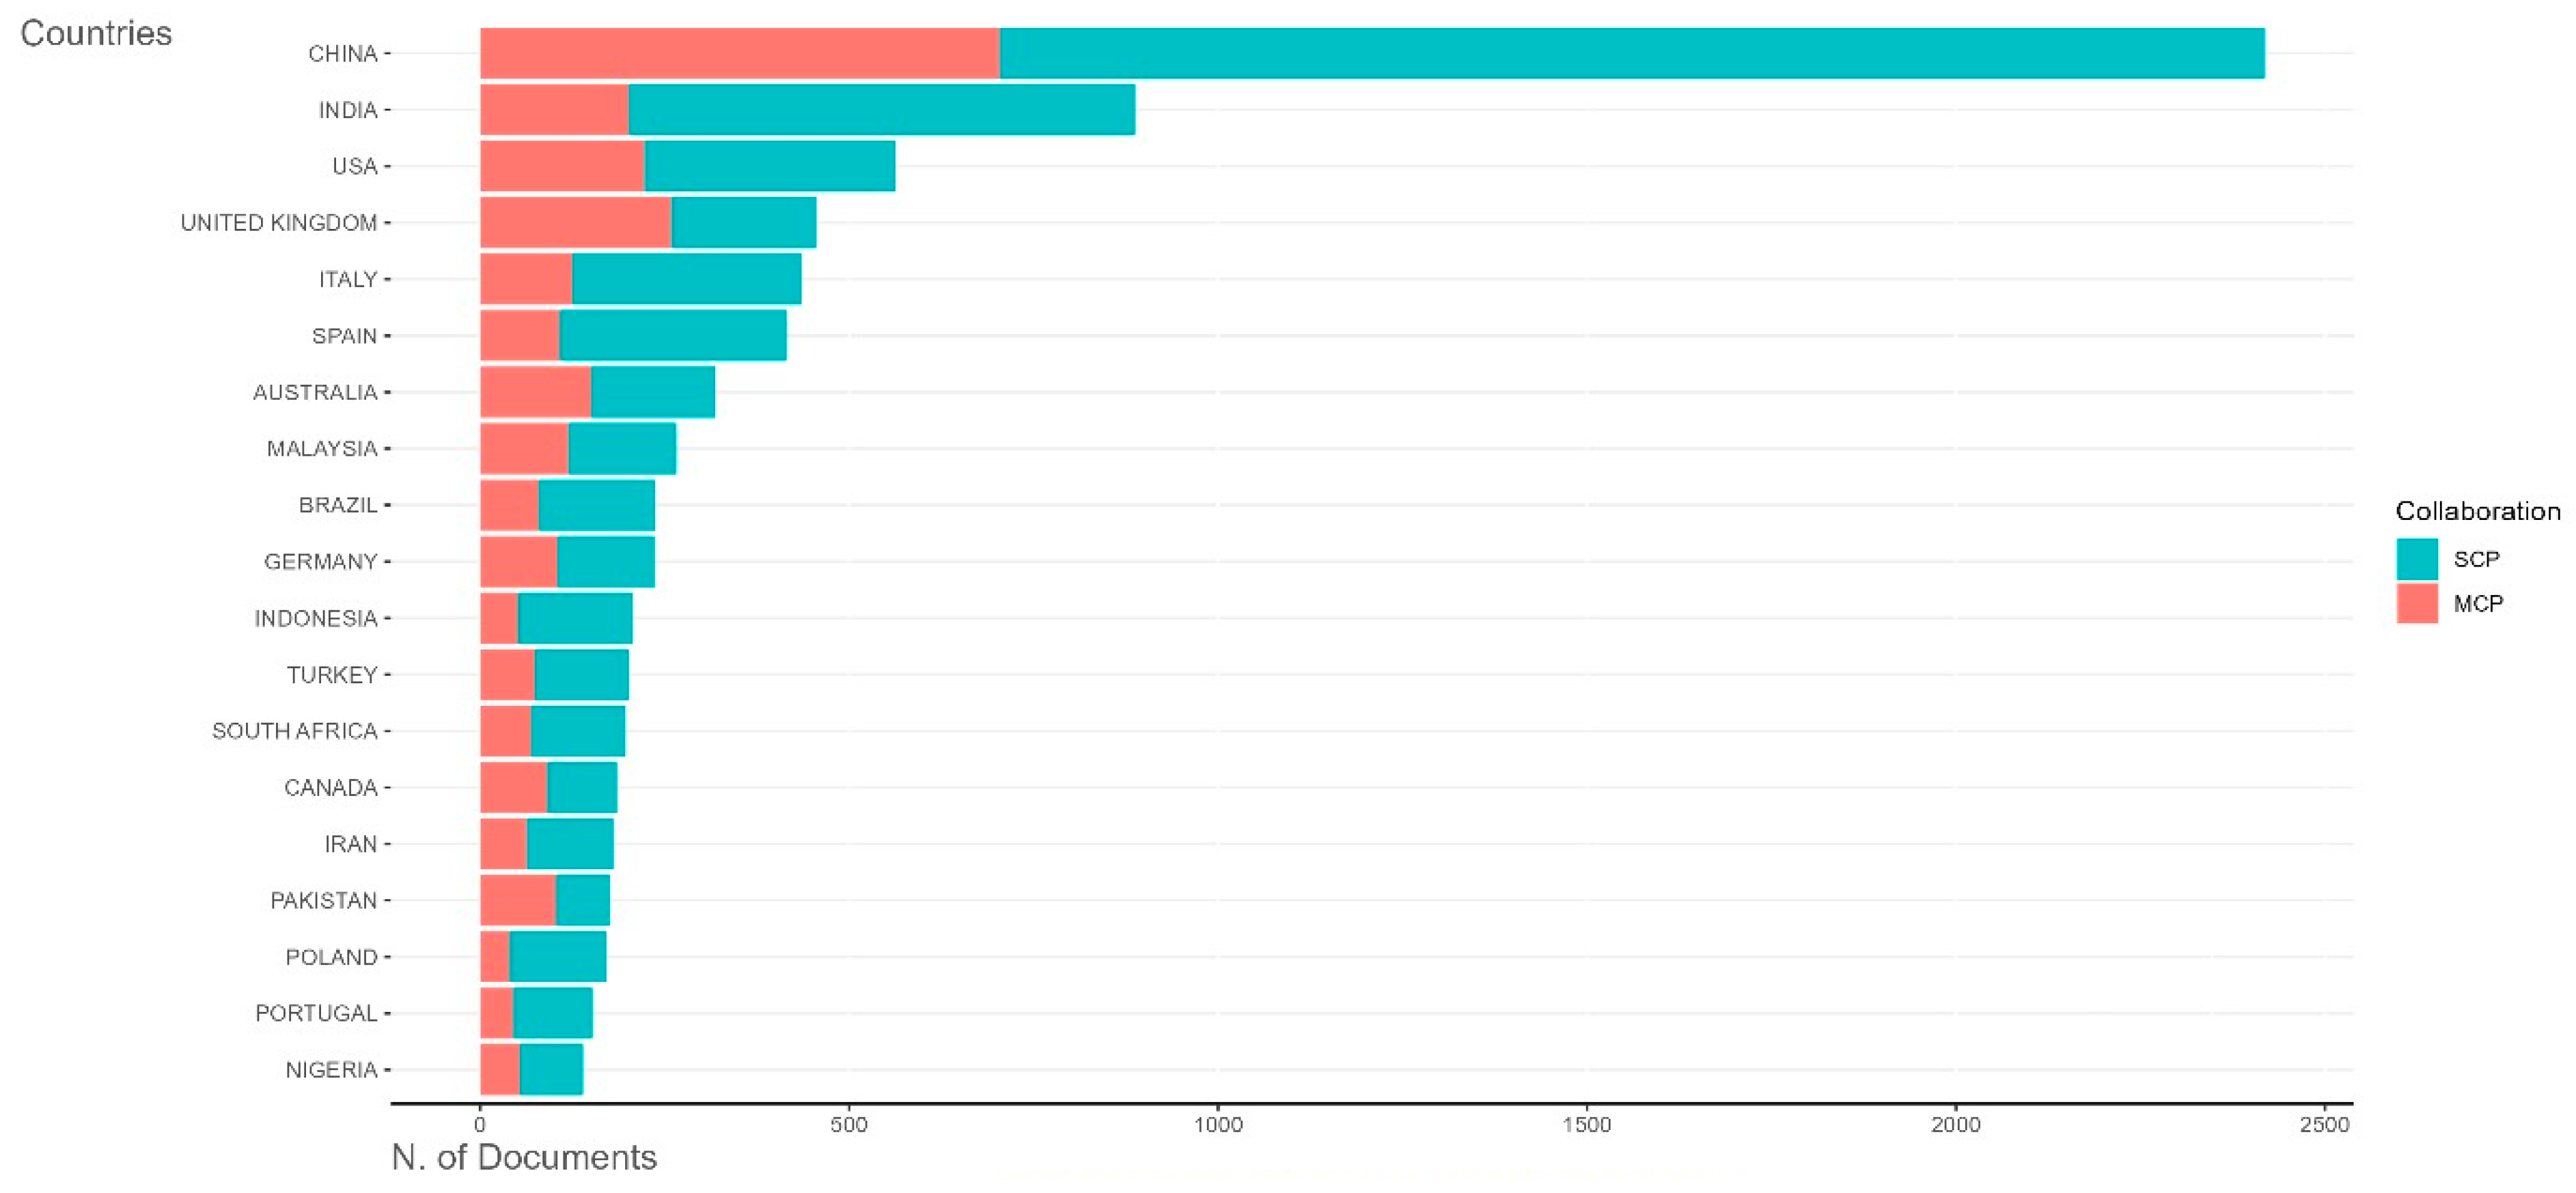
Figure 1 highlights the authors of the corresponding articles, with SCP and MCP representing intra-country and inter-country collaboration, respectively. China accounted for 2418 articles, India for 887, the USA for 562, the UK for 455 and Italy for 436.

Figure 1.
Top countries: literature analysis.
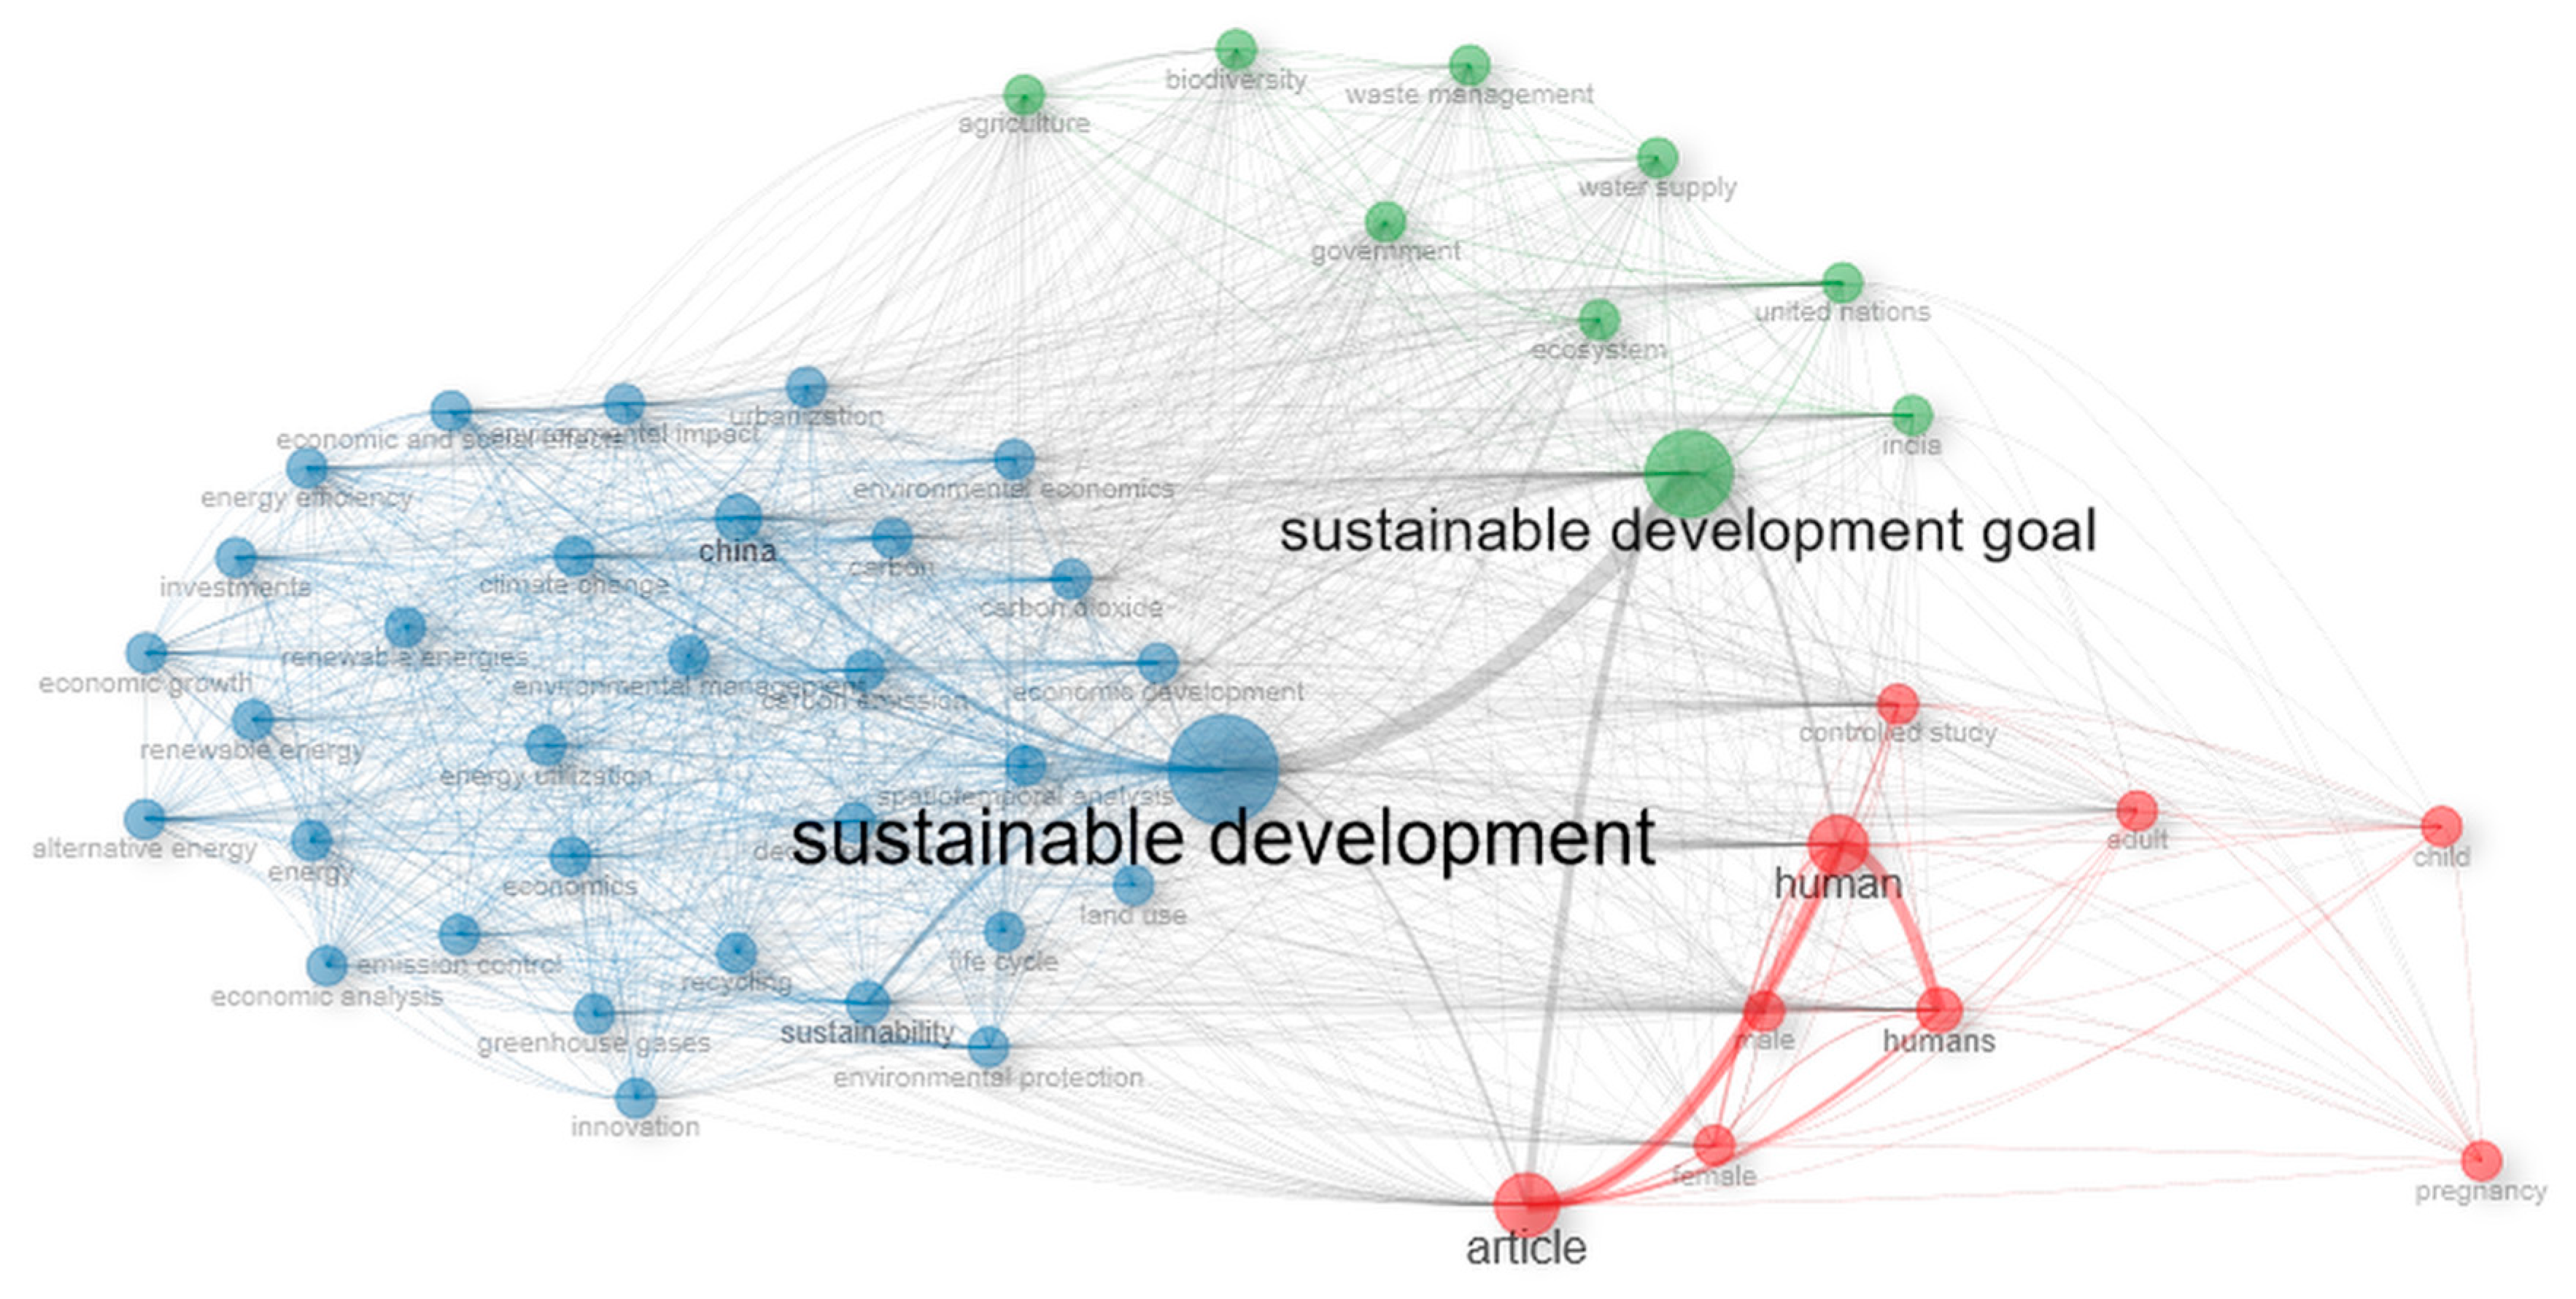
Figure 2 presents the co-occurrence network of our search results. A co-occurrence network is a graphical representation of relationships between entities based on their co-occurrence in a set of documents. In the context of a literature review, this involves identifying and analyzing the frequency with which terms (e.g., keywords, concepts, authors) appear together in documents [38]. In our network, some important links were notable, including a strong connection between “sustainable development” and “Sustainable Development Goals”. Indeed, in the modern academic landscape of sustainability, the SDGs are fundamental goals for future progress. Additionally, the network displayed a triangle formed by the SDGs, sustainable development and the word “human”. In this regard, we must in fact affirm that humans are the centerpiece of sustainable development. The continuous search for sustainable solutions makes us not only actors but also observers of the changes we seek. Finally, as seen throughout this literature review, China has positioned itself at the forefront of sustainable research and development.
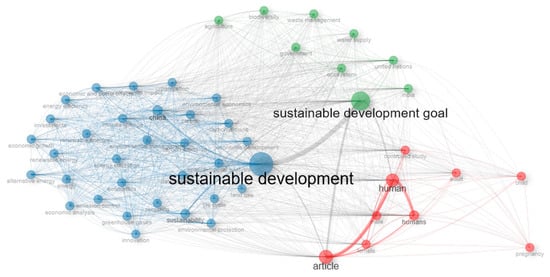
Figure 2.
Co-occurrence network.
In light of these topics, we conducted an analysis to determine the top five authors (Table 5) and top five affiliations (Table 6) based on document counts in Scopus from 2023 to 2024, using an advanced search: “sustainable AND development OR sustainable AND development AND goal” (accessed on 21 May 2024). To align with the scope of the present research, we restricted the analysis to the Italian territory. The results showed that, globally, Adetunji Charles O. from Edo University Iyamho authored 69 papers over the period, followed by two authors from the University of Sharjah: Olabi Abdul Ghani and Abdelkareem Mohammad Ali. At the Italian level, the most productive authors were D’Adamo Idiano from Sapienza University of Rome, followed by Gastaldi Massimo from University of L’Aquila and Appolloni Andrea from Tor Vergata University of Rome.
Table 5.
Top five authors.
Table 6.
Top five affiliations.
3. Materials and Methods
The present study compared Italian regional performance with respect to BES and SDG indicators using MCDA. This methodology, which is well known in the literature [39,40,41], is able to synthesize a large multiplicity of data, even considering data of different types and belonging to different scenarios characterized by contrasting objectives. The strength of the technique lies in its ability to create a composite indicator to rank different alternatives, thereby providing support for policymakers. In more detail, the method represents a mathematical combination of a set of elementary indicators representing the different components of a multidimensional concept to be measured. The matrix of the original data is formed by n rows (regions) and m columns (indicators). Of note, the present analysis considered 21 regions, since Trentino Alto Adige is divided into two macro-areas, the provinces of Trento and Bolzano, and m columns, relating to either the j indicators of the BES (with j = 1, …, m = 105) or the SDG indicators (with j = 1, …, m = 139). Once the data matrix was constructed, it could be normalized by obtaining the matrix . For region I, the composite indicator was determined according to the following formula:
with f representing a linear or non-linear aggregation function and e representing the weight of the single indicator j. The construction of the composite indicator was ensured through a dynamic process. First, elementary BES and SDG indicators were selected; then, these indicators were normalized and finally aggregated, determining the sustainable performance of each region. The min–max normalization method was used to create the composite indicator by determining values between 0 (worst performance) and 1 (best performance) and aggregating the results using the arithmetic mean (of note, all indicators had the same weight) [4,37]. In this way, two composite indicators were constructed: the first related to BES indicators and the second related to SDG indicators for the 21 regions in the year 2022. These indicators, having a common dimensionless range of variation (0–1), were thus fully comparable. Data for the analysis were taken from ISTAT’s official website and related to all indicators for which there were available data at the regional level during the study period [42].
4. Results
The results of this paper refer to the calculation of regional performance against the SDGs (considering 139 indicators), compared to the BES (considering 105 indicators), for the year 2022. Section 4.1 reports the results of the baseline scenario and then breaks them down into functions of the three dimensions of sustainability (Section 4.2). Finally, a cluster analysis is proposed (Section 4.3).
4.1. The SDG–BES Comparison for Italian Regions
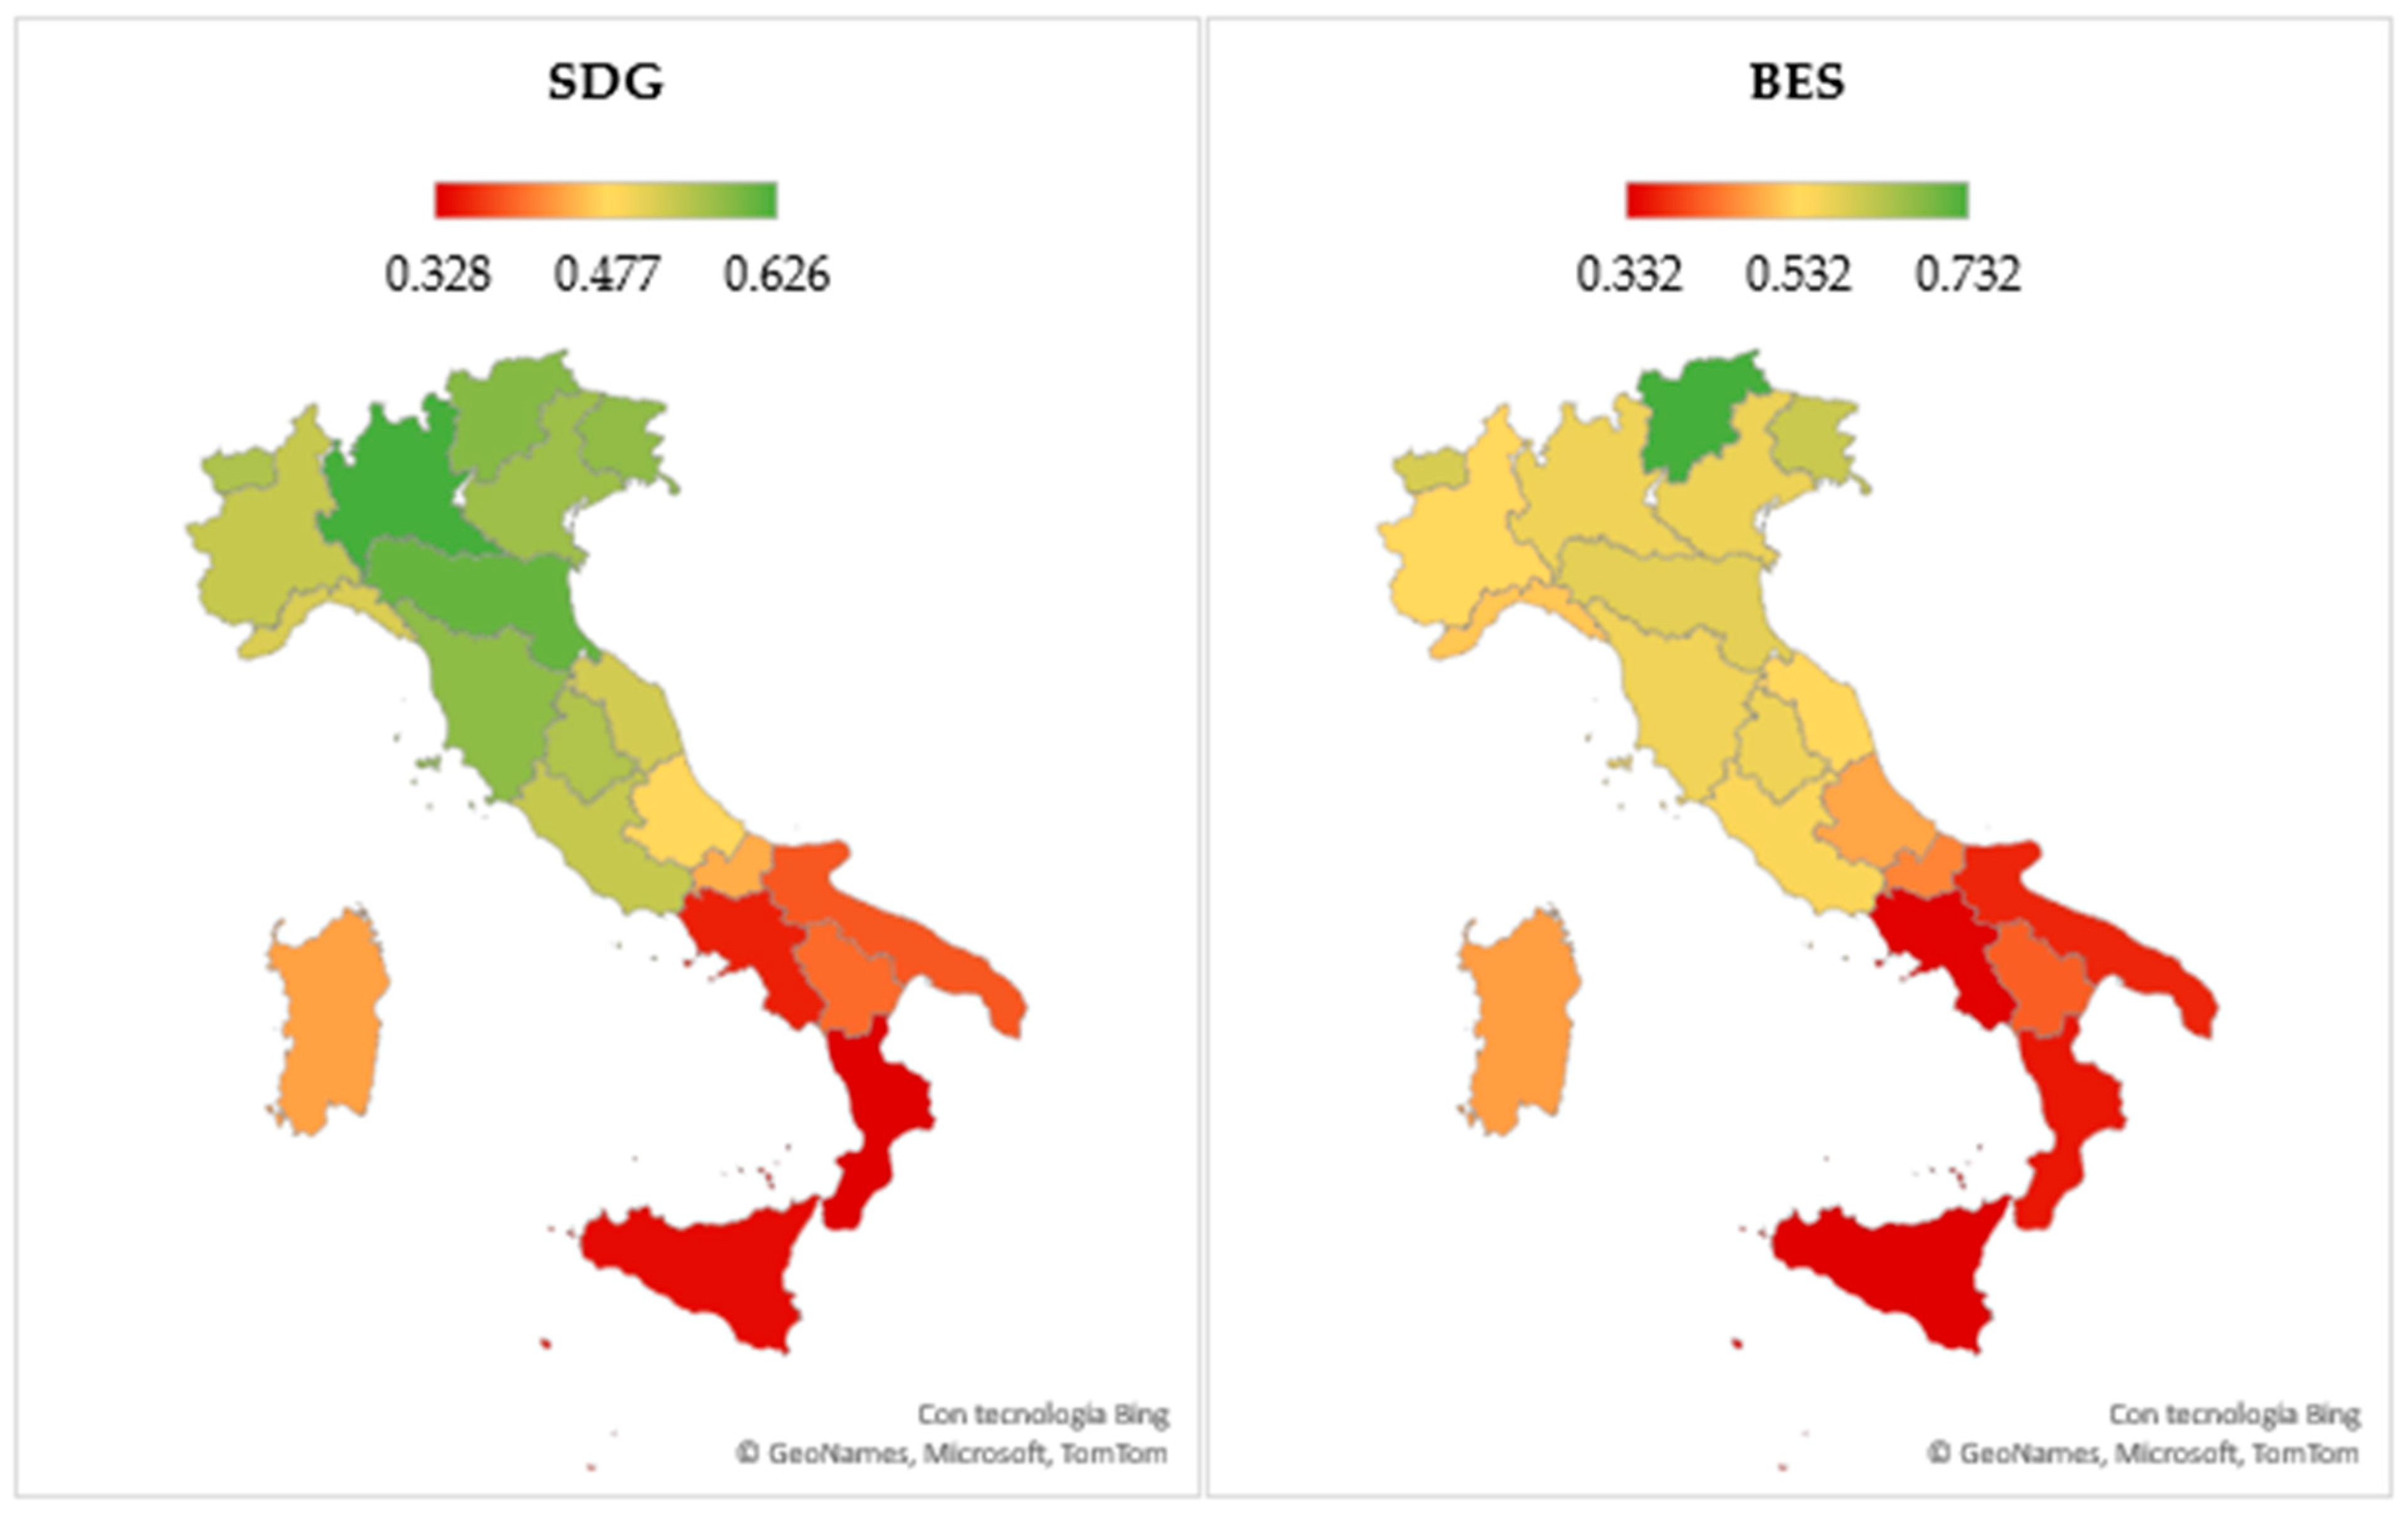
Within the 0–1 value normalization approach, a score of 1 is indicative of excellent performance. In the present analysis, no region produced a 1. Thus, the SDG and BES rankings showed different leading regions (Table 7). For the colored maps, the average value for Trentino Alto Adige was considered (0.587 for SDG and 0.732 for BES), considering the two provinces of Trento and Bolzano (Figure 3).
Table 7.
SDG–BES comparison across Italian regions.
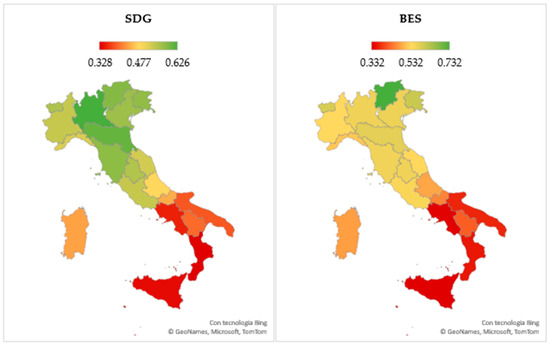
Figure 3.
Map of Italy in 2022.
According to the SDG, Lombardia excelled with a score of 0.626 (far from the theoretical maximum of 1), followed by the province of Trento with 0.612 and Emilia-Romagna with 0.607. Thirteen regions were above the national average (0.503), with the first position being 0.123 away from the benchmark. The remaining eight were below the national average, with the lowest ranked, Calabria, only 0.175 away.
All eight regions below the national average were located in the south, led by Abruzzo with a score of 0.487. In contrast, regions in the north and center were above the benchmark. Among those in the center, Tuscany scored highest (0.580) while Marche scored lowest (0.527). This result was nonetheless better than that of the lowest-performing northern region, Liguria (0.521). Table A6 shows the percentage change in each region’s score compared to each other region. The maximum variation was 91%, between the first (Lombardia) and last ranked (Calabria).
This difference between the first and last positions was 0.298, which was less marked than that of the BES (0.408). In alignment with previous research [37], the province of Trento (0.740) emerged in the top position, followed closely by the province of Bolzano (0.724). Much more significant was the distance with Friuli-Venezia Giulia (0.609). The following differences were also evident:
- The national average was 0.518 for the BES, slightly higher than the 0.503 for the SDGs; also for the BES, Liguria, in addition to the southern regions, fell below the national average.
- The negative changes from the BES ranking mainly concerned Lombardia and Toscana, which lost six and five positions, respectively.
- Positive changes from the BES ranking mainly concerned the provinces of Bolzano and Valle d’Aosta, which gained five and four positions, respectively.
- There was a change of two positions shown by four regions (Emilia-Romagna, Friuli-Venezia Giulia, Piemonte and Calabria), while five regions had the same position in the two rankings (Veneto, Liguria, Abruzzo, Basilicata and Puglia).
The numerical variation between the SDGs and the BES (Figure A7) showed that for nine regions there was a higher value, with Lombardy showing a positive delta of 0.061. However, while the difference for Sardegna (−0.038) was small, it was much more marked for the provinces of Trento (−0.128) and Bolzano (−0.163). This figure may be explained by the very significant BES performance of these regions, which was not, however, negative. In fact, the province of Trento ranked second in the SDG ranking.
4.2. Sustainability in Its Three Dimensions (i.e., Economic, Environmental, Social)
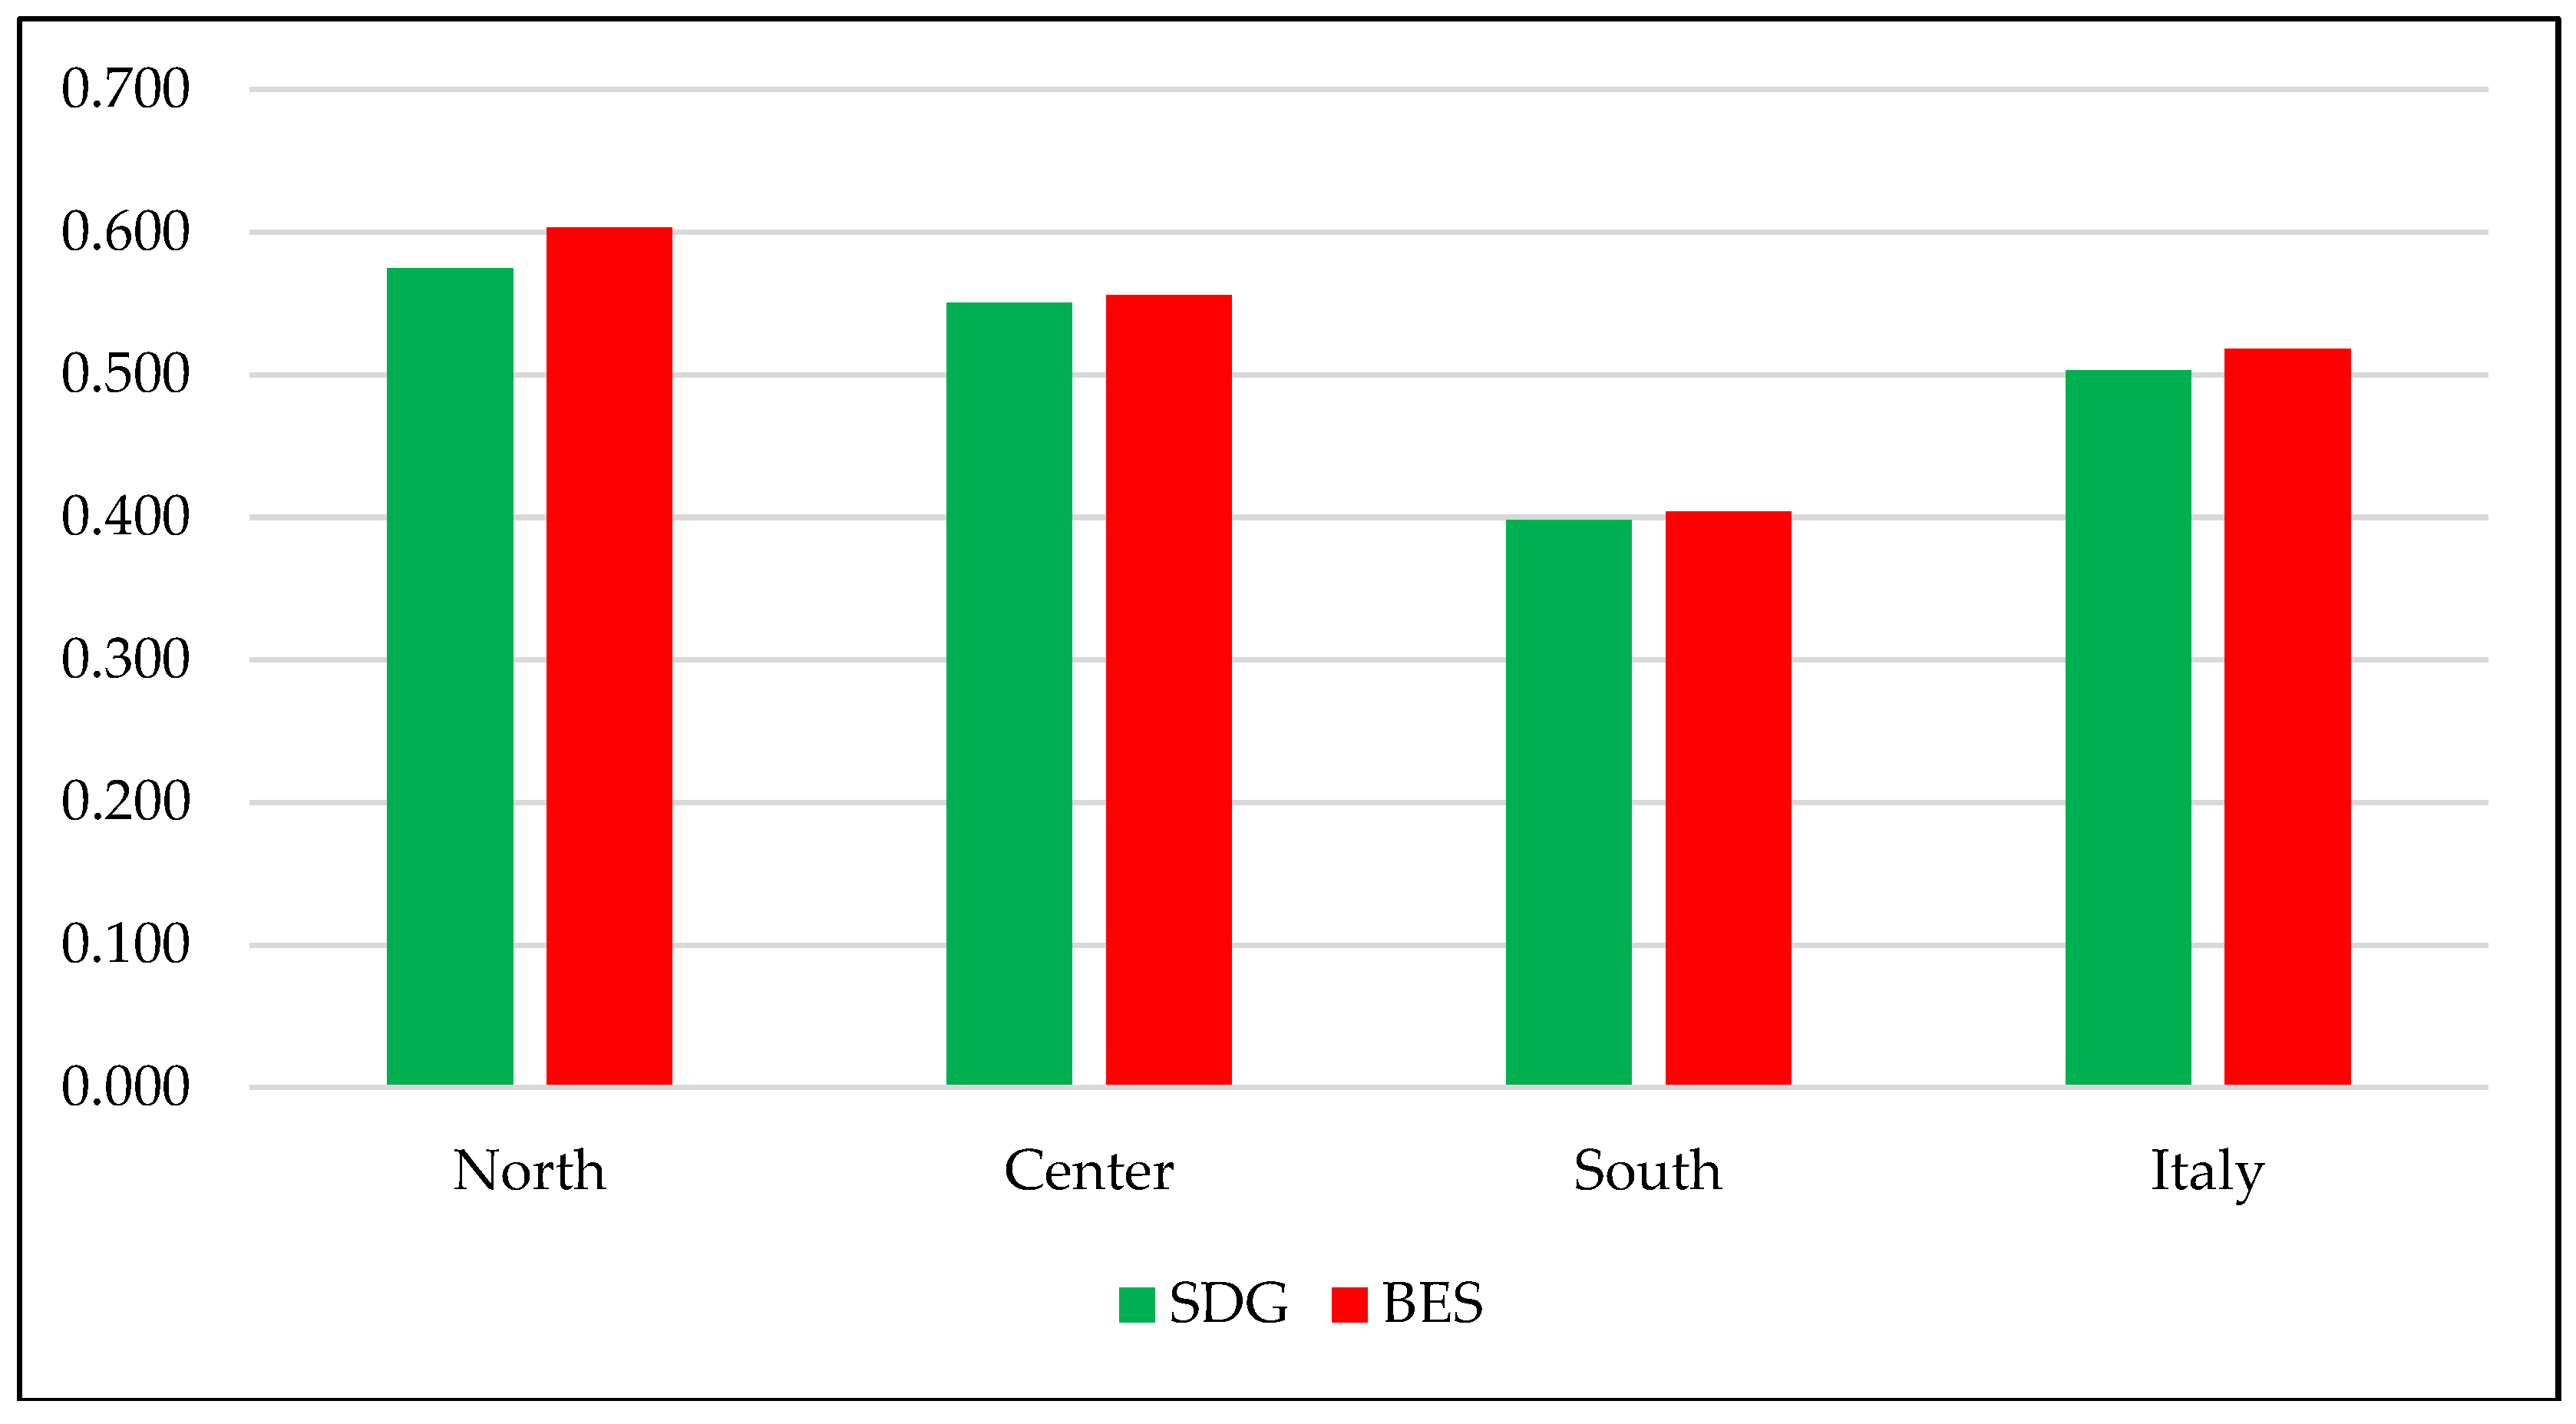
A useful analysis involved aggregating and disaggregating the results. The aggregation step considered the three Italian macro-areas (north, center and south) (Figure 4). In this analysis, no significant differences emerged between the two sets of indicators, although the delta between the north and center reduced when considering the SDGs due to the reduction in overall value. For instance, while Lombardia and Emilia-Romagna registered the most significant growth, the provinces of Trento and Bolzano followed the opposite direction. Thus, in the SDG ranking, the north (0.575) prevailed over the center (0.550). The difference with the south was much more pronounced, with the south recording the lowest-performing value (0.398), similar to that of the BES and on par with the central regions.
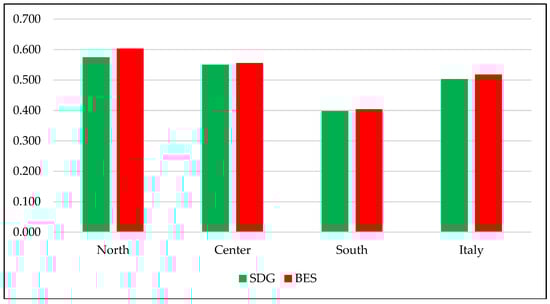
Figure 4.
SDG and BES comparison at the macro-geographical level.
In the disaggregation step, the results were broken down according to the three dimensions of sustainability (Table 8). In accordance with the literature, the following classification was used [43,44]:
- Economic dimension: SDGs 7, 8, 9, 11 and 12.
- Social dimension: SDGs 1, 2, 3, 4, 5, 10, 16 and 17.
- Environmental dimension: SDGs 6, 13, 14 and 15 (SDG 14 was not included due to data unavailability).
Table 8.
The three dimensions of sustainability: SDG side.
Table 8.
The three dimensions of sustainability: SDG side.
| Social Dimension | Environmental Dimension | Economic Dimension | ||||||
|---|---|---|---|---|---|---|---|---|
| 1 | Emilia-Romagna | 0.641 | 1 | Provincia Autonoma di Trento | 0.704 | 1 | Lombardia | 0.649 |
| 2 | Lombardia | 0.635 | 2 | Provincia Aut onoma di Bolzano | 0.653 | 2 | Provincia Autonomadi Bolzano | 0.618 |
| 3 | Provincia Autonoma di Trento | 0.622 | 3 | Valle d’Aosta | 0.645 | 3 | Provincia Autonoma di Trento | 0.574 |
| 4 | Toscana | 0.611 | 4 | Toscana | 0.637 | 4 | Veneto | 0.544 |
| 5 | Umbria | 0.609 | 5 | Sardegna | 0.627 | 5 | Emilia-Romagna | 0.539 |
| 6 | Friuli-Venezia Giulia | 0.606 | 6 | Liguria | 0.605 | 6 | Friuli-Venezia Giulia | 0.525 |
| 7 | Valle d’Aosta | 0.587 | 7 | Basilicata | 0.598 | 7 | Lazio | 0.523 |
| 8 | Veneto | 0.585 | 8 | Lazio | 0.584 | 8 | Toscana | 0.502 |
| 9 | Marche | 0.569 | 9 | Abruzzo | 0.581 | 9 | Piemonte | 0.490 |
| 10 | Piemonte | 0.563 | 10 | Friuli-Venezia Giulia | 0.570 | 10 | Valle d’Aosta | 0.472 |
| 11 | Lazio | 0.540 | 11 | Emilia-Romagna | 0.570 | 11 | Liguria | 0.463 |
| 12 | Liguria | 0.540 | 12 | Molise | 0.549 | Italy | 0.454 | |
| 13 | Provincia Autonoma di Bolzano | 0.527 | Italy | 0.548 | 12 | Marche | 0.441 | |
| 14 | Abruzzo | 0.523 | 13 | Umbria | 0.535 | 13 | Umbria | 0.440 |
| Italy | 0.521 | 14 | Veneto | 0.519 | 14 | Basilicata | 0.395 | |
| 15 | Molise | 0.478 | 15 | Piemonte | 0.499 | 15 | Abruzzo | 0.392 |
| 16 | Sardegna | 0.449 | 16 | Marche | 0.499 | 16 | Sardegna | 0.380 |
| 17 | Puglia | 0.412 | 17 | Puglia | 0.475 | 17 | Molise | 0.355 |
| 18 | Basilicata | 0.387 | 18 | Campania | 0.470 | 18 | Campania | 0.351 |
| 19 | Sicilia | 0.363 | 19 | Sicilia | 0.412 | 19 | Puglia | 0.322 |
| 20 | Calabria | 0.350 | 20 | Lombardia | 0.408 | 20 | Sicilia | 0.280 |
| 21 | Campania | 0.345 | 21 | Calabria | 0.364 | 21 | Calabria | 0.275 |
Lombardia confirmed its leadership in the economic dimension (0.649), took second place in the social dimension (0.635, only 0.006 lower than its first position) and performed poorly in the environmental dimension (0.408), ranking only 20th, below the national average. Emilia-Romagna led in the social dimension, while the province of Trento led in the environmental dimension. Regions in the north were above the national average in the economic and social dimensions. However, in the environmental dimension, Lombardia, Piemonte and Veneto ranked below the national average. Central regions ranked above the national average only in the social dimension, and Marche and Umbria ranked below average in both the environmental and economic dimensions. Southern regions showed slightly different results: all were below the national average in the economic dimension, while, in the social dimension, Abruzzo was just above, with a score of 0.523 (compared to the benchmark of 0.521). In the environmental dimension, Molise held a higher position with 0.549 (compared to the benchmark of 0.548), and Abruzzo rose to ninth place, exceeding the national average by 0.033.
To compare the three dimensions of sustainability related to the SDGs, we integrated BES indicators into the same dimensions (Table 9) as follows:
- Economic dimension: (i) economic well-being and (ii) innovation, research and creativity.
- Social dimension: (i) health, (ii) education and training, (iii) work and life time balance, (iv) social relationships, (v) policy and institutions, (vi) safety, (vii) subjective well-being, and (viii) quality of services.
- Environmental dimension: (i) landscape and cultural heritage and (ii) environment.
Table 9.
The three dimensions of sustainability: BES side.
Table 9.
The three dimensions of sustainability: BES side.
| Social Dimension | Environmental Dimension | Economic Dimension | ||||||
|---|---|---|---|---|---|---|---|---|
| 1 | Provincia Autonoma di Trento | 0.776 | 1 | Provincia Autonoma di Bolzano | 0.674 | 1 | Provincia Autonoma di Trento | 0.720 |
| 2 | Provincia Autonoma di Bolzano | 0.742 | 2 | Provincia Autonoma di Trento | 0.592 | 2 | Provincia Autonoma di Bolzano | 0.715 |
| 3 | Friuli-Venezia Giulia | 0.620 | 3 | Friuli-Venezia Giulia | 0.581 | 3 | Lazio | 0.676 |
| 4 | Valle d’Aosta | 0.604 | 4 | Umbria | 0.563 | 4 | Lombardia | 0.668 |
| 5 | Emilia-Romagna | 0.596 | 5 | Toscana | 0.557 | 5 | Friuli-Venezia Giulia | 0.654 |
| 6 | Lombardia | 0.576 | 6 | Valle d’Aosta | 0.530 | 6 | Emilia-Romagna | 0.651 |
| 7 | Veneto | 0.573 | 7 | Piemonte | 0.527 | 7 | Umbria | 0.639 |
| 8 | Toscana | 0.567 | 8 | Marche | 0.524 | 8 | Veneto | 0.639 |
| 9 | Lazio | 0.559 | 9 | Molise | 0.510 | 9 | Marche | 0.605 |
| 10 | Umbria | 0.557 | Italy | 0.495 | 10 | Toscana | 0.603 | |
| 11 | Marche | 0.545 | 10 | Abruzzo | 0.490 | 11 | Valle d’Aosta | 0.583 |
| 12 | Liguria | 0.545 | 11 | Veneto | 0.487 | Italy | 0.550 | |
| 13 | Piemonte | 0.543 | 12 | Lombardia | 0.484 | 12 | Liguria | 0.517 |
| Italy | 0.523 | 13 | Basilicata | 0.480 | 13 | Piemonte | 0.514 | |
| 14 | Abruzzo | 0.503 | 14 | Sardegna | 0.477 | 14 | Basilicata | 0.512 |
| 15 | Sardegna | 0.479 | 15 | Emilia-Romagna | 0.466 | 15 | Sardegna | 0.467 |
| 16 | Molise | 0.453 | 16 | Liguria | 0.451 | 16 | Puglia | 0.423 |
| 17 | Basilicata | 0.387 | 17 | Lazio | 0.448 | 17 | Molise | 0.421 |
| 18 | Puglia | 0.363 | 18 | Puglia | 0.406 | 18 | Calabria | 0.419 |
| 19 | Calabria | 0.353 | 19 | Calabria | 0.397 | 19 | Abruzzo | 0.419 |
| 20 | Campania | 0.332 | 20 | Sicilia | 0.378 | 20 | Sicilia | 0.365 |
| 21 | Sicilia | 0.322 | 21 | Campania | 0.368 | 21 | Campania | 0.333 |
The province of Trento confirmed its leadership in the economic and social dimensions, with scores of 0.720 and 0.776, respectively. It was followed in both cases by the province of Bolzano, with close scores of 0.715 and 0.742, respectively. For the environmental dimension, first place was obtained by the province of Bolzano (0.674), followed by the province of Trento, whose score was only 0.082 lower. Of note, in the social dimension, northern regions consistently scored above the national average. However, this was not the case in the other two dimensions. In the environmental dimension, Veneto, Lombardia, Emilia-Romagna and Liguria fell below the national average, as did Liguria and Piemonte in the economic dimension. Among the central regions, all were above the national average in the social and economic dimensions. Particularly in the economic dimension, Lazio took third place with a score of 0.676. However, in the environmental dimension, it was the only region below the national average, holding the 17th position with a score of 0.448 (0.047 away from the benchmark). Southern regions occupied the final positions in the ranking across all dimensions. In the social dimension, they were below the national average, led by Abruzzo, which ranked just below the average with a score of 0.503 (0.020 from the benchmark). In the economic dimension, Basilicata scored highest among these regions with a score of 0.512, which was still below the national average by 0.038. In the environmental dimension, Molise ranked just above the national average with a score of 0.510, exceeding the benchmark by 0.015. Abruzzo, similar to its performance in the social dimension, ranked just below the national average with a score of 0.490 (0.005 below the benchmark). Finally, in both types of indicators, the social dimension had the fewest regions below the national average. Conversely, the environmental dimension for the BES and the economic dimension for the SDGs had the least number of regions above the national average.
4.3. Clustering Sustainability Pillars
In this subsection, we present our comparative analysis of the SDG and BES indices, focusing on the social, environmental and economic dimensions. Our aim was to examine the relationship between these indices using scatterplots and Spearman correlations to gain insight into their interplay across Italian regions and their differences in capturing the multifaceted aspects of sustainability and well-being (Figure A8). In general, the Spearman correlation coefficient of 0.92 indicated a significant correlation between the two classifications.
4.3.1. Social Assessment
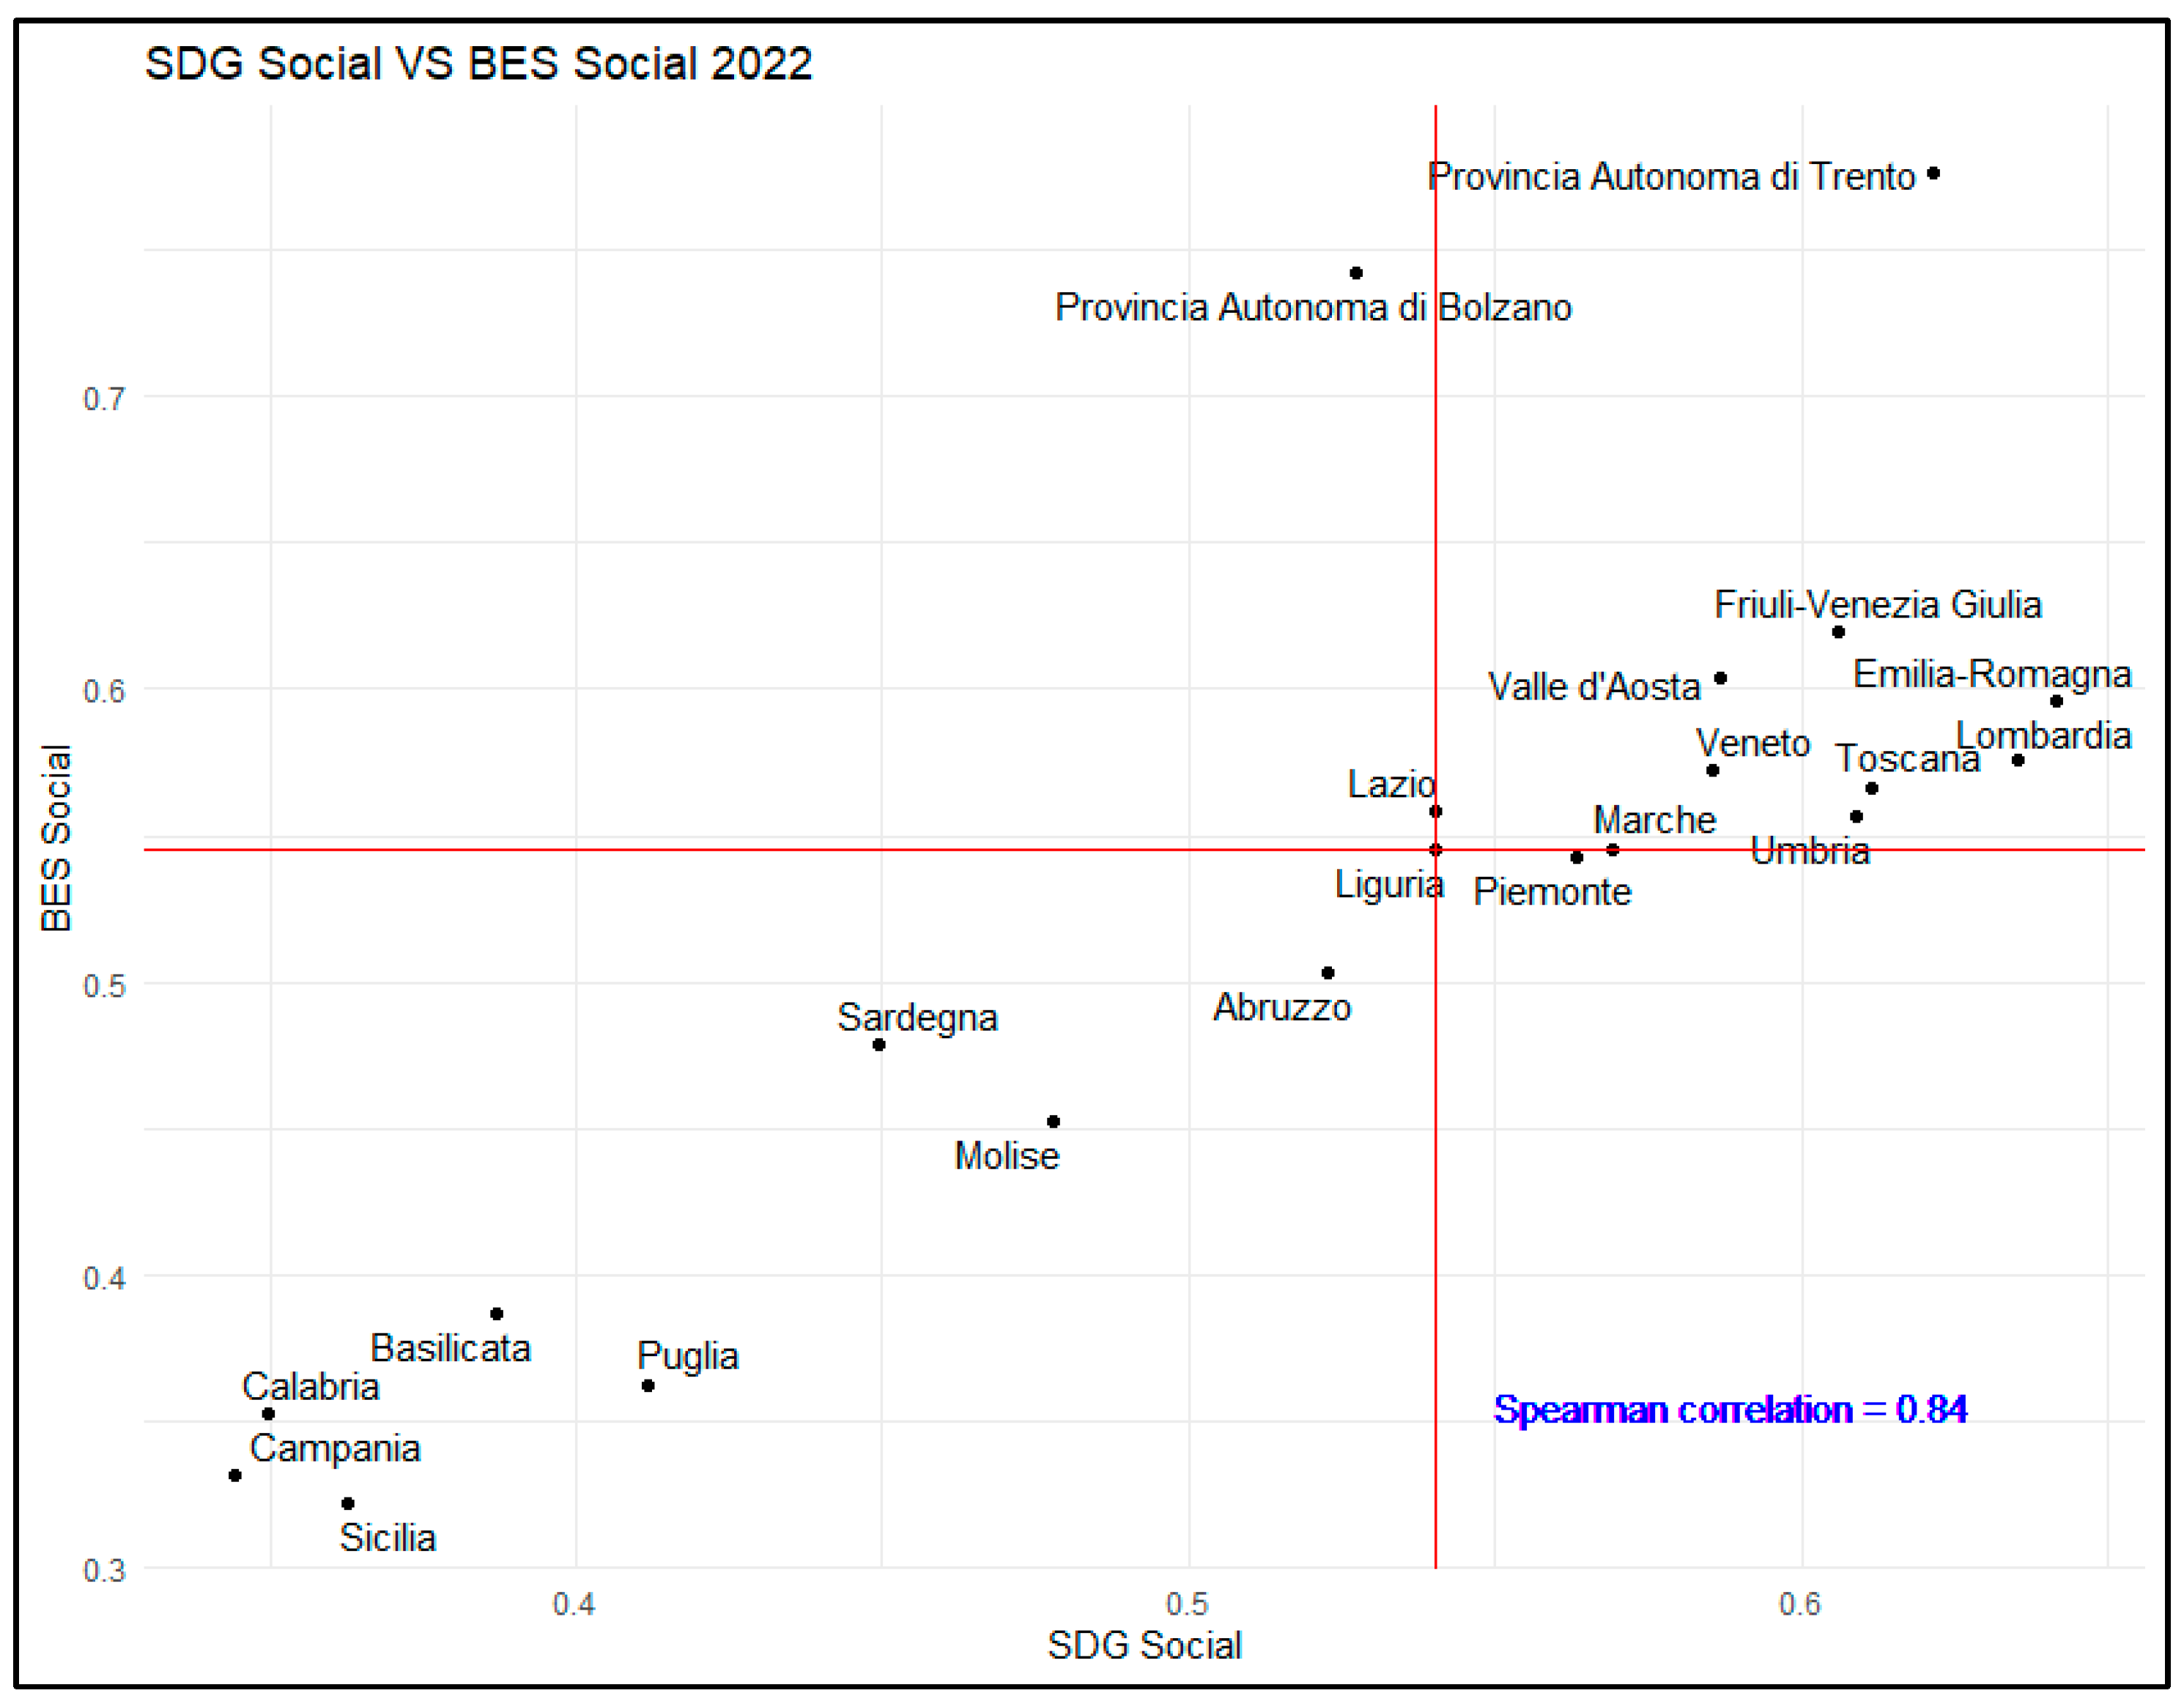
Figure 5 assesses the social aspect of sustainable development in the form of a scatterplot, with the SDG index on the x-axis and the BES index on the y-axis. Red lines indicate the respective medians of 0.540 for the SDG and 0.545 for the BES. The Spearman correlation coefficient of 0.84 indicated a strong linear correlation between the two indices. Here, we refer to the upper right quadrant, defined by high scores on both the SDG and the BES indices, as the UP quadrant. Notably, eight Italian territories fell into this quadrant: the province of Trento, Friuli-Venezia Giulia, Valle d’Aosta, Emilia-Romagna, Veneto, Toscana, Lombardia and Umbria. Marche did not belong in this quadrant as its score (0.545) fell exactly on the BES median, similar to Lazio and Liguria, with scores of 0.540.
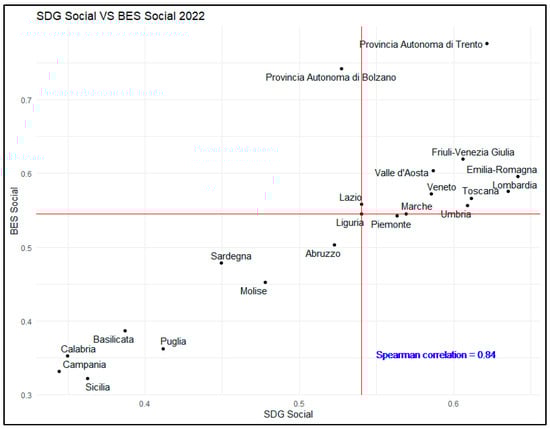
Figure 5.
SDG and BES: social dimension.
4.3.2. Environmental Assessment
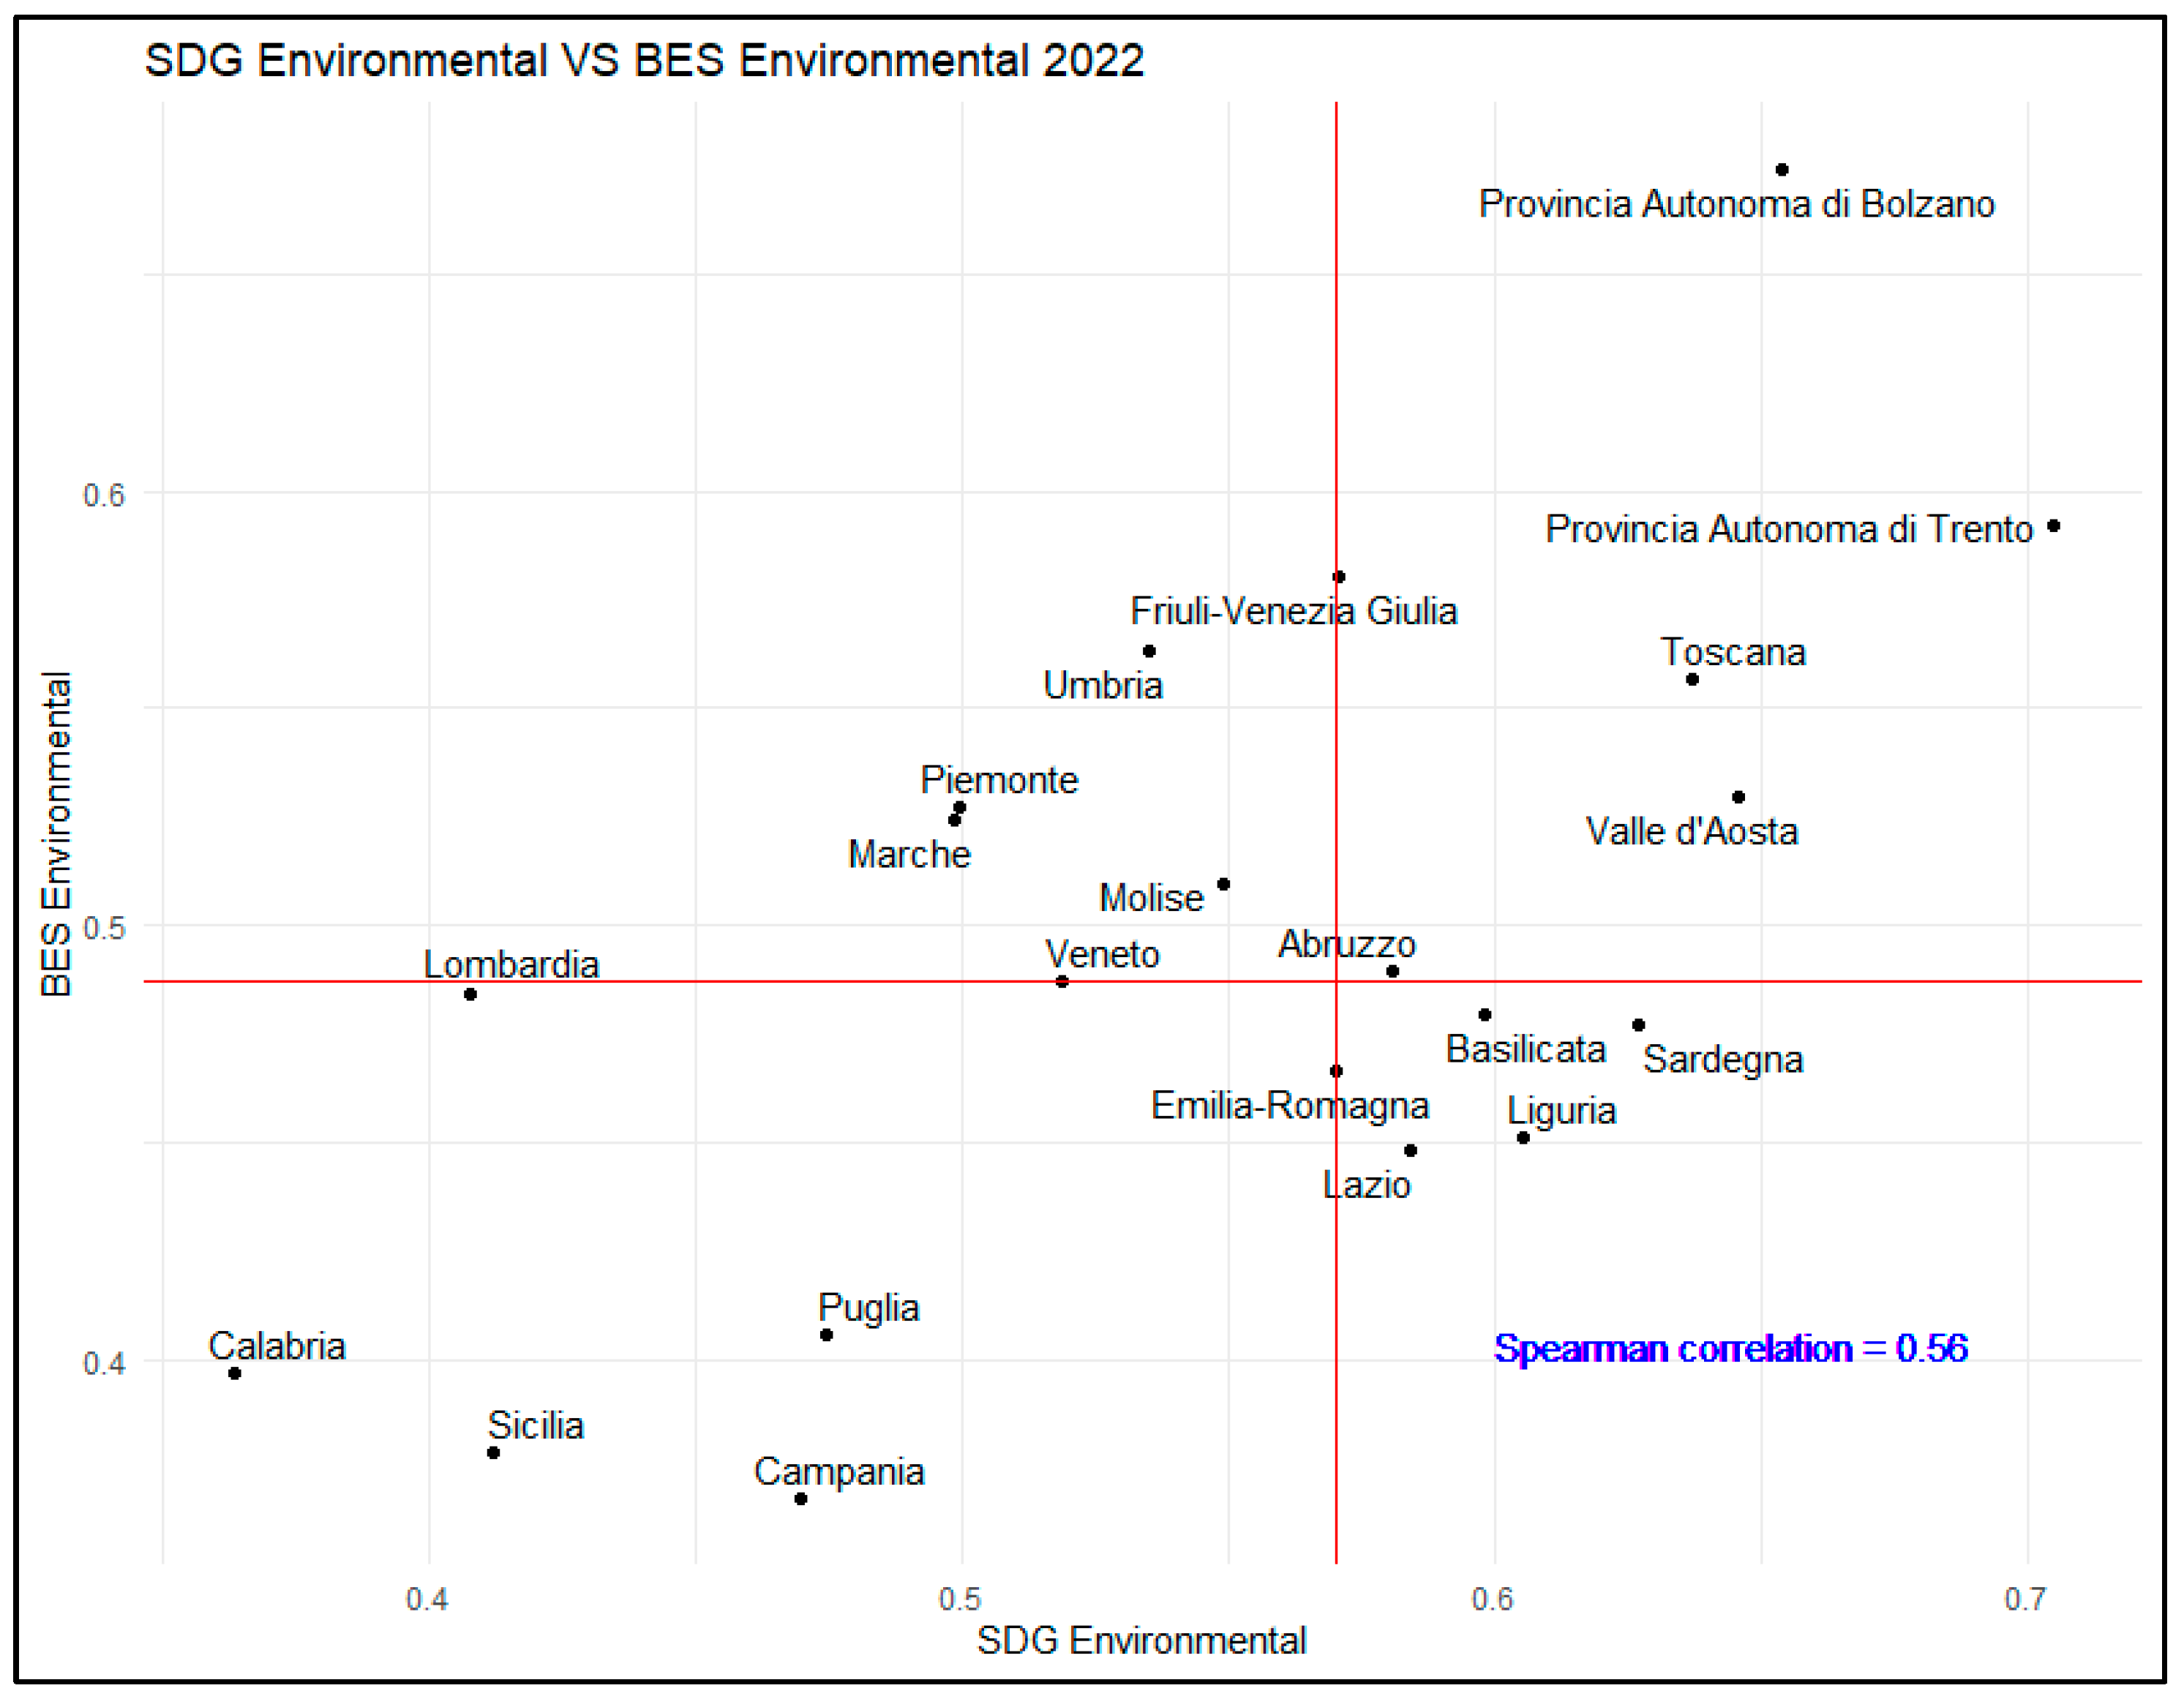
Figure 6 examines the environmental aspect of sustainable development in the form of a scatterplot. The median for the SDG index was 0.559, while that of the BES index was 0.488. The Spearman correlation coefficient of 0.56 was moderate, suggesting that the two indices weighed environmental aspects differently. In particular, the regions of Sardegna, Liguria, Basilicata, Lazio and Emilia-Romagna (which, despite appearing to be on the median, actually scored 0.570) scored highly on the SDG index for their environmental performance. However, they fell below the median for the BES index. This discrepancy suggests that, while these regions may excel in certain environmental indicators highlighted by the SDG framework, they may not perform as well when considering the broader range of environmental factors included in the BES index. Conversely, the four regions of Umbria, Piemonte, Marche and Molise (but not Veneto, which scored 0.48) scored highly on the BES index but fell below the SDG median. Six regions in the UP quadrant registered high environmental scores on both indices: the province of Bolzano, the province of Trento, Toscana, Valle d’Aosta, Abruzzo and Friuli-Venezia Giulia. This highlights the remarkable environmental performance of these regions, according to both indices.
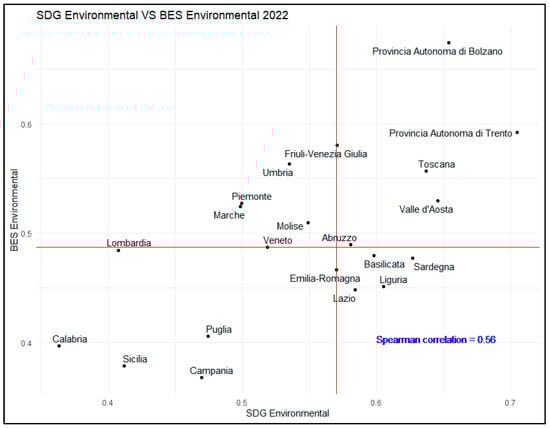
Figure 6.
SDG and BES: environmental dimension.
4.3.3. Economic Assessment
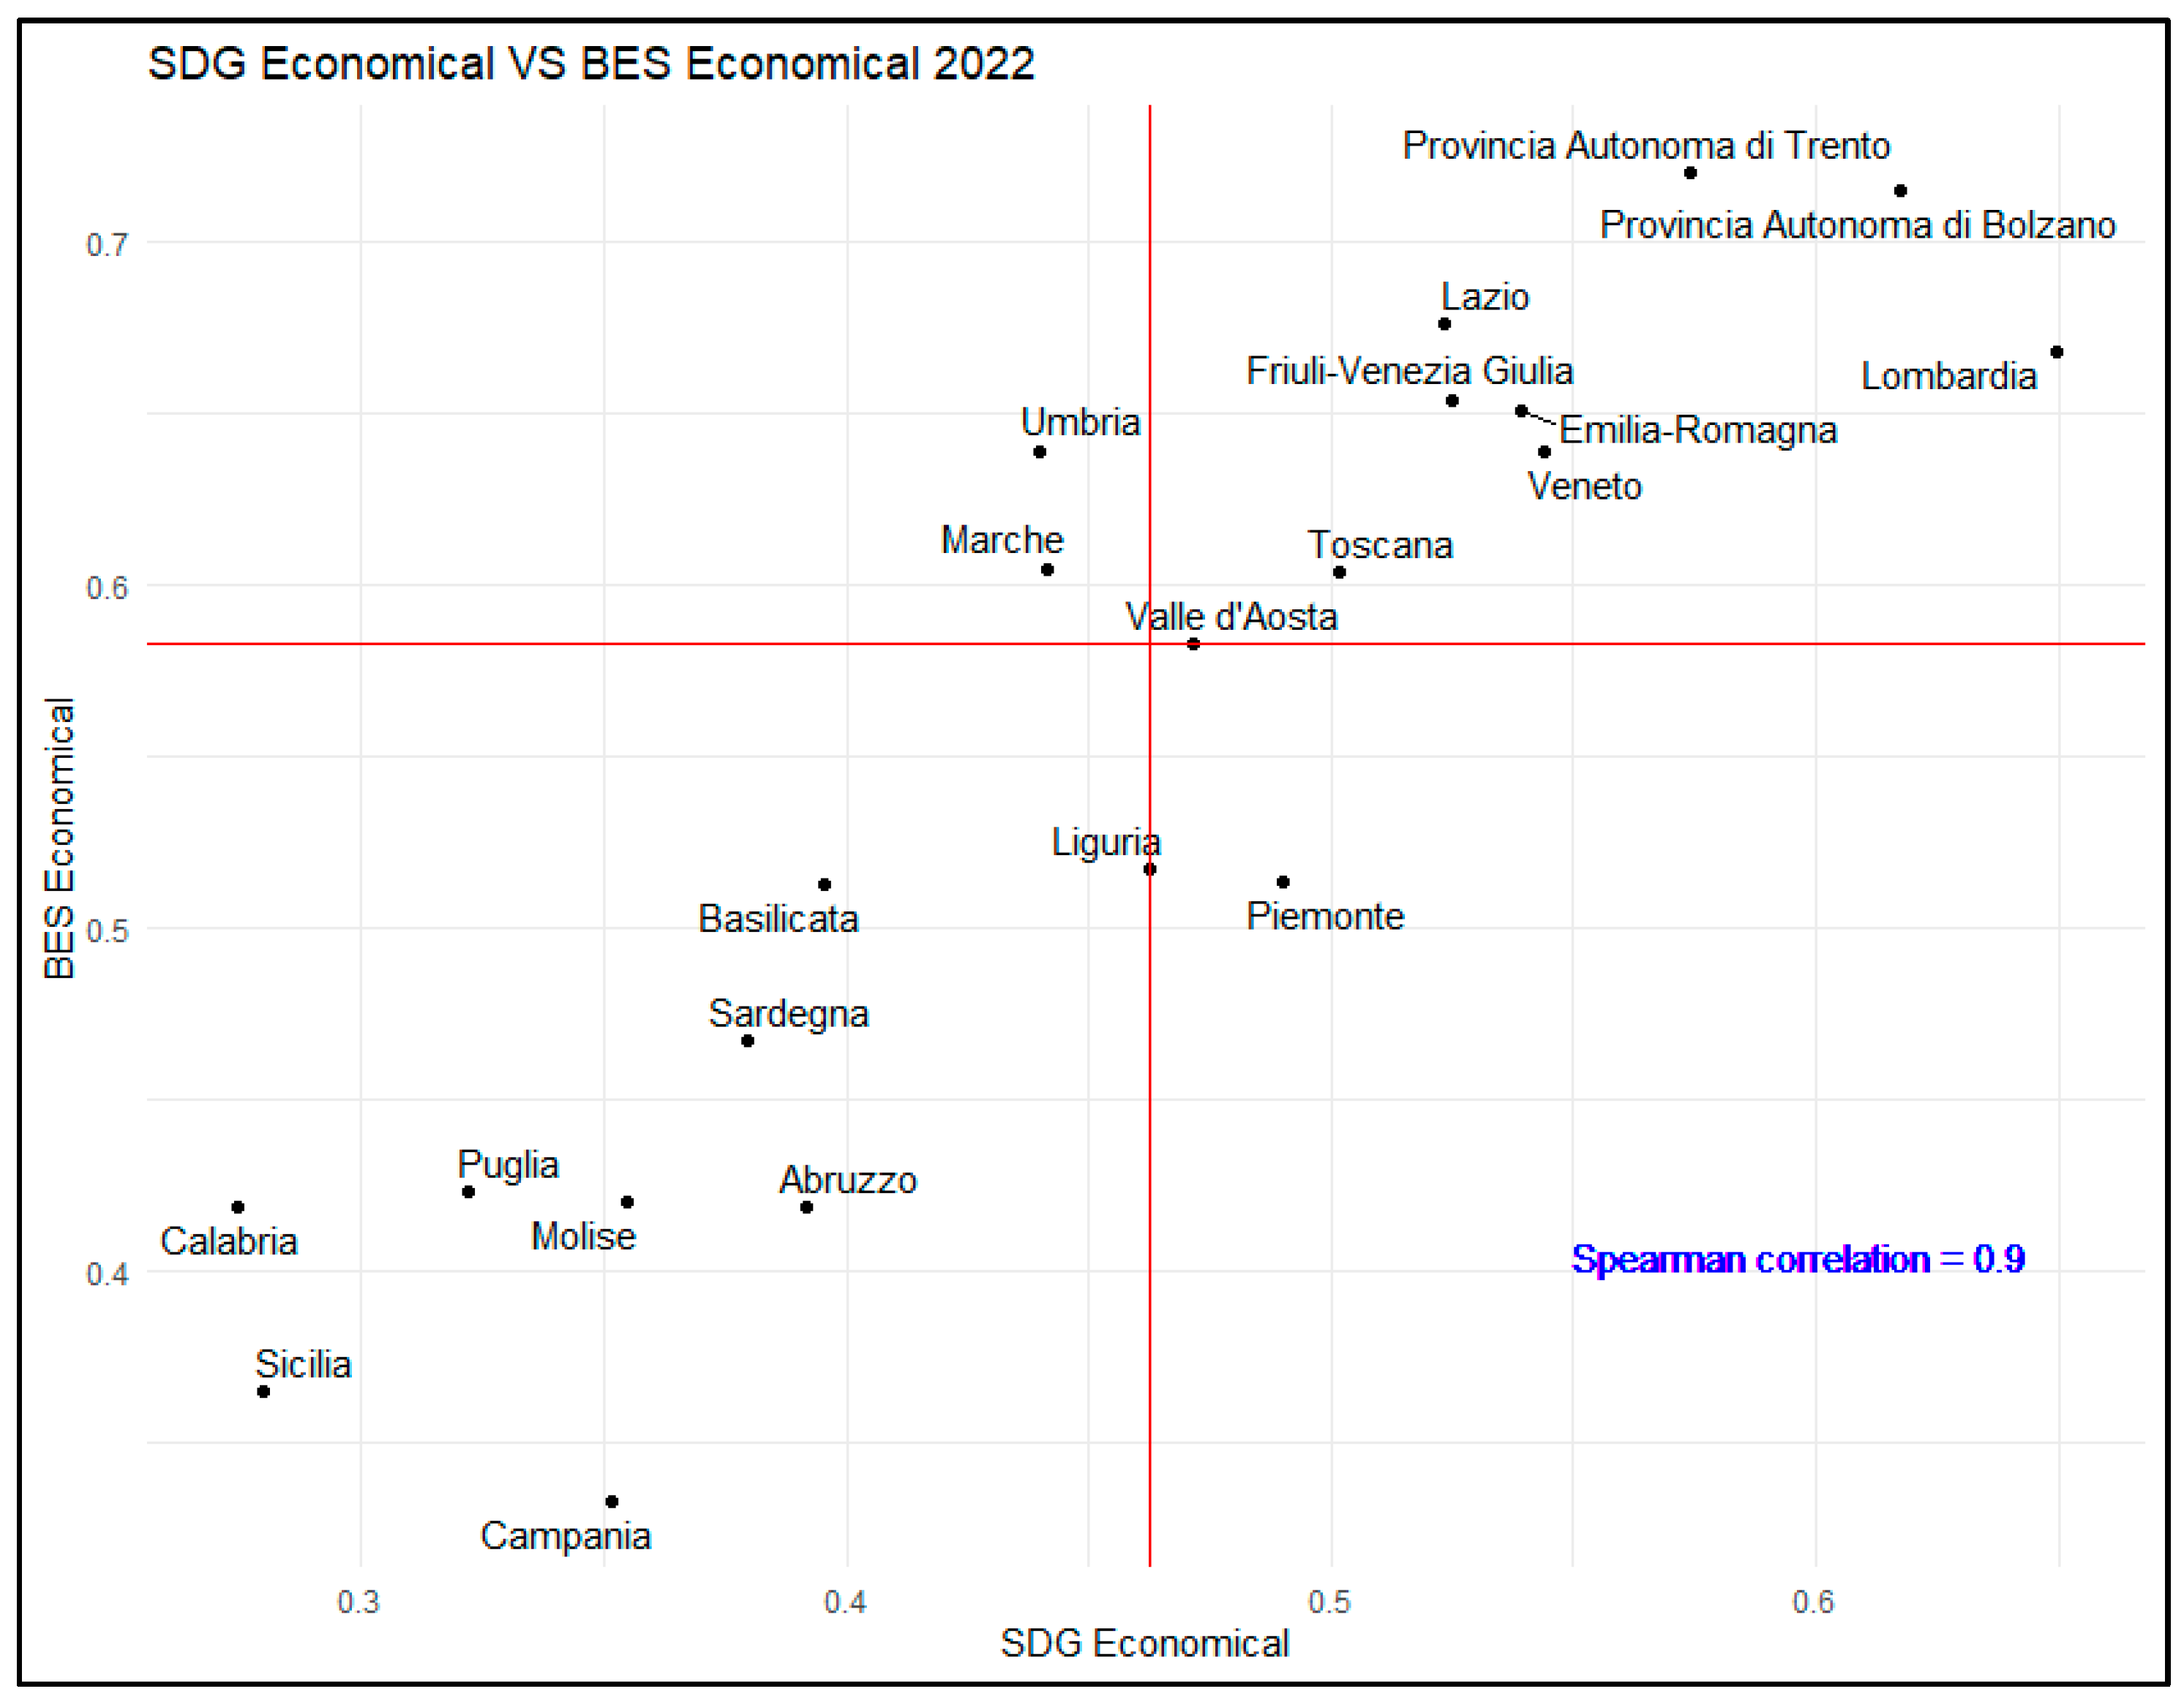
Figure 7 presents a comparative analysis of the economic aspect of the SDG and BES indices. The median for the SDG economic index was 0.458, while that for the BES index was 0.566. The Spearman correlation coefficient of 0.9 indicated a strong positive correlation between the two indices, representing the highest among the three dimensions. This suggested significant convergence in the assessment of economic aspects, with both indices broadly agreeing on the economic performance of the respective regions. Nine regions fell in the UP quadrant, demonstrating high economic scores on both indices: the province of Trento, the province of Bolzano, Lombardia, Lazio, Friuli-Venezia Giulia, Emilia-Romagna, Veneto, Toscana and Valle d’Aosta. Notably, Valle d’Aosta, while aligned with the BES median, actually exceeded the median score with a value of 0.583. This convergence highlights the consistency in the assessment of economic performance across regions, providing valuable insight into areas of economic strength and potential strategies for enhancing economic sustainability.
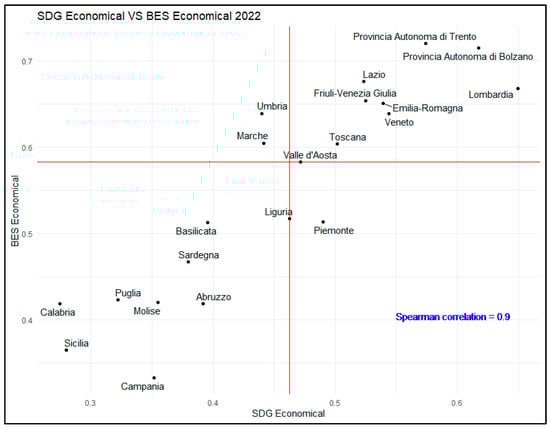
Figure 7.
SDG and BES: economic dimension.
4.3.4. Mapping Italian Regional Performance
Finally, we summarized the results of our previous analysis by mapping Italian regions according to their relative scores in the scatterplots. In more detail, we assigned a score to each region based on its presence in the UP quadrant: 1 if present once, 2 if present twice and 3 if present three times. Notably, the provinces of Bolzano and Trento were treated as a single entity, Trentino-Alto Adige.
Figure 8 shows the results of this clustering analysis:
- Four regions scored 3: Trentino-Alto Adige, Toscana, Friuli-Venezia Giulia and Valle d’Aosta.
- Three regions scored 2: Emilia-Romagna, Lombardia and Veneto.
- Three regions scored 1: Umbria, Lazio and Abruzzo.
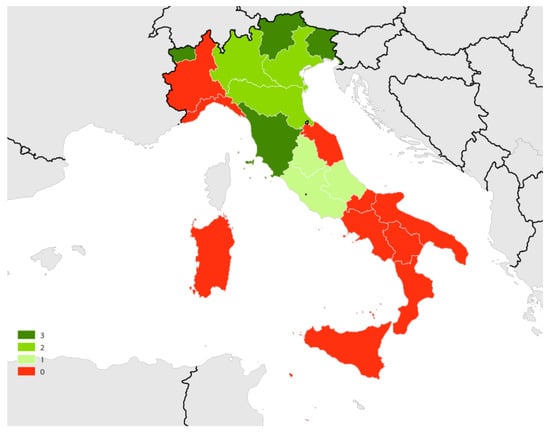
Figure 8.
Clustering sustainability pillars in Italian regions.
Figure 8.
Clustering sustainability pillars in Italian regions.

The analysis also revealed that three regions narrowly missed being ranked with a score of 1: Marche, Liguria and Piemonte, due to their slightly below-average scores in the social dimension. The findings also revealed interesting patterns in regional sustainability performance across Italy. In particular, three of the four regions scoring 3 were located in the north, with Trentino-Alto Adige and Friuli-Venezia Giulia all falling in the northeast. All regions scoring 2 were also in northern Italy. In central Italy, only Toscana scored 3 and two regions scored 2. Conversely, in southern Italy, only Abruzzo scored 1, while all other southern regions scored 0. Overall, northeastern regions emerged as the top performers, with all scoring 3 or 2. Southern Italy, however, showed lower performance across the board. These observations underline regional disparities in sustainability performance, highlighting potential areas for targeted interventions and policy initiatives to promote more equitable and balanced development across Italy.
5. Discussion
While the topic of sustainability has gained significant traction in recent years, some stakeholders remain focused solely on their own benefits. Consequently, phenomena such as green economy rebound, circular economy rebound and greenwashing have emerged [45,46,47,48], necessitating appropriate management to prevent a loss of public confidence. Public involvement is crucial for sustainability efforts, as highlighted by the prominence of the word “human” in the co-occurrence network (Figure 2). Some authors have called for new regulatory approaches and business models, emphasizing that “progress is too slow” and societal value creation remains underutilized [49].
The SDGs have gained fundamental relevance within the scientific community and civil society. Previously considered niche, the urgent need to address climate change has elevated these goals to a central focus. In particular, this urgency has underscored the need to develop innovative ideas and concepts to support SDG achievement, prompting the development of a new section within sustainability [50]. Thus, a vision of a sustainable community requires interdisciplinary contributions from various perspectives [51,52,53].
Local and global analyses often have different scopes of analysis, stakeholder categories may have different interests, and indicators sometimes provide competing information. This paper built on a review of the literature [29,30,31], showing that the BES and SDG indices are complementary while providing distinct insights. The results obtained from the analysis must now be integrated with the existing literature [37].
The first methodological contribution of this research was the creation of scatterplots ranking alternatives based on the two sets of indicators across the three dimensions of sustainability. The interplay between economic well-being and the SDGs is not only an Italian priority but also a European one [54].
From this analysis, a second consideration emerged, this time of a managerial nature. The cluster analysis made it possible to redefine the geographical structure of Italy, showing that it cannot be divided into north, center and south according to SDG and BES indicators. In fact, the data revealed that the northeast significantly outperformed the northwest (0.586 vs. 0.560 at the SDG level and 0.645 vs. 0.552 at the BES level). Additionally, values in the center were close to those registered in the northwest. Interestingly, among the southern regions, Abruzzo performed similarly to the central regions, reducing the overall value by only 0.012 in terms of the SDGs and 0.015 with respect to the BES. This suggests that central regions have great potential, demonstrated by Abruzzo’s strong performance in the environmental dimension, Lazio’s in the economic dimension and Umbria’s in the social dimension, combined with Toscana’s strong performance across all three dimensions. Although Marche narrowly missed the mark in the social dimension, it could still make a fundamental contribution. This shows that the realization of a sustainable community in these regions, facilitated by the exchange of services and products, may generate a competitive macro-area. This requires further data monitoring, which is already showing growth in these regions and the northeast’s superior performance [4].
The “Made in Italy” brand aims to integrate regional disparities, rather than highlight them, to produce unique brands that are globally competitive [37]. However, this integration cannot overlook existing disparities, particularly in southern Italy. The south’s potential, while significant, has yet to be fully and efficiently harnessed. Promoting the south will be essential for achieving balanced regional development in Italy and upholding the Italian pillars of sustainability. In addition, promoting technological innovation in the south may contribute to what many consider the fourth pillar of sustainability. By leveraging each region’s unique strengths and fostering nationwide collaboration, Italy may advance towards holistic sustainability and enhance its global competitiveness under the “Made in Italy” banner. The involvement of new generations, alongside the experience of older generations, will be crucial for building sustainable community models based on skills and resources [47].
Finally, we must highlight a third implication, which is political. The use of European funds should not focus solely on individual territories but incorporate a future vision incorporating points of interconnection and uniting the Adriatic with the Tyrrhenian to achieve significant logistical advantages. In central Italy, cohesion between national and local governments may provide political stability and a comprehensive perspective, thereby supporting the interception of European funds and promoting green, circular and digital projects. Important initiatives include those of Abruzzo, Marche and Umbria, along with their respective “confindustries” universities and industrial development companies. These entities have collaborated in the Hamu (Hub Abruzzo Marche Umbria) project, experimenting with ecosystem building and value generation in central Italy. These territories should foster the degree of attractiveness to their own talents and those from other countries. A further collaborative effort involves the financial institutions of Lazio, Abruzzo, Marche and Umbria, which have signed a partnership agreement on European Funds in Rome.
Central Italy currently represents a model of sustainable innovation that should aspire to emulate the performance of northeastern regions. A divided and fragmented Italy hindered by ideological visions has no future. We must therefore pursue a pragmatic vision that recognizes the great challenge of sustainability: overcoming personal selfishness to protect ecosystems and achieve the triple goal of economic performance, environmental protection and social progress. Indicators allow decision-makers and the public to monitor the performance of individual territories towards this goal. While the SDG and BES indicators share some criteria, their rankings reveal critical differences, indicating that their outputs are complementary, rather than redundant. This highlights the importance of developing new tools to integrate these rankings.
Limitations of the present work include the time period of reference, which could be extended in future research. In this regard, close monitoring of the relevant data will be necessary to assess regional performance in light of interregional policies. In addition, it may be useful to study the relationships between these data and those related to the implementation of sustainability goals by universities in their respective territories. Such research may also open up a social perspective, exploring how these indicators might influence young people’s choice of university and base for skills training. Further analysis could evaluate the present results concerning culture and income readiness, providing assessments at the macro-geographical level.
The SDG–BES pairing promotes ethical sustainability, engaging individuals’ religious and philosophical beliefs to facilitate an ecological consciousness that may restore the human–nature relationship.
6. Conclusions
The great challenge of sustainability is to overcome personal selfishness, as this is crucial for protecting ecosystems and achieving the threefold goal of economic performance, environmental protection and social progress. Indicators allow decision-makers and the public to monitor the performance of individual territories towards this goal. Although the SDG and BES indicators share some criteria, their rankings also highlight some differences. Consequently, their outputs are complementary, rather than redundant, emphasizing the need for tools capable of integrating the different rankings.
In the present study, a cluster analysis was conducted to differentiate the various territorial realities. The regions of Trentino-Alto Adige, Toscana, Friuli-Venezia Giulia and Valle d’Aosta scored highly across all three dimensions of sustainability. Emilia-Romagna, Lombardia and Veneto performed positively in two of the three dimensions and Umbria, Lazio and Abruzzo achieved similar results in one dimension. Regions outside these clusters have gaps that require strengthening. However, the present work did not aim to highlight territorial differences but attempted to suggest actions to enhance sustainability contributions from all regions.
In this direction, reintroducing the “Made in Italy” concept may foster the development of an innovative, sustainable model based on territorial cooperation and related synergies, thereby maximizing the use of resources and skills to enhance global competition.
The present findings showed strong performances by regions in the northeast and center of Italy. To overcome the north–south divide, some southern regions must improve their performance, and the present analysis indicated that this is starting to happen. There are many challenges ahead, but with a stable political climate and proactive decision-making, the dream of a more sustainable country may become a reality. Present issues must be addressed with foresight to ensure that benefits are generated for a wide range of stakeholder categories.
Author Contributions
Conceptualization, I.D., C.D.C., M.G., E.N.R. and A.F.U.; methodology, I.D., C.D.C., M.G., E.N.R. and A.F.U.; data curation, I.D., C.D.C., M.G., E.N.R. and A.F.U.; writing—original draft preparation, I.D., C.D.C., M.G., E.N.R. and A.F.U.; writing—review and editing, I.D., C.D.C., M.G., E.N.R. and A.F.U.; supervision, I.D. All authors have read and agreed to the published version of the manuscript.
Funding
This research received no external funding.
Institutional Review Board Statement
Not applicable.
Informed Consent Statement
Not applicable.
Data Availability Statement
The original contributions presented in the study are included in the article, further inquiries can be directed to the corresponding author.
Acknowledgments
This study was carried out within the PEACE (Protecting the Environment: Advances in Circular Economy) study, which received funding from the “Fondo per il Programma Nazionale di Ricerca e Progetti di Rilevante Interesse Nazionale (PRIN)” Investimento M4.C2.1.1-D.D. 104.02-02-2022, 2022ZFBMA4 funded by the European Union-Next Generation EU. This manuscript reflects only the authors’ views and opinions, and the authors can be considered solely responsible for them.
Conflicts of Interest
The authors declare no conflicts of interest.
Appendix A
Table A1.
Trend of published articles per Web of Science categories (top 10 categories).
Table A1.
Trend of published articles per Web of Science categories (top 10 categories).
| Category | Number of Published Articles |
|---|---|
| Environmental sciences | 9554 |
| Green sustainable science technology | 7153 |
| Environmental studies | 6023 |
| Energy fuels | 1892 |
| Public environmental occupational health | 1684 |
| Economics | 1519 |
| Engineering environmental | 1483 |
| Management | 1305 |
| Business | 1290 |
| Education educational research | 1180 |
Table A2.
Trend of published papers per country (top 10 countries).
Table A2.
Trend of published papers per country (top 10 countries).
| Country | Number of Published Articles |
|---|---|
| China | 5706 |
| USA | 4085 |
| UK | 3256 |
| India | 2737 |
| Spain | 2248 |
| Australia | 2081 |
| Italy | 1823 |
| Germany | 1703 |
| South Africa | 1350 |
| Canada | 1332 |
Table A3.
Trend of published papers per Web of Science index.
Table A3.
Trend of published papers per Web of Science index.
| WoS Index | Number of Published Articles |
|---|---|
| Science Citation Index Expanded (SCI-EXPANDED) | 18,246 |
| Social Sciences Citation Index (SSCI) | 12,516 |
| Emerging Sources Citation Index (ESCI) | 6877 |
| Conference Proceedings Citation Index-Science (CPCI-S) | 1033 |
| Book Citation Index—Social Sciences & Humanities (BKCI-SSH) | 465 |
Table A4.
Trend of published papers per SDG.
Table A4.
Trend of published papers per SDG.
| SDG | Description | Number of Published Articles |
|---|---|---|
| 13 | Climate action | 5927 |
| 3 | Good health and well-being | 4495 |
| 11 | Sustainable cities and communities | 3632 |
| 15 | Life on land | 2685 |
| 12 | Responsible consumption and production | 2295 |
| 1 | No poverty | 2125 |
| 6 | Clean water and sanitation | 1799 |
| 2 | Zero hunger | 1789 |
| 9 | Industry, innovation and infrastructure | 1671 |
| 7 | Affordable and clean energy | 1591 |
| 4 | Quality education | 1278 |
| 10 | Reduced inequality | 723 |
| 8 | Decent work and economic growth | 709 |
| 14 | Life below water | 690 |
| 5 | Gender equality | 519 |
| 16 | Peace and justice strong institutions | 216 |
Table A5.
Advanced search.
Table A5.
Advanced search.
| Section | Query String |
|---|---|
| 2.1 (Economic) | TITLE-ABS-KEY ( ( sustainable AND development AND goals OR sdgs ) AND economic AND sustainability ) AND PUBYEAR > 2019 AND PUBYEAR < 2025 AND ( LIMIT-TO ( DOCTYPE , “ar” ) ) AND ( LIMIT-TO ( LANGUAGE , “English” ) |
| 2.2 (Environmental) | TITLE-ABS-KEY ( ( sustainable AND development AND goals OR sdgs ) AND environmental AND sustainability ) AND PUBYEAR > 2019 AND PUBYEAR < 2025 AND ( LIMIT-TO ( DOCTYPE , “ar” ) ) AND ( LIMIT-TO ( LANGUAGE , “English” ) ) |
| 2.3 (Social) | TITLE-ABS-KEY ( ( sustainable AND development AND goals OR sdgs ) AND social AND sustainability ) AND PUBYEAR > 2019 AND PUBYEAR < 2025 AND ( LIMIT-TO ( DOCTYPE , “ar” ) ) AND ( LIMIT-TO ( LANGUAGE , “English” ) ) |
| 2.4 (Global) | TITLE-ABS-KEY ( sdgs OR sustainable AND development AND goals ) AND PUBYEAR > 2022 AND PUBYEAR < 2025 AND ( LIMIT-TO ( LANGUAGE , “English” ) ) AND ( LIMIT-TO ( DOCTYPE , “ar” ) ) |
Table A6.
Percentage variation between each region’s SDG score compared with every other region. The following acronyms are used: R1: Lombardia; R2: Provincia Autonoma di Trento; R3: Emilia-Romagna; R4: Toscana; R5: Friuli-Venezia Giulia; R6: Veneto; R7: Provincia Autonoma di Bolzano; R8: Valle d’Aosta; R9: Umbria; R10: Piemonte; R11: Lazio; R12: Marche; R13: Liguria; R14: Abruzzo; R15: Molise; R16: Sardegna; R17: Basilicata; R18: Puglia; R19: Campania; R20: Sicilia; R21: Calabria.
| R1 | R2 | R3 | R4 | R5 | R6 | R7 | R8 | R9 | R10 | R11 | R12 | R13 | R14 | R15 | R16 | R17 | R18 | R19 | R20 | R21 | |
|---|---|---|---|---|---|---|---|---|---|---|---|---|---|---|---|---|---|---|---|---|---|
| R1 | |||||||||||||||||||||
| R2 | 2% | ||||||||||||||||||||
| R3 | 3% | 1% | |||||||||||||||||||
| R4 | 8% | 5% | 5% | ||||||||||||||||||
| R5 | 8% | 6% | 5% | 0% | |||||||||||||||||
| R6 | 10% | 8% | 7% | 2% | 2% | ||||||||||||||||
| R7 | 12% | 9% | 8% | 3% | 3% | 1% | |||||||||||||||
| R8 | 13% | 10% | 9% | 4% | 4% | 2% | 1% | ||||||||||||||
| R9 | 13% | 10% | 9% | 5% | 5% | 3% | 1% | 0% | |||||||||||||
| R10 | 16% | 14% | 13% | 8% | 8% | 6% | 4% | 3% | 3% | ||||||||||||
| R11 | 16% | 14% | 13% | 8% | 8% | 6% | 4% | 3% | 3% | 0% | |||||||||||
| R12 | 19% | 16% | 15% | 10% | 10% | 8% | 6% | 5% | 5% | 2% | 2% | ||||||||||
| R13 | 25% | 22% | 21% | 15% | 15% | 13% | 12% | 11% | 10% | 7% | 7% | 5% | |||||||||
| R14 | 29% | 26% | 25% | 19% | 19% | 17% | 15% | 14% | 14% | 10% | 10% | 8% | 3% | ||||||||
| R15 | 41% | 37% | 36% | 30% | 30% | 28% | 26% | 25% | 24% | 21% | 21% | 18% | 13% | 9% | |||||||
| R16 | 43% | 39% | 38% | 32% | 32% | 30% | 28% | 27% | 26% | 23% | 23% | 20% | 15% | 11% | 2% | ||||||
| R17 | 56% | 52% | 51% | 45% | 44% | 42% | 406 | 39% | 38% | 34% | 34% | 31% | 25% | 21% | 11% | 9% | |||||
| R18 | 61% | 58% | 56% | 49% | 49% | 46% | 44% | 43% | 43% | 38% | 38% | 36% | 29% | 25% | 15% | 13% | 3% | ||||
| R19 | 77% | 73% | 72% | 64% | 64% | 61% | 59% | 57% | 57% | 52% | 52% | 49% | 42% | 38% | 26% | 24% | 14% | 10% | |||
| R20 | 84% | 80% | 78% | 70% | 70% | 67% | 65% | 63% | 63% | 58% | 58% | 55% | 47% | 43% | 31% | 29% | 18% | 14% | 4% | ||
| R21 | 91% | 86% | 85% | 77% | 77% | 73% | 71% | 69% | 69% | 64% | 64% | 61% | 53% | 48% | 36% | 34% | 22% | 18% | 8% | 4% |
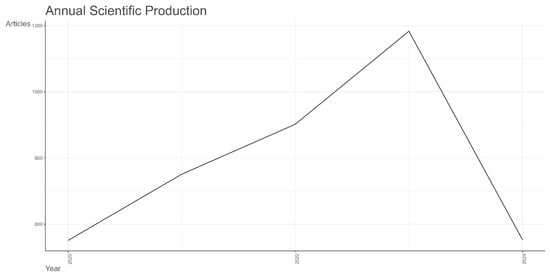
Figure A1.
Annual scientific production: economic sustainability.
Figure A1.
Annual scientific production: economic sustainability.

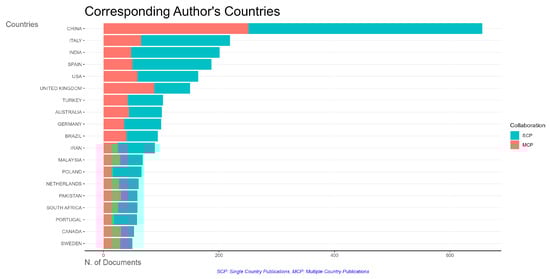
Figure A2.
Corresponding authors’ countries: economic sustainability.
Figure A2.
Corresponding authors’ countries: economic sustainability.
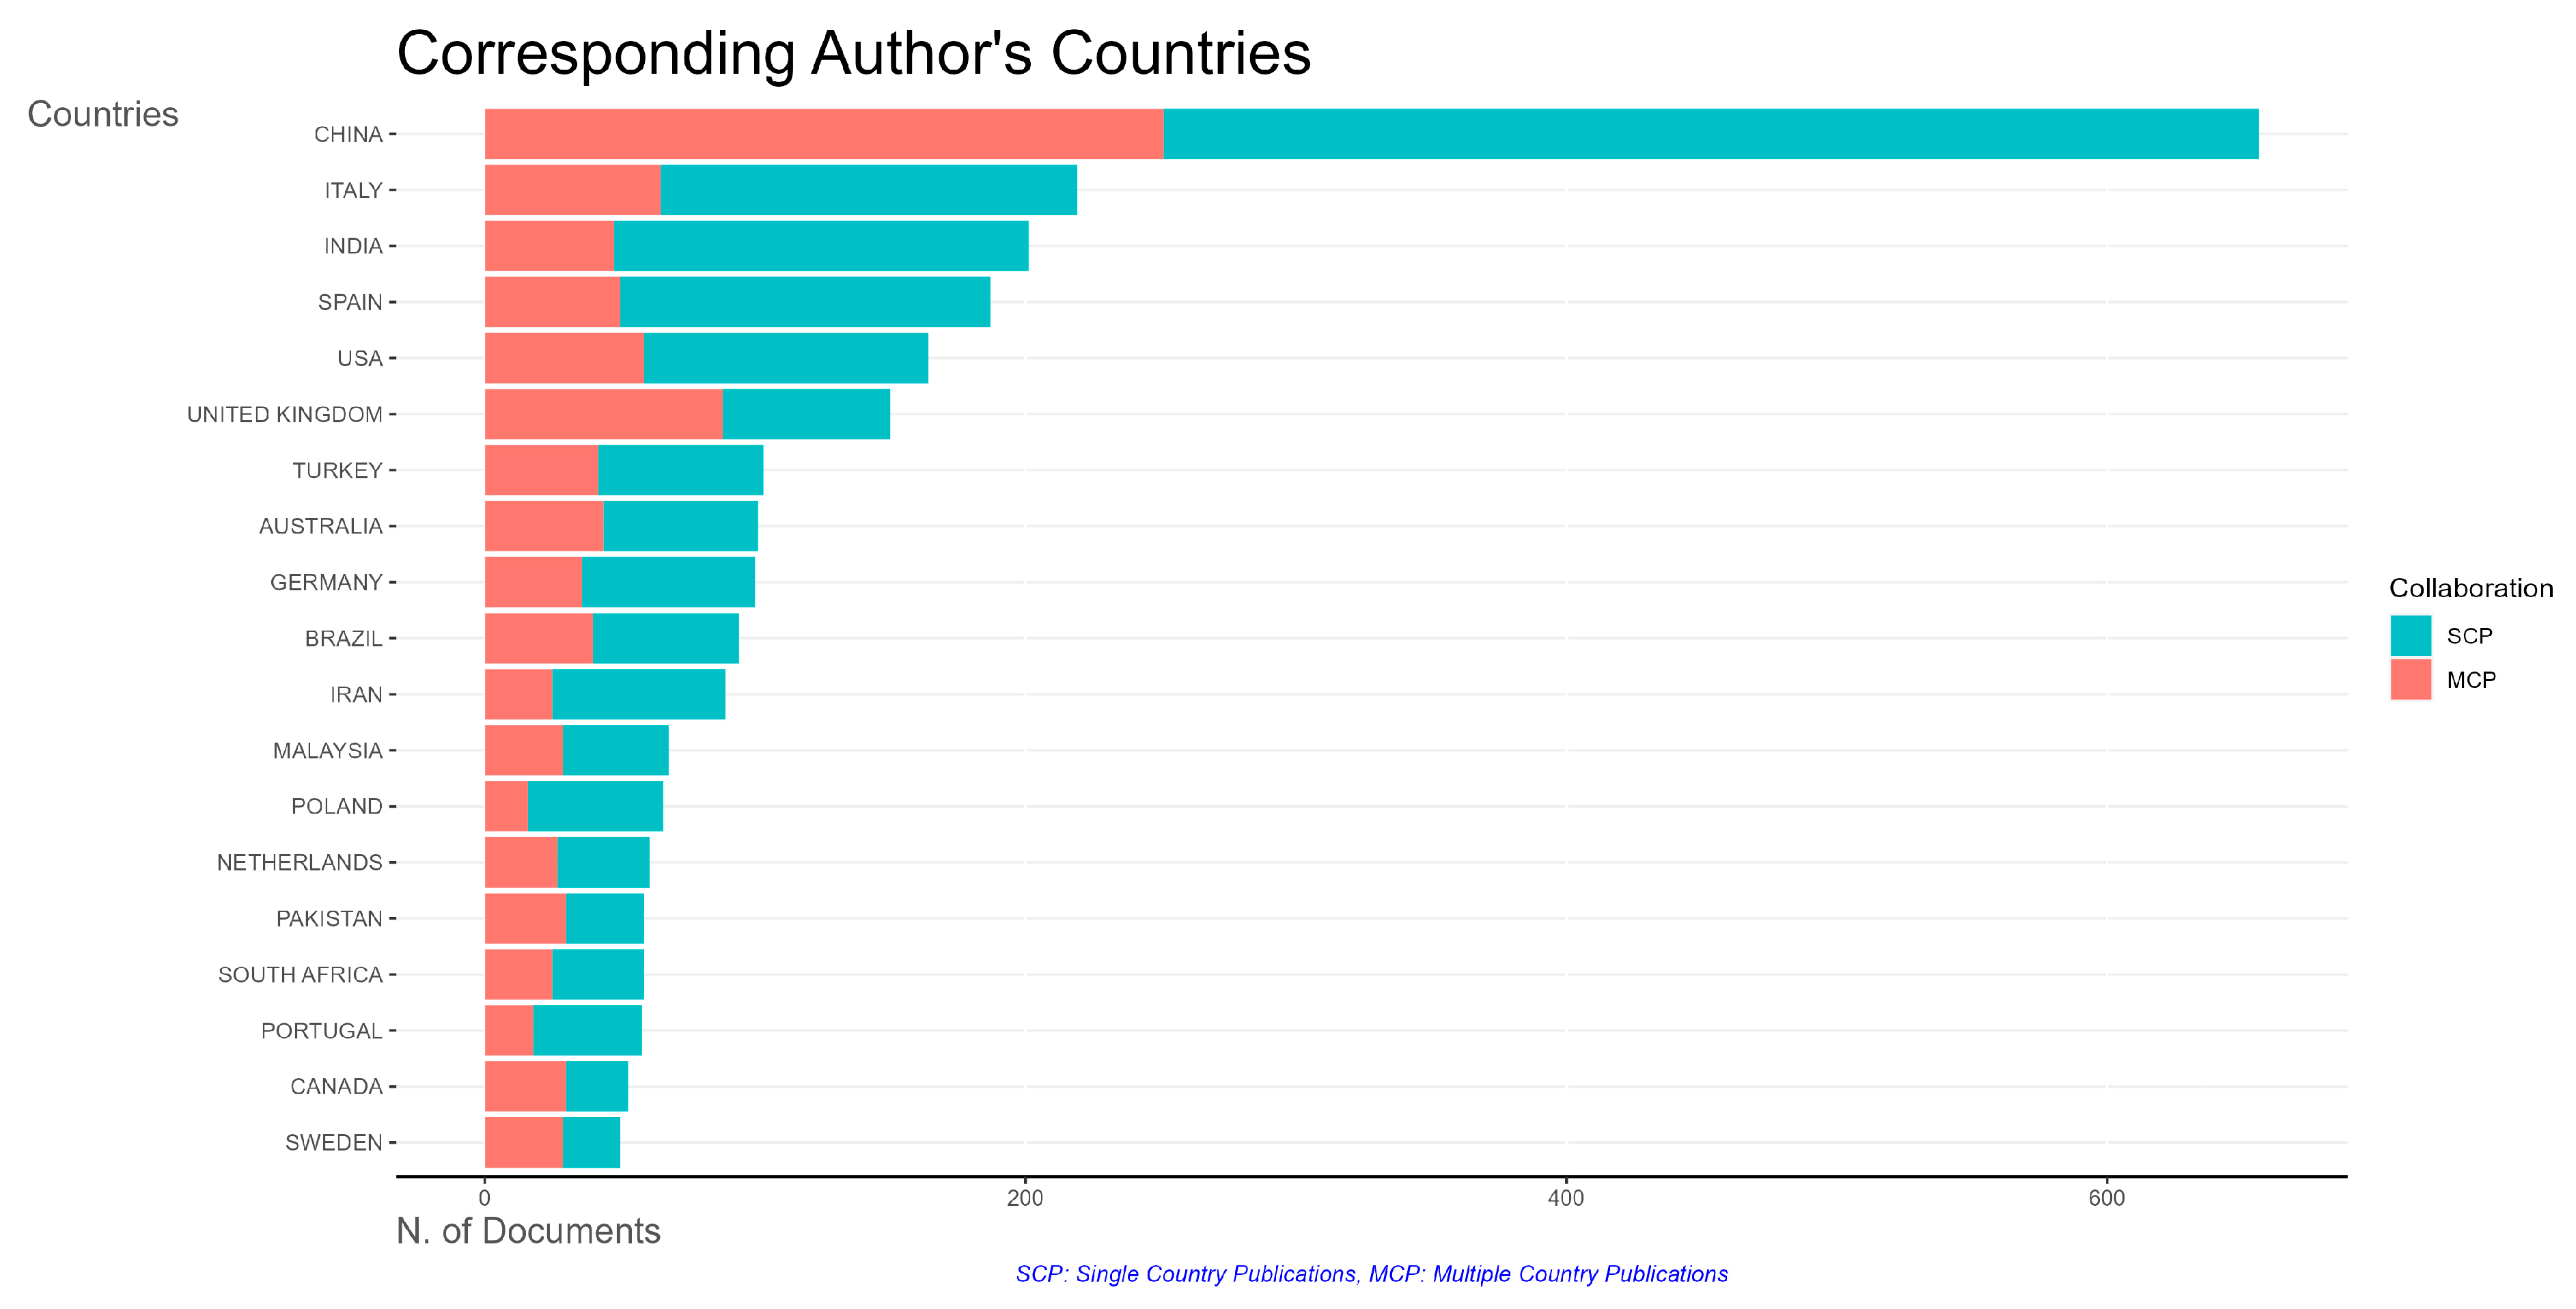

Figure A3.
Annual scientific production: environmental sustainability.
Figure A3.
Annual scientific production: environmental sustainability.

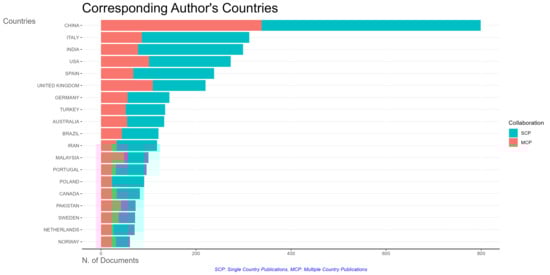
Figure A4.
Corresponding authors’ countries: environmental sustainability.
Figure A4.
Corresponding authors’ countries: environmental sustainability.
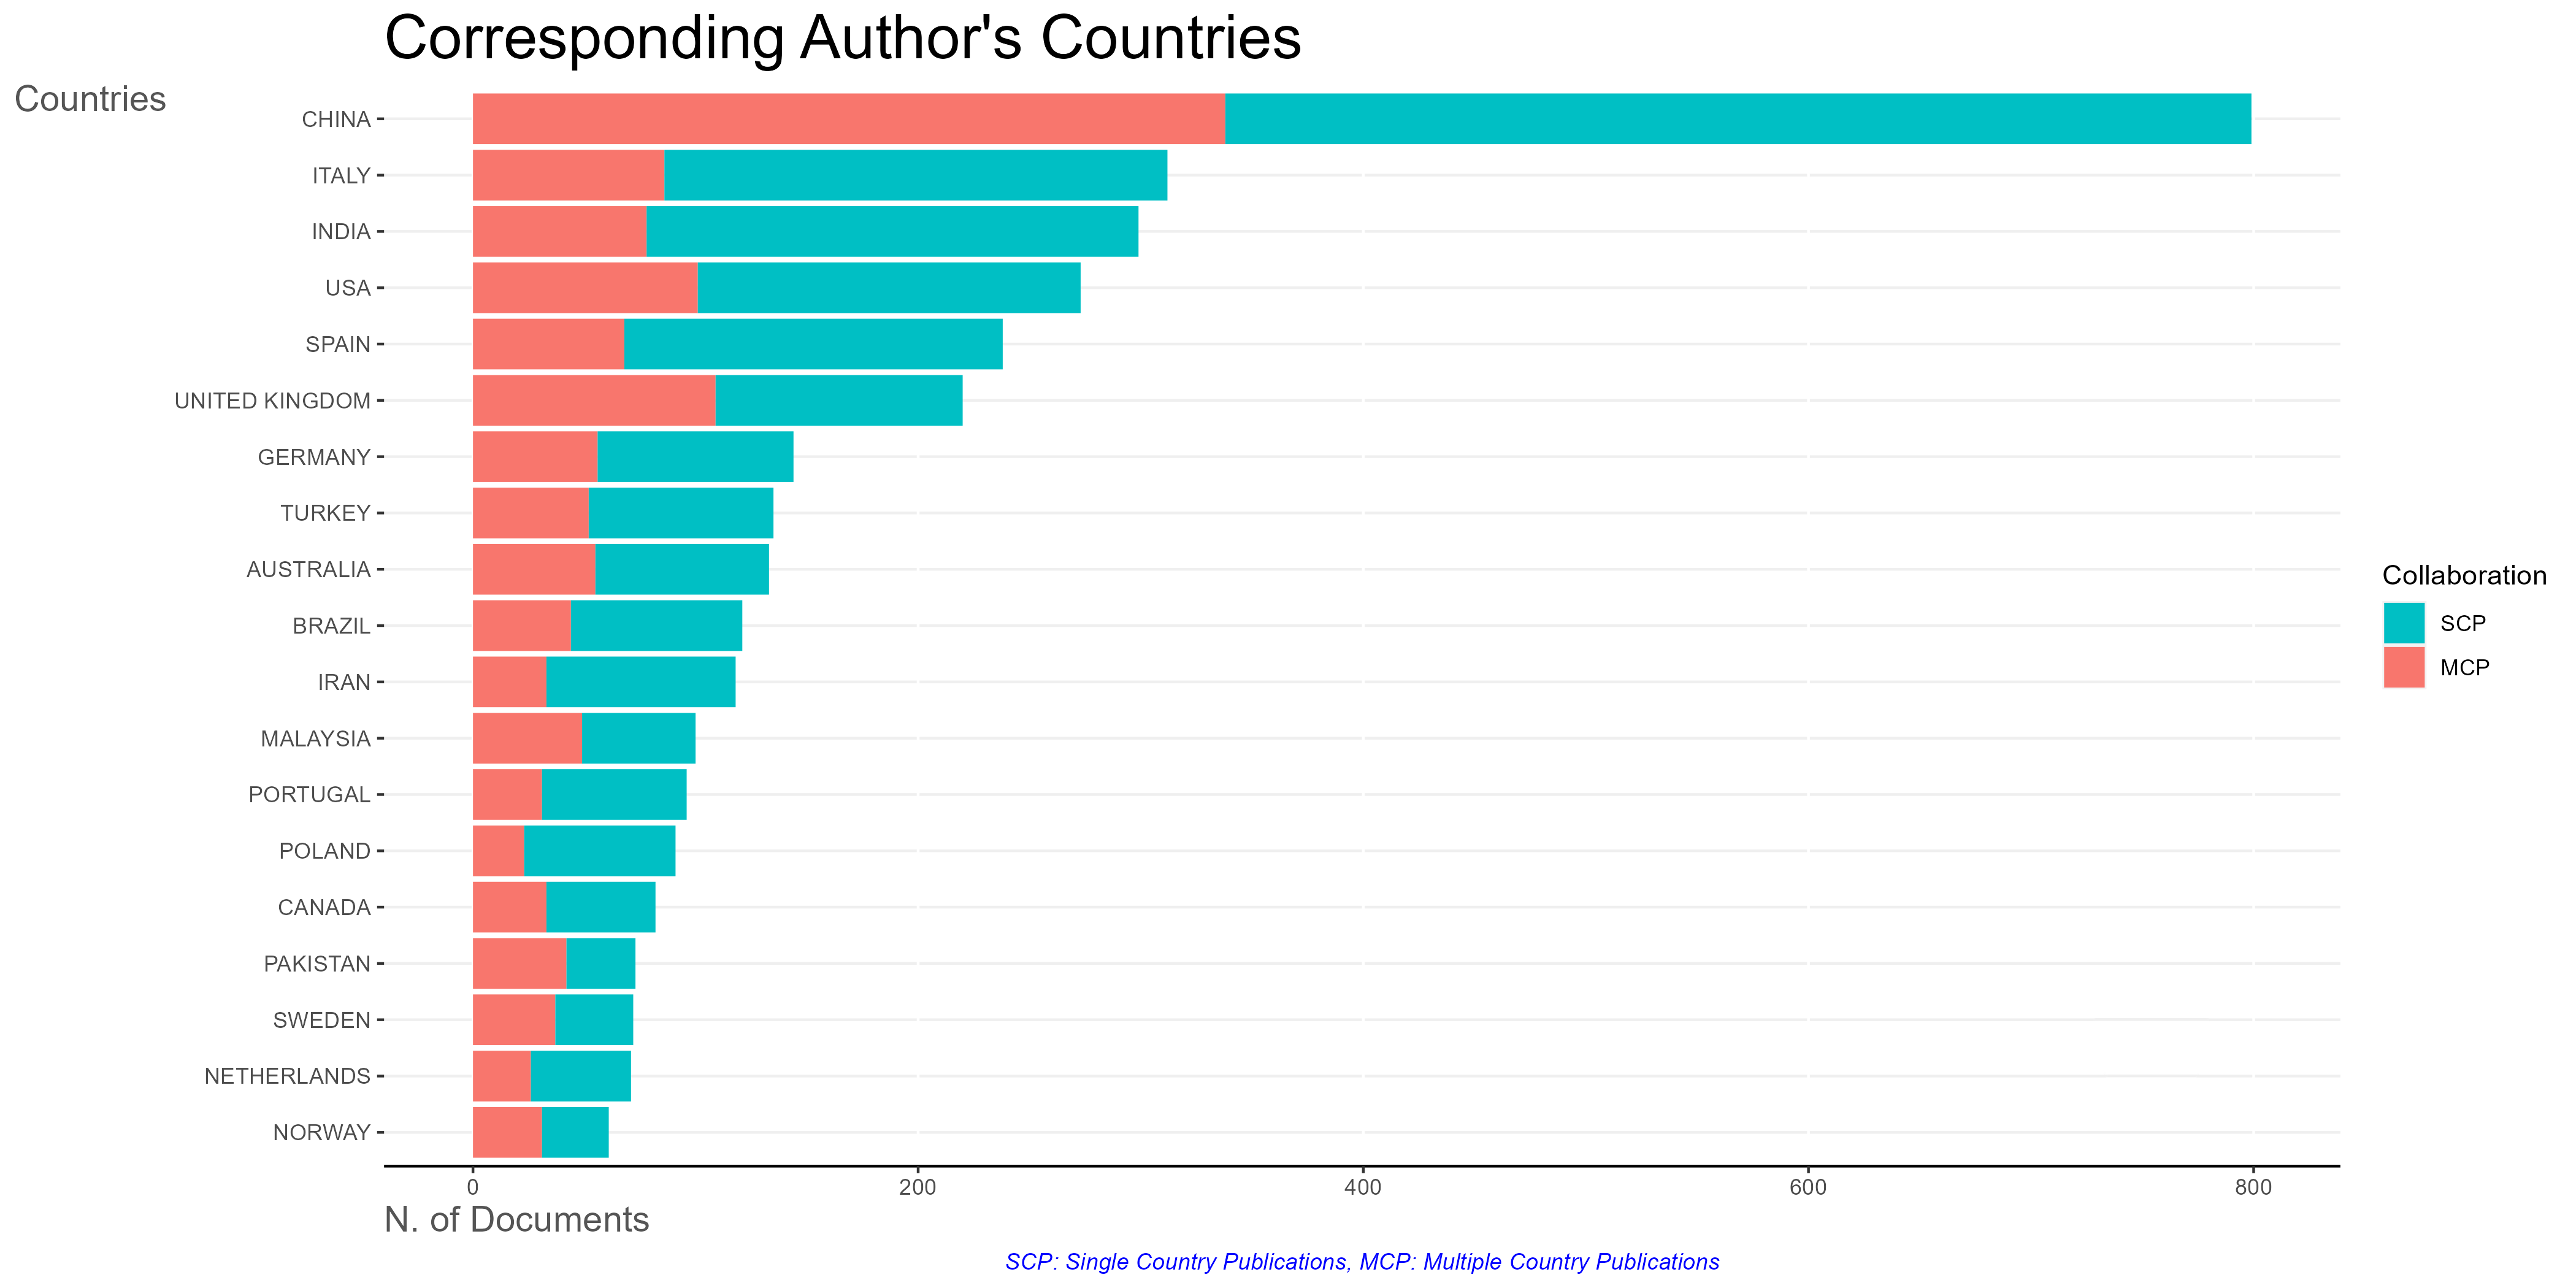
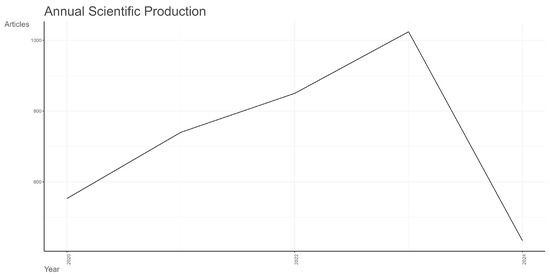
Figure A5.
Annual scientific production: social sustainability.
Figure A5.
Annual scientific production: social sustainability.
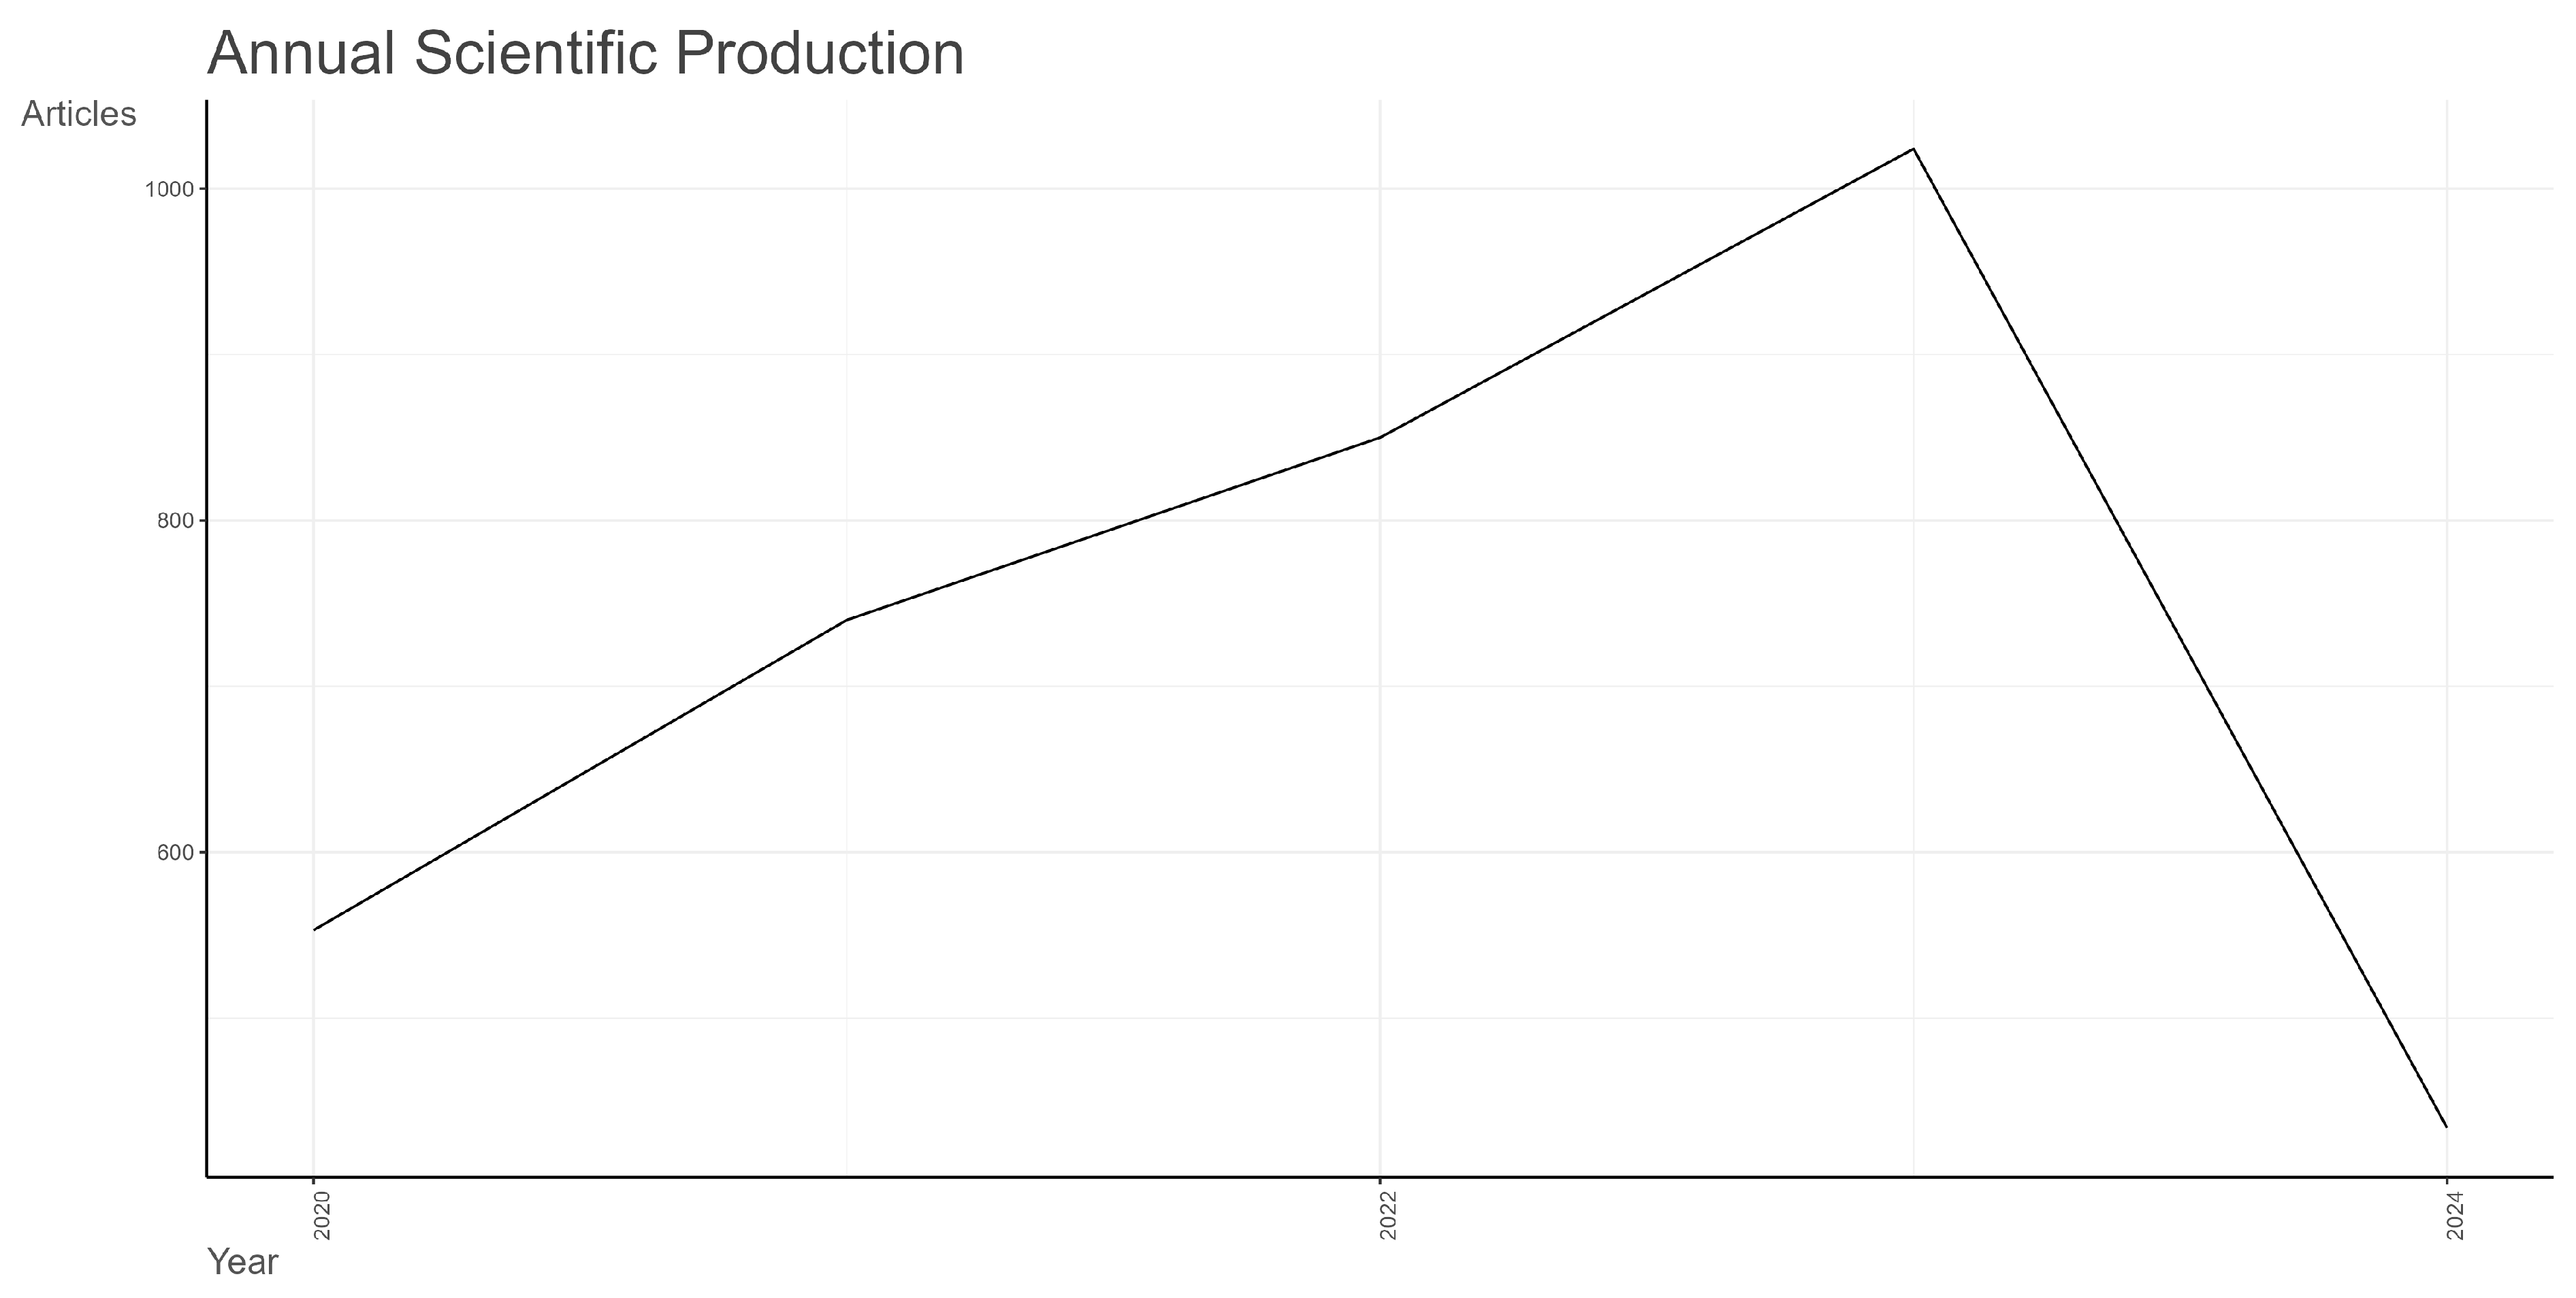
Figure A6.
Corresponding authors’ countries: social sustainability.
Figure A6.
Corresponding authors’ countries: social sustainability.
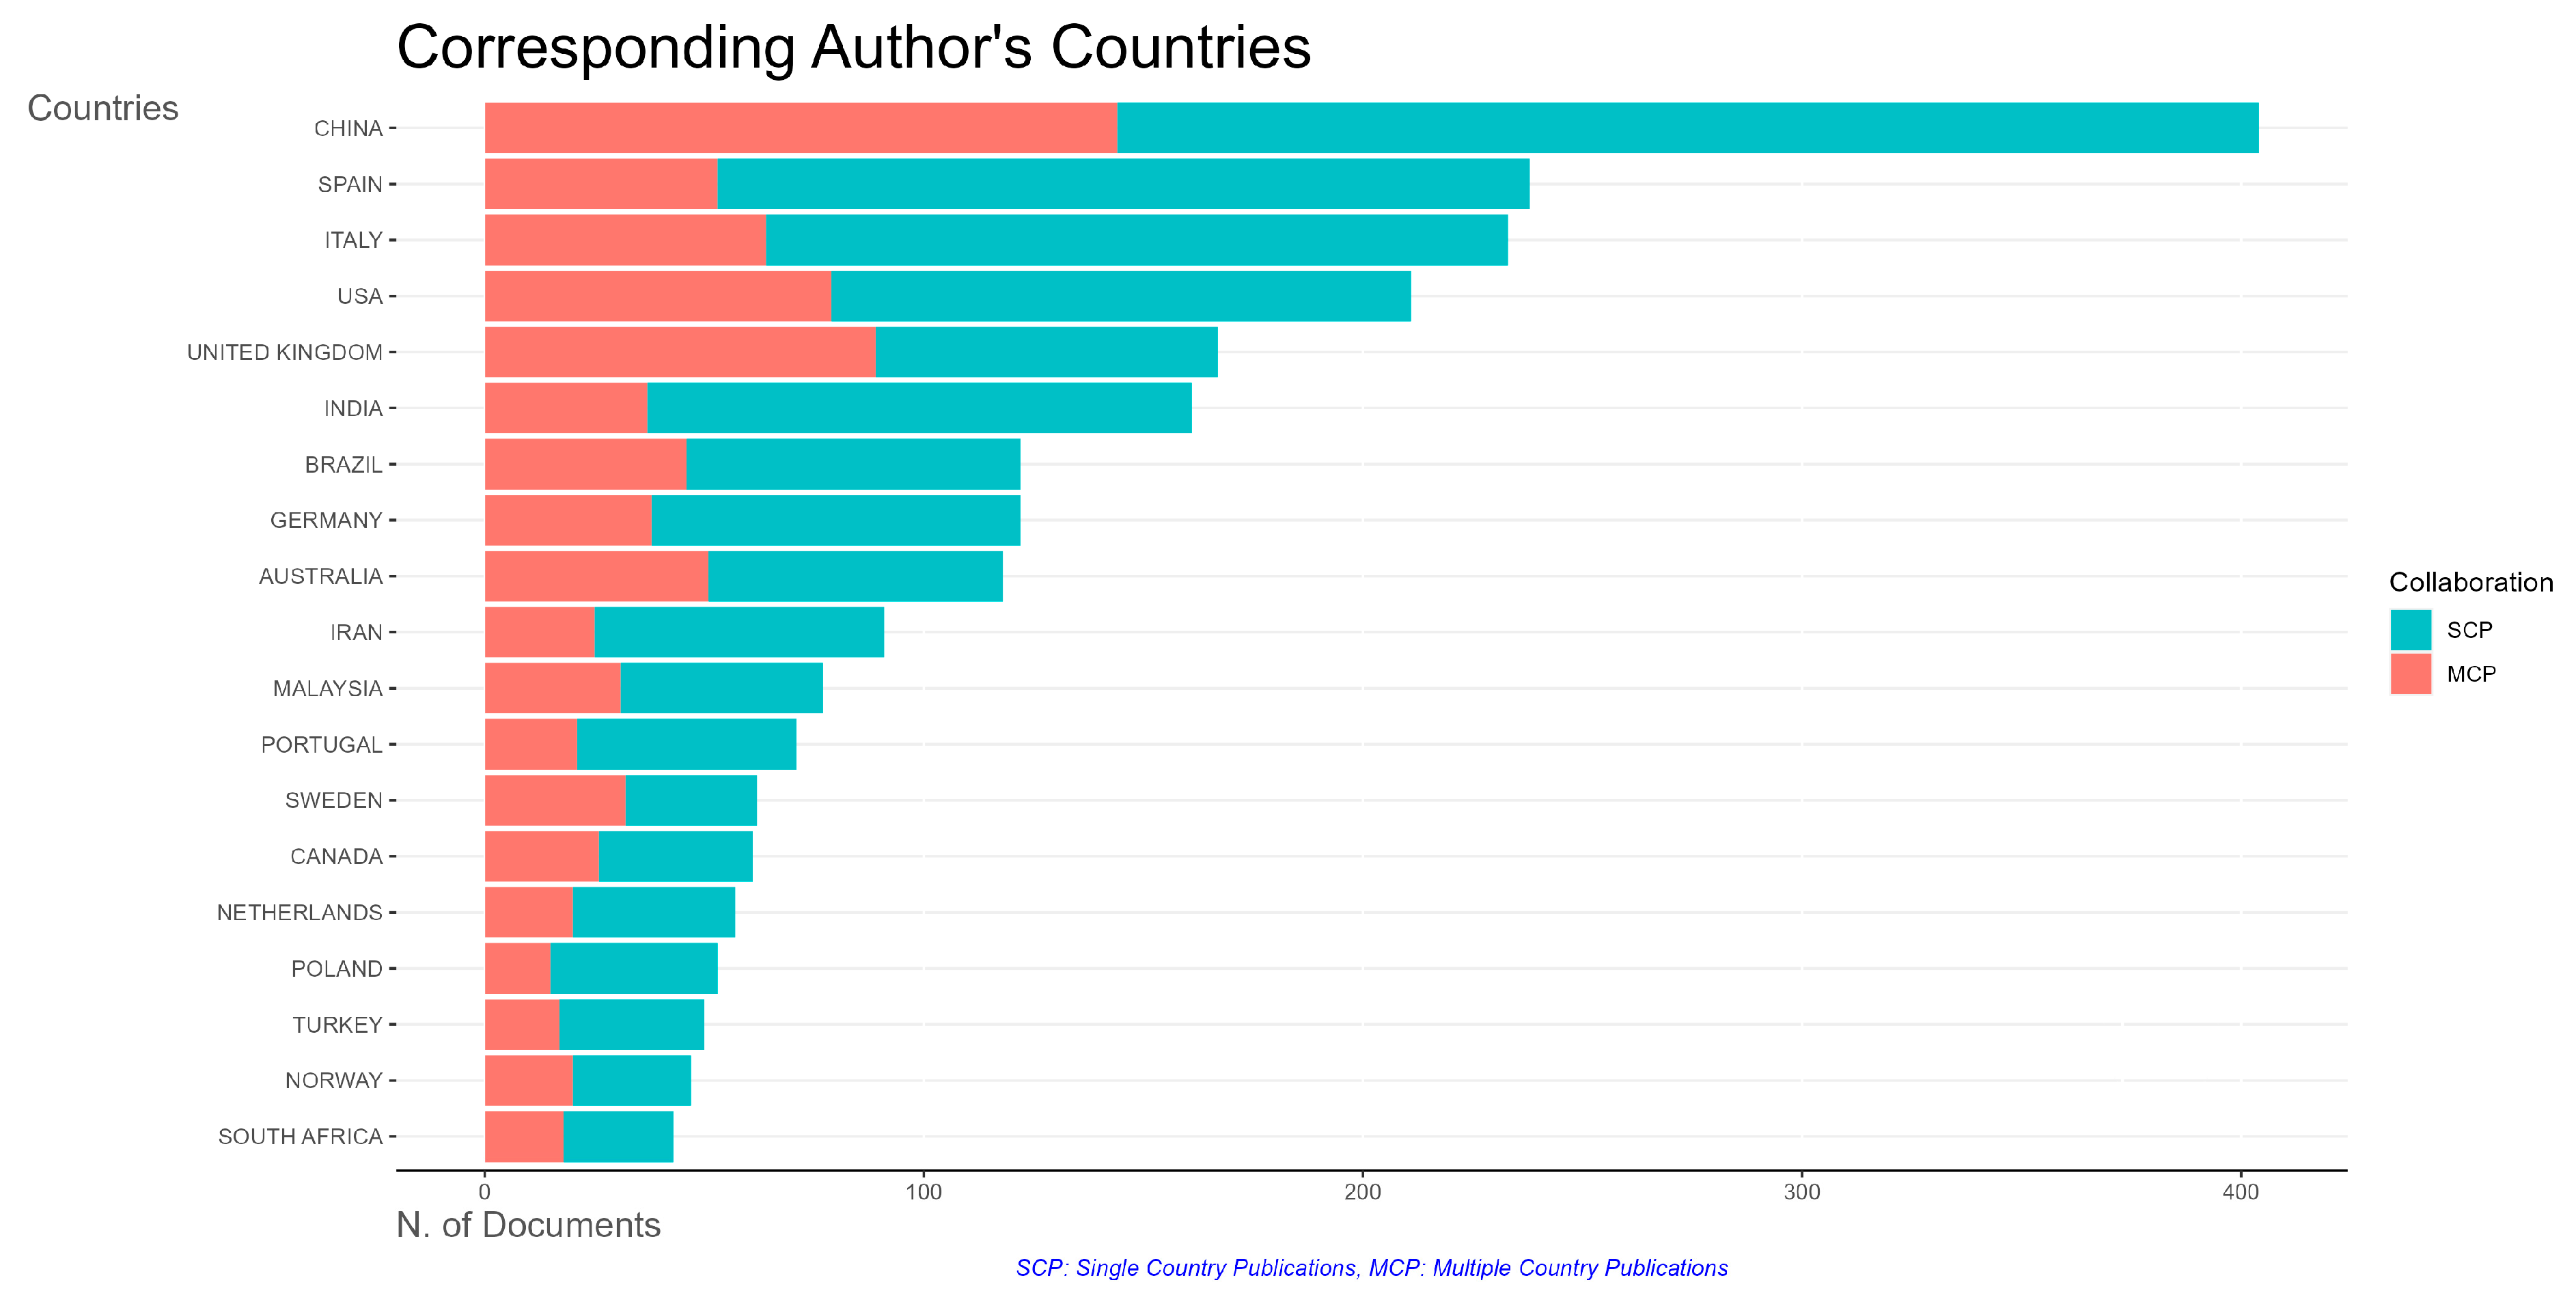
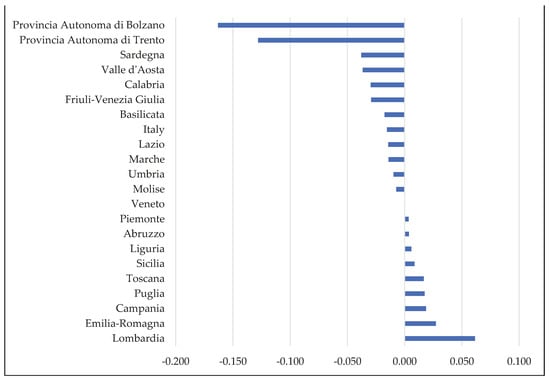
Figure A7.
Numerical variation between SDG and BES in 2022.
Figure A7.
Numerical variation between SDG and BES in 2022.
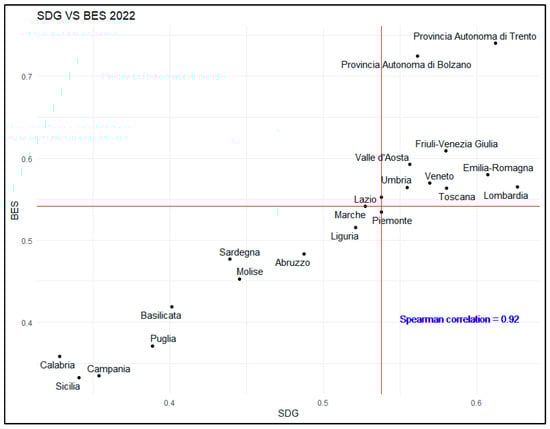
Figure A8.
SDG and BES: overall dimension.
Figure A8.
SDG and BES: overall dimension.
References
- Yamaguchi, N.U.; Bernardino, E.G.; Ferreira, M.E.C.; de Lima, B.P.; Pascotini, M.R.; Yamaguchi, M.U. Sustainable development goals: A bibliometric analysis of literature reviews. Environ. Sci. Pollut. Res. 2023, 30, 5502–5515. [Google Scholar] [CrossRef] [PubMed]
- Giannetti, B.F.; Agostinho, F.; Almeida, C.M.V.B.; Liu, G.; Contreras, L.E.V.; Vandecasteele, C.; Coscieme, L.; Sutton, P.; Poveda, C. Insights on the United Nations Sustainable Development Goals scope: Are they aligned with a ‘strong’sustainable development? J. Clean. Prod. 2020, 252, 119574. [Google Scholar] [CrossRef]
- World Commission on Environment and Development. Our Common Future; Oxford University Press: Oxford, UK, 1987; ISBN 019282080X. [Google Scholar]
- D’Adamo, I.; Gastaldi, M. Monitoring Performance of Sustainable Development Goals in the Italian Regions. Sustainability 2023, 15, 14094. [Google Scholar] [CrossRef]
- Mensah, K.; Wieck, C.; Rudloff, B. Sustainable food consumption and Sustainable Development Goal 12: Conceptual challenges for monitoring and implementation. Sustain. Dev. 2024, 32, 1109–1119. [Google Scholar] [CrossRef]
- Olabi, A.G.; Shehata, N.; Obaideen, K.; Sayed, E.T.; Mahmoud, M.; AlMallahi, M.N.; Abdelkareem, M.A. COVID-19: Medical Waste Management, Impact on Sustainable Development Goals, and Bibliometric Analysis. Chem. Eng. Technol. 2024, 47, 4–19. [Google Scholar] [CrossRef]
- Serafini, P.G.; de Moura, J.M.; de Almeida, M.R.; de Rezende, J.F.D. Sustainable Development Goals in Higher Education Institutions: A systematic literature review. J. Clean. Prod. 2022, 370, 133473. [Google Scholar] [CrossRef]
- Buhalis, D.; Leung, X.Y.; Fan, D.; Darcy, S.; Chen, G.; Xu, F.; Wei-Han Tan, G.; Nunkoo, R.; Farmaki, A. Editorial: Tourism 2030 and the contribution to the sustainable development goals: The tourism review viewpoint. Tour. Rev. 2023, 78, 293–313. [Google Scholar] [CrossRef]
- Parmentola, A.; Petrillo, A.; Tutore, I.; De Felice, F. Is blockchain able to enhance environmental sustainability? A systematic review and research agenda from the perspective of Sustainable Development Goals (SDGs). Bus. Strateg. Environ. 2022, 31, 194–217. [Google Scholar] [CrossRef]
- Vann Yaroson, E.; Chowdhury, S.; Mangla, S.K.; Dey, P.; Chan, F.T.S.; Roux, M. A systematic literature review exploring and linking circular economy and sustainable development goals in the past three decades (1991–2022). Int. J. Prod. Res. 2024, 62, 1399–1433. [Google Scholar] [CrossRef]
- Sharifi, A.; Allam, Z.; Bibri, S.E.; Khavarian-Garmsir, A.R. Smart cities and sustainable development goals (SDGs): A systematic literature review of co-benefits and trade-offs. Cities 2024, 146, 104659. [Google Scholar] [CrossRef]
- Pelikánová, R.M.; Němečková, T.; MacGregor, R.K. CSR Statements in International and Czech Luxury Fashion Industry at the Onset and during the COVID-19 Pandemic—Slowing Down the Fast Fashion Business? Sustainability 2021, 13, 3715. [Google Scholar] [CrossRef]
- Wood, D.; Rathnasabapathy, M.; Stober, K.J.; Menon, P. Challenges and progress in applying space technology in support of the sustainable development goals. Acta Astronaut. 2024, 219, 678–692. [Google Scholar] [CrossRef]
- Mishra, M.; Desul, S.; Santos, C.A.G.; Mishra, S.K.; Kamal, A.H.M.; Goswami, S.; Kalumba, A.M.; Biswal, R.; da Silva, R.M.; dos Santos, C.A.C.; et al. A bibliometric analysis of sustainable development goals (SDGs): A review of progress, challenges, and opportunities. Environ. Dev. Sustain. 2023, 26, 11101–11143. [Google Scholar] [CrossRef] [PubMed]
- Ordonez-Ponce, E. Exploring the Impact of the Sustainable Development Goals on Sustainability Trends. Sustainability 2023, 15, 16647. [Google Scholar] [CrossRef]
- Akande, A.; Cabral, P.; Gomes, P.; Casteleyn, S. The Lisbon ranking for smart sustainable cities in Europe. Sustain. Cities Soc. 2019, 44, 475–487. [Google Scholar] [CrossRef]
- Hametner, M.; Kostetckaia, M. Frontrunners and laggards: How fast are the EU member states progressing towards the sustainable development goals? Ecol. Econ. 2020, 177, 106775. [Google Scholar] [CrossRef]
- Kostetckaia, M.; Hametner, M. How Sustainable Development Goals interlinkages influence European Union countries’ progress towards the 2030 Agenda. Sustain. Dev. 2022, 30, 916–926. [Google Scholar] [CrossRef]
- Hickmann, T.; Biermann, F.; Spinazzola, M.; Ballard, C.; Bogers, M.; Forestier, O.; Kalfagianni, A.; Kim, R.E.; Montesano, F.S.; Peek, T.; et al. Success factors of global goal-setting for sustainable development: Learning from the Millennium Development Goals. Sustain. Dev. 2023, 31, 1214–1225. [Google Scholar] [CrossRef]
- Henderson, K.; Loreau, M. A model of Sustainable Development Goals: Challenges and opportunities in promoting human well-being and environmental sustainability. Ecol. Model. 2023, 475, 110164. [Google Scholar] [CrossRef]
- Perevoznic, F.M.; Dragomir, V.D. Achieving the 2030 Agenda: Mapping the Landscape of Corporate Sustainability Goals and Policies in the European Union. Sustainability 2024, 16, 2971. [Google Scholar] [CrossRef]
- D’Adamo, I.; Gastaldi, M.; Ioppolo, G.; Morone, P. An analysis of Sustainable Development Goals in Italian cities: Performance measurements and policy implications. Land Use policy 2022, 120, 106278. [Google Scholar] [CrossRef]
- Siddiqui, A.; Altekar, S.; Kautish, P.; Fulzele, S.; Kulkarni, N.; Siddiqui, M.; Bashir, M.F. Review of measurement of sustainable development goals: A comprehensive bibliometric and visualized analysis. Environ. Sci. Pollut. Res. 2023, 30, 91761–91779. [Google Scholar] [CrossRef] [PubMed]
- Ciommi, M.; Gigliarano, C.; Emili, A.; Taralli, S.; Chelli, F.M. A new class of composite indicators for measuring well-being at the local level: An application to the Equitable and Sustainable Well-being (BES) of the Italian Provinces. Ecol. Indic. 2017, 76, 281–296. [Google Scholar] [CrossRef]
- Bacchini, F.; Baldazzi, B.; Di Biagio, L. The evolution of composite indices of well-being: An application to Italy. Ecol. Indic. 2020, 117, 106603. [Google Scholar] [CrossRef]
- Davino, C.; Dolce, P.; Taralli, S.; Vinzi, V.E. A Quantile Composite-Indicator Approach for the Measurement of Equitable and Sustainable Well-Being: A Case Study of the Italian Provinces. Soc. Indic. Res. 2018, 136, 999–1029. [Google Scholar] [CrossRef]
- Ermini, B.; Santolini, R.; Ciommi, M. Equitable and sustainable well-being in Italian municipalities: Do women in politics make the difference? Socioecon. Plann. Sci. 2023, 90, 101741. [Google Scholar] [CrossRef]
- Dello Strologo, A.; D’Andrassi, E.; Paoloni, N.; Mattei, G. Italy versus Other European Countries: Sustainable Development Goals, Policies and Future Hypothetical Results. Sustainability 2021, 13, 3417. [Google Scholar] [CrossRef]
- Tebala, D.; Marino, D. A Synthetic Indicator BES-SDGs to Describe Italian Well-Being. New Metrop. Perspect. 2021, 178, 1862–1871. [Google Scholar]
- Guarini, E.; Mori, E.; Zuffada, E. Localizing the Sustainable Development Goals: A managerial perspective. J. Public Budg. Account. Financ. Manag. 2022, 34, 583–601. [Google Scholar] [CrossRef]
- Richiedei, A.; Pezzagno, M. Territorializing and Monitoring of Sustainable Development Goals in Italy: An Overview. Sustainability 2022, 14, 3056. [Google Scholar] [CrossRef]
- Ricciolini, E.; Tiralti, A.; Paolotti, L.; Rocchi, L.; Boggia, A. Sustainable development according to 2030 agenda in European Union countries: Evidence of the enlargement policy. Sustain. Dev. 2023, 32, 1894–1912. [Google Scholar] [CrossRef]
- Ruiz, F.; Cabello, J.M. MRP-PCI: A Multiple Reference Point Based Partially Compensatory Composite Indicator for Sustainability Assessment. Sustainability 2021, 13, 1261. [Google Scholar] [CrossRef]
- Mazziotta, M.; Pareto, A. Weighting in composite indices construction: The case of the Mazziotta-Pareto index. Riv. Ital. di Econ. Demogr. e Stat. 2022, 76, 1–10. [Google Scholar]
- Gan, X.; Fernandez, I.C.; Guo, J.; Wilson, M.; Zhao, Y.; Zhou, B.; Wu, J. When to use what: Methods for weighting and aggregating sustainability indicators. Ecol. Indic. 2017, 81, 491–502. [Google Scholar] [CrossRef]
- Puertas, R.; Marti, L. Regional analysis of the sustainable development of two Mediterranean countries: Spain and Italy. Sustain. Dev. 2023, 31, 797–811. [Google Scholar] [CrossRef]
- D’Adamo, I.; Di Carlo, C.; Gastaldi, M.; Uricchio, A.F. Equitable and sustainable well-being indicators: A study of Italian regional disparities towards sustainable development. Sustain. Dev. 2024. [Google Scholar] [CrossRef]
- Booth, A.; Sutton, A.; Papaioannou, D. Systematic Approaches to a Successful Literature Review; SAGE Publications Ltd.: Thousand Oaks, CA, USA, 2016. [Google Scholar]
- D’Adamo, I.; Gastaldi, M. Sustainable Development Goals: A Regional Overview Based on Multi-Criteria Decision Analysis. Sustainability 2022, 14, 9779. [Google Scholar] [CrossRef]
- Sousa, M.; Almeida, M.F.; Calili, R. Multiple Criteria Decision Making for the Achievement of the UN Sustainable Development Goals: A Systematic Literature Review and a Research Agenda. Sustainability 2021, 13, 4129. [Google Scholar] [CrossRef]
- Baffo, I.; Leonardi, M.; Bossone, B.; Camarda, M.E.; D’Alberti, V.; Travaglioni, M. A decision support system for measuring and evaluating solutions for sustainable development. Sustain. Futur. 2023, 5, 100109. [Google Scholar] [CrossRef]
- ISTAT Benessere e Sostenibilità. Available online: https://www.istat.it/it/benessere-e-sostenibilità (accessed on 3 December 2023).
- Costanza, R.; Daly, L.; Fioramonti, L.; Giovannini, E.; Kubiszewski, I.; Mortensen, L.F.; Pickett, K.E.; Ragnarsdottir, K.V.; De Vogli, R.; Wilkinson, R. Modelling and measuring sustainable wellbeing in connection with the UN Sustainable Development Goals. Ecol. Econ. 2016, 130, 350–355. [Google Scholar] [CrossRef]
- Kettunen, M.; Boywer, C.; Vaculova, L.; Charveriat, C. Sustainable Development Goals and the EU: Uncovering the Nexus between External and Internal Policies; Think2030 Discuss. Pap. IEEP Brussels, www.think2030.eu; Institute of European Environmental Policy: Brussels, Belgium, 2018. [Google Scholar]
- Fan, W.; Anser, M.K.; Nasir, M.H.; Nazar, R. Uncertainty in firm innovation scheme and impact of green fiscal policy; Economic recovery of Chinese firms in the post-Covid-19 era. Econ. Anal. Policy 2023, 78, 1424–1439. [Google Scholar] [CrossRef]
- Ferrante, M.; Vitti, M.; Facchini, F.; Sassanelli, C. Mapping the relations between the circular economy rebound effects dimensions: A systematic literature review. J. Clean. Prod. 2024, 456, 142399. [Google Scholar] [CrossRef]
- Biancardi, A.; Colasante, A.; D’Adamo, I.; Daraio, C.; Gastaldi, M.; Uricchio, A.F. Strategies for developing sustainable communities in higher education institutions. Sci. Rep. 2023, 13, 20596. [Google Scholar] [CrossRef] [PubMed]
- de Freitas Netto, S.V.; Sobral, M.F.F.; Ribeiro, A.R.B.; Soares, G.R.D.L. Concepts and forms of greenwashing: A systematic review. Environ. Sci. Eur. 2020, 32, 19. [Google Scholar] [CrossRef]
- Van Tulder, R.; van Mil, E. Principles of Sustainable Business: Frameworks for Corporate Action on the SDGs; Routledge: New York, NY, USA, 2022; ISBN 1003098355. [Google Scholar]
- Ali, S.M.; Appolloni, A.; Cavallaro, F.; D’Adamo, I.; Di Vaio, A.; Ferella, F.; Gastaldi, M.; Ikram, M.; Kumar, N.M.; Martin, M.A.; et al. Development Goals towards Sustainability. Sustainability 2023, 15, 9443. [Google Scholar] [CrossRef]
- Suguna, M.; Sreenivasan, A.; Ravi, L.; Devarajan, M.; Suresh, M.; Almazyad, A.S.; Xiong, G.; Ali, I.; Mohamed, A.W. Entrepreneurial education and its role in fostering sustainable communities. Sci. Rep. 2024, 14, 7588. [Google Scholar] [CrossRef] [PubMed]
- Lennon, B.; Dunphy, N. Sustaining energetic communities: Energy citizenship and participation in an age of upheaval and transition. Sci. Rep. 2024, 14, 3267. [Google Scholar] [CrossRef] [PubMed]
- Skaloumpakas, P.; Sarmas, E.; Rachmanidis, M.; Marinakis, V. Reshaping the energy landscape of Crete through renewable energy valleys. Sci. Rep. 2024, 14, 8038. [Google Scholar] [CrossRef]
- Cook, D.; Davíðsdóttir, B. An appraisal of interlinkages between macro-economic indicators of economic well-being and the sustainable development goals. Ecol. Econ. 2021, 184, 106996. [Google Scholar] [CrossRef]
Disclaimer/Publisher’s Note: The statements, opinions and data contained in all publications are solely those of the individual author(s) and contributor(s) and not of MDPI and/or the editor(s). MDPI and/or the editor(s) disclaim responsibility for any injury to people or property resulting from any ideas, methods, instructions or products referred to in the content. |
© 2024 by the authors. Licensee MDPI, Basel, Switzerland. This article is an open access article distributed under the terms and conditions of the Creative Commons Attribution (CC BY) license (https://creativecommons.org/licenses/by/4.0/).