Article

The Synergistic Effect of Urban Economic, Social and Space Factors on Residential Carbon Emissions: A Case Study on Provincial Capitals in China

1
Xi’an International Science and Technology Cooperation Base for Technological Innovation in Green Urban-Rural and Land Space Smart Construction, Chang’an University, Xi’an 710064, China
2
School of International Economics and Business, Yeungnam University, Gyeongsan 38541, Republic of Korea
3
School of Architecture, Chang’an University, Xi’an 710064, China
*
Author to whom correspondence should be addressed.
Sustainability 2024, 16(12), 5153; https://doi.org/10.3390/su16125153
Submission received: 10 May 2024 / Revised: 7 June 2024 / Accepted: 14 June 2024 / Published: 17 June 2024

Abstract

:
Within the context of China’s commitment to carbon reduction goals, particularly in urban areas, addressing carbon emissions stemming from residents’ travel activities assumes paramount significance. Drawing upon established theoretical frameworks, this study advances several hypotheses delineating the determinants of low-carbon behaviors among urban residents. It analyzes panel data from 30 provincial capitals in China using a time–individual dual fixed effects model. This study empirically scrutinizes the posited theoretical model, aiming to elucidate the factors shaping urban residents’ low-carbon behavioral patterns and provide a decision-making basis for low-carbon construction and management of urban space. The findings underscore several notable associations. The disposable income, population density, and urban built-up areas exhibit significant positive correlations with carbon emissions among residents. Conversely, the urban gross domestic product (GDP) displays a significant negative correlation with carbon emissions. Furthermore, a positive correlation is discerned between the expanse of green spaces and the per capita carbon emissions intensity, while the availability of subway systems exhibits a negative correlation with both the per capita public green space area and the carbon emissions intensity. Notably, the configuration intensity of urban bus systems manifests an inverted U-shaped relationship with residents’ carbon emissions intensity. Specifically, within a certain threshold, an escalation in the bus equipment intensity coincides with heightened carbon emission intensity; however, beyond this threshold, a notable reduction in the per capita carbon emissions intensity ensues. Additionally, a U-shaped relationship is observed between the number of urban parks and residents’ carbon emissions intensity, indicating that an increase in parks may not necessarily contribute to carbon reduction efforts. Moreover, a discernible synergy is observed among various factors influencing carbon reduction efforts. These factors encompass residents’ education levels and disposable incomes, the presence of subway and regular public transportation systems, urban land utilization scales, economic development levels, green space provisions, public transportation infrastructure, population densities, and land equilibrium. This interplay underscores the interconnectedness and interdependence of diverse variables in shaping strategies for mitigating carbon emissions within urban contexts.

1. Introduction

The increase in greenhouse gas emissions during the global economic and social development process poses a serious threat to the ecosystem and human living environment. The Chinese government has proposed the “dual carbon goals” of achieving “carbon peak” by 2030 and “carbon neutrality” by 2060, and energy conservation and emissions reduction have become important development strategies for China at present [1]. The research on the impact of carbon emissions by different scientists has a long history, and corresponding strategies for reducing carbon emissions have been proposed from different perspectives. From the perspective of research scope, research on different regional scales such as the national level [2,3,4,5], the urban agglomerations [6,7], and the urban [8,9,10,11,12] level is currently the main focus of research. Based on the reality of China’s economic and social development, the benign development path of low-carbon industries [13] and the regional differences in energy consumption under the background of rapid development [2,3] have become the focus of regional low-carbon development research by Chinese scholars.
Based on the practical significance of guiding the formulation of low-carbon development strategies in various regions through research results. Scholars from various fields worldwide are also vigorously exploring factors that can affect carbon emissions, mainly focusing on analyzing and studying the carbon emissions of certain regions and specific social activities. For example, Anne Aguiléra (2014) emphasized the importance of the proximity of workplaces to public transportation systems in reducing carbon dioxide emissions, based on the relationship between urban forms and commuting patterns in Paris, as well as related carbon dioxide emission surveys [14]. Alex Singleton (2013) modeled the carbon dioxide emissions of British students commuting from home to school and found that the areas with the highest carbon emissions are usually rural or wealthier, with emissions positively correlated with the academic year [15]. In Brazil, the population and per capita GDP significantly impact CO2 emissions [16]. For economically developed regions like Europe, North America, and Japan, income growth is the most important driving factor for CO2 emissions. In recent decades, technological change and fuel conversion have become crucial for reducing emissions in Europe [17]. In Latin America, population growth is a significant driving factor [18]. Onicha Meangbua (2019) studied the impact of socio-economic and demographic factors on changes in the carbon dioxide demand in Thailand and found that temperature is the most critical factor, with education being a key driving factor, positively affecting the direct energy and carbon dioxide demand [19]. The population, per capita GDP, and energy intensity are the main driving factors affecting changes in energy-related CO2 emissions in Malaysia [20].
Exploring the factors influencing household carbon emissions is also a research focus for many scholars. Reznik Ariel (2019) conducted a comprehensive high-resolution spatial analysis of greenhouse gas emissions related to private car travel among residents of Tel Aviv Jaffa in Israel, taking into account various urban social spatial factors [21]. Nair Sumita (2019) studied the relationship between household carbon emissions, income, and household size in three regions of India, finding that the household size and carbon dioxide emissions from different activities significantly impact the total emissions [22]. Dantong Wang et al. (2018) proposed an energy consumption regression method based on the UrbanSim model to model and simulate household energy consumption and carbon dioxide emissions in the Atlanta Circle area over 30 years of planning, suggesting the introduction of a travel demand model for a more reasonable simulation [23]. Japanese scholars have estimated the direct and indirect carbon emissions of multi-person households in 49 cities, showing that direct and indirect carbon emissions are almost the same, highlighting the importance of lifestyle improvements for energy conservation and reducing carbon emissions related to product and service consumption [24]. Low-carbon behavior, as a resource-saving and environmentally friendly behavior, affects the daily life and consumption patterns of residents, thereby reducing greenhouse gas emissions from daily activities. Transforming the preferences of residents for travel modes is beneficial for reducing the carbon emissions from travel [25], and the sustainable construction of low-carbon cities still requires identifying the influencing factors of residents’ low-carbon behavior.
From the existing research, it is evident that studies on low-carbon factors cover various fields, such as economy, society, and space. However, there are noticeable shortcomings, such as relatively little research on the coordinated carbon reduction of urban factors. A city is a complex system, and the interaction between various elements is crucial for ensuring the normal operation of urban functions. Based on historical data related to the carbon emissions and urban space of urban residents, this article explores the correlation factors affecting the carbon emissions intensity of urban residents under carbon reduction goals using multiple regression models. The focus is on analyzing the collaborative carbon reduction mechanism between different urban elements in the complex urban system. By measuring the correlation between urban elements and carbon emissions intensity, this article strives to provide new ideas and methods for constructing and managing low-carbon cities.

2. Literature Research and Hypotheses

To explore the influencing factors of carbon emissions from urban residents, this article reviews relevant existing research results and proposes hypotheses for single-factor and multi-factor collaborative carbon reduction from spatial environmental comfort, socio-economic factors, and urban public facilities.

2.1. Carbon Reduction Effect of Spatial Environmental Comfort

The principal indicator of the urban spatial environment’s comfort lies in the degree of physical and psychological comfort experienced by its residents during utilization. Within this framework, psychological comfort encompasses two pivotal facets: the overall pleasantness of the space and the establishment of a secure atmosphere. The experience of security and comfort is often obtained by residents directly using various micro-scal space in the city. It is not difficult to understand that micro-scale urban spaces affect residents’ daily travel and carbon emissions by influencing their usage experience [26]. Related studies have shown that walking space safety will affect residents’ walking decisions, outdoor activities, and social activities, and it will reduce energy consumption by increasing the frequency of outdoor activities for residents. Research on the choice of nighttime travel modes for residents also indicates that different forms of green layout [27], nighttime road lighting [28], green coverage and positive street interface [29] will affect the choice of nighttime travel modes for residents by affecting their sense of security in the spaces they use. The impact of urban spaces on residents’ travel choices through different user experiences can be reasonably inferred, which in turn affects the path of carbon emissions in daily life.
The width of sidewalks [30] and the cleanliness of roads [31] affect the safety and comfort of pedestrians, especially in some cities where road rights are not clear enough. The width of roads affects the user experience of the walking space for residents in mixed traffic with non-motorized vehicles, thereby affecting their choices regarding low-carbon travel. The safety guarantee for low-carbon travel for residents is also reflected in the degree of separation between walking, non-motorized travel, and motorized transportation, especially in cities where the maintenance of vehicle speed is an important principle. The key to maintaining residents’ choice of low-carbon travel is whether it can be safely and conveniently separated from and cross over with motorized vehicles to a certain extent. Related studies have shown that in urban intersections with high traffic volumes, it is necessary to set up three-dimensional crossing facilities [32], such as overpasses, safety islands, etc., which can increase the low-carbon travel frequency of residents from both the convenience of walking and the spatial safety.
Various scales of urban street space elicit distinct psychological responses among residents. Factors such as the aspect ratio of streets and the height of the buildings lining them contribute to diverse spatial perceptions. The oppressive or open spatial atmosphere determines how residents use the space. Research has shown that increasing the height of buildings can increase the probability of residents choosing to walk [28]. The oppressive perception of the street space has forced some residents to give up using private cars for transportation, which is also related to the higher buildings bringing about greater traffic volumes.
Hypothesis 1:
The comfort of the walking environment can reduce carbon emissions by promoting active low-carbon travel among residents, and the spatial perception of the urban environment can change the carbon emissions intensity by promoting changes in residents’ travel patterns.
Park green space is one of the important destinations for the daily low-carbon travel of residents, and its carbon reduction effect is mainly reflected in guiding outdoor activities for residents. The types of travel by residents to park green space can be divided into holiday travel and nearby travel [33]. For nearby travel, due to the uneven distribution of most urban parks, the unfairness of walking in parks is much greater than that of vehicles from the perspective of a complete community or living circle [34]. The increase in the number of parks and the reduction in service radius are effective measures to strengthen the walking accessibility of parks. The choice of travel modes for residents often becomes the key to whether large green spaces can reduce carbon emissions from their daily lives, and resident travel methods are positively influenced by factors such as bus route density [29]. As the number of parks increases and the service radius decreases, people’s opportunities to choose parks nearby increase [34]. In particular, the construction of specialized parks can attract targeted travel from residents with different entertainment preferences. Distributed rather than centralized travel destinations are beneficial for alleviating urban traffic congestion and reducing energy consumption. At the same time, the increase in investment and energy consumption caused by park construction, as well as the energy consumption generated during park operation, can all lead to an increase in emissions. Based on the above analysis, we can make the following reasonable assumptions.
Hypothesis 2:
There is an optimal number of parks in cities, and the carbon emissions generated by redundant park construction and operation processes are not sufficient to offset the carbon reduction that parks guide residents to low-carbon travel.

2.2. The Impact of Social and Economic Factors on Carbon Emissions

In addition to necessary energy consumption, such as the consumption of food and water resources, the level of carbon emissions in residents’ daily lives is often constrained by their choices of lifestyle, such as whether to adopt low-carbon lifestyles and behaviors. The prerequisite for low-carbon behavior is whether residents have a correct understanding of low-carbon [4,35]. After addressing which behaviors can reduce carbon emissions, the amount of carbon emissions is directly linked to whether residents choose this low-carbon behavior. Related studies suggest that environmental awareness is the main factor affecting low-carbon behavior among residents [36,37], and promotion and education [38] are effective ways for residents to establish low-carbon awareness. At the same time, low-carbon life skills also come from learning experience and scientific methods. The length of education of residents and the proportion of highly educated talents in the population can directly affect their carbon emissions by influencing their low-carbon behavior.
From the perspective of the source of energy consumption in household life, high-income households often purchase a wider variety of high-power electrical equipment such as air conditioners and vacuum cleaners when pursuing a high quality of family life, which is the main source of carbon emissions in household life. Relevant studies have shown a significant positive correlation between household income and low-carbon travel among residents [39]. The higher the household income, the more likely they are to choose low-carbon travel, and residents with self-owned property rights are also more willing to adopt low-carbon behavior [36]. However, some scholars believe that low-income families, due to their limited purchasing power, tend to prefer low-carbon transportation such as walking and cycling [40,41]. The difference between the two lies in the fact that households with different incomes are at different stages of carbon consumption development. The low-carbon behavior of high-income groups is an independent choice, while the low-carbon travel of low-income families is a helpless behavior. From the existing research results, there is a U-shaped relationship between the household income and the frequency of low-carbon travel behavior. Overall, high-income households have more household energy consumption and consumption of high carbon emissions coefficient goods than low-income households [42], which inevitably leads to an increase in indirect carbon emissions. The reduction of household carbon emissions depends on the reduction of household energy consumption other than low-carbon travel, that is, the improvement of low-carbon behavior and awareness in household life. Based on the above analysis, hypothesis 3 is proposed.
Hypothesis 3:
The improvement of education level can weaken the positive correlation between residents’ income level and carbon emissions from daily life.
In China, there is a positive correlation between urban size and economic development level, and large cities often have higher levels of economic development. Related studies suggest that urban economic growth will drive an increase in the per capita carbon emissions for residents [22], which can be explained by the fact that a growing economy requires more energy consumption. Cities with higher levels of economic development are more capable of constructing and improving their infrastructure and public service facilities, and reducing the per capita carbon emission intensity during the operation of infrastructure and public service facilities through economies of scale. The well-developed infrastructure and well-designed public service facilities in big cities can better exert agglomeration effects, thereby reducing the per capita carbon emissions intensity during the operation of infrastructure and public service facilities. At the same time, large cities have a higher proportion of high-quality population than small and medium-sized cities, and their low-carbon awareness is stronger. Low-carbon behavior is more frequent. From the horizontal comparison of household carbon emissions in regions with different levels of development, it can be seen that due to the consistent purchasing power parity level and economic development level among different cities in China [43], the price level in economically developed cities is higher, which to some extent affects the high energy consumption behavior of households and has the possibility of reducing household carbon emissions. On the other hand, the employment and living space of residents gradually separate and become imbalanced with the expansion of the urban scale [44,45]. The transportation costs and energy consumption brought about by commuting will continue to increase. This also easily leads to more serious congestion in urban transportation, further exacerbating urban transportation carbon emissions [46].
From the perspective of urban functional zoning, the reasonable allocation and layout of construction land among different types of cities is fundamental to ensuring the rational use of various urban functions, which can be expressed by the degree of mixed construction land. Related studies have shown that the lower the degree of mixed use of land in a certain area, the more frequent the residents’ cross-district travel, the longer the travel distance, and the higher the carbon emissions during travel [47]. However, this view is only valid at the level of urban areas, and the improvement of land mixing in a certain area is a process of transforming from a single land use to a mixed use of land in different cities. Residents can enjoy sufficient public services without leaving the area. At the urban level, there is not much change in the types of construction land, and the improvement of the balance is caused by the convergence of the proportion of various types of land. In the early stage of urban expansion, the newly added land functions are concentrated in public service facilities, transportation and other land types with relatively small proportions. This is the basic model of urban expansion in China [48,49]. That is to say, while expanding the urban scale, moderately increasing and reducing the mixing degree of urban land, and promoting the integrated construction of various types of construction land, can strengthen the carbon emissions intensity increase brought about by the expansion of the urban scale.
Hypothesis 4:
There is a negative correlation between the intensity of carbon emissions from the daily lives of residents in large cities and the level of economic development of the city. and an increase in urban size will strengthen this negative correlation.
Hypothesis 5:
The decrease in the mixing degree of urban construction land can weaken the trend of the increasing domestic carbon emissions intensity caused by urban expansion.

2.3. Carbon Reduction Mechanism of Urban Public Facilities

Urban public transportation is often regarded as the main low-carbon mode of transportation for residents due to its lower per capita energy consumption. Its accessibility [3,50] determines the service capacity of the public transportation and the degree of attraction to low-carbon travel choices for residents. Related studies have shown that balanced spaces with strong road network connectivity and dense transportation stations are more conducive to green travel for residents [51]. In areas with a high density and good accessibility of bus stops, people are more inclined to use green transportation methods [52]. However, the drawbacks of the public transportation system in big cities are also evident, such as longer commuting distances, slower bus speeds, and greater impact on travel time and costs from urban transportation. There have been studies on optimizing the public transportation system in large cities, which suggest that a multi-level public transportation system dominated by high-capacity buses is more advantageous for improving urban public transportation conditions [53]; The construction of rail transit is positively correlated with low-carbon travel for residents [54], especially the supply of subway services can effectively reduce carbon emissions during travel [25,55]. The collaborative carbon reduction mechanism between urban rail transit and conventional public transportation systems is a topic worth exploring. The operation mode of the subway has the advantages of fast speed and no traffic congestion, fixed driving speed, predictable travel time and cost, and high convenience; In the situation where the urban road traffic tends to be saturated, increasing conventional public transportation can increase transportation capacity and reduce the service radius of bus stops, but it cannot guarantee driving speed, which has a significant impact on residents’ public transportation choices. Based on the above analysis, we can make the following reasonable assumptions.
Hypothesis 6:
The conventional public transportation system has the advantage of a wide range of services, while rail transit has advantages in speed and volume of long-distance transportation. The construction and operation of subways can form a fast and convenient replacement system together with the conventional public transportation system, significantly strengthening the synergistic relationship between conventional public transportation and carbon emissions.
The “last mile” from urban public transportation stations to communities is also an important factor affecting whether residents choose public transportation for travel. Its influencing factors include residents’ acceptance of the distance and the comfort and safety of walking or non-motorized travel space. Related studies have proven that the environmental quality and spatial interface of urban spaces have a strong guiding effect on residents’ walking choices [29]. When the comfort experience of residents walking from the community to bus stops outweighs the adverse experience brought about by the increase in walking time costs, it is reasonable to believe that the comfort of the walking environment increases the probability of residents choosing bus travel.
Hypothesis 7:
The comfort level of the urban walking environment can guide residents to take public transportation, thereby strengthening the positive relationship between urban public transportation and carbon emissions from residents’ daily lives.

3. Research Methods

3.1. Construction of Econometric Models

Based on the theoretical analysis and proposed hypotheses, this article takes 30 provincial capitals and municipalities directly under the central government in China as the research object, focusing on exploring the impact of urban economic, social, and demographic factors on the carbon emissions of urban residents. Logarithmic processing of relevant variables was performed to alleviate heteroscedasticity. During the data analysis process, a Hausman test was conducted, and the results showed a p-value of 0.0000, rejecting the original hypothesis and indicating that a fixed effects model should be used.
Based on the study of 30 urban individuals and their different attributes in the paper, there are fixed characteristics such as size and population among urban individuals, and the impact of different attributes of urban individuals on the dependent variable varies. At the same time, there are differences in low-carbon management levels among different cities, which cannot be observed. Therefore, an individual fixed effects model is selected for analysis. Wald’s test was performed on the panel data, but the time effects model did not pass the test, confirming the analysis results that require a fixed effects model. The model is constructed as follows.
The model is constructed as follows.
C i t = α i + β e m a i n   E i t + γ k c o n t r o l   K i t + μ i + ε i t ( i = 1 , 2 , . . . , 30 ; t = 2002 , 2003 , . . . , 2019 )
This model investigates the impact of external factors such as the comfort of the walking environment and the service capacity of public facilities in cities, as well as internal factors such as the income and education level of citizens, on carbon reduction in their daily lives. C i t represents the residential carbon emission intensity of City i in year t . m a i n   E i t represents the external factors such as the walking environment comfort, public facility service capacity, as well as the internal factors such as the citizen income and education level of City i in year t . c o n t r o l   K i t represents the control variable K of City i in year t , μ i represents the individual effects, δ t represents the time effects, and ε i t represents a random disturbance term, which are unobserved variables.

3.2. Data Sources and Variables

The macro data of urban economic development come from the global economic and financial database, and the data related to urban construction come from the annual China Urban Construction Yearbook and the macro data of prefecture level cities in the global economic (financial) database. Due to the impact of COVID-19, the Chinese government implemented various epidemic control measures between 2020 and 2022, including suspending all social activities of urban residents. These measures caused abnormal carbon emissions in residents’ lives and urban economic and social activity data, significantly impacting the analysis results. Therefore, data from 2002 to 2019 were selected as the sample interval, and after removing missing samples, the final sample size obtained through data processing was 487.
In variable processing, indicators such as the green space rate (GSR) and greening rate (GR) serve to delineate the comfort of pedestrian spaces within urban built-up areas. Meanwhile, metrics such as the urban built-up area (UBA) and population density (PD) are employed to characterize the dimensions and dispersion of urban locales. The average wage (AW) of residents is utilized to gauge the income levels prevalent among urban inhabitants, while the per capita public green land area (PPG) and bus configuration intensity (BCI) are leveraged to assess the extent of urban public service provisions. The per capita education expenditure (PCE) represents the average level of education among residents, while the total retail sales of consumer goods (TSC), fiscal revenue (FR), urban built-up area (UBA), GDP, night lighting (NL), subway presence (SP), number of parks (NP), green area (GA) and public facility investment (PFI) are used as the control variables.
The dependent variable and the primary explanatory variable are computed as follows. Due to the lack of direct data sources for carbon emissions in urban households, this article draws on relevant research [56,57,58] and introduces household energy consumption carbon emission standards to calculate the carbon emissions of the main energy consumption in household life. The calculation formula is as follow.
C = i = 1 n R n S n O n
In the formula, C represents the carbon emissions of urban households, R n represents the energy consumption n , S n represents the standard carbon emissions per unit energy consumption of the energy n , and O n represents the carbon sink compensation for the energy consumption n . The energy consumption types selected in this article include residential electricity consumption, natural gas usage, tap water usage, and domestic sewage treatment.
The bus configuration intensity is the ratio of the number of urban buses to the length of urban roads (Formula (2)). Compared to common factors such as the number of buses per 10,000 people, the bus density can reflect the comprehensive relationship between the urban bus configuration, urban population, built-up area, and road network density. It is an intuitive reflection of the number of buses operating on urban roads. Considering the issue of travel costs for residents, the purpose of choosing buses is more likely to be the ability to reach the destination quickly, and the indicator of bus density can better express the low time cost of waiting for buses on urban roads and the convenience of transfer.
R b i = N b i P a i P i R d i
In the formula, R b i represents the public transportation density of the city i , N b i represents the number of public transportation configurations in city i , P a i   is the per capita construction land area of city i , P i represents the population of the city, and R d i represents the road network density of the city.
To measure the degree of land use mixing in different periods for each city, an information entropy calculation model is introduced. The information entropy of the land use structure mainly measures the degree of order, balance, and concentration of the land use status in a region [59,60]. Jie T. (2010) used the information entropy method to analyze the status and the existing main problems of urban land utilization in a quantitative way to come up with strategies to increase the efficiency of urban land utilization [61]. Referring to existing research results [62], assuming that the total area of urban construction land is S , including n types of land, and the area of each type of land is S i ( i = 1,…, n ), the calculation method for the information entropy of the urban land use structure is shown in Formula (4):
H x = i = 1 n P i ln P i
In the formula, H x is the information entropy, and P i is the proportion of land i to the total land area, expressed as S i S .
The information entropy of the land use structure represents the diversity of the land use, and based on this, a land use structure equilibrium model is constructed, as shown in Formula (5).
E = H H m a x = P i ln P i S i ln P i ln n
In the formula, E represents the land use equilibrium degree (LUE) in a built-up area, and the larger the value of E , the more balanced the land use structure.

4. Calculation Results and Analysis

Based on the above analysis, a time–individual dual fixed effects analysis was conducted using the carbon emission intensity of residents as the dependent variable, with social and spatial factors selected in Section 3 as explanatory variables and control variables. This article analyzed the correlation between the single-factor (Table 1) and multi-factor synergy (Table 2) and the carbon emissions intensity of residents, examining the causes of urban planning and construction practices based on the regression results.

4.1. Characteristics of Residential Carbon Emissions

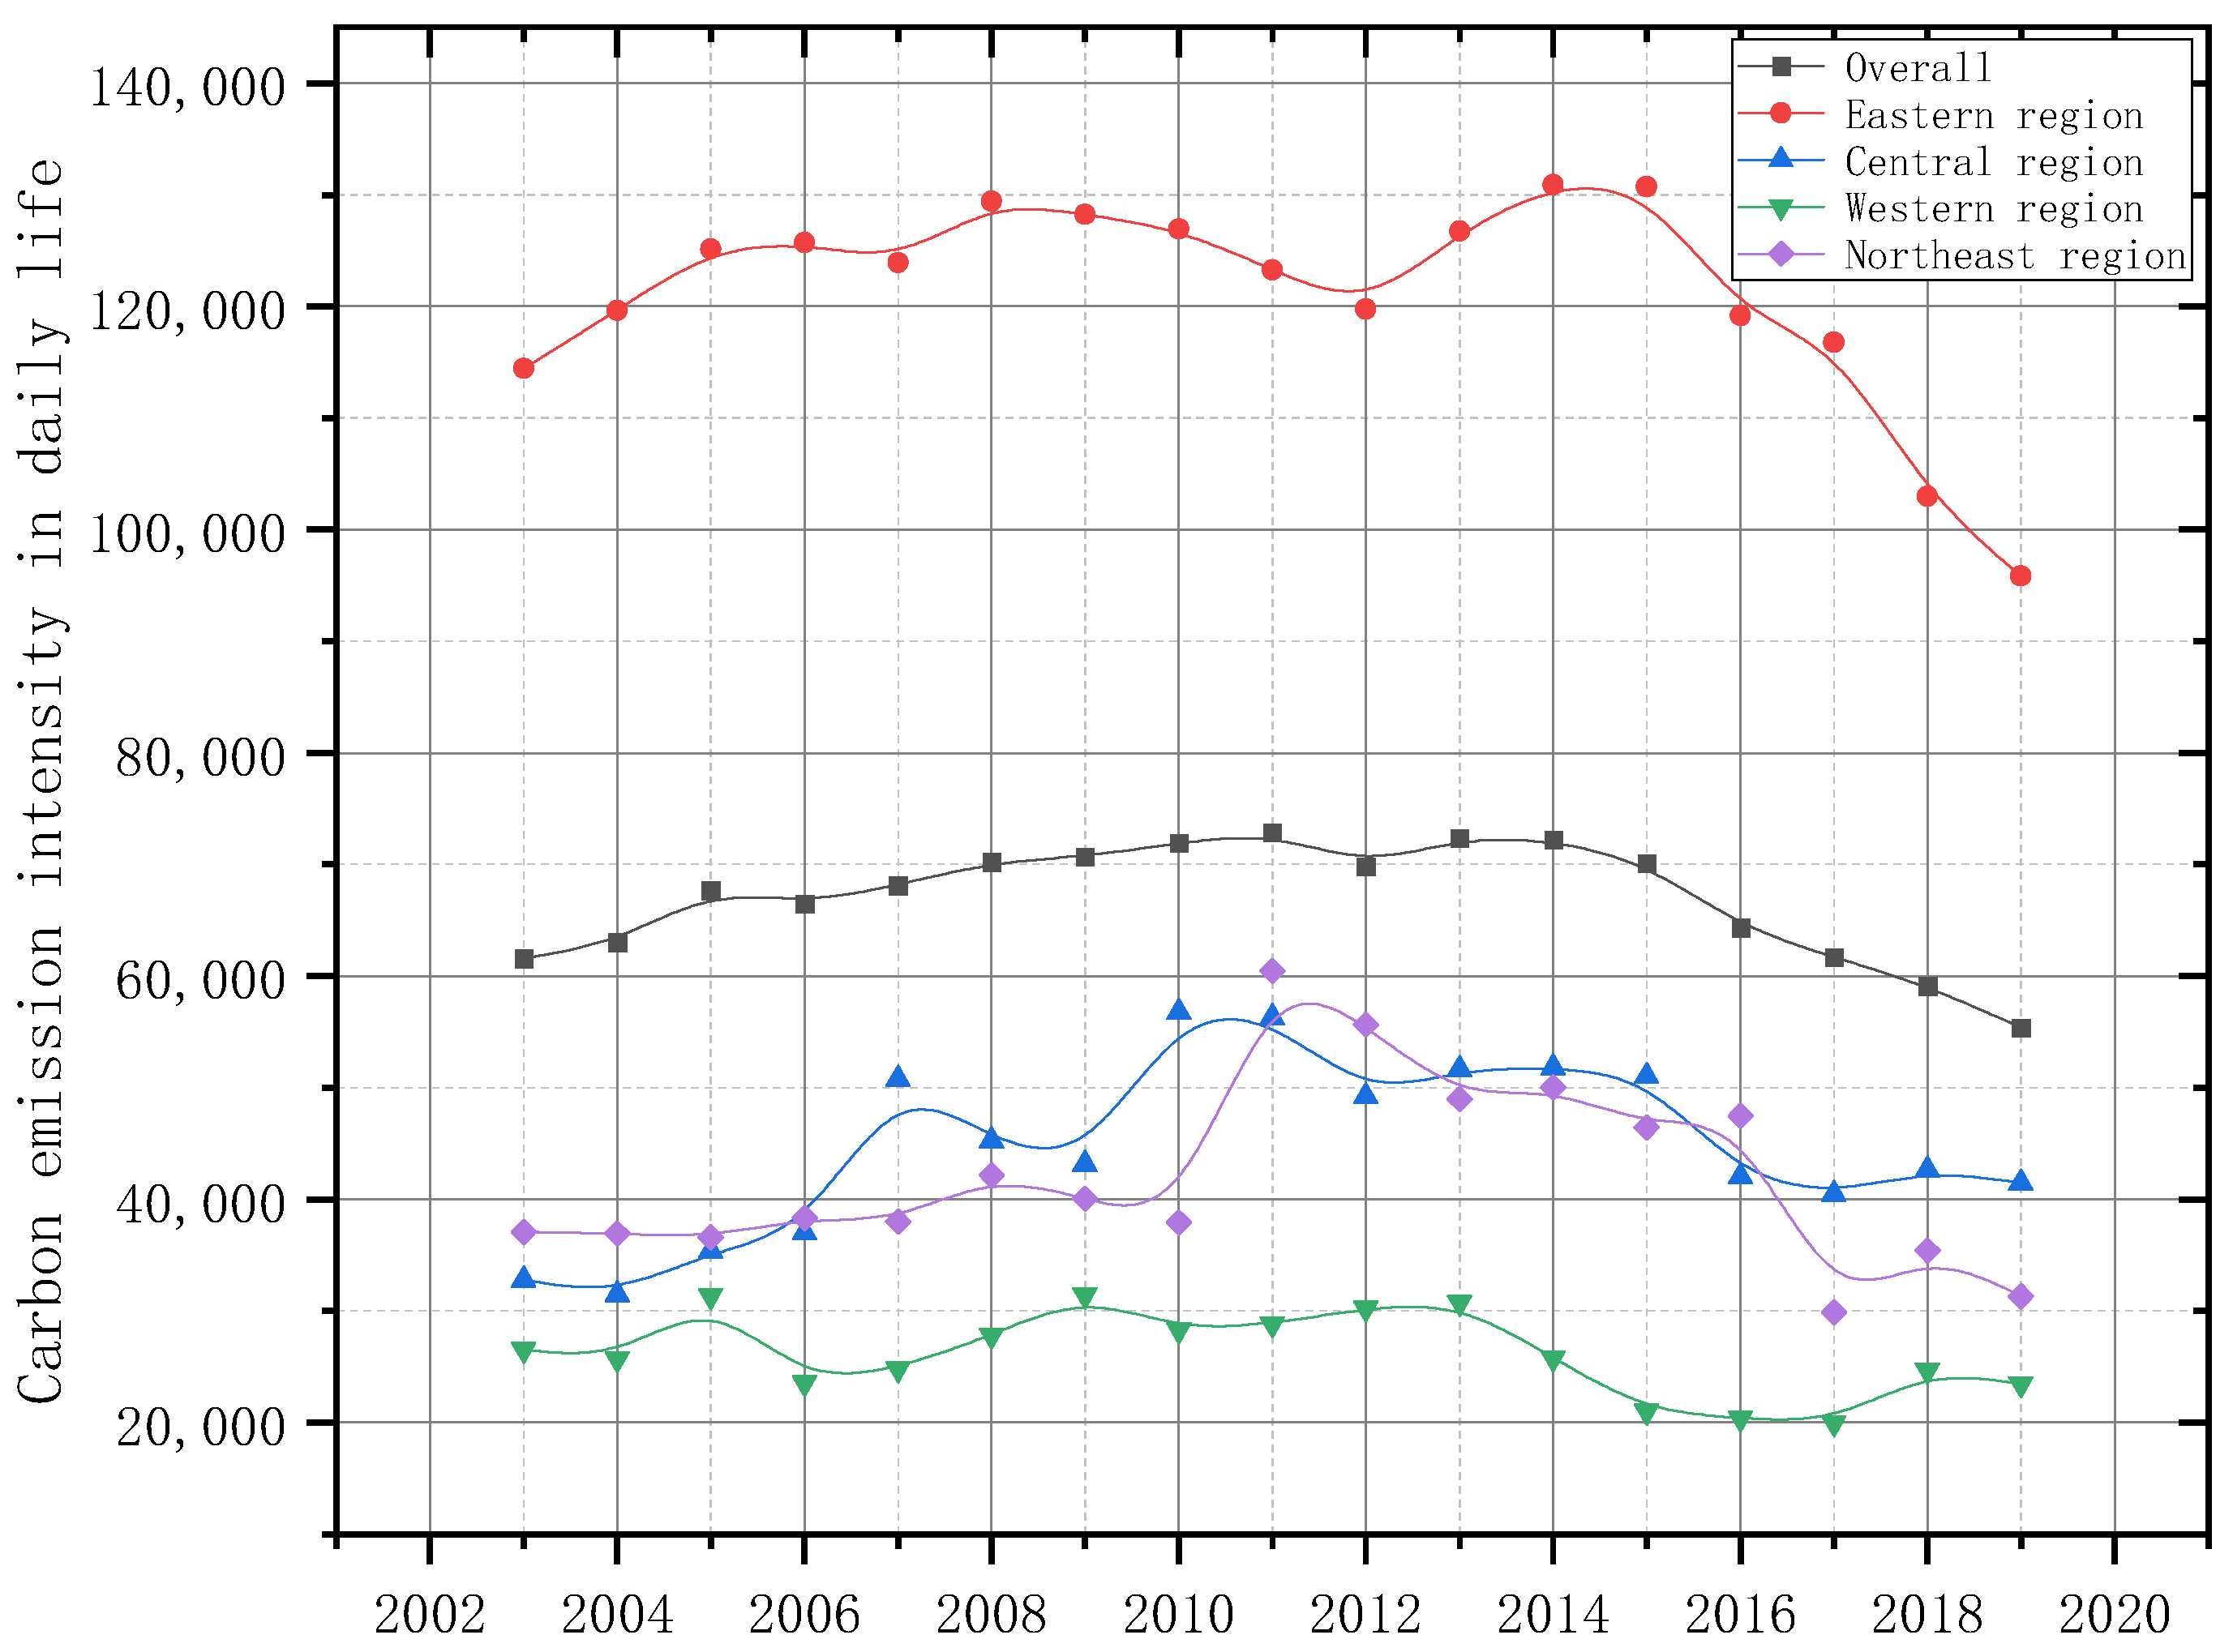
4.1.1. Overall Carbon Emissions

Figure 1 shows the statistical chart of the average total carbon emissions of 30 municipalities directly under the central government and provincial capital cities in China. It can be seen that the average total carbon emissions are on the rise, with an average annual growth rate of 3.98%, which is lower than the GDP growth rate. Especially after 2011, the growth rate of total carbon emissions has tended to flatten. In April 2007, China held a seminar on the low-carbon economy and China’s energy and environmental policies. In June, China released its National Plan to Address Climate Change. In April 2008, the first round table meeting of the China International Cooperation Committee on Environment and Development was held in Beijing. Developing a low-carbon economy and building a low-carbon society have become strategic priorities and important directions for national education in China. Various low-carbon measures have curbed the rapid growth of carbon emissions. From the perspective of the regional distribution, the average total carbon emissions of cities in the eastern region are the highest, while the average total carbon emissions of cities in the western region have jumped to second place since 2017, surpassing the average total carbon emissions of cities in the central and northeastern regions. This is related to the backward economic foundation of the western region and the transfer of more high-energy-consuming industries in the eastern region.

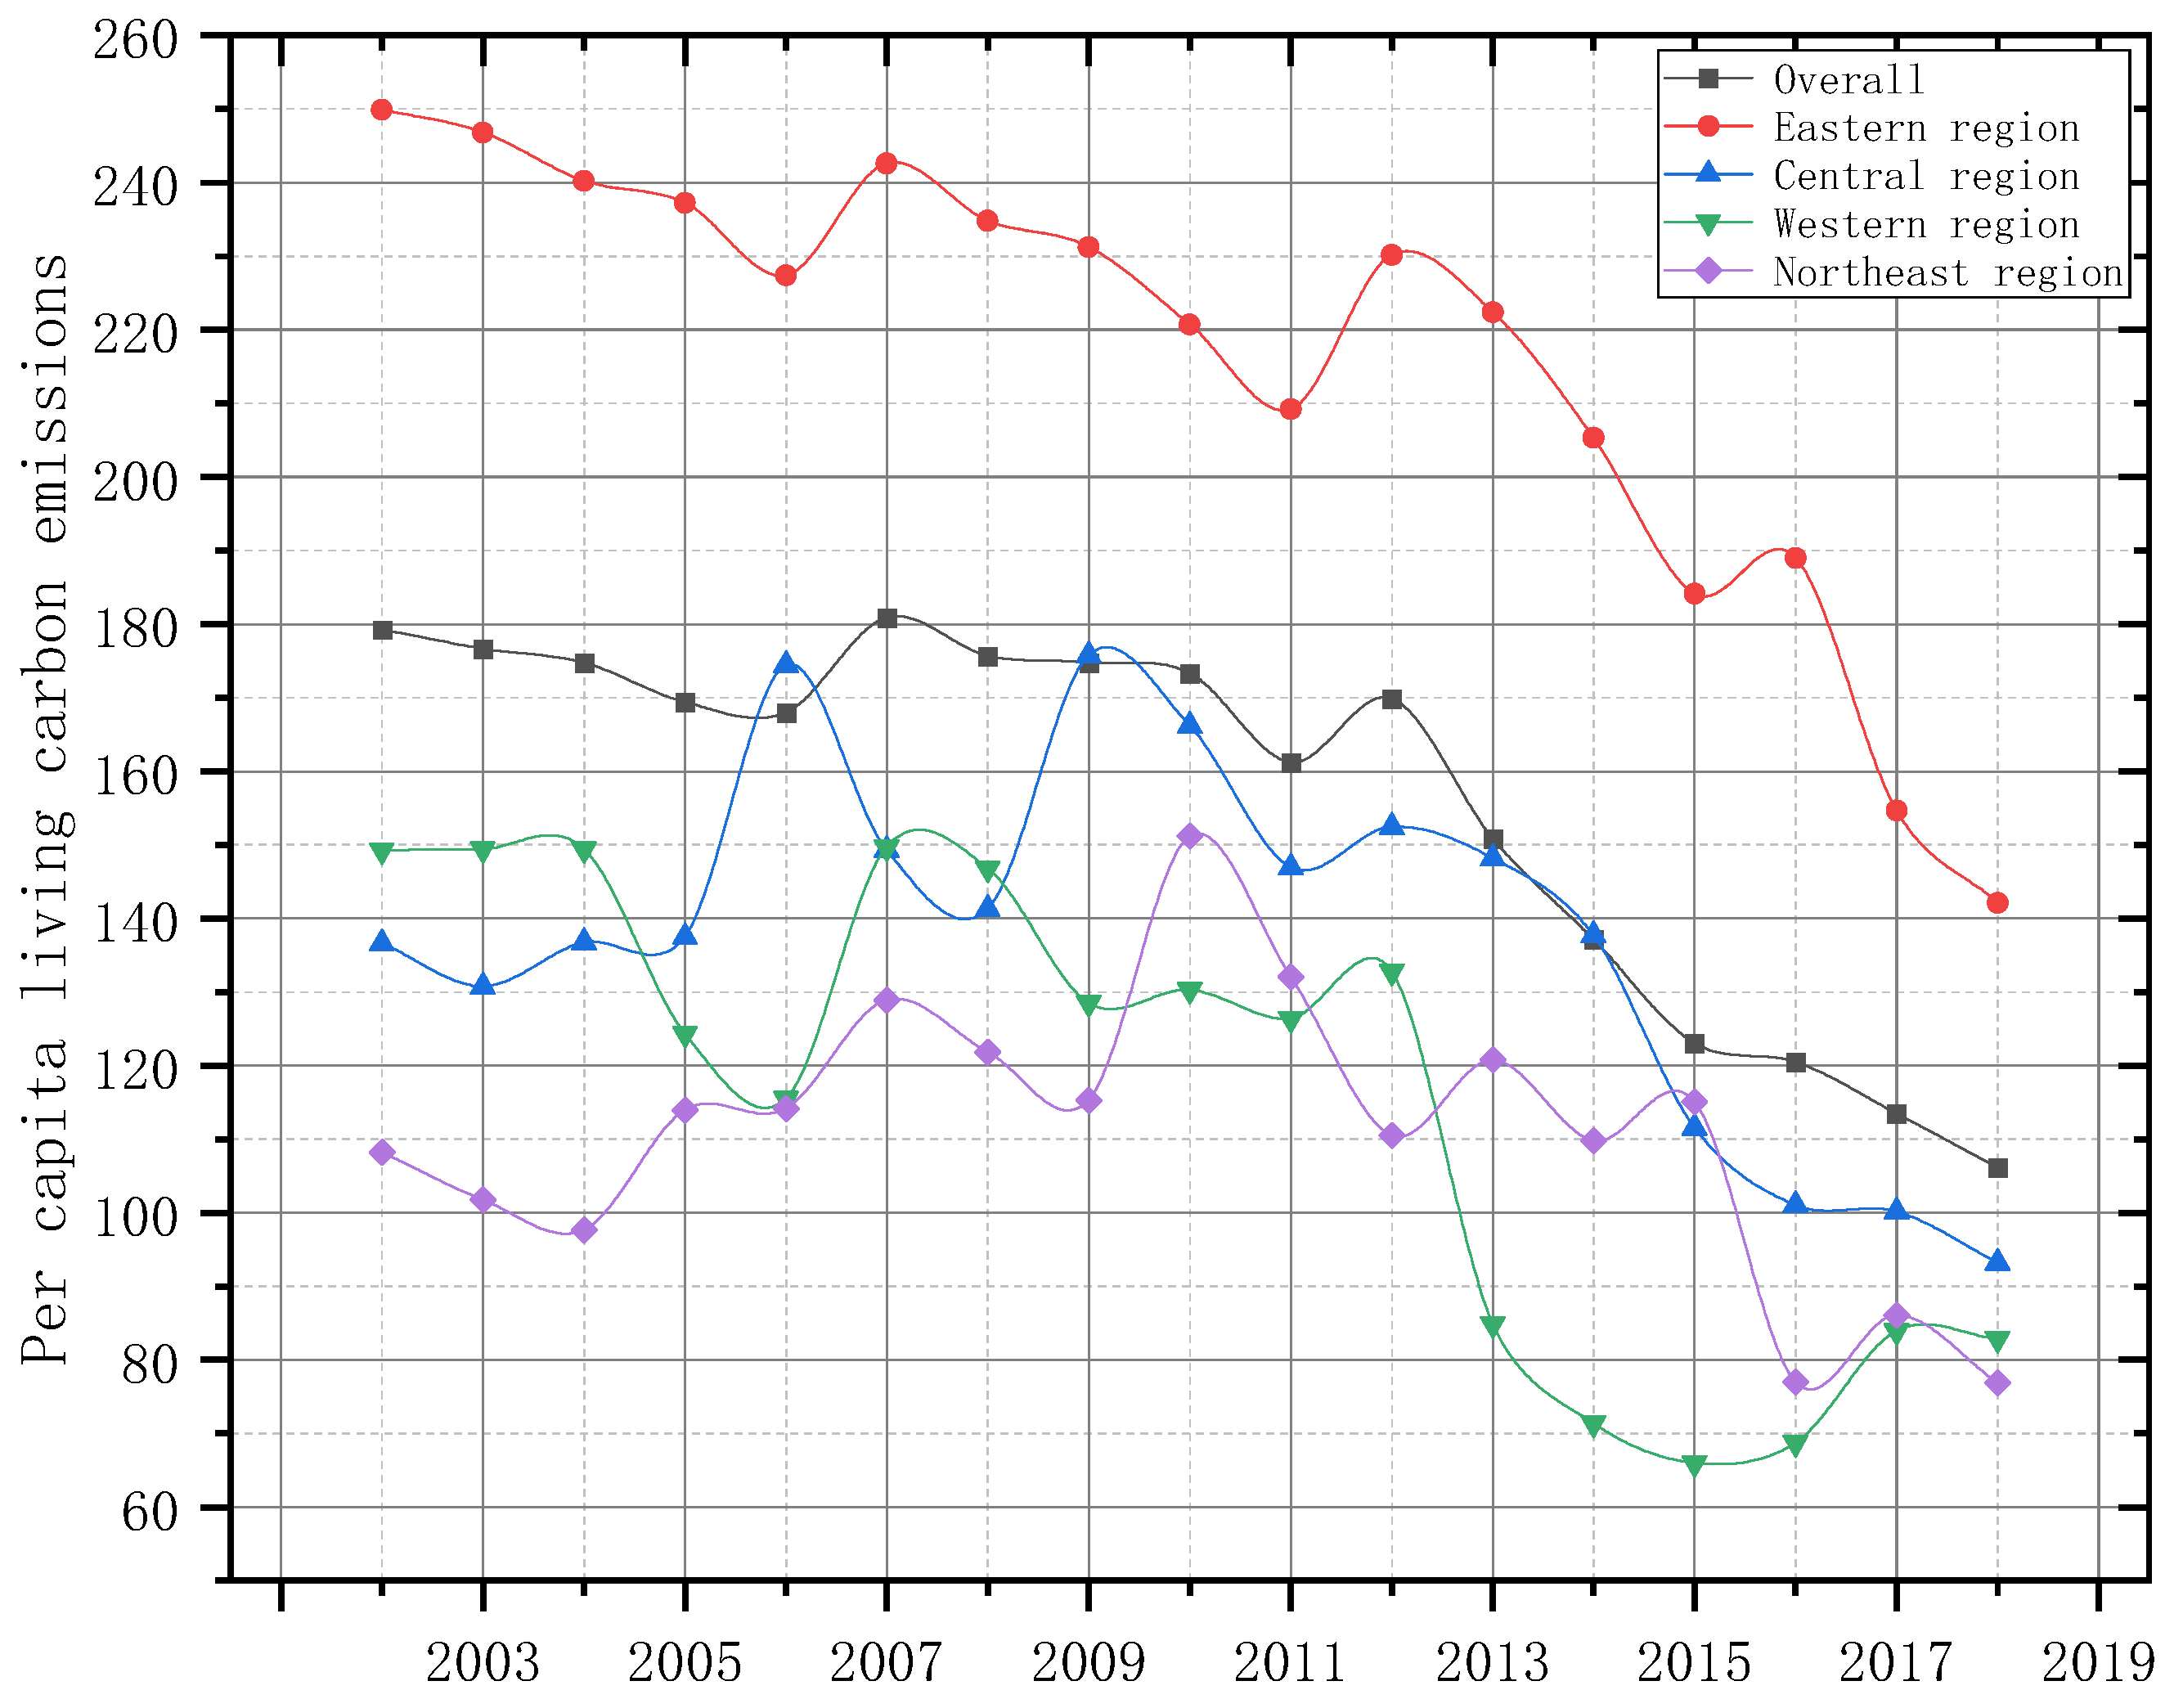
4.1.2. Residential Carbon Emission Intensity

In terms of the residential carbon emissions intensity, although the selected energy consumption type is not sufficient to cover all the carbon sources, it can still reflect the trend of changes in the residential carbon emissions intensity. The intensity of carbon emissions from daily life (Figure 2) and per capita carbon emissions from daily life (Figure 3) both show a downward trend, and the decrease in the per capita carbon emissions is more pronounced, which is directly related to the improvement of China’s urbanization rate and the increase in the urban population. From the perspective of the regional distribution, the carbon emissions intensity of residents in developed cities in the eastern region is much higher than that of other regions. While urban residents in the eastern region benefit from economic development, they also generate a significant amount of carbon emissions. In the new era of urban agglomeration and economic integration construction, strengthening coordinated carbon reduction among regions is a necessary path to seek low-carbon development.
In terms of the time series, the per capita carbon emissions intensity in the eastern region has been decreasing since the start of the statistics, while the other regions have shown peaks during the statistical period. This indicates that residents in developed cities in the eastern region have accepted the concept of low-carbon living and low-carbon technology earlier, and the construction of various public service facilities and low-carbon management policies in cities have shown a clustering effect of reducing the cost inputs and energy consumption earlier with sufficient financial support.

4.2. Factors Affecting Carbon Emissions

4.2.1. Social and Economic Factors

According to Model 1, there is a positive correlation between the average wage of urban residents and the carbon emissions intensity of residents, and it is statistically significant at the 5% level of significance. The correlation coefficient is 126.358, which implies that with a 1 unit increase in the average wage of urban residents there will be a 126.358 unit increase in the carbon emissions intensity of residents. Likewise, the population density of urban built-up areas also has a positive influence the carbon emissions intensity of residents at the 5% level of significance, and the correlation coefficient is 17.031. This implies that with a 1 unit increase in the urban population density there will be a 17.031 unit increase in the carbon emissions intensity. Thus, we can say that both the average wage and the urban population density play a leading role in the carbon emissions intensity of residents.
It is worth noting that the analysis results do not support the classical environmental Kuznets curve hypothesis, as the dependent variable in this study is household carbon emissions, not overall carbon emissions. Household carbon emissions do not include greenhouse gas emissions from industrial and agricultural production. This result also confirms the conclusion that the environmental Kuznets curve hypothesis should and can be questioned, as proposed in relevant studies [63].
The population density in built-up areas characterizes the degree of urban population congestion, and it is closely related to the vitality of urban economic development and the ability to attract foreign populations. That is, the rapid development of the urban economy has attracted a large number of foreign populations to work in the city, and the rapid construction of the city has not focused on solving the housing and living problems of this part of the foreign population, which is known as the floating population in China. According to the correlation analysis between the population density and the floating population in provincial capital cities, it can be seen that there is a significant positive correlation between the number of the urban floating population and the population density (P > |z| = 0.002), which accounts for a large proportion of the population in economically developed cities (Figure 4). The concentration of a large number of migrant populations with strong mobility and distribution uncertainty makes it difficult for various urban infrastructure and public service facilities to provide convenient services to this group of people. The insufficient level of centralized construction and facility sharing has led to an increase in living costs and energy consumption.
Related studies have shown that, when the urban population size is greater than one million, the increase in the population density leads to more carbon emissions of total, industrial, residential, or transportation carbon emissions [64]. The conclusion of this study aligns with the findings of this article. The average population of provincial capital cities in China reached 2.6 million in 2002, far exceeding the threshold of 1 million. The factors influencing the carbon emissions intensity of residents in small and medium-sized cities with populations of less than 1 million still require further in-depth research.
There is a negative correlation between the urban GDP and the per capita carbon emission intensity at the 5% level of significance. The coefficient is −107.479, which indicates that with a 1 unit increase in the urban GDP there will be a 107.479 unit decrease in the carbon emission intensity of residents. The GDP represents the level of economic development of a city. Cities with high levels of economic development are more capable of constructing various infrastructure and public service facilities, providing residents with more low-carbon lifestyles. At the same time, they have advantages in promoting low-carbon technology and awareness in households, which have a positive influence on reducing the carbon emissions intensity of residents.

4.2.2. Urban Space and Facility Factors

Model 1 shows that the per capita carbon emissions intensity has statistically significant positive relations with the built-up area, bus configuration intensity, and green space area. In the meantime, the per capita carbon emissions intensity has statistically significant negative relations with whether subways are opened, the number of parks, and the per capita public green space area.
The area of built-up areas is an indicator of the scale of urban land use. The larger the area of a city, the more difficult it is to achieve a reasonable and achievable balance between work and residence. The probability of long-distance commuting for residents will greatly increase. Emphasizing the mixed use and intensive development strategy of land, concentrating and compact planning of urban construction land, and avoiding the infinite expansion of urban scale are effective conditions for reducing the intensity of carbon emissions in daily life [65]. Green space includes two types of land: park green space and protective green space. From a functional perspective, it can be divided into two categories: those with and without citizen play functions. For example, protective green spaces on both sides of urban main and secondary roads, although large in scale, are mainly used to protect against pollutants such as noise and car exhaust, and they do not provide too many recreational and recreational facilities for residents. For these types of land, they do not have a strong ability to attract residents to engage in outdoor activities, but they also require a large amount of construction and maintenance costs. The positive influence of reducing local residents’ living emissions is not obvious. This can be proven from the negative correlation between the per capita public green space area and the intensity of carbon emissions in daily life. Public green space mainly refers to green spaces that are open to the public and can carry a certain scale of population for leisure and entertainment, with strong participation attributes and the ability to attract crowds. The per capita park green space area reflects the scale level of the park green space that residents can share and the comfort level of using the park green space, which verifies the validity of hypothesis 1.
From Model 1 and Model 3, it can be seen that there is a statistically significant negative correlation between the squared value of the intensity of the urban bus configuration and the intensity of household carbon emissions, and the correlation coefficient is −8.757. Based on the U-test, the results reject the original “U-shaped relationship” hypothesis, which states that the intensity of the urban bus configuration has an inverted U-shaped relationship with the intensity of household carbon emissions. Within a certain range, there is a positive correlation between the carbon emissions intensity and the bus configuration intensity. After the carbon emissions intensity reaches its peak, there is a negative correlation between the bus configuration intensity and the carbon emissions intensity.
From Model 1 and Model 2, it can be seen that the square value of the number of urban parks is significantly negatively correlated with carbon emission intensity. Through the U-test, the results reject the original “inverted U-shaped relationship” hypothesis, which states that there is a “U-shaped” relationship between the number of urban parks and the carbon emissions intensity of residents. Within a certain range, there is a negative correlation between the carbon emissions intensity and the number of parks. After reaching a valley in the carbon emissions intensity, there is a positive correlation between the carbon emissions intensity and the number of parks, which is consistent with hypothesis 2. Within a certain range, the increase in the number of parks means that more residents can enjoy park services nearby, while reducing energy consumption in household life. After the number reaches a certain range, the increase in parks cannot continue to increase the number of residents and the frequency of outdoor activities. At the same time, from the current situation of transportation around urban parks in China, it can be seen that parks often become nodes of crowd and traffic aggregation in urban public spaces. Eugen Rosca (2014) conducted a case study in the Carpathians and outlined that the weekend leisure time and the business tourism are among the human activities most responsible for road traffic congestion and therefore for the greenhouse gas emission [66]. Redundant parks bring more congestion points to urban transportation, which will have a negative impact on the reduction of the carbon emissions intensity for residents.

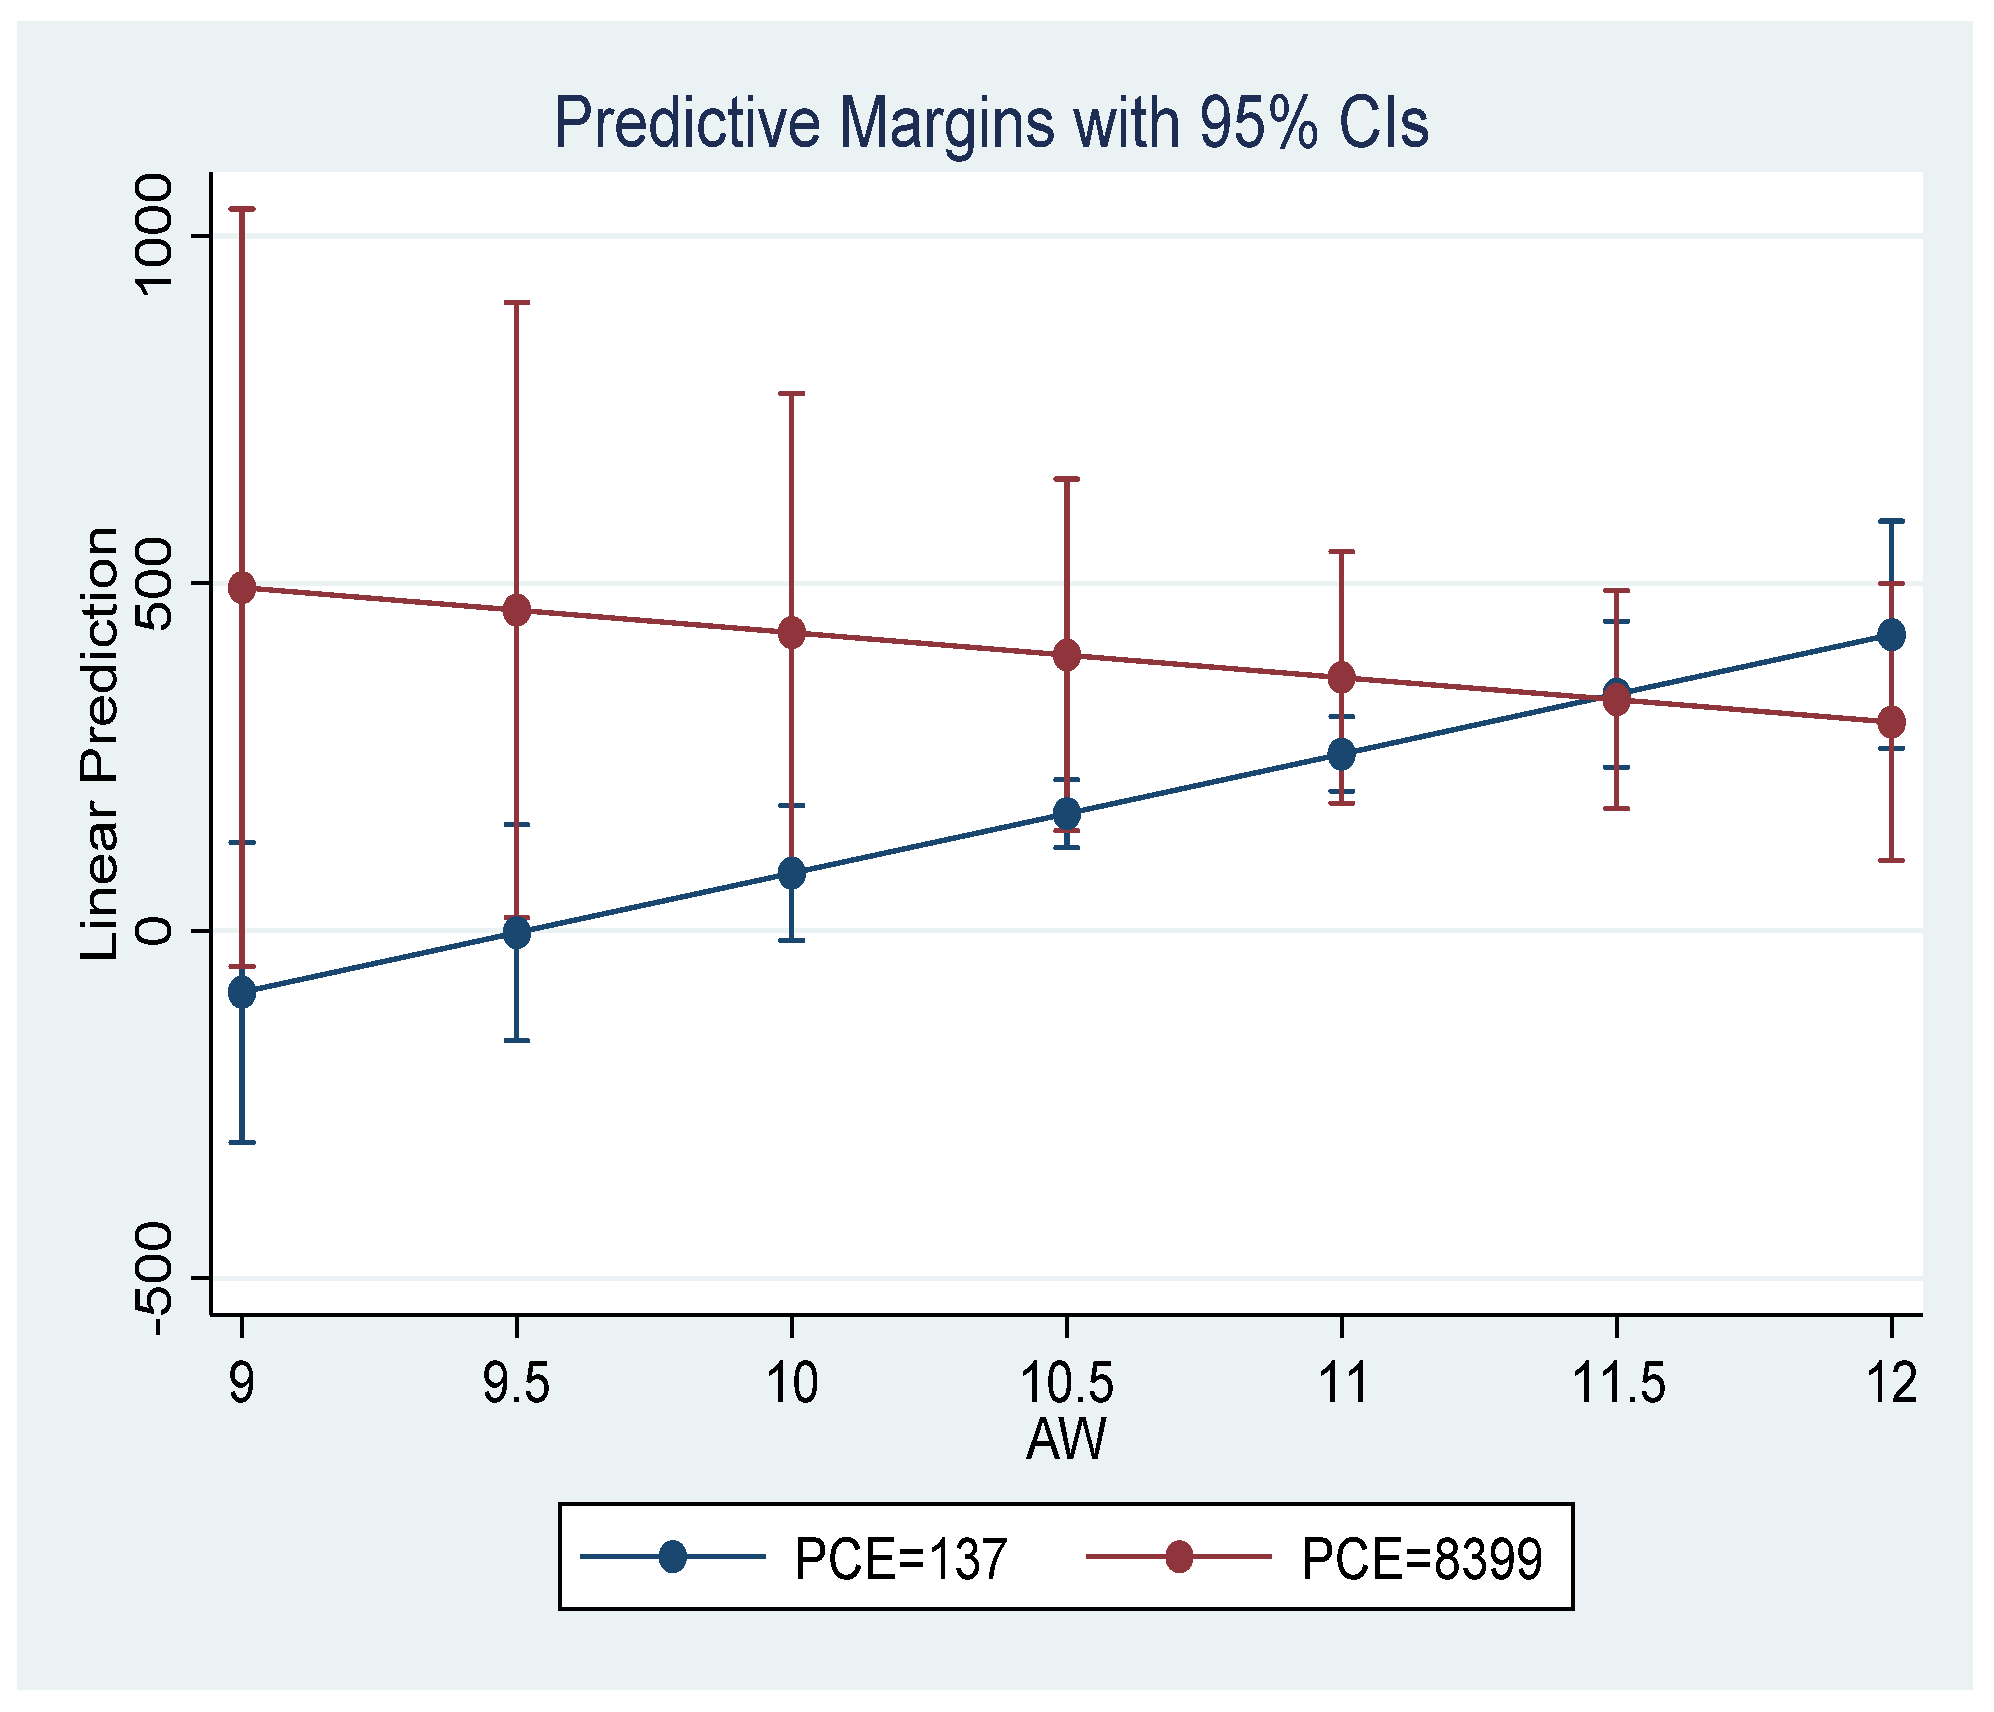
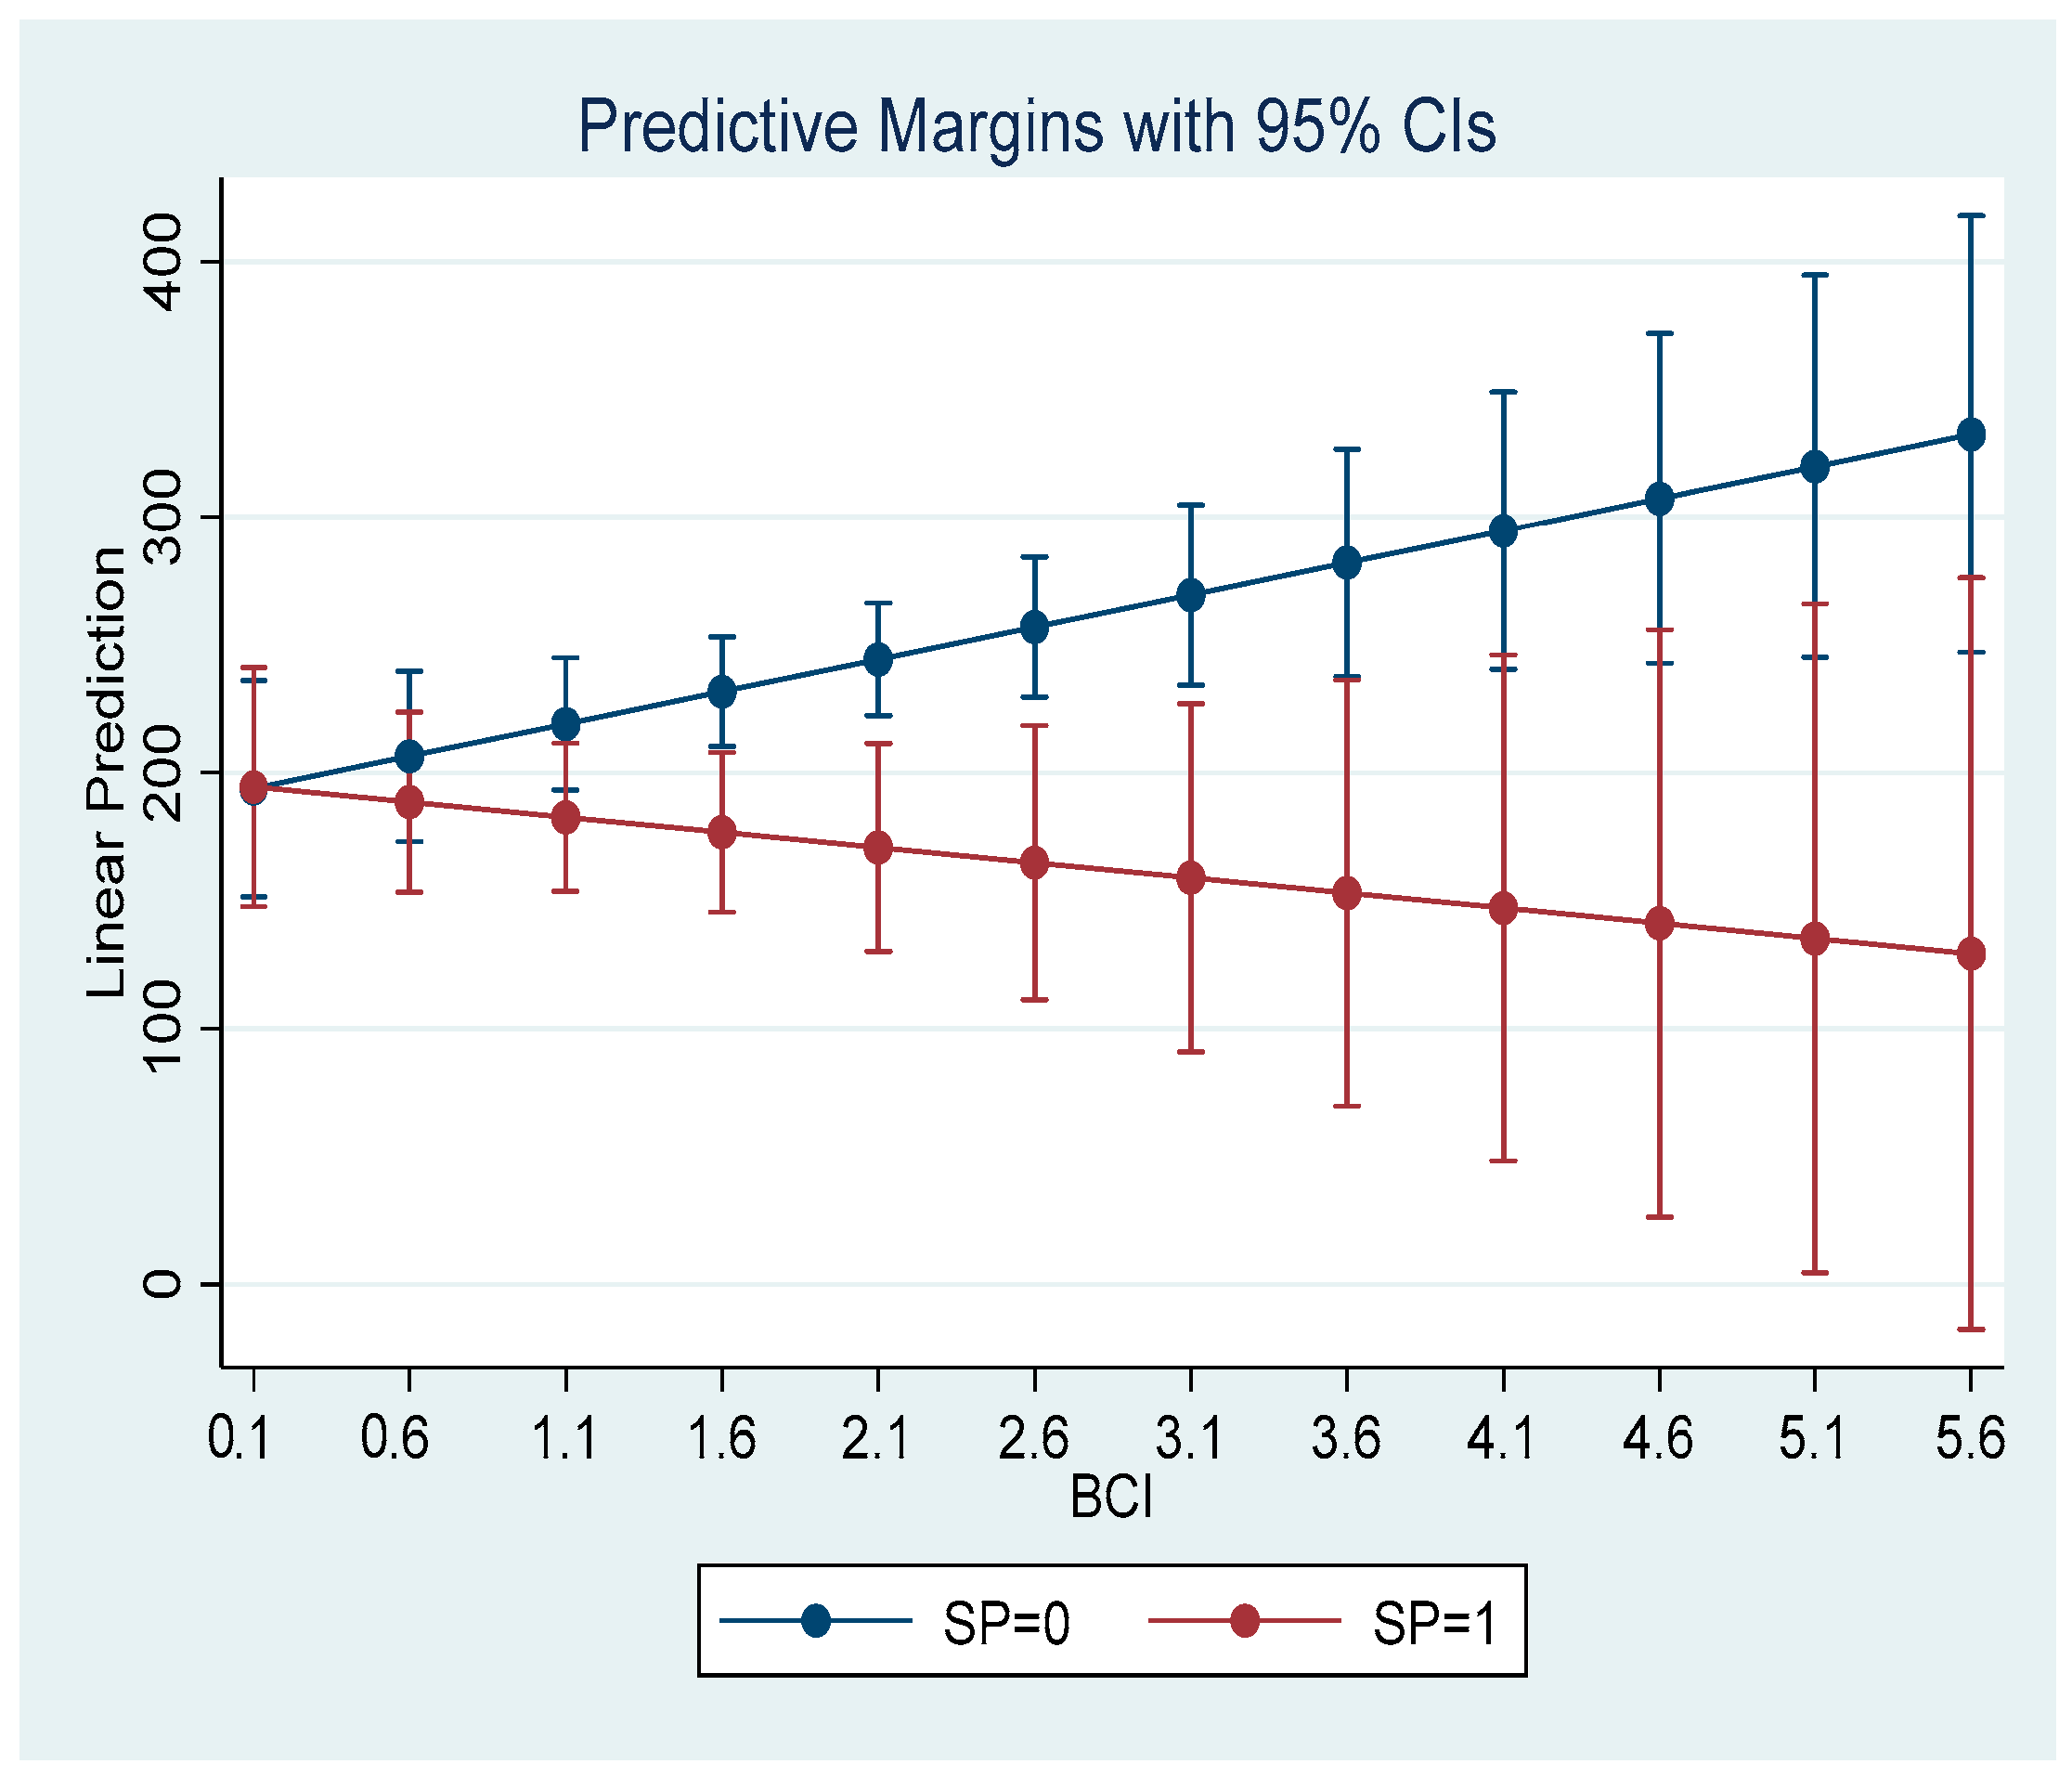
4.2.3. Synergistic Carbon Reduction Effect of Urban Elements

According to Model 4, it can be seen that the education level has a significant weakening effect on the positive relationship between the wage level and carbon emissions (as shown in Figure 5), and the correlation coefficient is −0.0286 at the 5% level of significance, which is consistent with the results of hypothesis 3. Good education not only strengthens residents’ low-carbon awareness, but also enhances their ability to select for low-carbon lifestyles, enabling them to improve their low-carbon living skills on the basis of mastering scientific knowledge such as the basic principles of carbon emissions in daily life. The impact of education level on residents’ carbon emissions is a dual effect of internal motivation and external influence.
According to Model 5, subway construction can enhance the positive effect of ordinary public transportation on carbon reduction (Figure 6), which is consistent with hypothesis 5. The connection composite network of the subway and the conventional public transportation system can lever-age the dual advantages of controllable cost of long-distance transportation capacity of the rapid transit system and high accessibility of buses. It has a dual role in relieving urban traffic pressure and guiding residents to travel by public transportation, and it has a positive impact on reducing carbon emissions from transportation. Related studies have also shown that time sensitivity is an important basis for travelers to choose transportation modes, and travelers’ measurement of the benefits of different transportation modes is the standard for choosing transportation modes. In the context of increasing ground traffic pressure, the construction of subways can alleviate the problem of delays in conventional public transportation [67]. The connection between subways and conventional public transportation combines the advantages of subways being less congested and conventional public transportation stations being widely distributed, which has positive significance in promoting low-carbon public transportation for residents.
According to Models 6 and 7, it can be seen that the comfort level of the urban walking environment, characterized by the green space ratio and green space ratio, can enhance the positive effect of public transportation on carbon reduction (Figure 7 and Figure 8), which can support the viewpoints of hypothesis 1 and hypothesis 7. Rohana Sham (2020) analyzed the factors influencing residents’ choice of walking environments, pointing out that factors such as sidewalk coverage significantly improve the comfort of the walking environment, which is an important measure for promoting a lower carbon footprint [68]. This viewpoint is mutually supportive of the analysis results in this article. Improving the green space ratio and green coverage can increase the low-carbon travel frequency by enhancing the comfort of the walking environment.
The last mile of public transportation is one of the important reasons that restrict public transportation for residents. Strengthening the greening of urban streets and the safety of walking environments can enhance the attractiveness of public transportation to residents and expand the service radius of urban bus stops. From the perspective of environmental behavior, this is an effective attempt to reduce carbon emissions caused by private car travel by increasing the proportion of public transportation travel through urban space creation and public transportation configuration. Although the increase in green coverage cannot enhance the attractiveness of urban public spaces to low-carbon travel for residents by increasing the green space service capabilities, the increase in green plants, especially those with larger canopies, can significantly improve the urban environment and microclimate. At the same time, it can also increase the shaded area, making the outdoor environment more comfortable, thereby increasing the probability of low-carbon travel and outdoor activities for residents in their daily lives. From the analysis results, it can be seen that the construction of urban green spaces can be started from two aspects: increasing the green space area and increasing the large crown plants. Especially in some old urban areas with limited land, optimizing the types of roadside trees and park greening, and increasing the large crown plants, has a positive impact on optimizing the outdoor spatial environment and improving low-carbon behavior.
According to Model 8, the urban scale represented by the built-up area can weaken the negative relationship between economic development and residential carbon emissions (Figure 9), and the correlation coefficient is 0.04 at the 5% level of significance. This conclusion is consistent with one of the analysis results of Model 1, which is that there is a significant positive correlation between the urban built-up area and the carbon emissions intensity of residents. Some scholars believe that the direct consequence of the expansion of the urban built-up areas is the increase in commercial, residential, and other land use, leading to the decreased connectivity of green spaces, thereby reducing the self-regulation and stable feedback of the regional carbon cycle. The carbon emissions from infrastructure construction will also increase with urban-scale expansion [69]. The expansion of the urban scale due to urbanization increases the discrete state of urban functional units and the degree of motorization of transportation [70], thus increasing energy consumption. The impact of the urban size on carbon emissions has become a research consensus. The analysis results of these two models indicate that urban construction and management strategies that shift from outward expansion to inward stock optimization construction have a positive impact on the reduction of the residential carbon emissions intensity.
According to Model 9, an increase in the balance of construction land can strengthen the positive correlation between the population density and carbon emissions intensity (Figure 10), which is consistent with hypothesis 5. According to the previous analysis, the correlation factors for the increase in the carbon emissions intensity caused by the increase in the population density are the clustering of a large number of mobile populations in cities and the uncertainty of their distribution in cities. The root cause of the problem lies in the inability to accurately generate statistics and predict the current characteristics and development trends of mobile populations in the planning and construction of various public service facilities in cities. The balance of land use is used to measure the size of various construction land gaps. The smaller the gap, the greater the balance of land use. At the same time, the higher the mixed use of land, the more conducive it is to concentrate various effective resources and stimulate urban development vitality [71,72]. This means that cities with a high balance often have more dynamic economic activities, which is consistent with the previous analysis of the mobile population.
The Code for Classification of Urban Land Use and Planning Standards of Development Land (GB 50137-2011) issued by the Ministry of Housing and Urban Rural Development of China recommends the ideal proportions of five types of construction land, namely residential land (25–40%), public management and public service land (5–8%), industrial land (15–30%), road and transportation facility land (10–25%), and green space and square land (10–15%) [73]. The increase in the balance also means that the scale of various types of construction land in cities exceeds the optimal proportion. From the perspective of increasing population density, a large amount of foreign construction land has exceeded the optimal proportion. The influx of population is concomitant with the expansion of urban industrial land, wherein this demographic segment does not achieve urbanization through conventional real estate ownership but rather inhabits the city through alternative arrangements such as co-renting or group renting. Consequently, in cities accommodating a significant migrant population, the proportion of residential land is dwindling relative to the ideal ratio. This phenomenon underscores a pivotal aspect of enhancing the equilibrium of urban construction land. Reducing the balance of urban construction land is an effective exploration to alleviate the increase in the living carbon emissions intensity caused by the large population agglomeration. The strategies implemented by many cities in China, such as the “the relocation of industries from urban areas and the development of the tertiary industry in urban areas” and “industry entering parks,” are good evidence of this analysis. These policies not only help to reduce the balance of urban construction land but also guide a large number of industrial populations, especially mobile populations, to concentrate on the outskirts of cities near industrial parks, effectively reducing the commuting distance and urban traffic congestion.

4.3. Robustness Testing

To test the overall robustness of the regression model, this article draws on existing research [74,75] and conducts robustness tests on the above models by changing the sample size. The specific method is to delete the data from the two years when China’s urban electricity shortage occurred in 2003 and 2010. The results show that the estimated regression coefficients of the main independent variables and explanatory variables of all the models have not changed significantly, and all the models have passed the robustness test (Table 3). The analysis of the factors related to the intensity of carbon emissions among residents in this article is reliable. The impact of economic, social, and spatial factors on the carbon emissions of urban residents is manifested in the direct impact of single factors and the synergistic effect of multiple factors. This can provide a basis for exploring low-carbon urban development strategies in the fields of urban and rural construction, planning, and management.

5. Conclusions

Among the factors significantly correlated with the carbon emissions intensity of urban residents, the average wage (correlation coefficient: 126.36), built-up area (correlation coefficient: 0.21), population density (correlation coefficient: 17.03), and green area (correlation coefficient: 34.66) are positively correlated with the carbon emissions intensity, whereas the GDP (correlation coefficient: −107.48), subway presence (correlation coefficient: 37.85), and per capita public green (correlation coefficient: −38.88) are negatively correlated with the carbon emissions intensity. In terms of the synergistic effect of urban elements on carbon reduction, subway construction can strengthen the positive effect of ordinary public transportation on carbon reduction (correlation coefficient: −37.07, p = 0.034), education expenditure can weaken the positive correlation between income level and carbon emissions intensity (correlation coefficient: −0.03, p = 0.04), the comfort of the urban walking environment characterized by the greening rate (correlation coefficient: 3.47, p = 0.002) and green space ratio (correlation coefficient: 4.52, p = 0.000) can strengthen the positive effect of public transportation on carbon reduction, while the urban scale characterized by the built-up area can weaken the negative correlation between economic development and carbon emissions (correlation coefficient: 0.04, p = 0.051). The increase in the land use equilibrium can strengthen the positive correlation between population density and carbon emissions intensity (correlation coefficient: 0.04, p = 0.053).
Reducing carbon emissions in the lives of urban residents is an effective way to reduce urban carbon emissions and seek green development. Regression analysis conducted on the influencing factors of carbon emissions in the daily lives of residents across 30 municipalities and provincial capital cities in China reveals a comprehensive array of determinants. These factors span the economic, social, and spatial dimensions, underscoring the multifaceted nature of the influences shaping carbon emissions intensity in residents’ daily activities. Simultaneously, when formulating spatial planning and management strategies aimed at reducing carbon emissions, it is imperative not only to acknowledge the individual impact of each element on carbon emission intensity but also to recognize the synergistic emissions reduction effects that emerge from the interaction between different elements. This entails mitigating the trend toward absolute independent operation often associated with “special planning” initiatives. Instead, there is a need to explore optimal planning and design schemes, as well as the temporal dynamics of spatial construction, through the lens of holistic urban spatial system integrity. This approach fosters synergistic efficiencies in carbon reduction across diverse urban elements.
Due to difficulties in obtaining data, this study cannot accurately calculate the inevitable part of the carbon emissions in residents’ daily lives, such as emissions from energy and food consumption that meet basic living needs. Solving this problem in future research can more accurately explore the factors leading to increased carbon emissions in residents’ daily lives, making the research results more instructive for urban construction and management.

Author Contributions

Conceptualization, Y.J. and S.H.; methodology, Y.J. and S.H.; software, Y.J. and S.H.; validation, Y.J. and S.H.; formal analysis, Y.J. and S.H.; investigation, Y.J. and S.H.; resources, Y.J.; data curation, S.H.; writing—original draft preparation, Y.J. and S.H.; writing—review and editing, Y.J. and S.H.; visualization, Y.J. and S.H.; supervision, Y.J. and S.H.; project administration, Y.J. and S.H.; funding acquisition, Y.J. All authors have read and agreed to the published version of the manuscript.

Funding

This research was funded by the Natural Science Basic Research Program of Shaanxi, grant number 2022JQ-491, and by the Natural Science Foundation of China, grant number 52278047.

Institutional Review Board Statement

Not applicable.

Informed Consent Statement

Not applicable.

Data Availability Statement

The raw data supporting the conclusions of this article will be made available by the authors on request.

Acknowledgments

This paper is a continuation and deepening research based on “the influencing factors and mechanisms of carbon emissions intensity in urban residents”, which will be presented at the Annual Meeting of China Urban Planning Society 2024. The authors express gratitude to all those who have conducted preliminary basic research.

Conflicts of Interest

The authors declare no conflicts of interest.

References

  1. Deng, J.-X.; Liu, X.; Wang, Z. Characteristics Analysis and Factor Decomposition Based on the Regional Difference Changes in China’s CO2 Emission. J. Nat. Resour. 2014, 29, 189–200. [Google Scholar]
  2. Zhou, J.; Shi, X.; Zhao, J.; Wang, Y.; Sun, L. On regional difference and influentialfactors of carbon emissions from direct living energy consumption of Chinese residents. J. Saf. Environ. 2019, 19, 954–963. [Google Scholar]
  3. Wang, S.; Su, Y.; Zhao, Y. Regional inequality, spatial spillover effects and influencing factors of China’s city-level energy-related carbon emissions. Acta Geogr. Sin. 2018, 73, 414–428. [Google Scholar]
  4. Yuan, X.; Zhong, Y. The Practice and System Construction of China′s Low carbon City. Urban Dev. Stud. 2010, 17, 42–47+58. [Google Scholar]
  5. Wang, S.J.; Gao, S.; Huang, Y.Y.; Shi, C.Y. Spatio-temporal evolution and trend prediction of urban carbon emission performance in China based onsuper-efficiency SBM model. Acta Geogr. Sin. 2020, 75, 1316–1330. [Google Scholar]
  6. Liu, Y.; He, S.; Jiang, Y.-J.; Luo, X.; Yuan, J.-H. Spatial-temporal decomposition of carbon emissions in China’s four major urban agglomerations. Clim. Chang. Res. 2024, 20, 231–241. [Google Scholar]
  7. Feng, D.; Li, J. Impacts of Urbanization on Carbon Dioxide Emissions in the Three Urban Agglomerations of China. Resour. Environ. Yangtze Basin 2018, 27, 2194–2200. [Google Scholar]
  8. Wang, Z.J.; Chen, F.; Fujiyama, T. Carbon emission from urban passenger transportation in Beijing. Transp. Res. Part D-Transp. Environ. 2015, 41, 217–227. [Google Scholar] [CrossRef]
  9. Jiang, J. Research on Household Commuting Carbon Emission of Metropolis in China: A Case Study of Wuhan. Ph.D. Thesis, Wuhan University, Wuhan, China, 2014. [Google Scholar]
  10. Zhang, J.; Yang, Y.; Chen, X.; Mao, Q. A Research on Neighborhood Built Environment and Household Travel Energy in Jinan. Urban Dev. Stud. 2013, 20, 83–89. [Google Scholar]
  11. Huang, J.N.; Du, N.R.; Liu, P.; Han, S.S. An Exploration of Land Use Mix Around Residence and Family Commuting Caused Carbon Emission: A Case Study of Wuhan City in China. Urban Plan. Int. 2013, 28, 25–30. [Google Scholar]
  12. Yang, W.; Li, T.; Cao, X. The spatial pattern of Community Travel Low Carbon Index (CTLCI) and spatial heterogeneity of the relationship between CTLCI and influencing factors in Guangzhou. Geogr. Res. 2015, 34, 1471–1480. [Google Scholar]
  13. Tang, C.; Yu, Y.; Yang, C.; Zhong, L.; Li, H. Analysis on low carbon cognition, willingness and behavior of tourists in Zhangjiajie National Forest Park. J. Arid Land Resour. Environ. 2018, 32, 43–48. [Google Scholar]
  14. Aguiléra, A.; Voisin, M. Urban form, commuting patterns and CO2 emissions: What differences between the municipality’s residents and its jobs? Transp. Res. Part A Policy Pract. 2014, 69, 243–251. [Google Scholar] [CrossRef]
  15. Singleton, A. A GIS approach to modelling CO2 emissions associated with the pupil-school commute. Int. J. Geogr. Inf. Sci. 2013, 28, 256–273. [Google Scholar] [CrossRef]
  16. Polloni-Silva, E.; Silveira, N.; Ferraz, D.; de Mello, D.S.; Moralles, H.F. The drivers of energy-related CO2 emissions in Brazil: A regional application of the STIRPAT model. Environ. Sci. Pollut. Res. 2021, 28, 51745–51762. [Google Scholar] [CrossRef]
  17. Henriques, S.T.; Borowiecki, K.J. The drivers of long-run CO2 emissions in Europe, North America and Japan since 1800. Energy Policy 2017, 101, 537–549. [Google Scholar] [CrossRef]
  18. Román-Collado, R.; Morales-Carrión, A.V. Towards a sustainable growth in Latin America: A multiregional spatial decomposition analysis of the driving forces behind CO2 emissions changes. Energy Policy 2018, 115, 273–280. [Google Scholar] [CrossRef]
  19. Meangbua, O.; Dhakal, S.; Kuwornu, J.K. Factors influencing energy requirements and CO2 emissions of households in Thailand: A panel data analysis. Energy Policy 2019, 129, 521–531. [Google Scholar] [CrossRef]
  20. Chong, C.H.; Tan, W.X.; Ting, Z.J.; Liu, P.; Ma, L.; Li, Z.; Ni, W. The driving factors of energy-related CO2 emission growth in Malaysia: The LMDI decomposition method based on energy allocation analysis. Renew. Sustain. Energy Rev. 2019, 115, 109356. [Google Scholar] [CrossRef]
  21. Reznik, A.; Kissinger, M.; Alfasi, N. Real-data-based high-resolution GHG emissions accounting of urban residents private transportation. Int. J. Sustain. Transp. 2019, 13, 235–244. [Google Scholar] [CrossRef]
  22. Nair, S.; Bhatia, S.K.; Chandrakar, M. Household Carbon Emissions in India: Correlation with Income and Household Size. Asian J. Water Environ. Pollut. 2019, 16, 71–81. [Google Scholar] [CrossRef]
  23. Wang, D.; Yuan, C. Modeling and forecasting household energy consumption and related CO2 emissions integrating UrbanSim and transportation models: An Atlanta BeltLine case study. Transp. Plan. Technol. 2018, 41, 448–462. [Google Scholar] [CrossRef]
  24. Hirano, Y.; Ihara, T.; Hara, M.; Honjo, K. Estimation of Direct and Indirect Household CO2 Emissions in 49 Japanese Cities with Consideration of Regional Conditions. Sustainability 2020, 12, 4678. [Google Scholar] [CrossRef]
  25. Yang, W.; Cao, X. The influence mechanism of travel-related CO2 emissions from the perspective of residential self-selection: A case study of Guangzhou. Acta Geogr. Sin. 2018, 73, 346–361. [Google Scholar]
  26. Ma, J.; Chai, Y.; Liu, Z. The Mechanism of CO2 Emissions from Urban Transport Based on Individuals’ Travel Behavior in Beijing. Acta Geogr. Sin. 2011, 66, 1023–1032. [Google Scholar]
  27. Zhu, M.; Wang, C.; Chen, J. Identification of Key Influences on the Perception of Safety at Night in Street Walking Environment: Walking Perception Experiments Based on Wearable Physiological Sensors. Chin. Landsc. Archit. 2023, 39, 64–69. [Google Scholar]
  28. Chen, Y.; Wang, Q.Y.; Xi, W.Q.; Mao, J. Influence of Spatial Form on Pedestrians. Planners 2017, 33, 74–80. [Google Scholar]
  29. Chen, W.; Ge, Y. The Influence Mechanism of Road Environment on Travel Choice from the Low-Carbon Perspective: An Empirical Research Based on Multinomial Logit Model. Ecol. Econ. 2018, 34, 37–42. [Google Scholar]
  30. Su, S. The Effects of Walking Environment on Pedestrian Security Requirement and Travel Activities. Ph.D. Thesis, Chang’an University, Xi’an, China, 2017. [Google Scholar]
  31. Lee, J.S.; Park, S.; Jung, S. Effect of Crime Prevention through Environmental Design (CPTED) Measures on Active Living and Fear of Crime. Sustainability 2016, 8, 872. [Google Scholar] [CrossRef]
  32. Qin, Q.; Yuan, Z.; Tian, J. Method of Slow Traffic Planning in the Concept of Green Transportation Research. Planners 2012, 28, 5–10. [Google Scholar]
  33. Ma, L.; Xiu, C. Research on the matching of park green space and residential function in Shenyang based on the perspective of residents’ leisure travel. World Reg. Stud. 2023, 32, 108–118. [Google Scholar]
  34. Xing, L.; Du, S.; Tong, Z.; Zhang, L. Spatial and temporal accessibility of urban green space and its influencing factors in Wuhan from the perspective of environmental justice. Acta Ecol. Sin. 2023, 43, 5370–5382. [Google Scholar]
  35. Zhang, J.F.; Zhang, L.J.; Qin, Y.C.; Wang, X.; Sun, Y.Y.; Rong, P.J. Influencing factors of low-carbon behaviors of residents in Zhengzhou City from the perspective of cognition-behavior gaps. Prog. Geogr. 2020, 39, 265–275. [Google Scholar] [CrossRef]
  36. Mi, L.Y.; Gu, M.; Yang, J.; Yu, X.; Liu, Y. Empirical research on the psychological motivation factors of urban residents’ low carbon oriented energy consumption behavior in Xuzhou City. Resour. Sci. 2016, 38, 609–621. [Google Scholar]
  37. Liu, D. Green Transport: A Transport Philosophy of Sustainable Development. Mod. Urban Res. 2003, 01, 60–63. [Google Scholar]
  38. Chen, L. Study on Urban Residential Energy Consumption Behavior. Ph.D. Thesis, Dalian University of Technology, Dalian, China, 2009. [Google Scholar]
  39. Ding, Z.H.; Wang, G.Q.; Liu, Z.H.; Long, R.Y. Research on differences in the factors influencing the energy-saving behavior of urban and rural residents in China—A case study of Jiangsu Province. Energy Policy 2017, 100, 252–259. [Google Scholar] [CrossRef]
  40. Munshi, T. Built environment and mode choice relationship for commute travel in the city of Rajkot, India. Transp. Res. Part D Transp. Environ. 2016, 44, 239–253. [Google Scholar] [CrossRef]
  41. Zhang, Y.; Hu, S.; Chen, X.; Zhao, L. The Impact of Urban Built Environment on Residential Choice of Commuting Mode: Based on Empirical Research in Fuzhou. Urban Dev. Stud. 2019, 26, 72–78. [Google Scholar]
  42. Chen, L.; Wang, J.; Chen, Z.; Zhou, L. Chinese household income and household carbon peaking: Based on CGSS data and multinomial Logit model. China Soft Sci. 2024, 4, 166–175. [Google Scholar]
  43. Wang, X.; Song, Y.; Xu, J. Comparative Study on Food Consumption Prices among Regional Residents—Analysis based on purchasing power parity perspective. Price Theory Pract. 2023, 11, 93–99+156. [Google Scholar]
  44. Shen, L.; Zhang, C.; Li, H.; Wang, Y. Interaction between commuting modes and job-housing imbalance in metropolis: An empirical study by Bayesian-tobit analysis in Beijing. Prog. Geogr. 2018, 37, 1277–1290. [Google Scholar]
  45. Liu, Q.; Zhang, Y.; Xiao, Y.; Yuan, Y.; Xia, H. Characteristics and determinants of carbon emissions from daily private cars travel in central area of Jinan. Resour. Sci. 2018, 40, 262–272. [Google Scholar]
  46. Ding, C.; Wang, Y.; Lin, Y. Exploration on the Relationship between Transit-City Strategy and Tod Mode: From the Perspective of Low Carbon Travel. City Plan. Rev. 2013, 11, 54–61. [Google Scholar]
  47. Lin, H.; Li, J. Relationship between Spatial Distribution of Resident Trips and Mixed Degree of Land Use: A Case Study of Guangzhou. City Plan. Rev. 2008, 9, 53–56+74. [Google Scholar]
  48. Wang, Q. Urban New Development Mode Based on Large-scale Public Facility. Mod. Urban Res. 2008, 23, 47–53. [Google Scholar]
  49. Le, J.; Ye, K. Research on optimization of public facilities development path in new urban district. Urban Dev. Stud. 2019, 026, 133–140. [Google Scholar]
  50. Chen, Y.P.; Song, Y.; Zhang, Y.; Peng, K.; Zhang, Q.; Jin, X. Impact of Land Use Development on Travel Mode Choice: A Case Study in Shenzhen. Urban Transp. China 2011, 9, 80–85+27. [Google Scholar]
  51. Guo, L.; Peng, Y.; Huang, J.; Feng, J.; Hu, G.; Sun, X. Identification and Optimization of Spatial Elements in Short Distance Commuting for Green Travel: Taking Wuhan as an Example. Urban Plan. Forum 2022, 3, 37–43. [Google Scholar]
  52. Gehrke, S.R.; Wang, L. Operationalizing the neighborhood effects of the built environment on travel behavior. J. Transp. Geogr. 2020, 82, 102561. [Google Scholar] [CrossRef]
  53. Zhang, T.; Zhou, Y.; Zhao, X. Analysis on the Status and Development Path of the China’s Urban Low-carbon Transport. Urban Dev. Stud. 2011, 18, 68–73+80. [Google Scholar]
  54. Pan, H. Urban Spatial Structure towards Low Carbon: New Urban Transport and Land Use Model. Urban Plan. Forum 2010, 17, 40–45. [Google Scholar]
  55. Xiao, Z.; Chai, Y.; Liu, Z. Quantitative Distribution and Related Factors for Household Daily Travel CO2 Emissions in Beijing. Urban Dev. Stud. 2011, 18, 104–112. [Google Scholar]
  56. Li, Q.; Chen, J.; Tang, L. Inventory-algorithm-based carbon emission characteristics in regional energy systems, Sichuan Province. Nat. Gas Technol. Econ. 2022, 16, 50–56. [Google Scholar]
  57. Jiang, J. An Evaluation and Decomposition Analysis of Carbon Emissions in China. Resour. Sci. 2011, 33, 597–604. [Google Scholar]
  58. Sun, Q.; Chen, H.; Long, R.; Zhang, J.; Yang, M.; Huang, H.; Ma, W.; Wang, Y. Can Chinese cities reach their carbon peaks on time? Scenario analysis based on machine learning and LMDI decomposition. Appl. Energy 2023, 347, 121427. [Google Scholar] [CrossRef]
  59. Jin, Y.; Wang, W. Information Entropy Change of Land Use Structure in Zhangye City Research on its Driving Factors. China For. Econ. 2020, 4, 24–27+31. [Google Scholar]
  60. Xu, Z.; Li, C.; Niu, L. Decoupling Relationship between Land Mixed Use and Carbon Emissions in Hohhot-Baotou-Ordos-Yulin Urban Agglomeration. Res. Environ. Sci. 2022, 35, 299–308. [Google Scholar]
  61. Tan, J.; Zhu, H.-M.; Jin, W.-H. Analysis on Information Entropy of Land Use Structure in Changsha City. Econ. Geogr. 2010, 19, 1400–1416. [Google Scholar]
  62. Zhou, M.; Zhao, R.Q.; Yuan, Y.C.; Feng, D.X.; Yang, Q.L.; Wang, S.; Yang, W.J. Impact of Land-mixing Degree of Residential Area on Carbon emissions of Commuting: A Case Study of Typical Residential district, Jiangning District, Nanjing. Hum. Geogr. 2018, 33, 70–75. [Google Scholar]
  63. Sadik-Zada, E.R.; Gatto, A. The puzzle of greenhouse gas footprints of oil abundance. Socio-Econ. Plan. Sci. 2020, 75, 100936. [Google Scholar] [CrossRef]
  64. Hong, S.; Hui, E.C.M.; Lin, Y. Relationships between carbon emissions and urban population size and density, based on geo-urban scaling analysis: A multi-carbon source empirical study. Urban Clim. 2022, 46, 101337. [Google Scholar] [CrossRef]
  65. Fang, C.; Li, G.; Zhang, Q. The Variation Characteristics and Control Measures of the Urban Construction Land in China. J. Nat. Resour. 2017, 32, 363–376. [Google Scholar]
  66. Rosca, E.; Costescu, D.; Rusca, F.V.; Burciu, S. Assessing the Effect of Traffic Congestion on Greenhouse Gas Emissions. In Proceedings of the International Conference on Traffic and Transport Engineering, Belgrade, Serbia, 27–28 November 2014. [Google Scholar]
  67. Li, C.; Lei, A.; Wu, X.; Hong, T. Game mode of choice of urban public transportation travel mode. Technol. Econ. Areas Commun. 2022, 3, 18–24. [Google Scholar]
  68. Sham, R.; Othman, R.; Yee, H.H.; Han, T.Y. Promoting a Lower Carbon Footprint using an Enhanced Pedestrian-Friendly Model. Environ. Behav. Proc. J. 2020, 13, 157–164. [Google Scholar] [CrossRef]
  69. Liu, X.; Xu, H.; Zhang, M. The effects of urban expansion on carbon emissions: Based on the spatial interaction and transmission mechanism. J. Clean. Prod. 2024, 434, 140019. [Google Scholar] [CrossRef]
  70. Sun, Y.; Zhang, Y.; Liu, X. Driving Factors of Transportation CO2 Emissions in Beijing: An Analysis from the Perspective of Urban Development. Chin. J. Urban Environ. Stud. 2020, 3, 2050013. [Google Scholar] [CrossRef]
  71. Verburg, P.H.; Soepboer, W.; Veldkamp, A.; Limpiada, R.; Espaldon, V.; Mastura, S.S. Modeling the spatial dynamics of regional land use: The CLUE-S model. Environ. Manag. 2002, 30, 391–405. [Google Scholar] [CrossRef]
  72. Fan, Q.; Wang, Y. Temporal and spatial change detecting (1998–2003) and predicting of land use and landcover in core corridor of Pearl River Delta (China) by using TM and ETM+ images. Environ. Monit. Assess. 2008, 137, 127–147. [Google Scholar] [CrossRef] [PubMed]
  73. GB 50137-2011; The Code for Classification of Urban Land Use and Planning Standards of Development Land. China Architecture & Building Press: Beijing, China, 2011.
  74. Wang, S.; Hong, J. Impact of Population Agglomeration on Haze Pollution under the Threshold of Economic Growth. J. Jiangsu Ocean. Univ. Humanit. Soc. Sci. Ed. 2022, 20, 81–90. [Google Scholar]
  75. Xu, B.; Hu, J. Digital Finance Development and Human Capital Promotion: Empirical Evidence based on the Prefecture Level Cities in China. J. Tech. Econ. Manag. 2022, 12, 81–87. [Google Scholar]
Figure 1. Carbon emissions statistics of cities in different regions of China.
Sustainability 16 05153 g001
Figure 2. Carbon emissions intensity of urban residents in different regions of China.
Sustainability 16 05153 g002
Figure 3. Carbon emissions intensity per capita of urban residents in different regions of China.
Sustainability 16 05153 g003
Figure 4. Statistics of registered residence population and floating population in China’s capital cities in 2019.
Sustainability 16 05153 g004
Figure 5. The moderating effect of education level on the relationship between wage income and carbon emissions intensity.
Sustainability 16 05153 g005
Figure 6. The moderating effect of subway construction on the relationship between bus configuration and carbon emissions intensity.
Sustainability 16 05153 g006
Figure 7. The moderating effect of the green space ratio on the relationship between public transportation configuration and carbon emissions intensity.
Sustainability 16 05153 g007
Figure 8. The moderating effect of the greening rate on the relationship between bus configuration and carbon emissions intensity.
Sustainability 16 05153 g008
Figure 9. The moderating effect of built-up area on the relationship between economic development and carbon emissions from residents’ daily lives.
Sustainability 16 05153 g009
Figure 10. The moderating effect of the balance of construction land on the relationship between population density and carbon emissions intensity.
Sustainability 16 05153 g010
Table 1. Fixed effects analysis of panel data.
VariablesModel 1Model 2Model 3
Bus configuration intensity^2————−8.757 *
Number of parks^2——−0.003 ***——
Average wage126.358 **117.067 **121.198 **
Per capital education expenditure−0.004−0.004−0.002
Total retail sales of consumer goods−10.075−11.149−10.185
Fiscal revenue−16.491−19.628−20.277
Urban built-up area0.208 *0.125 *0.196 *
GDP−107.479 **−95.924 **−105.707 **
Night lighting0.0110.0160.012
Population density17.031 **16.798 **16.522 **
Land use equilibrium degree172.728196.146123.180
Subway presence−37.852 *−46.348 **−36.112 *
Bus configuration intensity16.34912.783 *60.334 *
Greening rate−4.645−4.114−5.177
Green space ratio6.0666.0285.782
Number of parks−0.879 ***0.908−0.866 ***
Green area34.662 ***29.108 ***41.967 ***
Per capital public green space area−39.876 *−43.058 *−36.360 *
Public facility investment0.000001870.000002040.00000296
Constant term456.525498.611396.689
Prob > F0.0000.0000.000
Number of observations = 487. The data in the table are the correlation coefficients between the independent and dependent variables. Bus configuration intensity^2 means the square value of bus configuration intensity, number of parks^2 means the square value of number of parks. * indicates significance, * p < 0.1; ** p < 0.05; *** p < 0.01.
Table 2. Moderating effect analysis of panel data.
VariablesModel 4Model 5Model 6Model 7Model 8Model 9
Average wage #c. per capita education expenditure−0.0286 **——————————
Subway presence #c. bus configuration intensity——−37.069 **————————
Bus configuration intensity #c. greening rate————3.471 ***——————
Bus configuration intensity #c. green space ratio——————4.518 ***————
Urban built-up area #c. GDP————————0.040 *——
Population density #c. land use equilibrium degree 686.180 *
Average wage175.505 ***125.930 **117.001 **123.366 **121.113 **120.340 **
Per capita education expenditure0.328 **−0.006−0.002−0.0007−0.007−0.005
Total retail sales of consumer goods−14.296−9.505−8.154−6.716−9.624−8.744
Fiscal revenue−53.049−8.184−25.033−29.2801.351−15.583
Urban built-up area0.248 **0.190 *0.201 *0.189 *−0.5450.187 *
GDP−112.17 **−112.238 **−105.561 **−105.02 **−125.536 **−105.452 **
Night lighting0.0030.0090.0170.0200.0130.031
Population density17.212 **17.897 **14.554 **14.240 **16.560 **−576.019
Land use equilibrium degree209.084322.253129.91993.58388.126−672.491
Subway presence−34.573 **4.339 *−28.583 *−30.719 *−35.887 *−38.400 *
Bus configuration intensity15.74325.226 **−104.41 **−128.742 ***14.05112.447
Greening rate−3.786−3.751−12.086 **−5.408−5.505−5.246
Green space ratio5.4245.9324.984−4.2506.7626.593
Number of parks−0.881 ***−0.879 ***−0.793 **−0.767 ***−0.889−0.919 ***
Green area36.018 ***34.697 ***41.882 ***41.536 ***34.779 ***36.190 ***
Per capita public green space area−43.941 **−42.052 **−31.007 **−29.99 *−39.337 *−37.166 *
Public facility investment0.000003190.000001660.000001390.0000007470.0000001790.00000328
Constant term539.835272.096745.457806.111659.0221152.12
Prob > F0.0000.0000.0000.0000.0000.000
Number of observations = 487. The data in the table are the correlation coefficients between the independent and dependent variables. #c. indicates the regulatory relationship between factors. * indicates significance, * p < 0.1; ** p < 0.05; *** p < 0.01.
Table 3. Model robustness test results.
VariablesT-Model 1T-Model 2T-Model 3T-Model 4T-Model 5T-Model 6T-Model 7T-Model 8T-Model 9
Population density #c. land use equilibrium degree————————————————371.060 *
Urban built-up area #c. GDP——————————————0.0667 *——
Bus configuration intensity #c. green space ratio————————————5.319 ***————
Bus configuration intensity #c. greening rate——————————4.096 ***——————
Subway presence #c. bus configuration intensity————————−39.112 **————————
Average wage #c. per capita education expenditure——————−0.032 **——————————
Bus configuration intensity^2————−7.288 *————————————
Number of parks^2——−0.003 **——————————————
Average wage118.456 *106.181114.311 *178.840 **115.907 *103.350 *109.142 *111.131 *114.784 *
Per capita education expenditure0.002−0.001−0.0030.373 **0.00010.0040.005−0.0030.001
Total retail sales of consumer goods−0.773−1.618−0.564−4.4511.4560.4681.808−0.299−0.135
Fiscal revenue−25.04536−28.497−28.723−65.874−14.796−39.149−45.515−38.759−23.474
Urban built-up area0.240 *0.147 *0.229 *0.282 **0.213 *0.228 **0.211 *−0.994 *0.232 *
Night lighting0.0250.0290.0260.0160.0210.0330.0350.0270.034
Population density17.320 **16.967 ***16.995 **17.380 **18.071 **14.90614.618 **16.721 **−303.404
Land use equilibrium degree171.039192.887124.988181.700325.597110.66067.89757.089−271.105
Bus configuration intensity15.14111.32352.07114.97224.034−126.01 ***−154.25 ***11.26612.871
Greening rate−3.510−3.096−3.992−2.585−2.629−12.566 **−4.9075.363−3.794
Green space ratio4.4624.5944.2493.7734.4833.403−7.197−4.7884.798
Number of parks−1.015 ***0.809 ***−1.000 ***−1.015 ***−1.014 ***−0.888 **−0.848 **−1.045 ***−1.040 ***
Green area34.967 ***29.322 ***41.447 ***36.687 ***34.598 ***44.874 ***44.781 ***34.733 ***35.613 ***
Subway presence−41.573 *−48.758 **−39.958 *−37.762 *0.798−31.945 *−34.927 *−38.087 *−41.813 *
Per capita public Green space area−42.207 *−44.413 *−39.195 *−45.986 **−44.176 *−33.015 *−32.017 *−41.577 *−41.111 *
GDP−102.954 *−89.109 *−101.197 *−113.409 **−108.341 **−92.456 *−89.145 *−133.272 **−102.766 *
Public facility investment−1.01 × 10⁻⁶−6.55 × 10⁻⁷−5.90 × 10−84.01 × 10−7−3.54 × 10⁻⁶−9.49 × 10⁻⁷−1.58 × 10⁻⁶−4.23 × 10⁻⁶−4.04 × 10⁻⁷
Constant term456.225491.294399.758579.820252.489767.461831.375785.701827.725
Prob > F0.0000.0000.0000.0000.0000.0000.0000.0000.000
Number of observations = 487. The data in the table are the correlation coefficients between the independent and dependent variables. #c. indicates the regulatory relationship between factors. Bus configuration intensity^2 means the square value of bus configuration intensity, number of parks^2 means the square value of number of parks. * indicates significance, * p < 0.1; ** p < 0.05; *** p < 0.01.
Disclaimer/Publisher’s Note: The statements, opinions and data contained in all publications are solely those of the individual author(s) and contributor(s) and not of MDPI and/or the editor(s). MDPI and/or the editor(s) disclaim responsibility for any injury to people or property resulting from any ideas, methods, instructions or products referred to in the content.

