


Exploring Evolution and Trends: A Bibliometric Analysis and Scientific Mapping of Multiobjective Optimization Applied to Hybrid Microgrid Systems


Abstract
1. Introduction
- Technical Challenges: HESs face complexities integrating multiple energy sources, ensuring grid stability, and maintaining a consistent energy supply amidst environmental variability [10]. These systems require sophisticated control mechanisms and robust infrastructure to manage diverse energy inputs and outputs effectively.
- Economic Feasibility: High initial investment costs, ongoing operation and maintenance expenses, and funding challenges can pose barriers to the widespread adoption of HESs. A thorough economic analysis is essential for long-term sustainability [11]. This includes assessing the cost–benefit ratio, potential savings over time, and securing adequate funding for implementation.
- Environmental Impacts: Assessing the environmental footprint of HESs and implementing strategies for mitigation are critical steps toward ensuring their positive impact on the environment [12]. This includes considering the lifecycle emissions, potential land use impacts, and ways to minimize negative environmental effects through innovative design and operation strategies.
- Research Scope: The scope of research on HESs may be limited, potentially overlooking crucial factors like regional variations, scalability issues, and emerging trends.
- Social and Policy Implications: Societal acceptance, public awareness, community engagement, and supportive policies are essential for the successful adoption of HESs. Understanding and addressing these social and policy factors is crucial for the transition to and operation of HESs. Supportive regulatory frameworks, incentives, and educational initiatives can significantly influence the adoption and effectiveness of these systems.
2. Methodological Framework
2.1. First Phase: Mathematical Model of HMGSs
2.1.1. SPV System
- SPV: A solar cell, or photovoltaic (PV) cell, is a device that transforms light into electricity through the photovoltaic effect. The behavior of both an ideal SPV cell and a practical SPV device are typically represented in diagrams, such as those depicted in Figure 4.

- Charge controller: A charge controller, also known as a charge regulator or battery regulator, moderates the flow of electric current to and from the batteries. This control prevents excessive charging and voltage spikes, which can damage the battery, reduce its efficiency, or pose safety concerns. In SPV systems, solar charge controllers adjust the power or DC voltage coming from the solar panels before it is directed to the batteries.
- Inverter: Various inverter models exist, each tailored to the specific requirements of the load. The selection depends on the load’s waveform needs and the inverter’s efficiency. The choice is also influenced by whether the inverter is standalone or grid-connected. Inverter failure is a leading cause of malfunctions in SPV systems, presenting opportunities for engineers to improve inverter designs. The efficiency of an inverter ( is typically represented by the ratio of the output power ( to the input power (, mathematically expressed as:indicating that the output power is always less that due to inherent system losses. These losses can originate from various sources, such as component resistance, inefficiencies during semiconductor switching, and other imperfections.
- Battery: A battery bank within HMGSs serves dual purposes: as a power source and for energy storage, balancing power needs over time. Surplus energy from RESs is stored in the batteries, which then provide energy during low RES output due to adverse weather. Battery size, determined by the autonomy days () and the difference between load demand () and power from RESs (), is calculated using:where denotes the battery’s efficiency and signifies the efficiency of the inverter, with referring to the depth of discharge [22].
2.1.2. Wind Energy
2.1.3. Diesel Generator (DG)
2.2. Second Phase: Decision-Making Tools and Investment Metrics for HMGSs
2.2.1. Decision-Making Tools (LCOE, LCC, NPC, LPSP, RF)
- Levelized Cost of Energy (LCOE): This represents the average cost per unit of energy produced by a system throughout its lifecycle, incorporating all lifecycle costs. It is calculated as follows [25]:where is the total costs (capital, operating, maintenance) in year t, is the electricity generated in year t, r is the discount rate, and n is the system’s lifetime in years.
- Life Cycle Cost (LCC): Encompasses the total cost of ownership of the HMGS during its lifespan, including installation, operation, maintenance, and decommissioning costs but excluding system depreciation [26]. The LCC is calculated using the equation:where is the initial cost, the annual operation and maintenance costs, are the replacement costs, salvage values, the system’s lifetime, and the interest rate per annum.
- Net Present Cost (NPC): Calculates the present value of all costs and profits associated with the HMGS, offering a net-cost perspective over the system’s lifecycle [27].where represents annual revenues or savings from operation, distinct from the salvage value .
- Loss of Power Supply Probability (LPSP): Defined as the ratio of the total time the system cannot meet the demanded load to the total observation period (often a year), indicates the likelihood of power outages. It may be computed using the generic formula:
- Renewable Fraction (RF): Quantifies the fraction of total energy provided by RESs in the HMGS, a key metric for assessing system sustainability [28].
2.2.2. Investment Metrics (NPV, EPBT, PBP, ROI)
- Net present value (NPV): Calculates the profitability of a project by discounting future cash flows to the present.where is net cash inflow–outflows during a single period , is discount rate or the cost of capital, is time in years, and is total number of periods.
- Energy Payback Time (EPBT): Determines how long a RE system takes to generate energy equal to its energy input over its lifespan. The EPBT formula is as follows:refers to the overall quantity of energy used in the system’s development, installation, and operation, while is the amount of energy generated annually.
- Payback Period (PBP): Assesses the time it takes for an investment to recoup its value through savings.
- Return on Investment (ROI): Measures profitability from an investor’s perspective.
2.3. Third Phase: Bibliometric Analysis and Comparative Case Studies
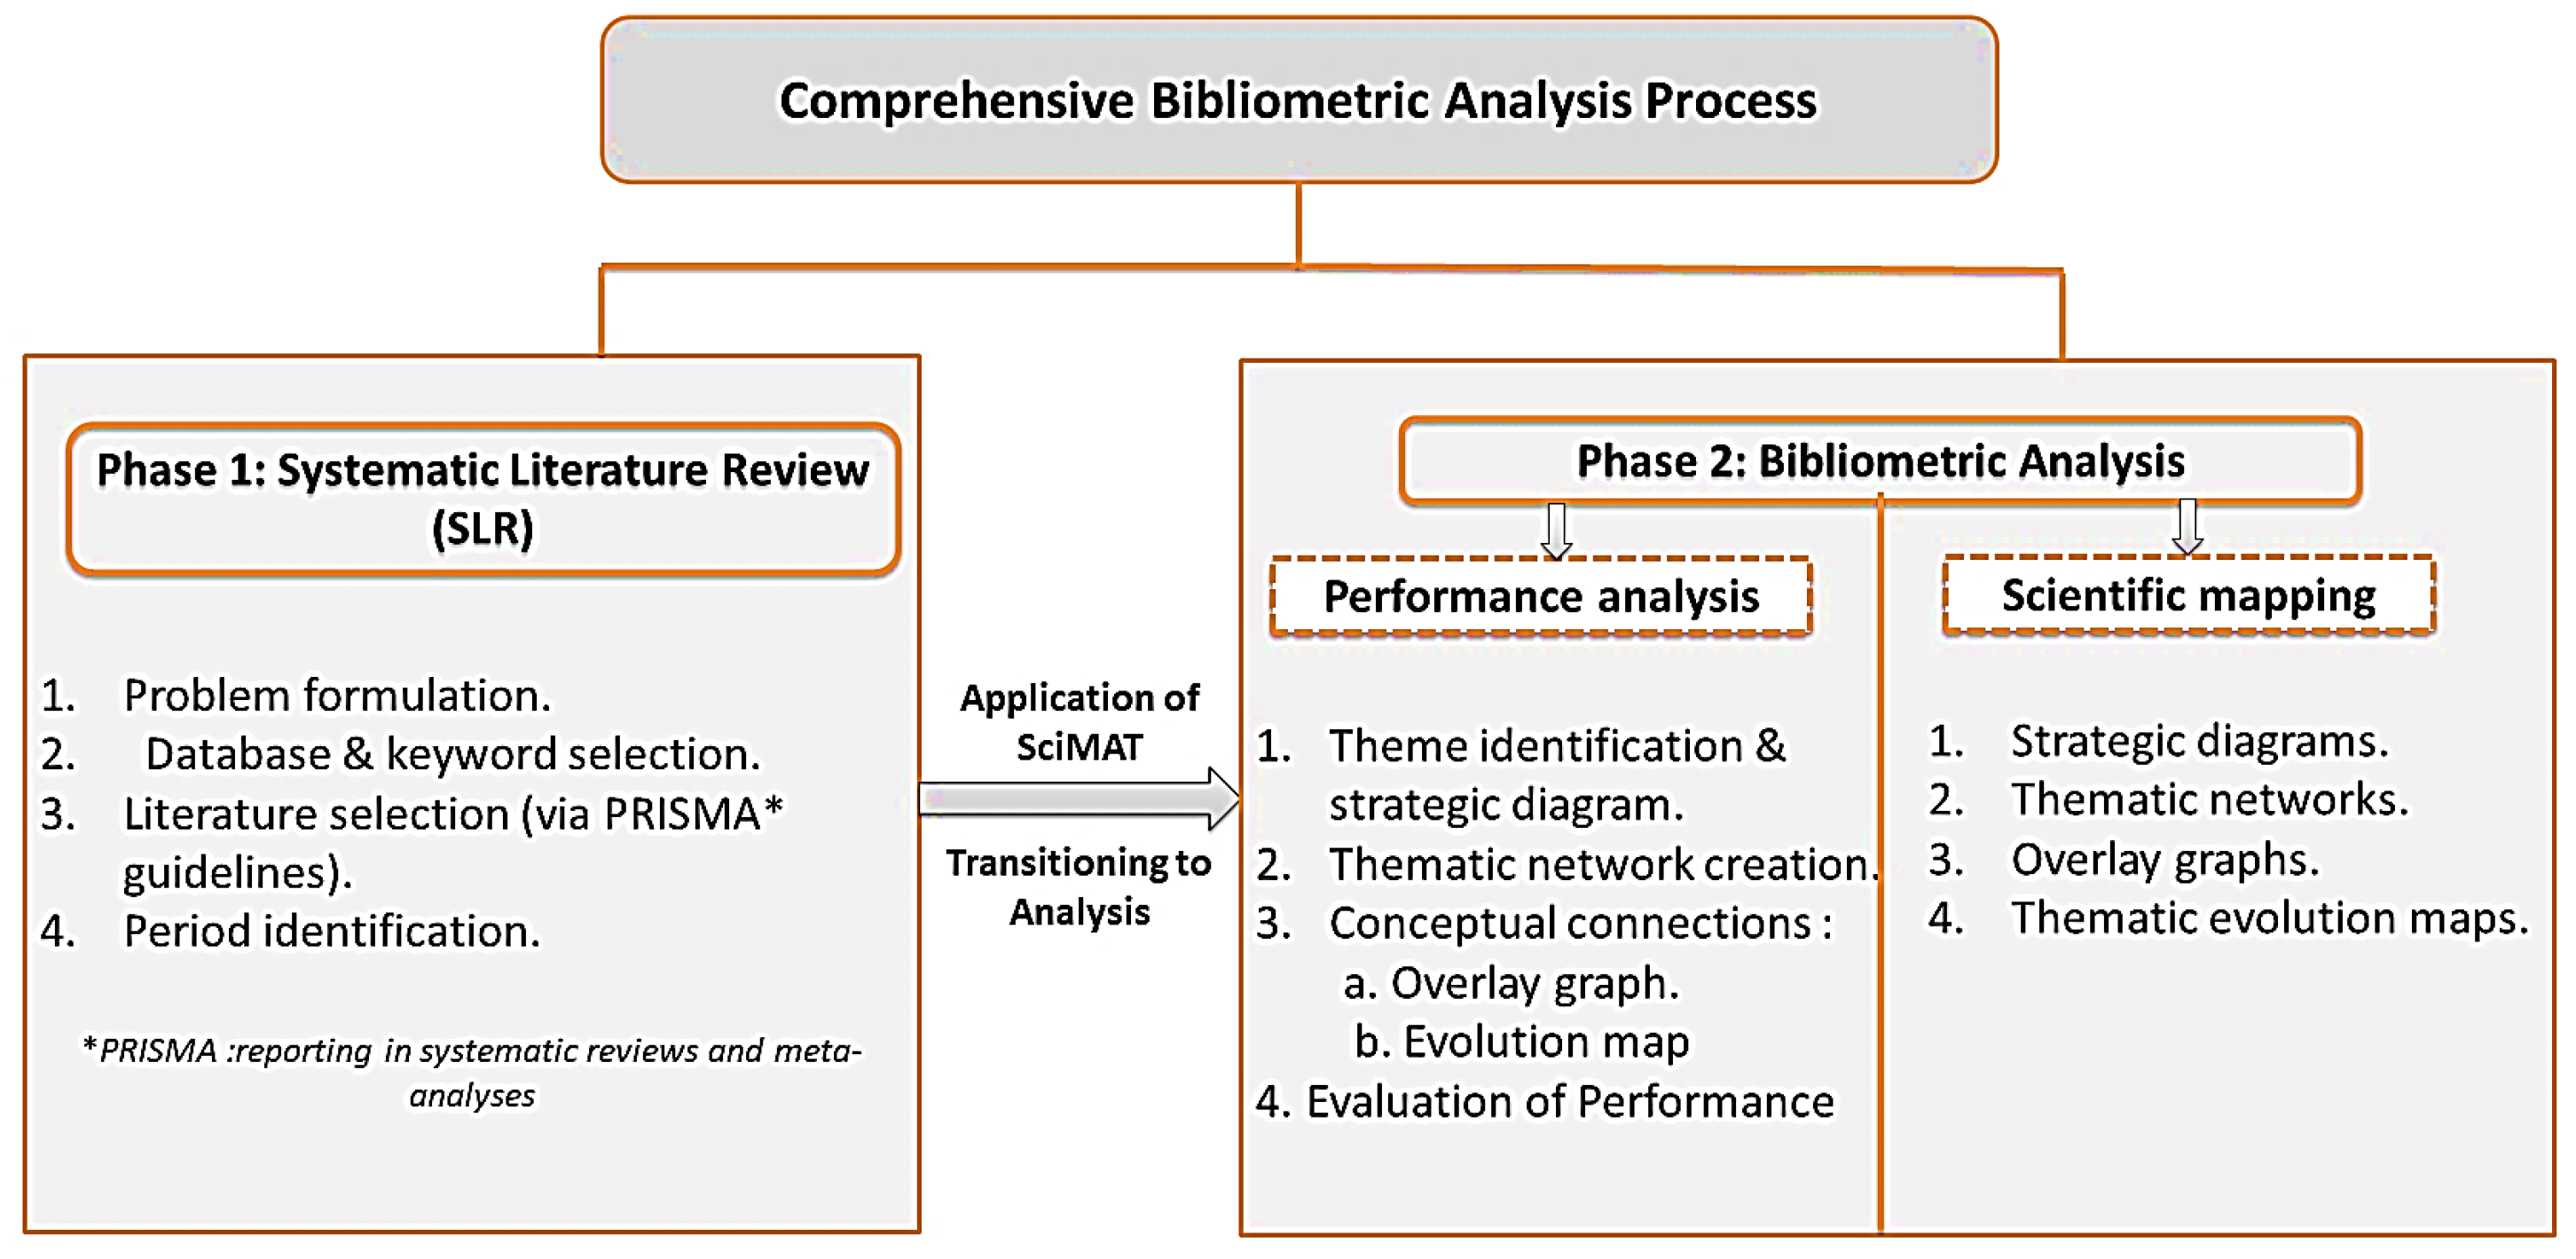
Bibliometric Analysis
- Problem planning and formulation: This initial step establishes the foundation for the study, involving the framing of research questions, deciding on relevant literature criteria, methods for filtering unrelated findings, and outlining possible conclusions.
- Database(s), keywords, and search string determination: A range of databases was chosen, and a set of important terms was identified for searching. Selecting appropriate terms is crucial to encompass varied research while remaining focused on relevant articles.
- Literature selection: At this stage, adherence to the PRISMA guidelines, which pertain to systematic reviews and meta-analyses, ensures that the selected articles align with the study’s direction [39]. Insights from these articles were systematically extracted.
- Period identification: This step involves considering elements like the topic’s depth, existing literature, and its evolution over time.
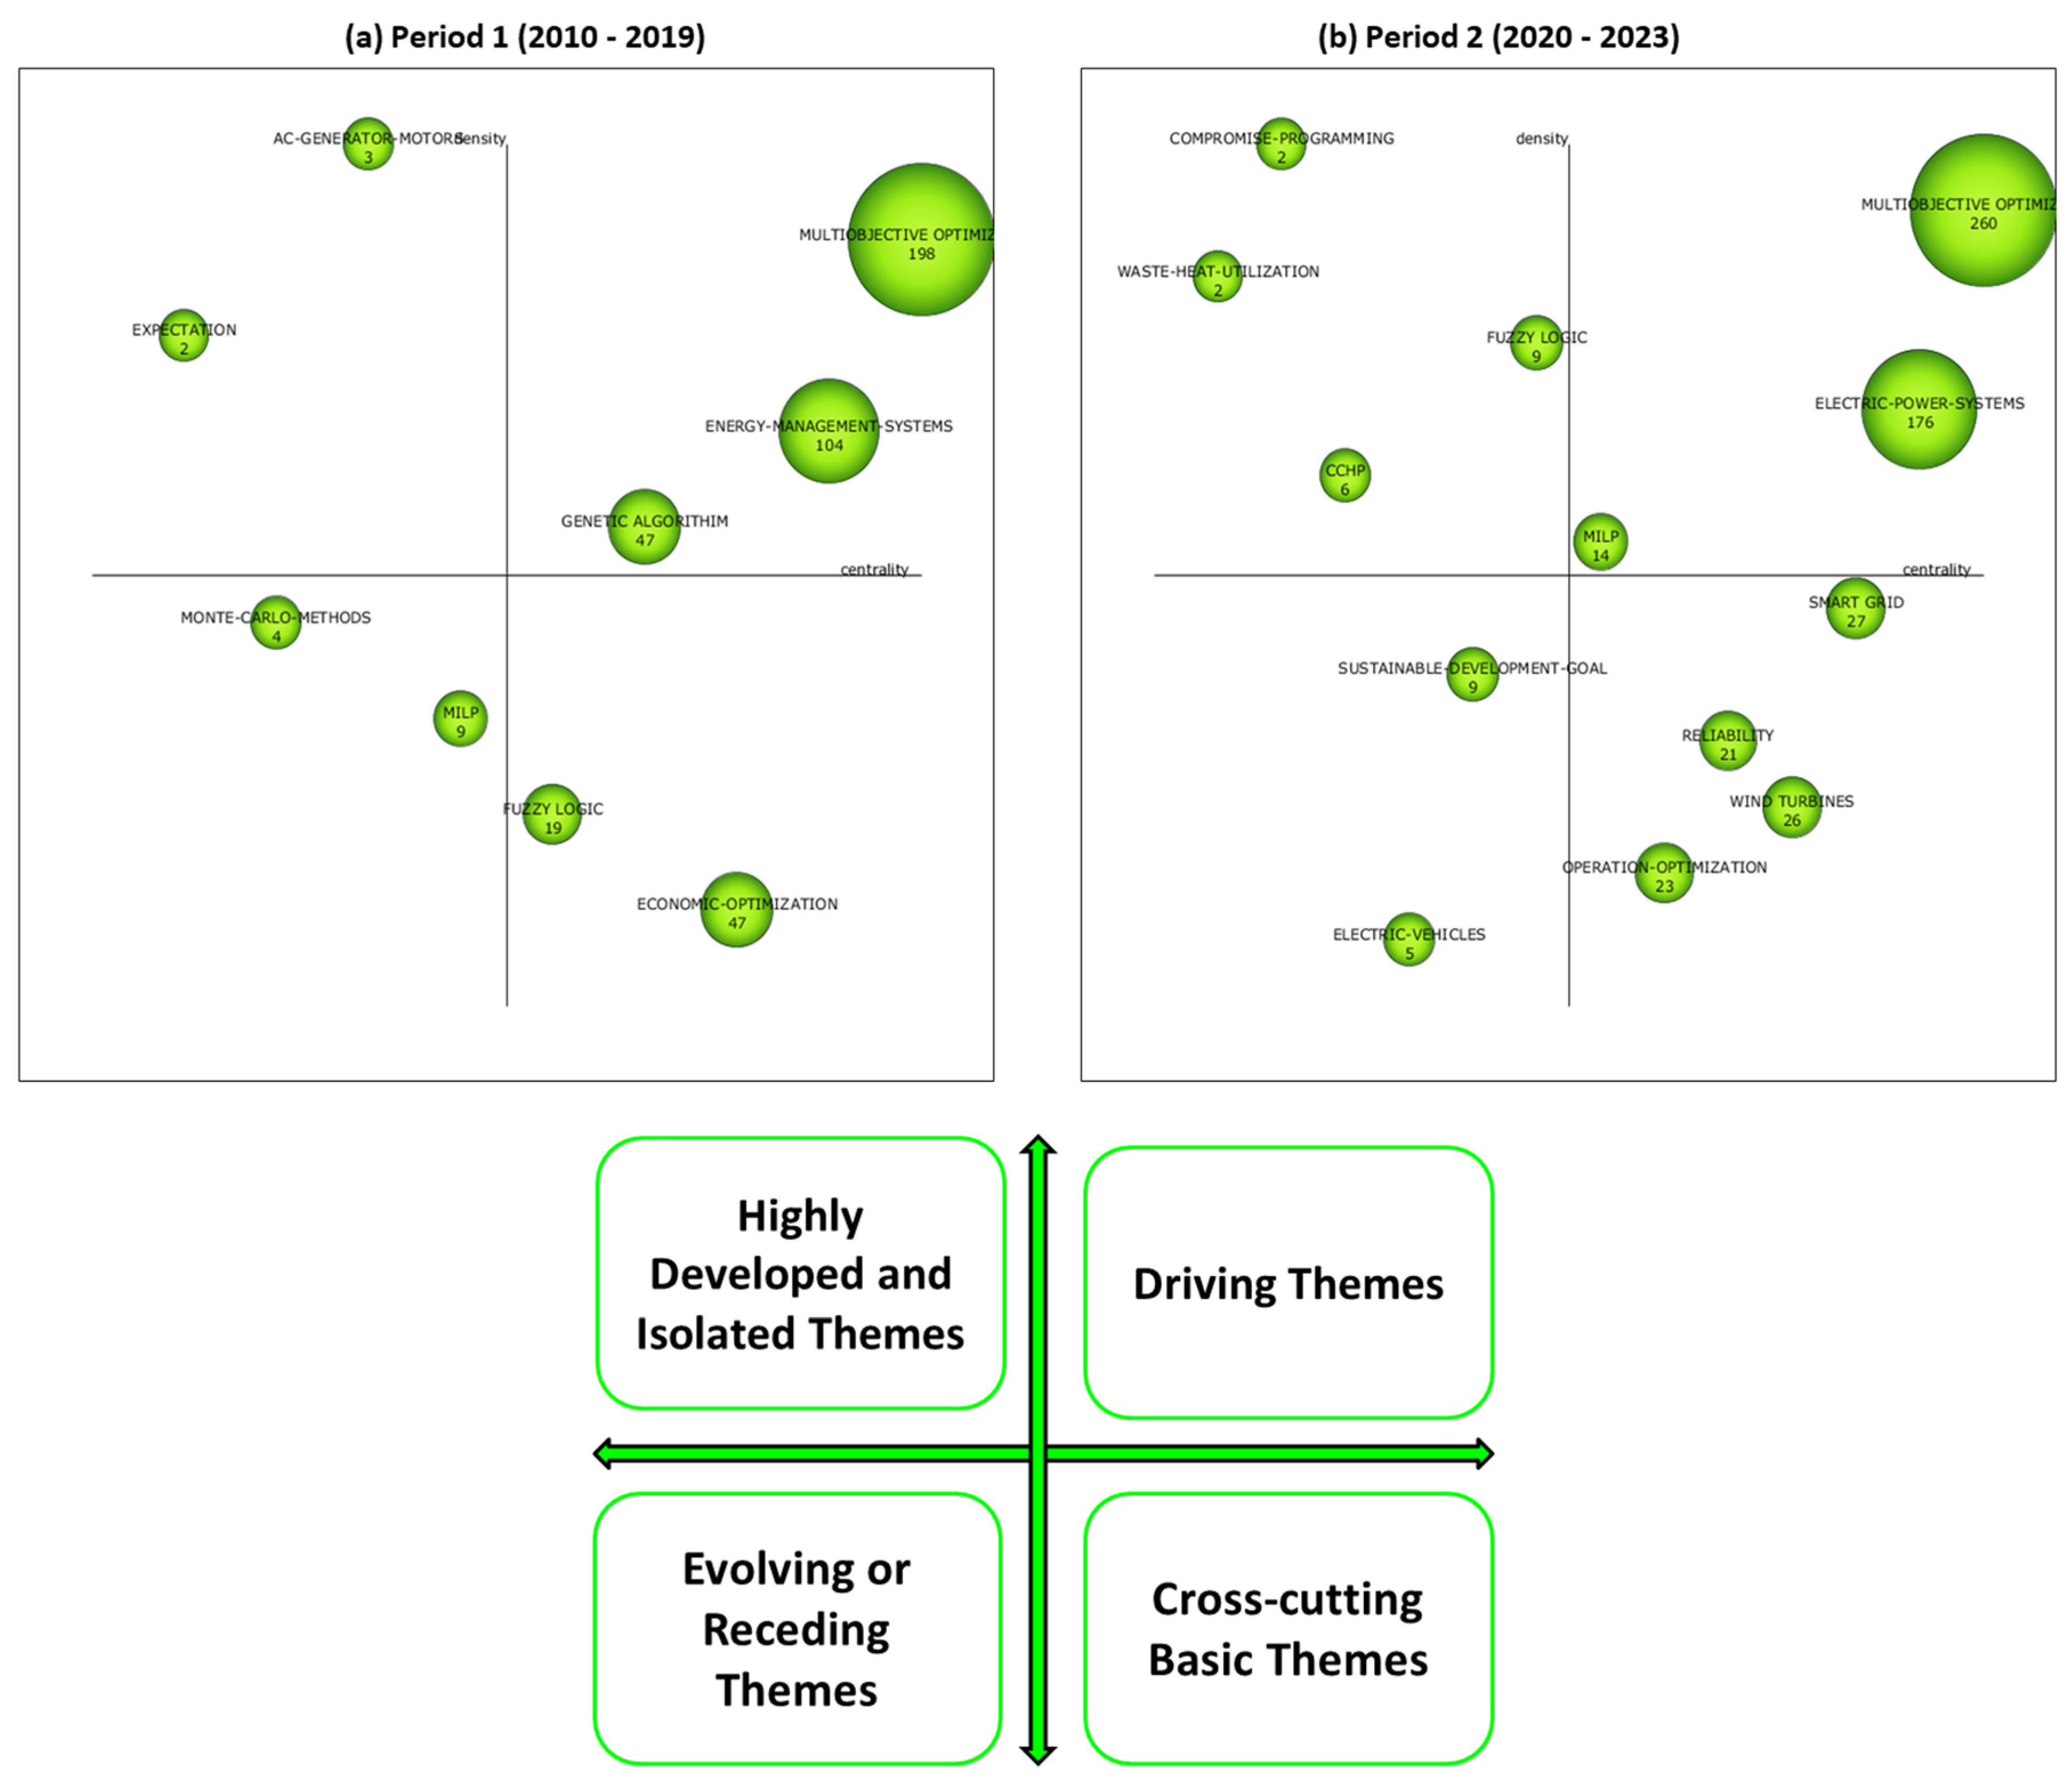
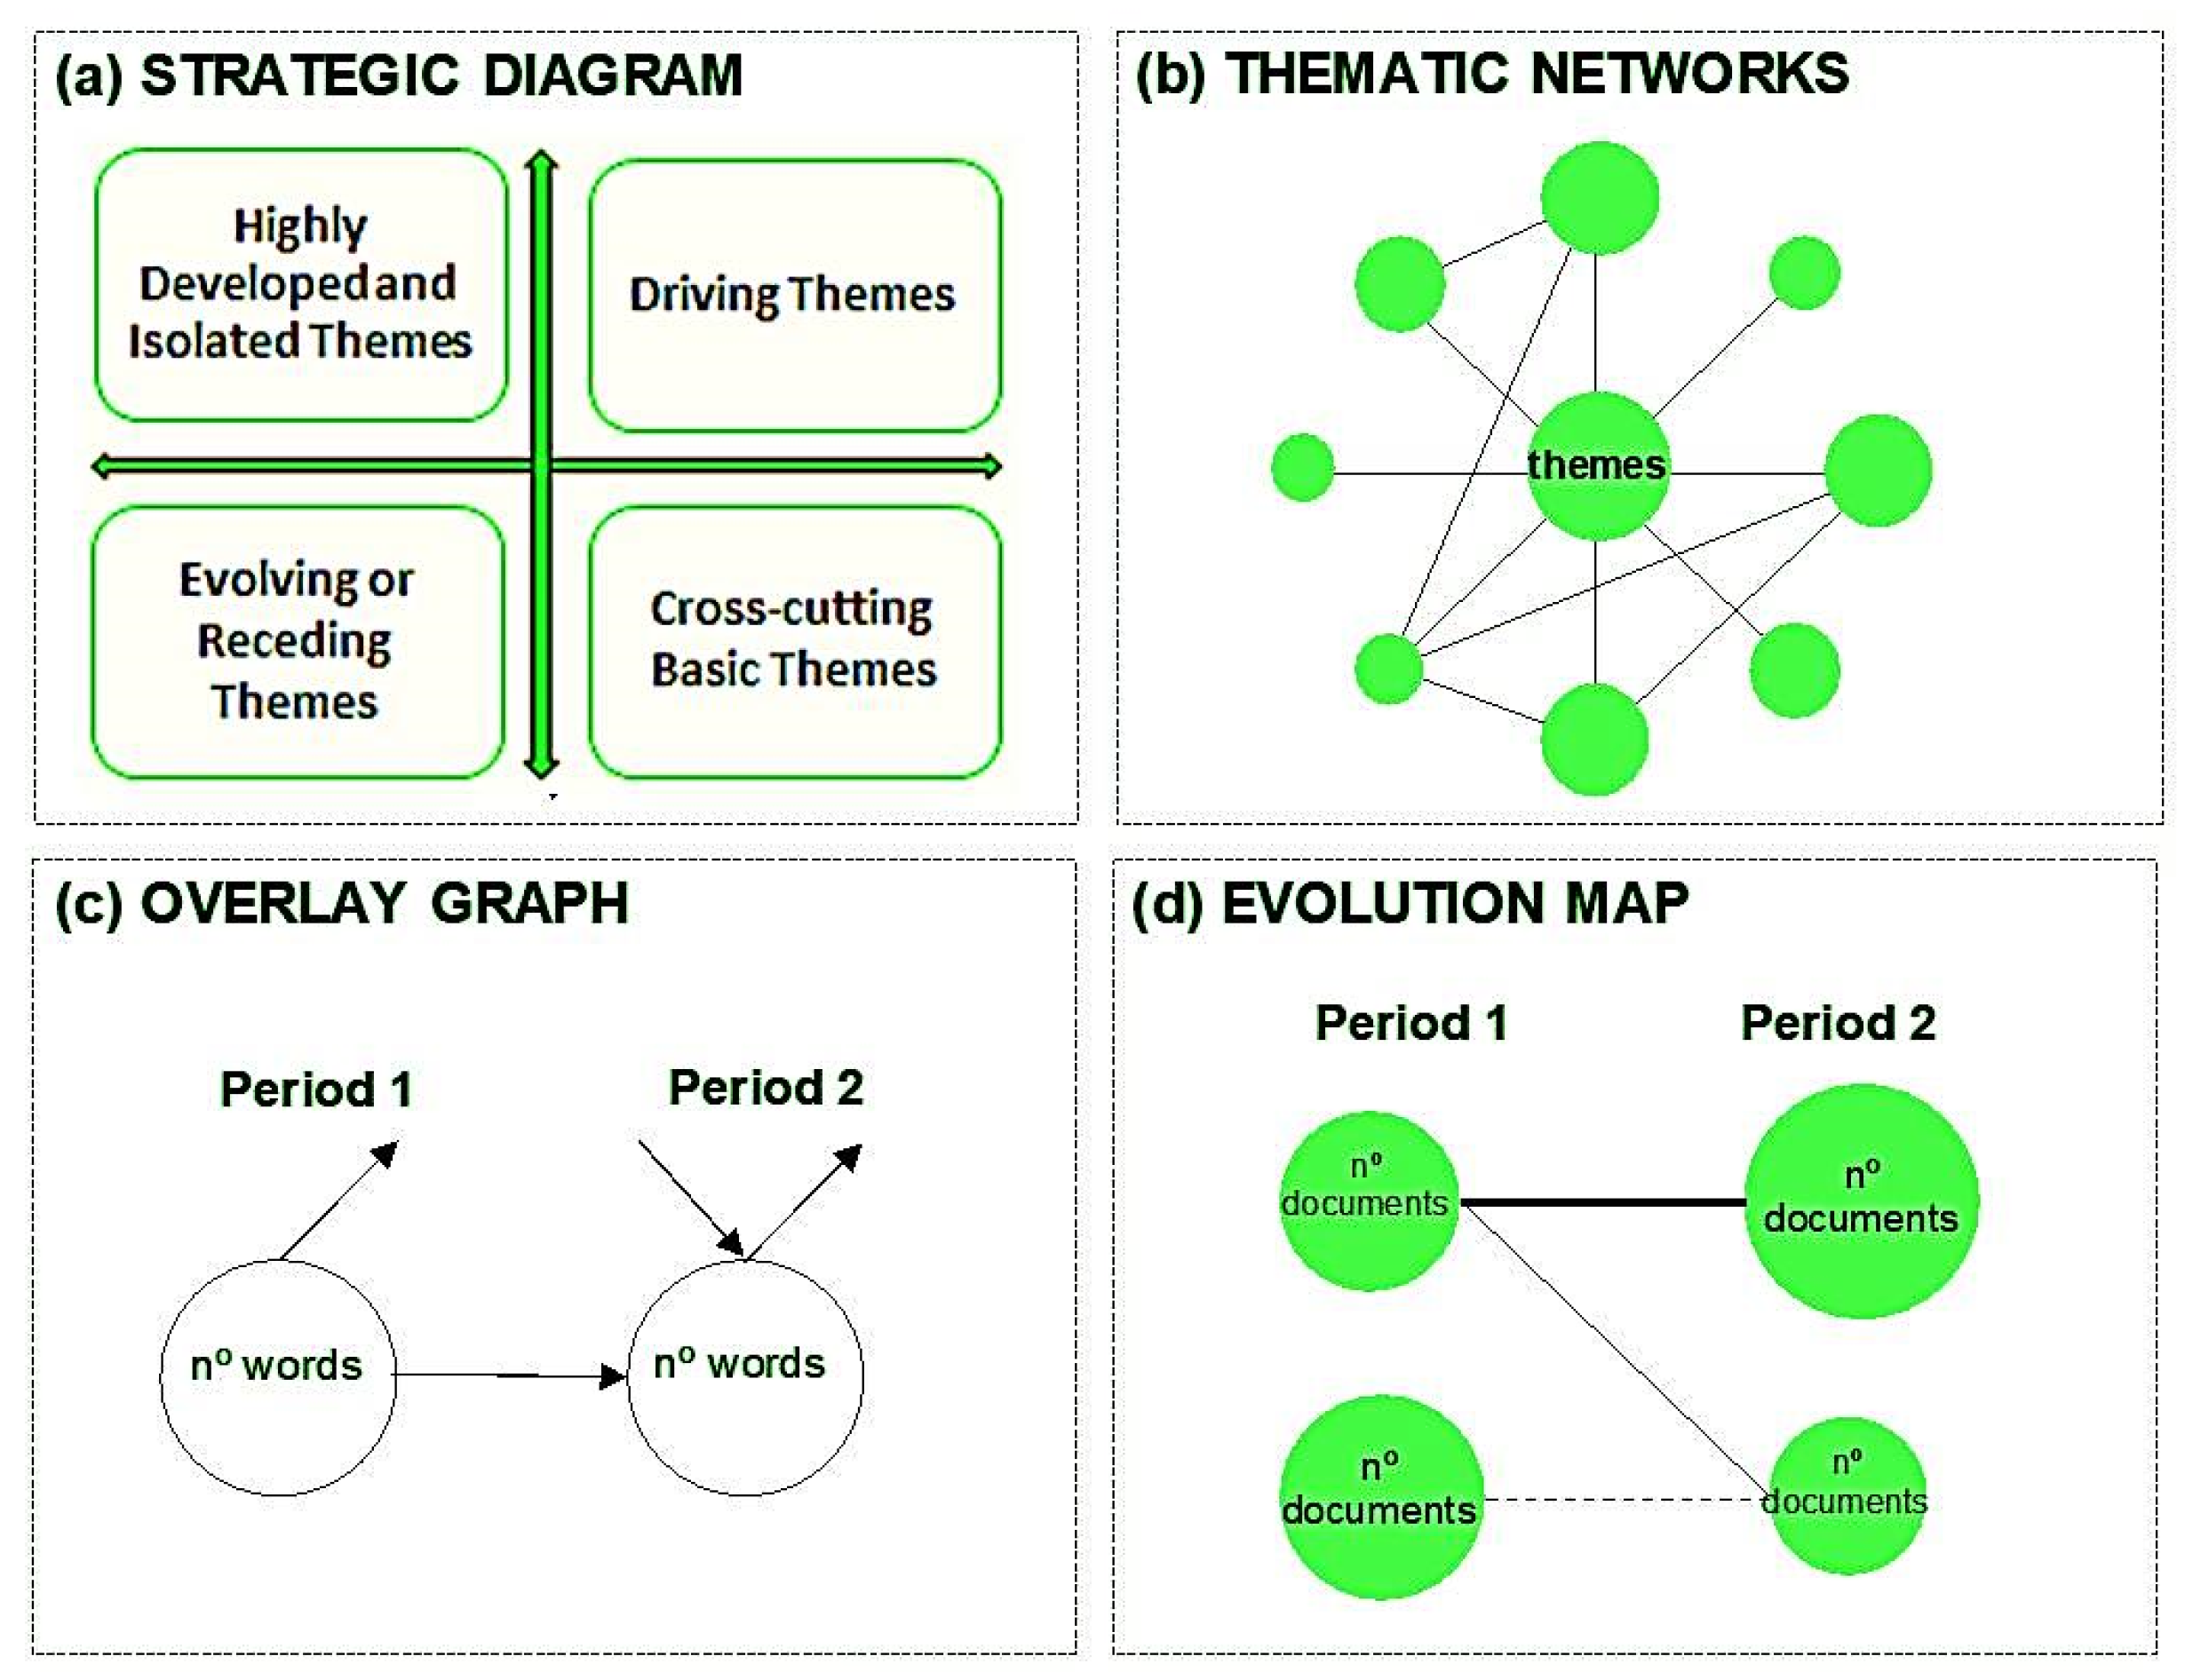
- Theme identification and strategic diagram: Initially, the software sets up the equivalency index. It then employs a specific methodology to identify the most relevant topics. Subsequently, using the concepts of centrality and density, it strategizes for every theme, illustrating how the core research and related subjects are interconnected. Centrality refers to the degree of influence a theme has over others in the network. Themes with high centrality are vital and positioned on the right side of the diagram. Density analyzes the relationships between terms within a theme to determine its development level. Themes with high density are considered well-developed and placed toward the top of the diagram [40,41,42]. The diagrams, divided into four sections, as shown in Figure 8, illustrate the various research topic categories.
- Driving themes: Important and well-understood subjects in the top right, essential for research growth.
- Highly developed and isolated themes: Topics that stand alone and are well-understood, found in the top left, specialized but separate from the main research.
- Evolving or receding themes: Topics in the bottom left that are not fully developed or currently significant. Their importance may increase or decrease in the future.
- Cross-cutting basic themes: Fundamental subjects important to the research but not yet fully developed, occupying the lower right section of the quadrant.
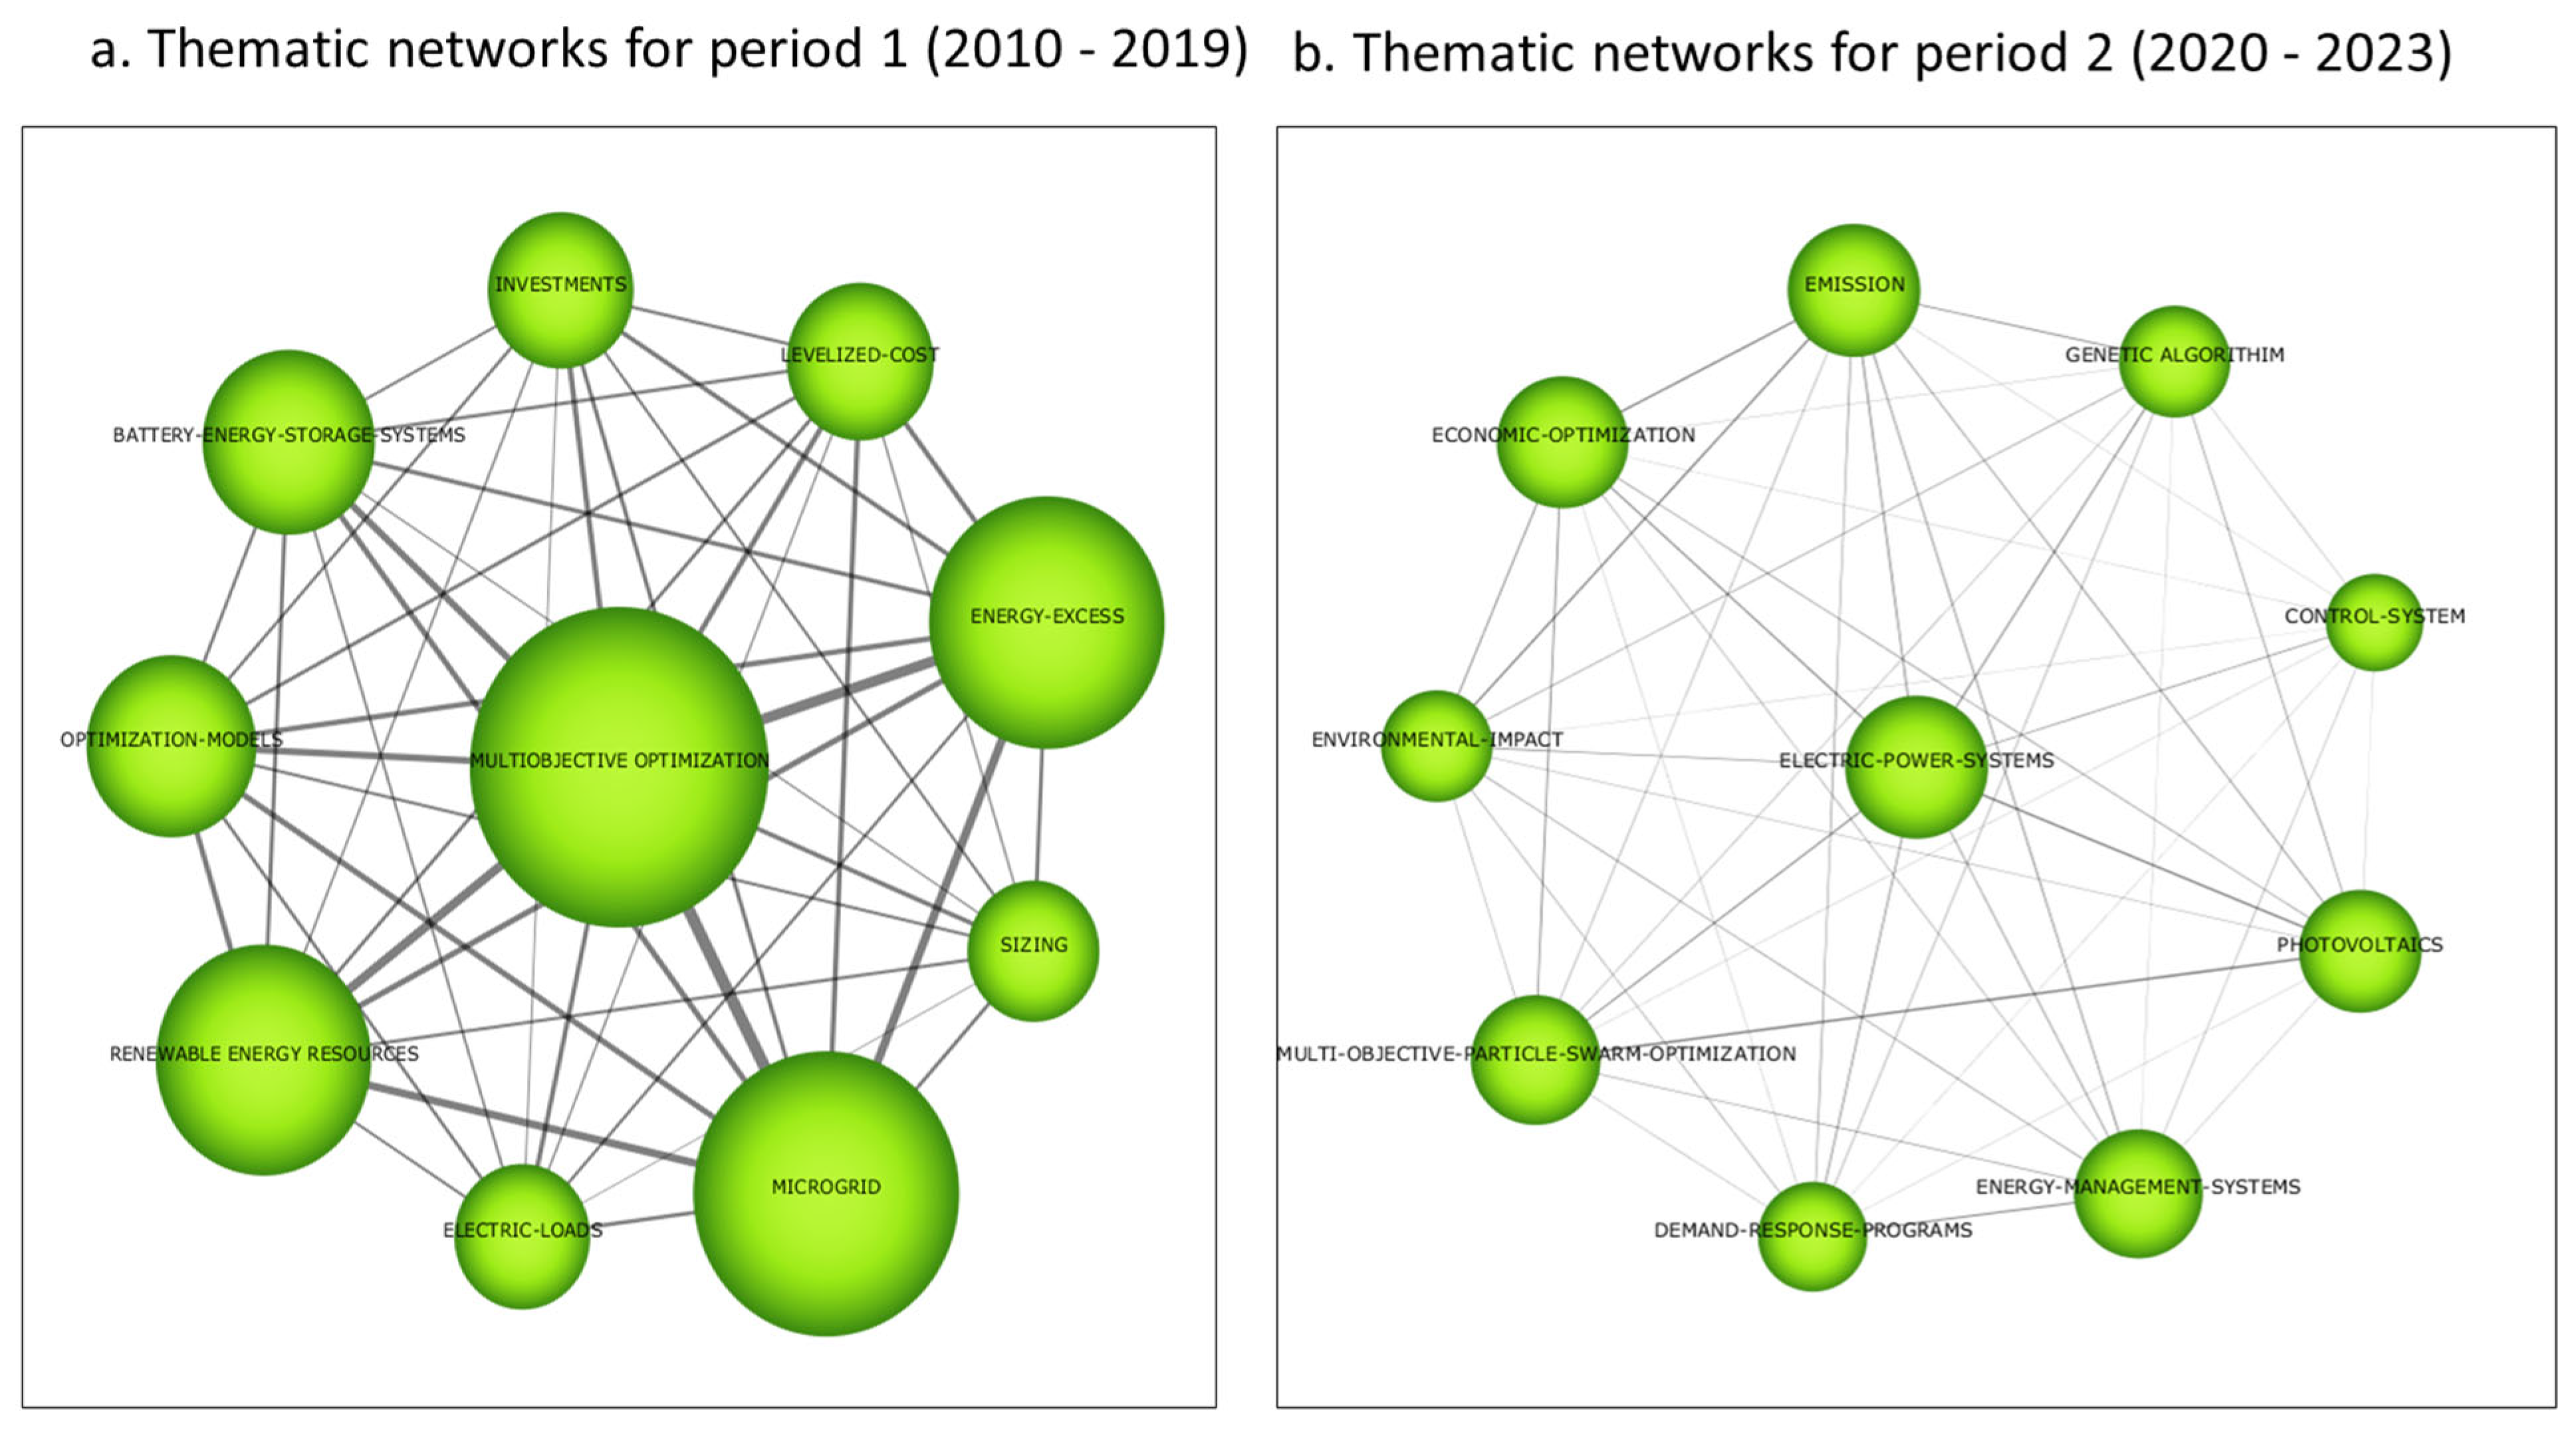
- Thematic Network Creation: This explores relationships between keywords and subjects to refine strategic diagrams. Each network depicted in Figure 8 is named after its principal keyword. The size of the circles indicates the number of associated papers, while the thickness of the links is determined by the equivalence index.
- Conceptual Connections: The inclusion index [43] illustrates how themes are interconnected over time:
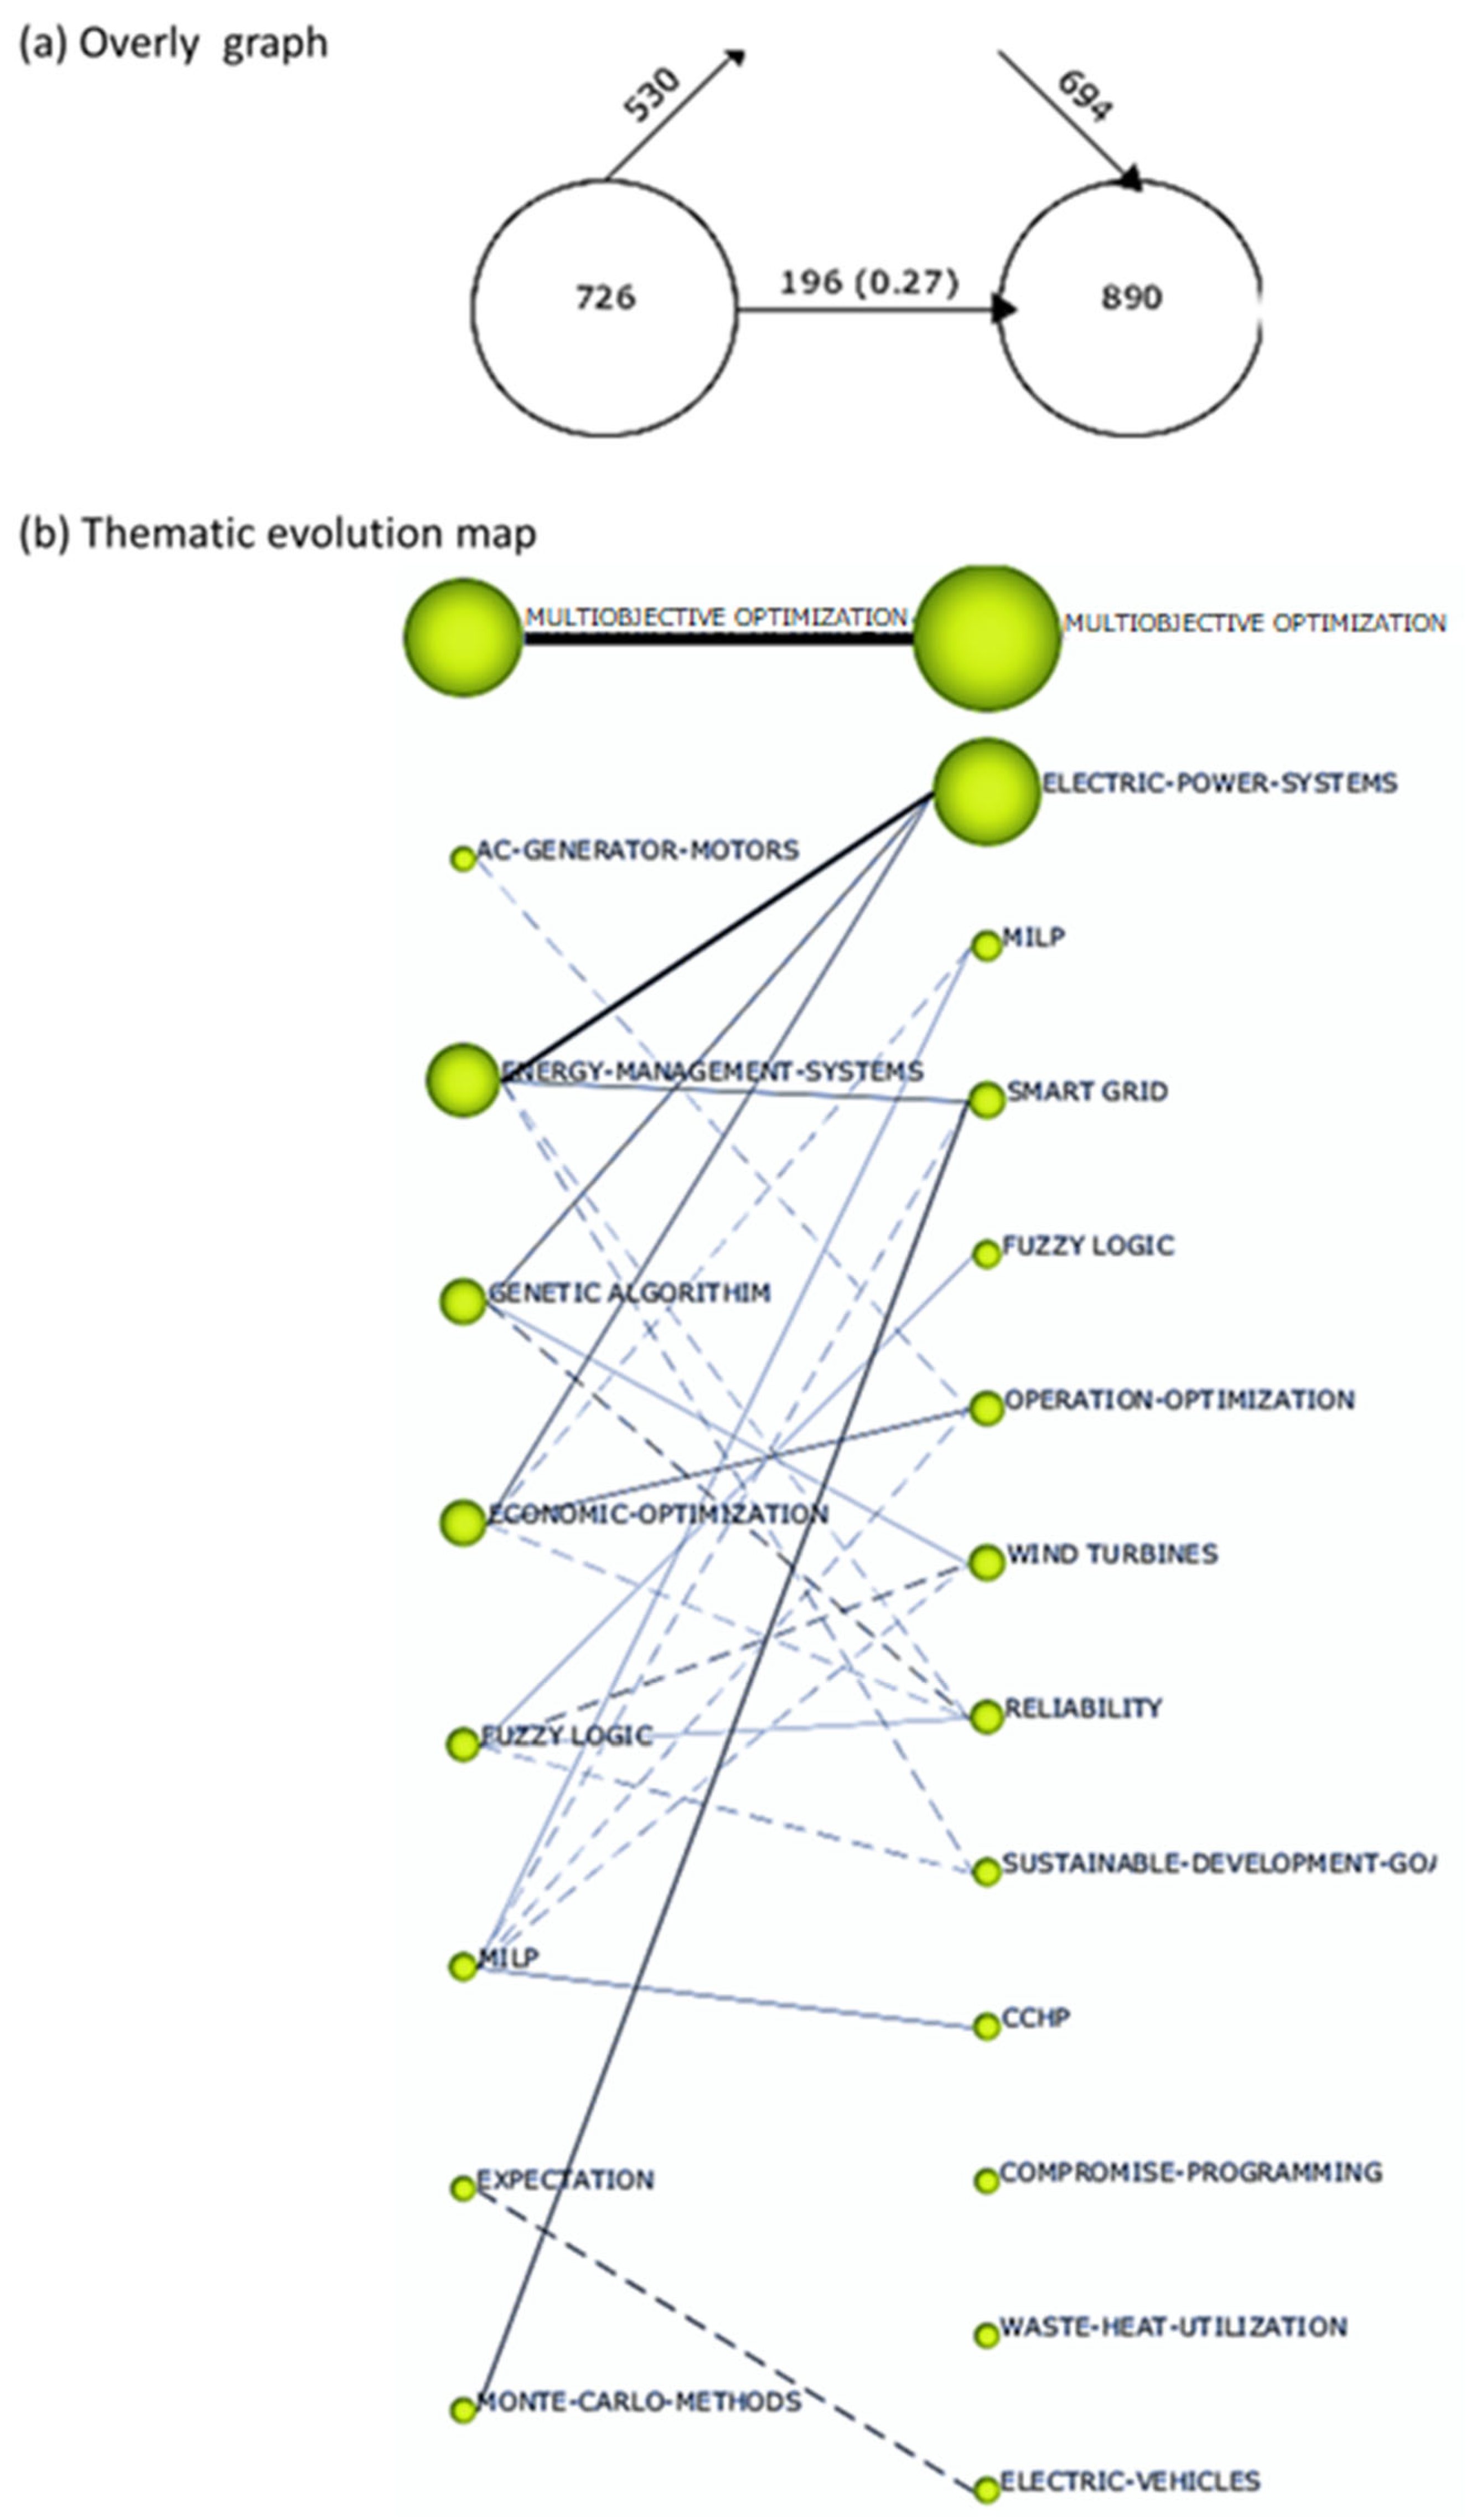
- Overlay Graph: Shows prevalent terms alongside keywords that have been added or removed over time.
- Thematic Evolution Map: Dotted lines represent sub-elements, and solid lines indicate connections to the primary theme. The size of circles and the thickness of lines signify the number of documents and the inclusion index, respectively.
- Evaluation of Performance: Evaluates research contributions using various metrics. It identifies leading subfields based on indicators such as the number of articles, citation counts, and variations in the h-index.
3. Findings and Analysis
3.1. SLR on the Application of MOO for HMGSs
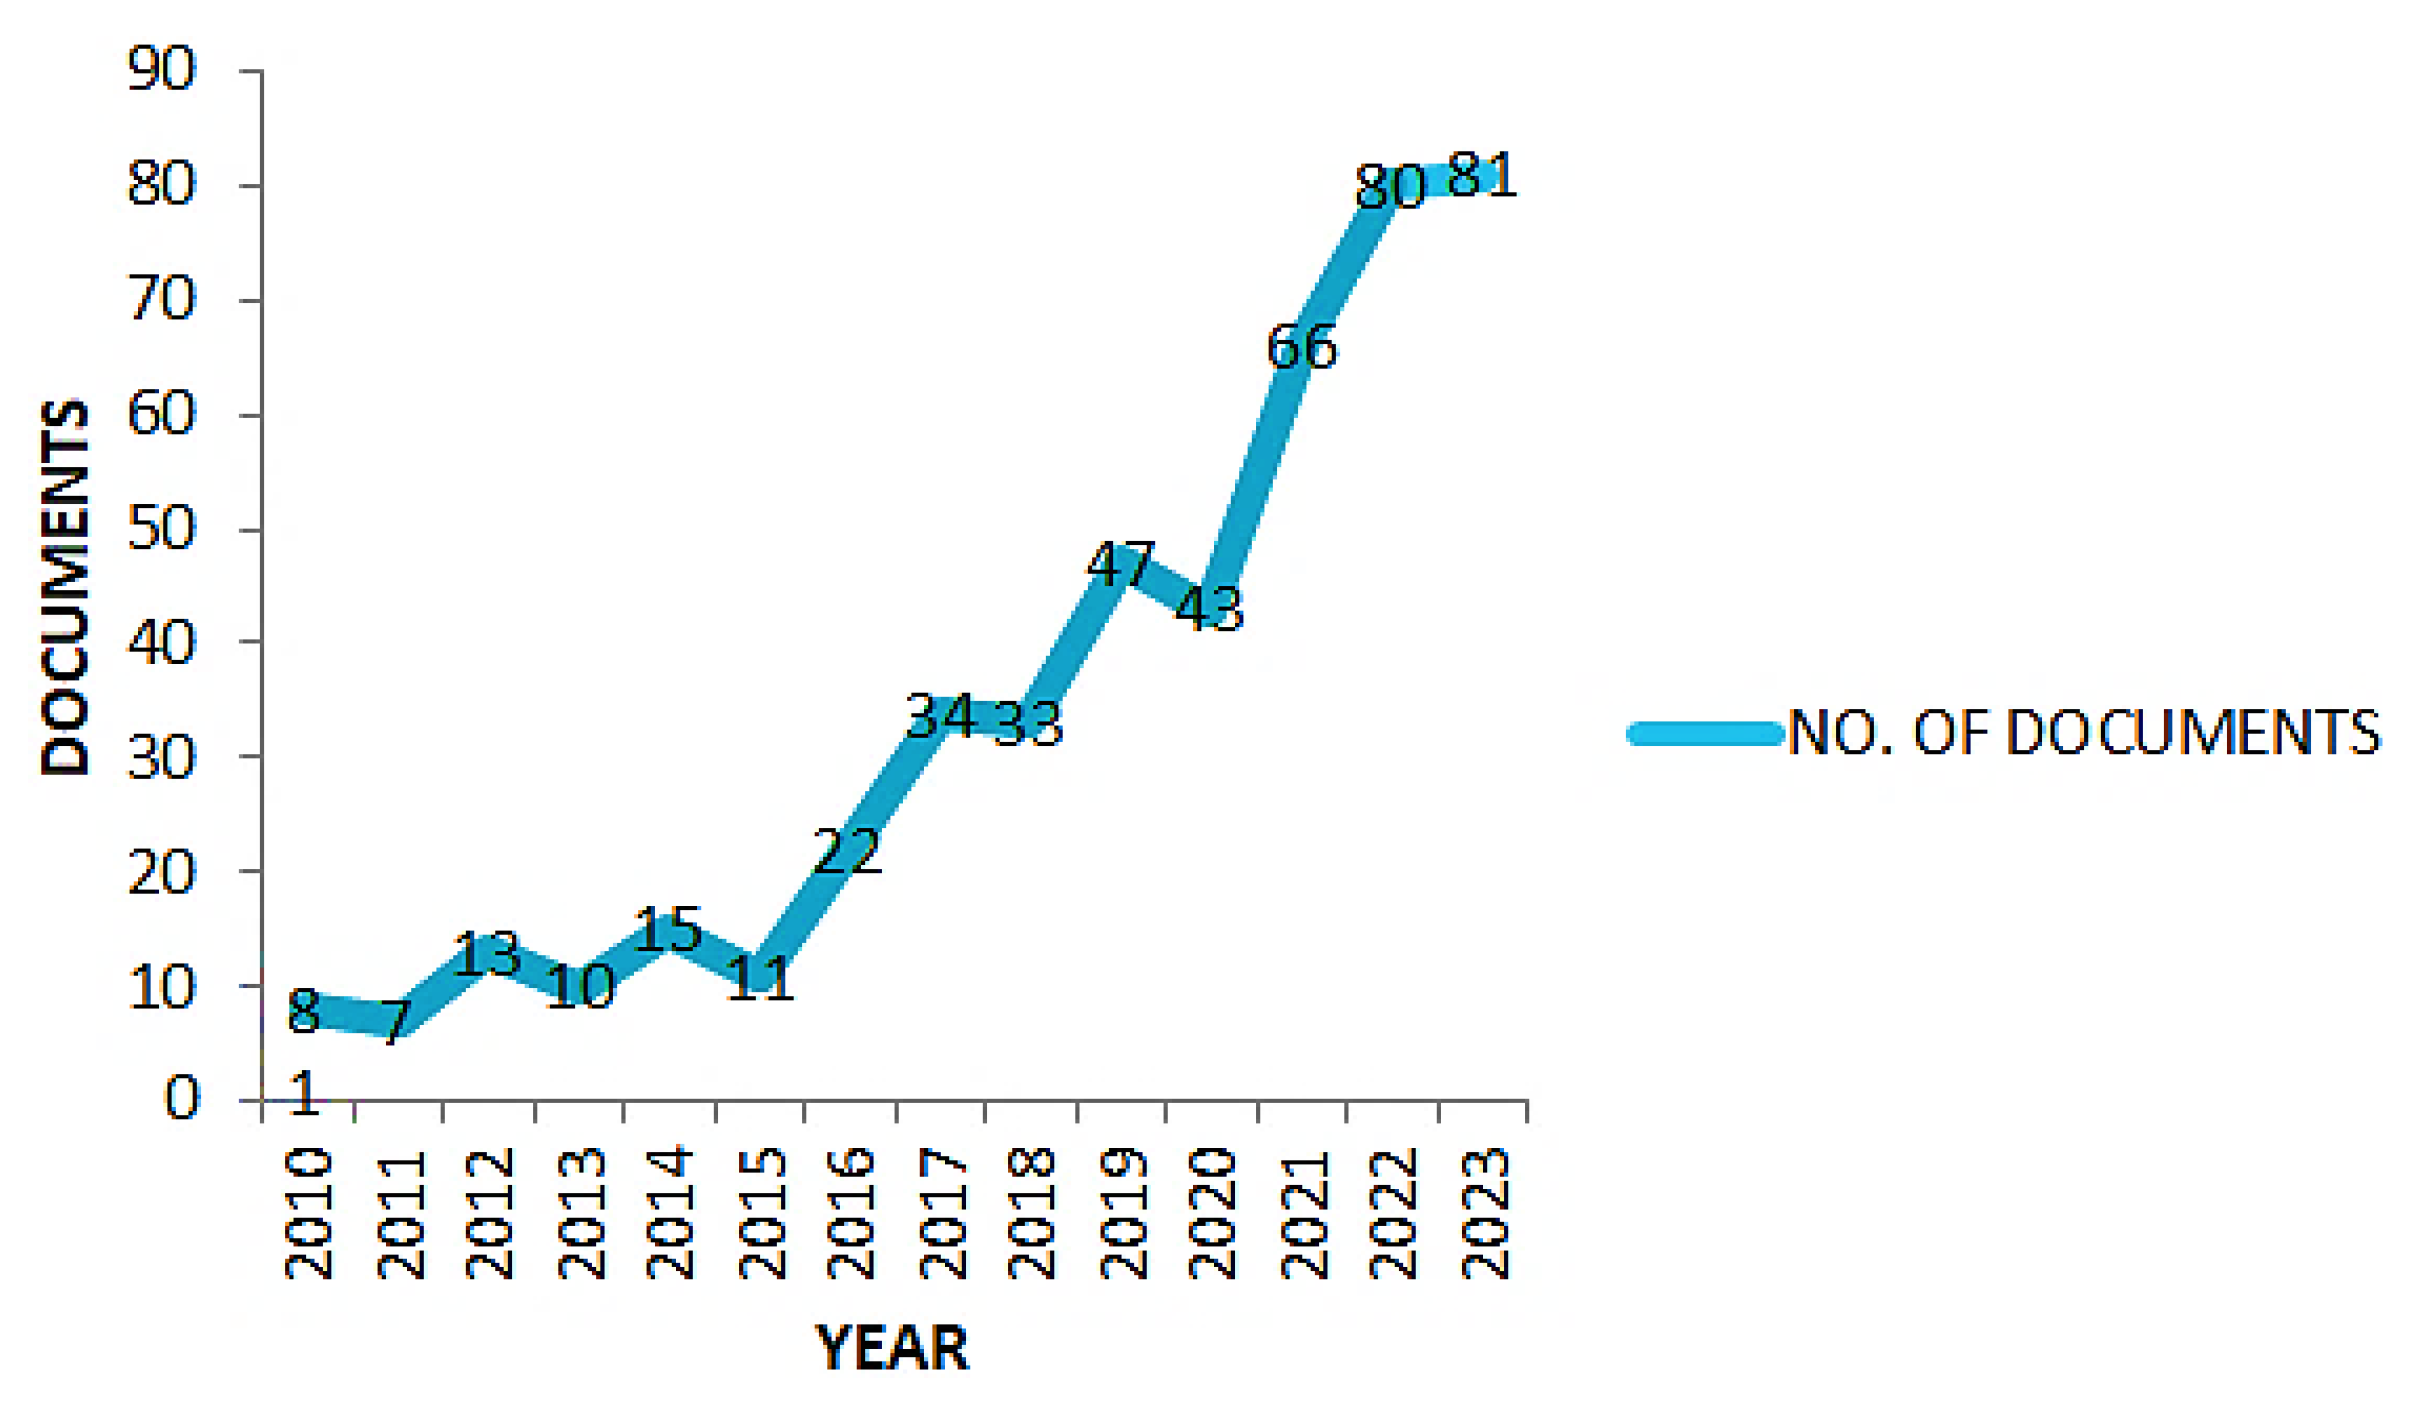
- RQ1: How is current research evolving in the selected field?
- RQ2: Which core ideas shape this area of study?
- RQ3: Which challenges currently persist in this research domain?
- RQ4: What are the pivotal moments or crucial issues related to the topic?
- RQ5: What topics attract significant focus and discussion?
- RQ6: What gaps or shortcomings can be identified in current studies?
- RQ7: Which publications or studies are considered seminal in this field?
- RQ8: Who are the leading contributors or prolific writers in this sector of research?

3.2. Bibliometric Analysis: Insights from Science Mapping and Performance Metrics
3.2.1. Strategic Diagrams

| Period 1 (2010–2019) | |||||
| Name of clusters | Documents count | h-index | Citations count | Centrality | Density |
| Multiobjective optimization | 198 | 51 | 9630 | 373.74 | 131.48 |
| Ac generator motors | 3 | 3 | 16 | 59.44 | 242.5 |
| Energy-management systems | 104 | 43 | 7351 | 226.49 | 24.94 |
| Genetic algorithm | 47 | 19 | 2956 | 126.1 | 19.49 |
| Economic optimization | 47 | 20 | 2630 | 134.23 | 8.16 |
| Fuzzy logic | 19 | 11 | 1839 | 89.02 | 9.76 |
| MILP | 9 | 7 | 472 | 70.22 | 10.63 |
| Expectation | 2 | 1 | 13 | 6.49 | 44.44 |
| Monte Carlo methods | 4 | 4 | 177 | 8.82 | 16.67 |
| Period 2 (2020–2023) | |||||
| Name of Clusters | Documents count | h- index | Citations count | Centrality | Density |
| Multiobjective optimization | 260 | 30 | 3347 | 363.59 | 135.68 |
| Electric-power systems | 176 | 29 | 2795 | 245.16 | 25.61 |
| MILP | 14 | 9 | 436 | 46.55 | 9.67 |
| Smart grid | 27 | 14 | 686 | 65.42 | 8.09 |
| Fuzzy logic | 9 | 5 | 193 | 39.26 | 47.41 |
| Operation optimization | 23 | 9 | 324 | 48.7 | 4.23 |
| Wind turbines | 26 | 9 | 381 | 61.39 | 4.34 |
| Reliability | 21 | 12 | 365 | 54.4 | 4.84 |
| Sustainable-development goal | 9 | 5 | 116 | 24.09 | 6.92 |
| CCHP | 6 | 4 | 101 | 16.65 | 19.67 |
| Compromise programming | 2 | 1 | 6 | 5.73 | 150 |
| Waste-heat utilization | 2 | 1 | 5 | 2.81 | 77.78 |
| Electric vehicles | 5 | 3 | 121 | 17.9 | 3.45 |
3.2.2. Thematic Networks
3.2.3. Graphical Overlay and the Evolution of Theme Mapping
3.2.4. Evaluation of Performance
| Name of the Journal | Documents Count | Total Citations | Most Cited Document | Citations Count |
|---|---|---|---|---|
| Energy | 26 | 2391 | [63] | 490 |
| Energies | 24 | 264 | [64] | 29 |
| IEEE Access | 22 | 265 | [65] | 41 |
| Applied Energy | 17 | 1449 | [36] | 357 |
| International Journal Of Electrical Power And Energy Systems | 15 | 443 | [66] | 121 |
| Renewable Energy | 10 | 905 | [35] | 360 |
| Sustainable Cities And Society | 10 | 386 | [67] | 121 |
| Energy Conversion And Management | 10 | 609 | [68] | 200 |
| Journal of cleaner production | 9 | 338 | [69] | 164 |
| IET Renewable Power Generation | 8 | 271 | [70] | 96 |
| Authors’ Names | Documents Count | Total Citations | H-Index | Most Cited Document | Citations Count |
|---|---|---|---|---|---|
| Yue Wang | 8 | 186 | 12 | [71] | 128 |
| Hongdong Wang | 8 | 130 | 12 | [72] | 102 |
| Josep M. Guerrero | 8 | 131 | 130 | [65] | 41 |
| Tomnobu Senjyu | 6 | 57 | 9 | [73] | 33 |
| Meenakshi De | 6 | 57 | 5 | [74] | 20 |
| Yuanzheng Li | 6 | 25 | 31 | [75] | 12 |
| Yongjun Zhang | 6 | 71 | 30 | [76] | 34 |
| Ziqiang Wang | 6 | 101 | 14 | [77] | 52 |
| Maria Luisa Di Silvestre | 6 | 445 | 22 | [78] | 147 |
| Hesen Liu | 6 | 53 | 9 | [79] | 27 |
| Authors’ Names | Year | Citation Counts | Most-Cited Document |
|---|---|---|---|
| Chaouachi, A., Kamel, R.M., Andoulsi, R, Nagasaka, K. | 2013 | 545 | [37] |
| Niknam, T., Moghaddam, A.A., Seifi, A., Alizadeh Pahlavani, M.R. | 2011 | 490 | [63] |
| Ramli, M.A.M., Bouchekara, H.R.E.H., Alghamdi, A.S. | 2018 | 360 | [35] |
| Niknam, T., Azizipanah Abarghooee, R, Narimani, M.R. | 2012 | 357 | [36] |
| Aghajani, G., Ghadimi, N. | 2018 | 347 | [80] |
| Borhanazad, H., Gounder Ganapathy, V., Mekhilef, S., Mirtaheri, A., Modiri-Delshad, M. | 2014 | 342 | [81] |
| Eriksson, E.L.V., Gray, E. | 2017 | 264 | [62] |
| Basu, A.K., Bhattacharya, A., Chowdhury, S., Chowdhury, S.P. | 2012 | 250 | [82] |
| Balog, R.S., Shadmand, M.B. | 2014 | 217 | [48] |
| Abapour, S., Mohammadi-Ivatloo, B., Nazari-Heris, M. | 2017 | 212 | [83] |
4. Comparative Analysis of MOO in HMGs: Evaluating Techniques and Algorithms for Enhanced Performance and Sustainability
5. Conclusions
Funding
Data Availability Statement
Conflicts of Interest
References
- Renewable Energy Agency; Global Renewables Alliance. Global Renewables Alliance Tripling Renewable Power and Doubling Energy Efficiency by 2030 Crucial Steps towards 1.5 °C 3200. Available online: https://globalrenewablesalliance.org/ (accessed on 14 November 2023).
- Stanković, Z.Z.; Rajic, M.N.; Božić, Z.; Milosavljević, P.; Păcurar, A.; Borzan, C.; Păcurar, R.; Sabău, E. The Volatility Dynamics of Prices in the European Power Markets during the COVID-19 Pandemic Period. Sustainability 2024, 16, 2426. [Google Scholar] [CrossRef]
- International Energy Agency. World Energy Outlook 2023. 2023. Available online: https://www.iea.org/terms (accessed on 23 April 2024).
- Khan, F.A.; Pal, N.; Saeed, S.H. Stand-alone hybrid system of solar photovoltaics/wind energy resources: An eco-friendly sustainable approach. In Renewable Energy Systems; Academic Press: Cambridge, MA, USA, 2021; pp. 687–705. [Google Scholar] [CrossRef]
- Paliwal, P.; Patidar, N.P.; Nema, R.K. Planning of grid integrated distributed generators: A review of technology, objectives and techniques. Renew. Sustain. Energy Rev. 2014, 40, 557–570. [Google Scholar] [CrossRef]
- Paska, J.; Biczel, P.; Kłos, M. Hybrid power systems—An effective way of utilising primary energy sources. Renew. Energy 2009, 34, 2414–2421. [Google Scholar] [CrossRef]
- Deshmukh, M.K.; Deshmukh, S.S. Modeling of hybrid renewable energy systems. Renew. Sustain. Energy Rev. 2008, 12, 235–249. [Google Scholar] [CrossRef]
- Shivarama Krishna, K.; Sathish Kumar, K. A review on hybrid renewable energy systems. Renew. Sustain. Energy Rev. 2015, 52, 907–916. [Google Scholar] [CrossRef]
- Hemmati, R.; Saboori, H. Emergence of hybrid energy storage systems in renewable energy and transport applications—A review. Renew. Sustain. Energy Rev. 2016, 65, 11–23. [Google Scholar] [CrossRef]
- Upadhyay, S.; Sharma, M.P. A review on configurations, control and sizing methodologies of hybrid energy systems. Renew. Sustain. Energy Rev. 2014, 38, 47–63. [Google Scholar] [CrossRef]
- Manwell, J.F. Hybrid Energy Systems. Encycl. Energy 2004, 3, 215–229. [Google Scholar]
- Al-Sahlawi, A.A.K.; Ayob, S.M.; Tan, C.W.; Ridha, H.M.; Hachim, D.M. Optimal Design of Grid-Connected Hybrid Renewable Energy System Considering Electric Vehicle Station Using Improved Multi-Objective Optimization: Techno-Economic Perspectives. Sustainability 2024, 16, 2491. [Google Scholar] [CrossRef]
- Ton, D.T.; Smith, M.A. The U.S. Department of Energy’s Microgrid Initiative. Electr. J. 2012, 25, 84–94. [Google Scholar] [CrossRef]
- Zia, M.F.; Elbouchikhi, E.; Benbouzid, M. Microgrids energy management systems: A critical review on methods, solutions, and prospects. Appl. Energy 2018, 222, 1033–1055. [Google Scholar] [CrossRef]
- Jha, P.; Sharma, N.; Jadoun, V.K.; Agarwal, A.; Tomar, A. Optimal scheduling of a microgrid using AI techniques. In Control Standalone Microgrid; Academic Press: Cambridge, MA, USA, 2021; pp. 297–336. [Google Scholar] [CrossRef]
- Arar Tahir, K.; Zamorano, M.; Ordóñez García, J. Scientific mapping of optimisation applied to microgrids integrated with renewable energy systems. Int. J. Electr. Power Energy Syst. 2023, 145, 108698. [Google Scholar] [CrossRef]
- Kaabeche, A.; Belhamel, M.; Ibtiouen, R. Sizing optimization of grid-independent hybrid photovoltaic/wind power generation system. Energy 2011, 36, 1214–1222. [Google Scholar] [CrossRef]
- Li, Y.J.; Yue, D.W.; Liu, H.X.; Liu, Y.F. Wind-solar complementary power inverter based on intelligent control. In Proceedings of the 2009 4th IEEE Conference on Industrial Electronics and Applications, Xi’an, China, 25–27 May 2009; pp. 3635–3638. [Google Scholar] [CrossRef]
- Cagnano, A.; De Tuglie, E.; Mancarella, P. Microgrids: Overview and guidelines for practical implementations and operation. Appl. Energy 2020, 258, 114039. [Google Scholar] [CrossRef]
- Fusheng, L.; Ruisheng, L.; Fengquan, Z. Microgrid technology and engineering application. In Microgrid Technology and Engineering Application; Elsevier: Amsterdam, The Netherlands, 2015; pp. 1–198. [Google Scholar] [CrossRef]
- Sumathi, S.; Kumar, L.A.; Surekha, P. Solar Photovoltaic & Wind Energy Conversion Systems; Springer: Cham, Switzerland, 2015; p. 807. [Google Scholar]
- Azaza, M.; Wallin, F. Multi objective particle swarm optimization of hybrid micro-grid system: A case study in Sweden. Energy 2017, 123, 108–118. [Google Scholar] [CrossRef]
- Wang, L.; Singh, C. PSO-based multi-criteria optimum design of a grid-connected hybrid power system with multiple renewable sources of energy. In Proceedings of the 2007 IEEE Swarm Intelligence Symposium, Honolulu, HI, USA, 1–5 April 2007; pp. 250–257. [Google Scholar] [CrossRef]
- Ashari, M.; Nayar, C.V. An Optimum Dispatch Strategy Using Set Points for a Photovoltaic (PV)-Diesel-Battery Hybrid Power System. Sol. Energy 1999, 66, 1–9. [Google Scholar] [CrossRef]
- Bruck, M.; Sandborn, P. Pricing bundled renewable energy credits using a modified LCOE for power purchase agreements. Renew. Energy 2021, 170, 224–235. [Google Scholar] [CrossRef]
- Ma, T.; Yang, H.; Lu, L. Study on stand-alone power supply options for an isolated community. Int. J. Electr. Power Energy Syst. 2015, 65, 1–11. [Google Scholar] [CrossRef]
- Tsai, C.T.; Beza, T.M.; Molla, E.M.; Kuo, C.C. Analysis and Sizing of Mini-Grid Hybrid Renewable Energy System for Islands. IEEE Access 2020, 8, 70013–70029. [Google Scholar] [CrossRef]
- Hiendro, A.; Yusuf, I.; Trias, F.; Wigyarianto, P.; Kho, H.; Khwee, J. Optimum Renewable Fraction for Grid-connected Photovoltaic in Office Building Energy Systems in Indonesia. Int. J. Power Electron. Drive Syst. 2018, 9, 1866–1874. [Google Scholar] [CrossRef]
- Murphy, D.J.; Hall, C.A.S. Year in review-EROI or energy return on (energy) invested. Ann. N. Y. Acad. Sci. 2010, 1185, 102–118. [Google Scholar] [CrossRef] [PubMed]
- Hall, C.A.S.; Lambert, J.G.; Balogh, S.B. EROI of different fuels and the implications for society. Energy Policy 2014, 64, 141–152. [Google Scholar] [CrossRef]
- Payback—Energy Education. Available online: https://energyeducation.ca/encyclopedia/Payback (accessed on 19 February 2024).
- Deb, K. Multi-Objective Optimization Using Evolutionary Algorithms: An Introduction. In Multi-objective Evolutionary Optimisation for Product Design and Manufacturing; Springer: London, UK, 2011. [Google Scholar] [CrossRef]
- Alhammadi, H.Y.; Romagnoli, J.A. Process design and operation: Incorporating environmental, profitability, heat integration and controllability considerations. Comput. Aided Chem. Eng. 2004, 17, 264–305. [Google Scholar] [CrossRef]
- Pintarič, Z.N.; Kravanja, Z. Suitable Process Modelling for Proper Multi-Objective Optimization of Process Flow Sheets. Comput. Aided Chem. Eng. 2014, 33, 1387–1392. [Google Scholar] [CrossRef]
- Ramli, M.A.M.; Bouchekara, H.R.E.H.; Alghamdi, A.S. Optimal sizing of PV/wind/diesel hybrid microgrid system using multi-objective self-adaptive differential evolution algorithm. Renew. Energy 2018, 121, 400–411. [Google Scholar] [CrossRef]
- Niknam, T.; Azizipanah-Abarghooee, R.; Narimani, M.R. An efficient scenario-based stochastic programming framework for multi-objective optimal micro-grid operation. Appl. Energy 2012, 99, 455–470. [Google Scholar] [CrossRef]
- Chaouachi, A.; Kamel, R.M.; Andoulsi, R.; Nagasaka, K. Multiobjective Intelligent Energy Management for a Microgrid. IEEE Trans. Ind. Electron. 2013, 60, 1688–1699. [Google Scholar] [CrossRef]
- Donthu, N.; Kumar, S.; Mukherjee, D.; Pandey, N.; Lim, W.M. How to conduct a bibliometric analysis: An overview and guidelines. J. Bus. Res. 2021, 133, 285–296. [Google Scholar] [CrossRef]
- Liberati, A.; Altman, D.G.; Tetzlaff, J.; Mulrow, C.; Gøtzsche, P.C.; Ioannidis, J.P.A.; Clarke, M.; Devereaux, P.J.; Kleijnen, J.; Moher, D. The PRISMA statement for reporting systematic reviews and meta-analyses of studies that evaluate healthcare interventions: Explanation and elaboration. BMJ 2009, 339, b2700. [Google Scholar] [CrossRef]
- Martínez, M.A.; Cobo, M.J.; Herrera, M.; Herrera-Viedma, E. Analyzing the Scientific Evolution of Social Work Using Science Mapping. Res. Soc. Work. Pract. 2015, 25, 257–277. [Google Scholar] [CrossRef]
- Cobo, M.J.; López-Herrera, A.G.; Herrera-Viedma, E.; Herrera, F. An approach for detecting, quantifying, and visualizing the evolution of a research field: A practical application to the Fuzzy Sets Theory field. J. Informetr. 2011, 5, 146–166. [Google Scholar] [CrossRef]
- Callon, M.; Courtial, J.P.; Laville, F. Co-word analysis as a tool for describing the network of interactions between basic and technological research: The case of polymer chemsitry. Scientometrics 1991, 22, 155–205. [Google Scholar] [CrossRef]
- Díaz-López, C.; Carpio, M.; Martín-Morales, M.; Zamorano, M. Analysis of the scientific evolution of sustainable building assessment methods. Sustain. Cities Soc. 2019, 49, 101610. [Google Scholar] [CrossRef]
- SDG Indicators—SDG Indicators. Available online: https://unstats.un.org/sdgs/metadata/ (accessed on 14 March 2024).
- Naderi, E.; Dejamkhooy, A.; Seyedshenava, S.J.; Shayeghi, H. MILP based Optimal Design of Hybrid Microgrid by Considering Statistical Wind Estimation and Demand Response. J. Oper. Autom. Power Eng. 2022, 10, 54–65. [Google Scholar] [CrossRef]
- Karimi, H.; Jadid, S. Optimal energy management for multi-microgrid considering demand response programs: A stochastic multi-objective framework. Energy 2020, 195, 116992. [Google Scholar] [CrossRef]
- Vivas, F.J.; Segura, F.; Andújar, J.M.; Palacio, A.; Saenz, J.L.; Isorna, F.; López, E. Multi-Objective Fuzzy Logic-Based Energy Management System for Microgrids with Battery and Hydrogen Energy Storage System. Electronics 2020, 9, 1074. [Google Scholar] [CrossRef]
- Shadmand, M.B.; Balog, R.S. Multi-objective optimization and design of photovoltaic-wind hybrid system for community smart DC microgrid. IEEE Trans. Smart Grid 2014, 5, 2635–2643. [Google Scholar] [CrossRef]
- Sanseverino, E.R.; Di Silvestre, M.L.; Ippolito, M.G.; De Paola, A.; Lo Re, G. An execution, monitoring and replanning approach for optimal energy management in microgrids. Energy 2011, 36, 3429–3436. [Google Scholar] [CrossRef]
- Ghasemi, R.; Wosnik, M.; Foster, D.L.; Mo, W. Multi-Objective Decision-Making for an Island Microgrid in the Gulf of Maine. Sustainability 2023, 15, 13900. [Google Scholar] [CrossRef]
- Lokeshgupta, B.; Sivasubramani, S. Optimal operation of a residential microgrid with demand side management. In Proceedings of the 2019 IEEE PES Innovative Smart Grid Technologies Europe (ISGT-Europe), Bucharest, Romania, 29 September–2 October 2019. [Google Scholar] [CrossRef]
- Haddadian, H.; Noroozian, R. Multi-Microgrid-Based Operation of Active Distribution Networks Considering Demand Response Programs. IEEE Trans. Sustain. Energy 2019, 10, 1804–1812. [Google Scholar] [CrossRef]
- Krishna, P.V.N.M.; Sekhar, P.C. Area Constrained Optimal Planning Model of Renewable-Rich Hybrid Microgrid. IEEE Access 2023, 11, 70873–70883. [Google Scholar] [CrossRef]
- Tracking Clean Energy Progress 2023—Analysis—IEA. Available online: https://www.iea.org/reports/tracking-clean-energy-progress-2023 (accessed on 15 February 2024).
- Mu, Z.; Zhao, F.; Bai, F.; Liu, Z.; Hao, H. Evaluating Fuel Cell vs. Battery Electric Trucks: Economic Perspectives in Alignment with China’s Carbon Neutrality Target. Sustainability 2024, 16, 2427. [Google Scholar] [CrossRef]
- Momen, S.; Nikoukar, J.; Gandomkar, M. Multi-objective Optimization of Energy Consumption in Microgrids Considering CHPs and Renewables Using Improved Shuffled Frog Leaping Algorithm. J. Electr. Eng. Technol. 2023, 18, 1539–1555. [Google Scholar] [CrossRef]
- Li, Y.; Huang, J.; Liu, Y.; Wang, H.; Wang, Y.; Ai, X. A Multicriteria Optimal Operation Framework for a Data Center Microgrid Considering Renewable Energy and Waste Heat Recovery: Use of Balanced Decision Making. IEEE Ind. Appl. Mag. 2023, 29, 23–38. [Google Scholar] [CrossRef]
- Heat Pumps—Energy System—IEA. Available online: https://www.iea.org/energy-system/buildings/heat-pumps#tracking (accessed on 15 February 2024).
- Martínez Fernández, P.; Villalba Sanchís, I.; Yepes, V.; Insa Franco, R. A review of modelling and optimisation methods applied to railways energy consumption. J. Clean. Prod. 2019, 222, 153–162. [Google Scholar] [CrossRef]
- Aghajani, G.R.; Shayanfar, H.A.; Shayeghi, H. Presenting a multi-objective generation scheduling model for pricing demand response rate in micro-grid energy management. Energy Convers. Manag. 2015, 106, 308–321. [Google Scholar] [CrossRef]
- Zand, H.K.; Mazlumi, K.; Bagheri, A.; Hashemi-Dezaki, H. Optimal Protection Scheme for Enhancing AC Microgrids Stability against Cascading Outages by Utilizing Events Scale Reduction Technique and Fuzzy Zero-Violation Clustering Algorithm. Sustainability 2023, 15, 15550. [Google Scholar] [CrossRef]
- Eriksson, E.L.V.; Gray, E.M.A. Optimization and integration of hybrid renewable energy hydrogen fuel cell energy systems—A critical review. Appl. Energy 2017, 202, 348–364. [Google Scholar] [CrossRef]
- Moghaddam, A.A.; Seifi, A.; Niknam, T.; Alizadeh Pahlavani, M.R. Multi-objective operation management of a renewable MG (micro-grid) with back-up micro-turbine/fuel cell/battery hybrid power source. Energy 2011, 36, 6490–6507. [Google Scholar] [CrossRef]
- Wu, X.; Cao, W.; Wang, D.; Ding, M. A Multi-Objective Optimization Dispatch Method for Microgrid Energy Management Considering the Power Loss of Converters. Energies 2019, 12, 2160. [Google Scholar] [CrossRef]
- Salehi, N.; Martinez-Garcia, H.; Velasco-Quesada, G.; Guerrero, J.M. A Comprehensive Review of Control Strategies and Optimization Methods for Individual and Community Microgrids. IEEE Access 2022, 10, 15935–15955. [Google Scholar] [CrossRef]
- Moradi, M.H.; Abedini, M.; Tousi, S.M.R.; Hosseinian, S.M. Optimal siting and sizing of renewable energy sources and charging stations simultaneously based on Differential Evolution algorithm. Int. J. Electr. Power Energy Syst. 2015, 73, 1015–1024. [Google Scholar] [CrossRef]
- Mansouri, S.A.; Ahmarinejad, A.; Nematbakhsh, E.; Javadi, M.S.; Jordehi, A.R.; Catalão, J.P.S. Energy management in microgrids including smart homes: A multi-objective approach. Sustain. Cities Soc. 2021, 69, 102852. [Google Scholar] [CrossRef]
- Motevasel, M.; Seifi, A.R. Expert energy management of a micro-grid considering wind energy uncertainty. Energy Convers. Manag. 2014, 83, 58–72. [Google Scholar] [CrossRef]
- Rezvani, A.; Gandomkar, M.; Izadbakhsh, M.; Ahmadi, A. Environmental/economic scheduling of a micro-grid with renewable energy resources. J. Clean. Prod. 2015, 87, 216–226. [Google Scholar] [CrossRef]
- Gazijahani, F.S.; Salehi, J. Stochastic multi-objective framework for optimal dynamic planning of interconnected microgrids. IET Renew. Power Gener. 2017, 11, 1749–1759. [Google Scholar] [CrossRef]
- Das, R.; Wang, Y.; Putrus, G.; Kotter, R.; Marzband, M.; Herteleer, B.; Warmerdam, J. Multi-objective techno-economic-environmental optimisation of electric vehicle for energy services. Appl. Energy 2020, 257, 113965. [Google Scholar] [CrossRef]
- Fang, S.; Xu, Y.; Li, Z.; Zhao, T.; Wang, H. Two-Step Multi-Objective Management of Hybrid Energy Storage System in All-Electric Ship Microgrids. IEEE Trans. Veh. Technol. 2019, 68, 3361–3373. [Google Scholar] [CrossRef]
- Hemeida, A.M.; Omer, A.S.; Bahaa-Eldin, A.M.; Alkhalaf, S.; Ahmed, M.; Senjyu, T.; El-Saady, G. Multi-objective multi-verse optimization of renewable energy sources-based micro-grid system: Real case. Ain Shams Eng. J. 2022, 13, 101543. [Google Scholar] [CrossRef]
- De, M.; Das, G.; Mandal, K.K. An effective energy flow management in grid-connected solar–wind-microgrid system incorporating economic and environmental generation scheduling using a meta-dynamic approach-based multiobjective flower pollination algorithm. Energy Rep. 2021, 7, 2711–2726. [Google Scholar] [CrossRef]
- Li, Y.; Zhao, T.; Wang, P.; Gooi, H.B.; Ding, Z.; Li, K.; Yan, W. Flexible Scheduling of Microgrid with Uncertainties Considering Expectation and Robustness. IEEE Trans. Ind. Appl. 2018, 54, 3009–3018. [Google Scholar] [CrossRef]
- Xie, P.; Cai, Z.; Liu, P.; Li, X.; Zhang, Y.; Xu, D. Microgrid System Energy Storage Capacity Optimization Considering Multiple Time Scale Uncertainty Coupling. IEEE Trans. Smart Grid 2018, 10, 5234–5245. [Google Scholar] [CrossRef]
- Xiong, L.; Li, P.; Wang, Z.; Wang, J. Multi-agent based multi objective renewable energy management for diversified community power consumers. Appl. Energy 2020, 259, 114140. [Google Scholar] [CrossRef]
- Graditi, G.; Di Silvestre, M.L.; Gallea, R.; Sanseverino, E.R. Heuristic-based shiftable loads optimal management in smart micro-grids. IEEE Trans. Ind. Inform. 2015, 11, 271–280. [Google Scholar] [CrossRef]
- Yan, B.; Wang, B.; Zhu, L.; Liu, H.; Liu, Y.; Ji, X.; Liu, D. A Novel, Stable, and Economic Power Sharing Scheme for an Autonomous Microgrid in the Energy Internet. Energies 2015, 8, 12741–12764. [Google Scholar] [CrossRef]
- Aghajani, G.; Ghadimi, N. Multi-objective energy management in a micro-grid. Energy Rep. 2018, 4, 218–225. [Google Scholar] [CrossRef]
- Borhanazad, H.; Mekhilef, S.; Gounder Ganapathy, V.; Modiri-Delshad, M.; Mirtaheri, A. Optimization of micro-grid system using MOPSO. Renew. Energy 2014, 71, 295–306. [Google Scholar] [CrossRef]
- Basu, A.K.; Bhattacharya, A.; Chowdhury, S.; Chowdhury, S.P. Planned scheduling for economic power sharing in a CHP-based micro-grid. IEEE Trans. Power Syst. 2012, 27, 30–38. [Google Scholar] [CrossRef]
- Nazari-Heris, M.; Abapour, S.; Mohammadi-Ivatloo, B. Optimal economic dispatch of FC-CHP based heat and power micro-grids. Appl. Therm. Eng. 2017, 114, 756–769. [Google Scholar] [CrossRef]
- Wang, L.; Li, Q.; Ding, R.; Sun, M.; Wang, G. Integrated scheduling of energy supply and demand in microgrids under uncertainty: A robust multi-objective optimization approach. Energy 2017, 130, 1–14. [Google Scholar] [CrossRef]
- Jahangir, H.; Ahmadian, A.; Golkar, M.A. Multi-objective sizing of grid-connected micro-grid using Pareto front solutions. In Proceedings of the 2015 IEEE Innovative Smart Grid Technologies—Asia (ISGT ASIA), Bangkok, Thailand, 3–6 November 2015; pp. 1–6. [Google Scholar] [CrossRef]
- Motevasel, M.; Seifi, A.R.; Niknam, T. Multi-objective energy management of CHP (combined heat and power)-based micro-grid. Energy 2013, 51, 123–136. [Google Scholar] [CrossRef]
- Wang, J.S.; Lee, C.S.G. Self-adaptive neuro-fuzzy inference systems for classification applications. IEEE Trans. Fuzzy Syst. 2002, 10, 790–802. [Google Scholar] [CrossRef]
- Gao, S.; Yu, Y.; Wang, Y.; Wang, J.; Cheng, J.; Zhou, M. Chaotic Local Search-Based Differential Evolution Algorithms for Optimization. IEEE Trans. Syst. Man Cybern. Syst. 2021, 51, 3954–3967. [Google Scholar] [CrossRef]
- Liu, H.; Zhang, X.W.; Tu, L.P. A modified particle swarm optimization using adaptive strategy. Expert Syst. Appl. 2020, 152, 113353. [Google Scholar] [CrossRef]
- Kanchev, H.; Lu, D.; Francois, B.; Lazarov, V. Smart monitoring of a microgrid including gas turbines and a dispatched PV-based active generator for energy management and emissions reduction. In Proceedings of the 2010 IEEE PES Innovative Smart Grid Technologies Conference Europe (ISGT Europe), Gothenburg, Sweden, 11–13 October 2010. [Google Scholar] [CrossRef]
- Roldán-Blay, C.; Escrivá-Escrivá, G.; Roldán-Porta, C.; Dasí-Crespo, D. Optimal sizing and design of renewable power plants in rural microgrids using multi-objective particle swarm optimization and branch and bound methods. Energy 2023, 284, 129318. [Google Scholar] [CrossRef]
- Belboul, Z.; Toual, B.; Kouzou, A.; Mokrani, L.; Bensalem, A.; Kennel, R.; Abdelrahem, M. Multiobjective Optimization of a Hybrid PV/Wind/Battery/Diesel Generator System Integrated in Microgrid: A Case Study in Djelfa, Algeria. Energies 2022, 15, 3579. [Google Scholar] [CrossRef]
- Shan, J.N.; Lu, R.X. Multi-objective economic optimization scheduling of CCHP micro-grid based on improved bee colony algorithm considering the selection of hybrid energy storage system. Energy Rep. 2021, 7, 326–341. [Google Scholar] [CrossRef]
- Ding, X.; Sun, W.; Harrison, G.P.; Lv, X.; Weng, Y. Multi-objective optimization for an integrated renewable, power-to-gas and solid oxide fuel cell/gas turbine hybrid system in microgrid. Energy 2020, 213, 118804. [Google Scholar] [CrossRef]
- Wu, J.; Qi, Z.; Yang, F.; Li, X. The Multi-Objective Optimal Configuration of Wind-PV-Battery Microgrid. In Proceedings of the 2020 Chinese Automation Congress (CAC), Shanghai, China, 6–8 November 2020; pp. 5585–5590. [Google Scholar] [CrossRef]


| Aspect | Renewable Energy Systems (RESs) | Hybrid Energy Systems (HESs) |
|---|---|---|
| Reliability | Weather-dependent, it can be less reliable. | More consistent power supplies reduce reliance on a single source. |
| Economic | Higher initial cost, lower long-term operational costs. | More cost-effective long-term due to optimized resource use. |
| Security | Reduces reliance on imported fuels but is sensitive to environmental changes. | Enhanced security through diversified energy sources. |
| Environment | Minimal emissions, low environmental impact. | Potentially lower impact through optimized energy mix. |
| Maintenance Requirements | Regular maintenance needed, varies by technology. | Potentially more complex maintenance due to multiple systems, but can be optimized for efficiency. |
| Stability | Can be unstable due to reliance on a single energy source. | Generally more stable due to diversified energy sources. |
| Technological Advancement | Dependent on specific technology advancements. | Benefits from advancements in multiple technologies. |
| Geographical Suitability | Depends on local resource availability. | Better adaptability to various geographical conditions. |
| Energy Storage and Distribution | Storage solutions are required for inconsistent supply. | More efficient storage and distribution with steady supply. |
| First Period (2010–2019) | ||||||
|---|---|---|---|---|---|---|
| Ref. | Key System Components | Primary Objective of Optimization | Optimization Technique Used | Key Findings | Algorithm Performance Comments | Publication Year |
| [35] | SPV, WT, DG, BT | Optimization of component sizing for economic efficiency and system reliability in HMGS | MOSaDE | The study utilizes the MOSaDE algorithm to optimize the sizing of components in an HMGS in Yanbu, Saudi Arabia, focusing on cost-effectiveness and reliability. ‘Sizing’ in this context involves determining the optimal capacity and configuration to achieve economic efficiency while maintaining system performance. The analysis demonstrates the algorithm’s effectiveness in adapting to varied operational scenarios and its impact on reducing the cost of energy (COE). It confirms the practicality and adaptability of the optimization approach, emphasizing its real-world applicability across different settings. | The MOSaDE algorithm has proven highly effective in optimizing HMGS in this study, adeptly handling multiple objectives such as cost, reliability, and integration of renewable energy sources (RESs). Its ability to generate a Pareto front of solutions enhances the versatility of design options, offering a spectrum of optimal solutions tailored to varying priorities. Additionally, the algorithm’s flexibility is underscored by its successful application across different system components, demonstrating its adaptability in real-world settings. | 2018 |
| [84] | SPV, CCHP, GSHP, BT | Minimizing LCOE, reducing CO2 emissions, and alleviating disturbances from uncertainties | MOCE | The integrated scheduling approach for MGs addresses uncertainties caused by intermittent RESs and random loads. Load shifting is introduced as an effective demand response program for industrial customers. The MOCE algorithm minimizes costs and emissions under worst-case scenarios of uncertainties, with robust sets and budgets of uncertainty capturing these effectively. The strong duality-based model transformation method addresses coupling and nonlinearity in the system’s formulation. Comparative experiments confirm the approach’s superior performance in attenuating disturbances and achieving optimal economic and environmental benefits, outperforming traditional single-objective robust optimization and deterministic MOO approaches. | The MOCE algorithm is selected for its high accuracy and straightforward approach to addressing the proposed formulation. It conceptualizes the optimization problem as an estimation issue, utilizing importance sampling techniques to accurately estimate parameters of probability density functions. Proven highly effective in MOO, this method not only meets all optimization objectives but also delivers a robust solution to the MG scheduling problem under uncertain conditions. This study particularly highlights the algorithm’s capability to efficiently handle complex scenarios, making it a reliable choice for real-world applications. | 2017 |
| [85] | SPV, WT, BT, DG | Minimizing LCOE, reducing CO2 emissions, and lowering the LPSP | GA | The author utilizes Pareto front solutions to address a MOO problem, focusing on three critical dimensions: investment costs, emission pollution, and power loss. The optimization process employs a GA, adeptly managing both technical and economic constraints. This method is effective in both grid-connected and standalone HMGS operation modes. The study is particularly noted for its ability to balance the intricate interplay of cost, environmental, and efficiency objectives, presenting a comprehensive and balanced approach to MG planning and resource optimization. | The GA is valued for its effectiveness in solving complex optimization problems. It is particularly suitable for tasks such as DER planning, where both technical and economic constraints are involved. The GA excels in finding optimal solutions within multi-dimensional objective spaces, as demonstrated in this study by its application to the MG across various operational modes. | 2016 |
| [60] | WT, SPV, BT, MT, FC | Minimize cost and emissions, with and without responsive loads | MOPSO, Fuzzy-based mechanism, Non-linear sorting system | The study utilized MOPSO, complemented by a fuzzy-based mechanism and a non-linear sorting system, to optimize operations, aiming to reduce operating costs and emissions. Including responsive loads notably decreased power generation by WT and SPV during peak hours. Additionally, the implementation of DR programs led to a 24% reduction in operating costs and a 16% decrease in emissions. | In this study, MOPSO proved highly effective in achieving the dual objectives of cost reduction and emission control, demonstrating significant enhancements in both operational efficiency and environmental impact. | 2015 |
| [81] | WT, SPV, BT, DG | Minimizing LCOE, reducing LPSP, and ensuring a system primarily based on RESs | MOPSO | The study demonstrated that MOPSO effectively optimized the system configuration and component sizing, focusing on reducing LCOE and LPSP. Results highlighted the effective use of wind and solar energy in various regional contexts, showing notable enhancements in energy reliability and cost efficiency. The sensitivity analysis validated the optimization outcomes, suggesting that the implementation of hybrid systems can significantly improve access to reliable and sustainable energy in remote areas. | MOPSO was successful in optimizing the system for cost-effectiveness and reliability, demonstrating its utility in managing complex energy systems with a focus on renewable resources. | 2014 |
| [86] | WT, SPV, MT, FC, CHP, electrical and thermal storage | Minimizing total operational costs and net emissions in a CHP-based MG | MBFO, Interactive Fuzzy Satisfying Method | The study introduced an integrated energy management system (IEMS) for a CHP-based MG, employing MBFO and an interactive fuzzy satisfying method to minimize operational costs and emissions. This system efficiently managed total electrical and thermal load demands, effectively balancing economic and environmental criteria. | According to the study results, MBFO, enhanced by the interactive fuzzy satisfying method, successfully balanced the trade-offs between cost and emissions, thereby enhancing the MG’s performance efficiency. | 2013 |
| [82] | MT, DG, DERs | Optimizing economic scheduling of DERs in a CHP-based MG, focusing on balancing fuel costs and emissions | PSO, DE | The study focused on economically deploying DERs in a CHP-based MG, utilizing PSO for optimal sizing and DE for balancing fuel costs and emissions. It assessed various DER combinations, including MTs and DGs, to efficiently distribute electrical and thermal loads. The findings confirmed the effectiveness of these DER mixes in meeting diverse energy demands while maintaining a cost-effective and environmentally friendly balance. | The findings indicated that the integration of PSO and DE was effective for MOO, successfully balancing fuel costs and emissions while promoting economic and efficient MG operations. | 2012 |
| [63] | SPV, WT, BT, FC, MT | Minimizing total operating costs and net emissions in a renewable MG | AMPSO, CLS, FSA | This study introduced the AMPSO algorithm to optimize the operations of an MG equipped with RESs and a backup system consisting of MT, FC, and BT. The primary goal was to minimize both operating costs and emissions. SPV and WT were included as part of various distributed generation sources. Enhanced with CLS and FSA, the AMPSO was employed to manage the nonlinear MOO challenge, focusing on balancing power mismatches and optimizing energy storage requirements. | Based on the results, integrating AMPSO with CLS and FSA provided an effective solution for MOO, balancing economic and environmental objectives in MG operations based on RES. AMPSO is adaptable and optimizes quickly but can converge prematurely and requires high computational resources. CLS improves solution diversity and cooperation but is complex to coordinate and scale. FSA effectively explores the solution space and avoids local optima but may be slow to converge and is computationally demanding [87,88,89]. | 2011 |
| [90] | GT, SPV | Minimizing emissions (CO2, CO, NOx) from GTs and reducing fuel consumption in an MG | MATLAB function ‘fgoalattain’ for MOO | The study focused on optimizing an MG that includes GTs and an SPV-based active generator. MOO was implemented to minimize emissions from the GTs and to maximize the use of the non-polluting SPV-based active generator. This optimization led to a 9.17% reduction in equivalent CO2 emissions, with the active generator contributing 11% of the total energy to the system. | In this study, the MOO, using the MATLAB function ‘fgoalattain’, effectively balanced environmental goals with energy management, demonstrating efficiency in reducing emissions and fuel consumption while specifically utilizing SPV systems. | 2010 |
| Second Period (2020–2023) | ||||||
| [91] | SPV, WT, Hydroelectric, Biomass | Minimizing total annualized cost of electricity supply and reducing energy imports from the grid | MOPSO | The article introduces a novel optimization technique for MG production in a Spanish town with inconsistent grid connections. Employing the MOPSO technique, the primary aim is to minimize costs and reduce dependence on the grid. The methodology achieves a practical and feasible solution, demonstrating a 20-year internal rate of return of 8.33%. This is accomplished through a combination of SPV, WT, hydropower, biomass, and turbine-based power production. This approach not only enhances the capacity to meet local energy needs independently but also serves as a model for potentially disconnecting from Spain’s national power network. | In this study, the MOPSO algorithm was used to effectively minimize the objective function, achieving a balance between cost and energy imported from the network. The results indicated that higher installed power capacity resulted in reduced energy imports from the network. | 2023 |
| [92] | SPV, WT, DG, BT | LCOE, LPSP, RF | MOSSA | This study proposes an optimization design for a stand-alone MG in Djelfa, Algeria, aimed at serving a remote off-grid community. The system, powered by hybrid sources (SPV, WT, BT, DG), utilizes MOSSA to optimize COE and LPSP. The results demonstrate MOSSA’s superiority over algorithms like MODA, MOGA, and MOALO, achieving better RF, COE, and LPSP. The study highlights the use of RESs and suggests future enhancements with diverse renewable sources and advanced AI algorithms. | The application of MOSSA in optimizing a stand-alone MG underscores its effectiveness in managing complex energy systems. By focusing on RE integration and cost-efficient operations, it showcases the potential of advanced algorithms to enhance future MG designs, seamlessly blending sustainability with practicality. | 2022 |
| [93] | MGT, WT, SPV, Bromide Refrigerator, AC, FC, HESS | Minimizing power generation and environmental treatment costs | (BAS-ABC) Improved ABC | This study introduces an economically optimized MOO model for a CCHP MG, utilizing an enhanced ABC algorithm with the Beetle Antennae Search Algorithm (BAS-ABC). The model strives to minimize both daily power generation dispatching costs and environmental pollutant treatment costs. An analysis of a grid-connected CCHP MG in Shanghai during summer shows that BAS-ABC achieves faster convergence and lower minimum costs compared to traditional ABC. Additionally, it reveals the inherent conflict between minimizing power generation costs and environmental costs, emphasizing the need for a balanced approach to economic efficiency and environmental sustainability. | The integration of the BAS-ABC algorithm into the CCHP MG model marks an advancement over traditional ABC, particularly in terms of convergence speed and cost-efficiency. However, the study also highlights the inherent trade-offs between economic and environmental objectives, emphasizing their importance for sustainable energy management. | 2021 |
| [94] | WT, P2G, SOFC/GT, H2 Storage, Electrolyzer | Minimizing system cost and wind curtailment rate | MOGA | This research integrates a micro-energy system (MES) with wind power, P2G, H2 storage, and a SOFC/GT hybrid. Using a MOO approach with a GA, it focuses on minimizing system costs and wind curtailment rate while managing wind power and load variability. The results demonstrate a low wind curtailment rate of 0.63%, high RE penetration at 90.1%, and an optimized life cycle cost of GBP 2,468,093. The SOFC/GT system operates at maximum electrical efficiency of 67.1%, adhering to safety constraints, and a power management strategy is developed to ensure efficient operation amidst fluctuating demands. | This study demonstrates how MOGA can effectively balance competing goals such as cost-efficiency and RE integration, ensuring an optimized and sustainable MG operation. | 2020 |
| [95] | SPV, WT, BT | Minimizing annual comprehensive cost and grid dependency | MOCS, TOPSIS | This study establishes a MOO function for a grid-connected MG, focusing on minimizing the annual comprehensive cost and grid dependency. It utilizes the k-medoids method to handle uncertainties of RESs and load demand. The MOCS algorithm is employed to solve the model, and the TOPSIS method is used to identify the optimal compromise solution. | The combination of the MOCS algorithm and the TOPSIS method in this study presents a robust approach to MG configuration under uncertain conditions. It underscores the importance of addressing multiple objectives and managing uncertainties in RESs to achieve both economic and grid reliability goals. | 2020 |
Disclaimer/Publisher’s Note: The statements, opinions and data contained in all publications are solely those of the individual author(s) and contributor(s) and not of MDPI and/or the editor(s). MDPI and/or the editor(s) disclaim responsibility for any injury to people or property resulting from any ideas, methods, instructions or products referred to in the content. |
© 2024 by the authors. Licensee MDPI, Basel, Switzerland. This article is an open access article distributed under the terms and conditions of the Creative Commons Attribution (CC BY) license (https://creativecommons.org/licenses/by/4.0/).
Share and Cite
Tahir, K.A.; Ordóñez, J.; Nieto, J. Exploring Evolution and Trends: A Bibliometric Analysis and Scientific Mapping of Multiobjective Optimization Applied to Hybrid Microgrid Systems. Sustainability 2024, 16, 5156. https://doi.org/10.3390/su16125156
Tahir KA, Ordóñez J, Nieto J. Exploring Evolution and Trends: A Bibliometric Analysis and Scientific Mapping of Multiobjective Optimization Applied to Hybrid Microgrid Systems. Sustainability. 2024; 16(12):5156. https://doi.org/10.3390/su16125156
Chicago/Turabian StyleTahir, Kawakib Arar, Javier Ordóñez, and Juanjo Nieto. 2024. "Exploring Evolution and Trends: A Bibliometric Analysis and Scientific Mapping of Multiobjective Optimization Applied to Hybrid Microgrid Systems" Sustainability 16, no. 12: 5156. https://doi.org/10.3390/su16125156
APA StyleTahir, K. A., Ordóñez, J., & Nieto, J. (2024). Exploring Evolution and Trends: A Bibliometric Analysis and Scientific Mapping of Multiobjective Optimization Applied to Hybrid Microgrid Systems. Sustainability, 16(12), 5156. https://doi.org/10.3390/su16125156