Article

Applying GIS in Blue-Green Infrastructure Design in Urban Areas for Better Life Quality and Climate Resilience

by
Szymon Czyża
1 and
Anna Maria Kowalczyk
2,*
1
Department of Geoinformation and Cartography, Institute of Geodesy and Civil Engineering, Faculty of Geoengineering, University of Warmia and Mazury in Olsztyn, 10-719 Olsztyn, Poland
2
Department of Geodesy, Institute of Geodesy and Civil Engineering, Faculty of Geoengineering, University of Warmia and Mazury in Olsztyn, 10-719 Olsztyn, Poland
*
Author to whom correspondence should be addressed.
Sustainability 2024, 16(12), 5187; https://doi.org/10.3390/su16125187
Submission received: 10 April 2024 / Revised: 21 May 2024 / Accepted: 13 June 2024 / Published: 18 June 2024

Abstract

:
The expansion of urban centers and peri-urban zones significantly impacts both the natural world and human well-being, leading to issues such as increased air pollution, the formation of urban heat islands, and challenges in water management. The concept of multifunctional greening serves as a cornerstone, emphasizing the interconnectedness of ecological, social, and health-related factors. This study aimed to identify potential locations for three specific types of blue-green infrastructure (BGI): bioswales, infiltration trenches, and green bus stops. Leveraging geospatial datasets, Geographic Information System (GIS) technology, and remote sensing methodologies, this study conducted a comprehensive analysis and modeling of spatial information. Initial cartographic representations were developed to identify specific locations within Olsztyn, a city in Poland, deemed appropriate for the implementation of the designated blue-green infrastructure (BGI) components. Following this, these models were combined with two additional models created by the researchers: a surface urban heat island (SUHI) model and a demographic model that outlined the age structure of the city’s population. This synergistic approach resulted in the development of a detailed map, which identified potential locations for the implementation of blue-green infrastructure. This was achieved by utilizing vector data acquired with a precision of 1 m. The high level of detail on the map allows for an extremely accurate representation of geographical features and infrastructure layouts, which are essential for precise planning and implementation. This infrastructure is identified as a key strategy for strengthening ecosystem resilience, improving urban livability, and promoting public health and well-being.

1. Introduction

The important and urgent need to cope with climate change, coupled with the evolution of urban and peri-urban landscapes, emphasizes the need to seek solutions focused on mitigating and, in retrospect, counteracting the effects of this situation. Consequently, methods for monitoring the environmental impact of human activities on the urbanization processes taking place are increasingly important [1,2,3,4,5,6,7]. Multifunctional greening is fundamental to providing a wide range of ecosystem goods and services that benefit the urban population. The motivation for undertaking this research was the prevailing opinion in the literature that there are not many methods and approaches to quantify and monitor multifunctional greening at different spatial scales also with GIS usage [8,9,10]. Many of the urban areas that are elements of blue-green infrastructure are undergoing development, thus maintaining a minimal amount of green space, for which the type and area are mainly the result of existing urban planning regulations rather than a necessity arising from minimizing future problems [11,12,13,14,15,16]. Currently, geospatial data are the most meaningful type of data and thus a key element for increasing the scope of information about the state of space. Ongoing research on blue-green infrastructure provides examples of the use of GIS tools in spatial analysis [17,18,19,20].
The integration of blue-green infrastructure in urban areas is proposed as a strategy to lessen the impact of escalating temperatures from climate change on health outcomes [11,21,22,23,24,25,26,27]. Highlighting the wealth of research confirmed the positive effects of BGI; the focus has been directed toward elements seamlessly connecting water and natural features, specifically bioswales, infiltration ditches, and green bus stops [28,29,30].
The BGI encompasses design and spatial solutions rooted in the intrinsic qualities of a specific location, often referred to as nature-based solutions (NBSs) [31]. The elements of BGI are designed to create a cohesive system where services and spatial configurations enhance and support each other reciprocally [18]. In urban environments, BGI serves multiple purposes concurrently. It can store and purify water, enhance the visual appeal of an area [32], absorb carbon dioxide, mitigate air pollution, and counteract the urban heat island effect by regulating the air temperature. Furthermore, these elements provide habitats for urban plants and wildlife, fostering ecological continuity and contributing to environmental education. When properly designed, they mitigate excessive surface runoff and the risk of flooding [33,34,35]. BGI contributes to improving mental health and positively influences the well-being of city dwellers by mitigating the negative impacts of climate change with the provision of cohesive ecosystem services [31,36,37].
The technology under discussion ensures the effective collection, storage, and handling of spatial data, enabling the processing and examination of these data to generate novel, dependable spatial information, namely, details associated with a specific spatial location. Some research in this arena focuses on employing the GIS platform to recognize established blue-green infrastructure (BGI) [38,39] as well as whether there are enough BGI elements to ensure at an appropriate level the quality of life of the population and whether this is in line with current legal regulations [15,40,41,42]. According to the literature, there are several difficulties in measuring quality of life, mainly due to the many interpretations of the concept and the lack of a complete, agreed definition [3,43,44]. This paper assumes that the concept of quality of life is defined by a model that combines objective and subjective indicators, encompasses different domains of life, and integrates both personal autonomy and individual preferences with actual assessments. This approach suggests that a statistical measurement of quality of life should consider the multifaceted nature of the concept. It proposes that such measurements should include both objective conditions of an individual’s life and their subjective experiences or subjective well-being. In conclusion, the term living conditions encompasses a multitude of factors, including material conditions, health, education, economic activity, leisure activities, social relations, personal security, and the quality of the natural environment at the place of living. The multifaceted domains addressed by BGI, as previously mentioned, effectively translate into both objective improvements in living conditions and subjective perceptions of well-being. A holistic approach that takes into account the optimal realization of BGI is in line with the emphasis in the literature on including both tangible and intangible aspects of life in quality of life assessments. Consequently, BGI not only supports the technical functioning of a city but also enriches the lives of its inhabitants by creating healthier, more sustainable, and enjoyable living environments.
The referenced studies demonstrate that Geographic Information System (GIS) tools are crucial for identifying areas in need of further development to ensure sustainability and for effectively selecting components of blue-green infrastructure. Additionally, substantial research focuses on leveraging remote sensing data to analyze land cover change dynamics, especially in scenarios characterized by swift and significant urbanization [45,46,47]. Nevertheless, a unifying theme emerges from these studies—the automation of conducted analyses and the capacity to execute them over expansive geographical areas, objectives that this study also espouses. It is also noteworthy that spatial analyses developed using GIS permit the precise identification of phenomena and processes occurring within the context of dynamic suburban development [48,49,50,51,52,53].
The form of urban spaces, as well as areas under pressure from urbanization processes, have been permanently shaped over the years. Thus, it should be noted that it is much easier to design new elements of blue-green infrastructure in open and nature-rich areas than in an area where everything is already occupied, and such spaces are difficult to find. Given the location of the research area, this study aligns with the scientific article [54] in examining information relevant to BGI from the standpoint of its inception, particularly in zones where recreation and tourism are of central importance. The feasibility of performing analyses and spatial data modeling was validated with a GIS, which also facilitated the evaluation of how practicable it was to implement three selected BGI components. Consequently, a map was produced showcasing potential sites for three specified types of blue-green infrastructure within the urban setting, encompassing bioswales, infiltration trenches, and green bus stops.
This research methodology utilized geospatial data, including remote sensing data supported by GIS technology, to identify and optimize the location selection process for BGI (blue-green infrastructure) components. The results obtained confirm the validity of the use of specific spatial datasets as well as the applied spatial analysis methods in improving the location optimization process for different BGI components.

2. Materials and Methods

2.1. Multifunctional Greening and Blue-Green Infrastructural Components

The implementation analyses of BGI are intended to assist planners and landscape architects in integrating nature-based solutions into urban planning, serving as either an alternative or a complement to traditional infrastructure. These activities, based on the principles of sustainable development, aim to improve the quality of life and protect the environment. It is also essential to conduct research on effective land management, which is crucial for sustainable urban development and the development of rural areas [55,56].
These ecosystems offer critical services, essential for tackling climate change through mitigation and adaptation efforts, notably including [57,58] cooling and insulation; the absorption of CO2; the utilization of low-carbon materials; and the promotion and implementation of sustainable development goals (SDGs) [59]. It also aims at increasing the continuity of natural areas within cities, supporting their ecological role and substantially increasing urban biodiversity [60].
Subsequently, the specific BGI components that are most suitable for the optimal use of urbanized areas are delineated, either independently or in combination. The utilization of BGI elements permits the enhancement of environmental and thermal comfort, whereas the deployment of multiple elements would have a more synergistic impact on the urban environment [4]. The integration of the elements collectively or individually is contingent upon the specific urban environmental objectives, the availability of space, and the specific climatic conditions of the area. The combined use of the BGI elements analyzed ensures the adequate irrigation of the vegetation and, simultaneously, reduces excessive evaporation through appropriate shading [61]. Concurrently, each of these elements contributes to the improvement in water quality through filtration, which has a positive impact on soil quality. Furthermore, the absorption of water directly into the ground serves to reduce the load on urban drainage systems, preventing the flooding of urban areas. At the same time, the introduction of appropriate vegetation and a shading function significantly enhances urban aesthetics, making it more welcoming and attractive for residents.
Table 1 presents the concept and configuration, highlighting the spatial attributes favorable to their installation and offering insights into the proposed locations for the various BGI components [57,62,63,64,65,66]. Concurrently, this study aims to collate a set of spatial features (geodata), which represents a fundamental preliminary step for subsequent analyses to identify optimal locations for these components [57].
In the context of this study, the researchers examined the spatial attributes identified in the referenced literature as key to identifying optimal locations for BGI elements [57,62,64,65,66,67]. The analysis conducted unveiled that, with regard to specific features, publicly accessible spatial datasets exhibited variations in accessibility and quality. This allowed for the identification of parameters from the aforementioned table that could contribute to establishing a composite indicator for determining the optimal locations of individual BGI components. It is notable that, in the analysis, the decision was taken to primarily rely on publicly available registries that are distinguished by high quality, timeliness, and standardization. Consequently, the chosen attributes used in the spatial analyses enabled the precise identification of locations and, more critically, ensured that these analyses could be replicated in future years.

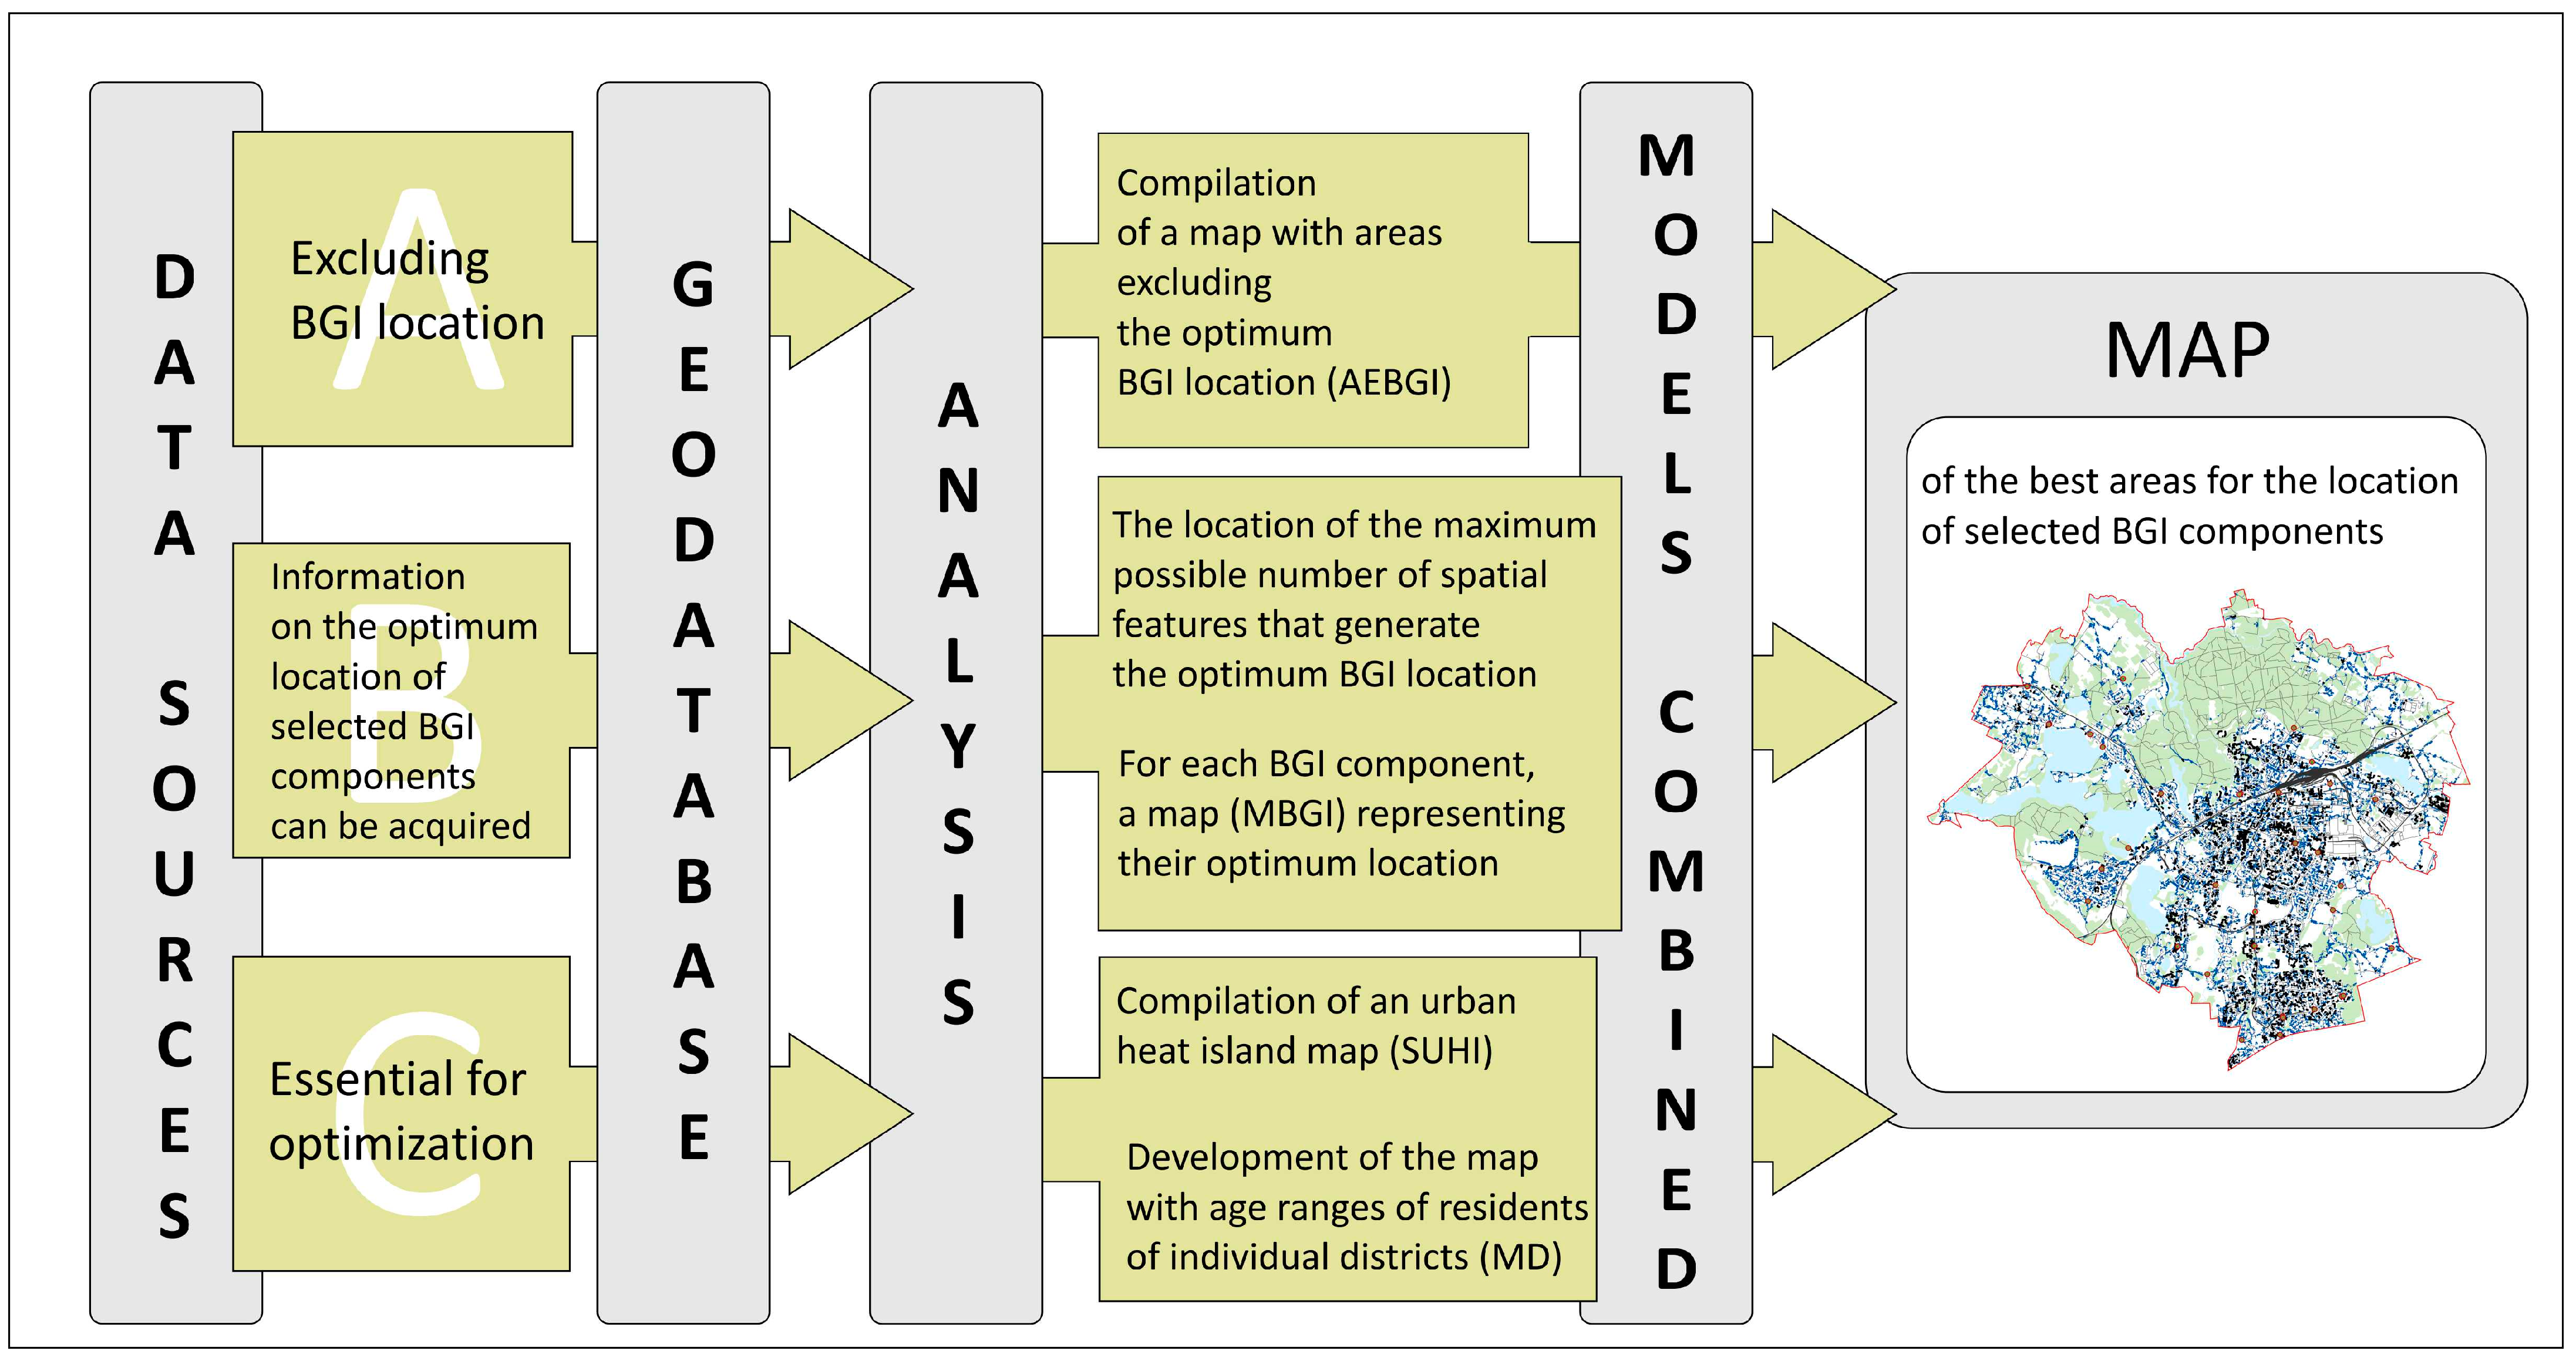
2.2. Geodata Analysis for Optimum BGI Locations

This study focuses on the city of Olsztyn, covering an area of 88.3 km2. Forests constitute 21.3% of this area, with the City Forest alone comprising 18 km2. The majority of the 5.6 km2 of urban green spaces in Olsztyn are parks and cemeteries. The city also boasts eleven lakes and five smaller water bodies, predominantly located in the western part. Four rivers, the Łyna, Wadąg, Kortówka, and Skanda, flow through the city. With a population exceeding 172,000, Olsztyn provides each resident with an average of 139 m2 of urban forest, 3.5 m2 of parkland, and 43.5 m2 of water within the city limits. Despite abundant natural resources, the increasing prevalence of residential and service-oriented development poses a threat to green spaces, often leading to their usurpation or degradation. This trend is confirmed by the heat island map and analysis conducted for this study. The necessity to identify optimal sites for blue-green infrastructure (BGI) deployment is highlighted, aiming to enhance urban sustainability. The developed method assists in selecting sites with favorable spatial characteristics for BGI, ensuring their viability and effective integration. The optimal BGI location map is instrumental in the decision-making process, revealing potential sites that traditional methods might overlook.
The geoinformatic analysis was performed to develop a cartographic model of the optimal location of BGI following the scheme presented in Figure 1.
The spatial data were categorized into three sets (Figure 1):
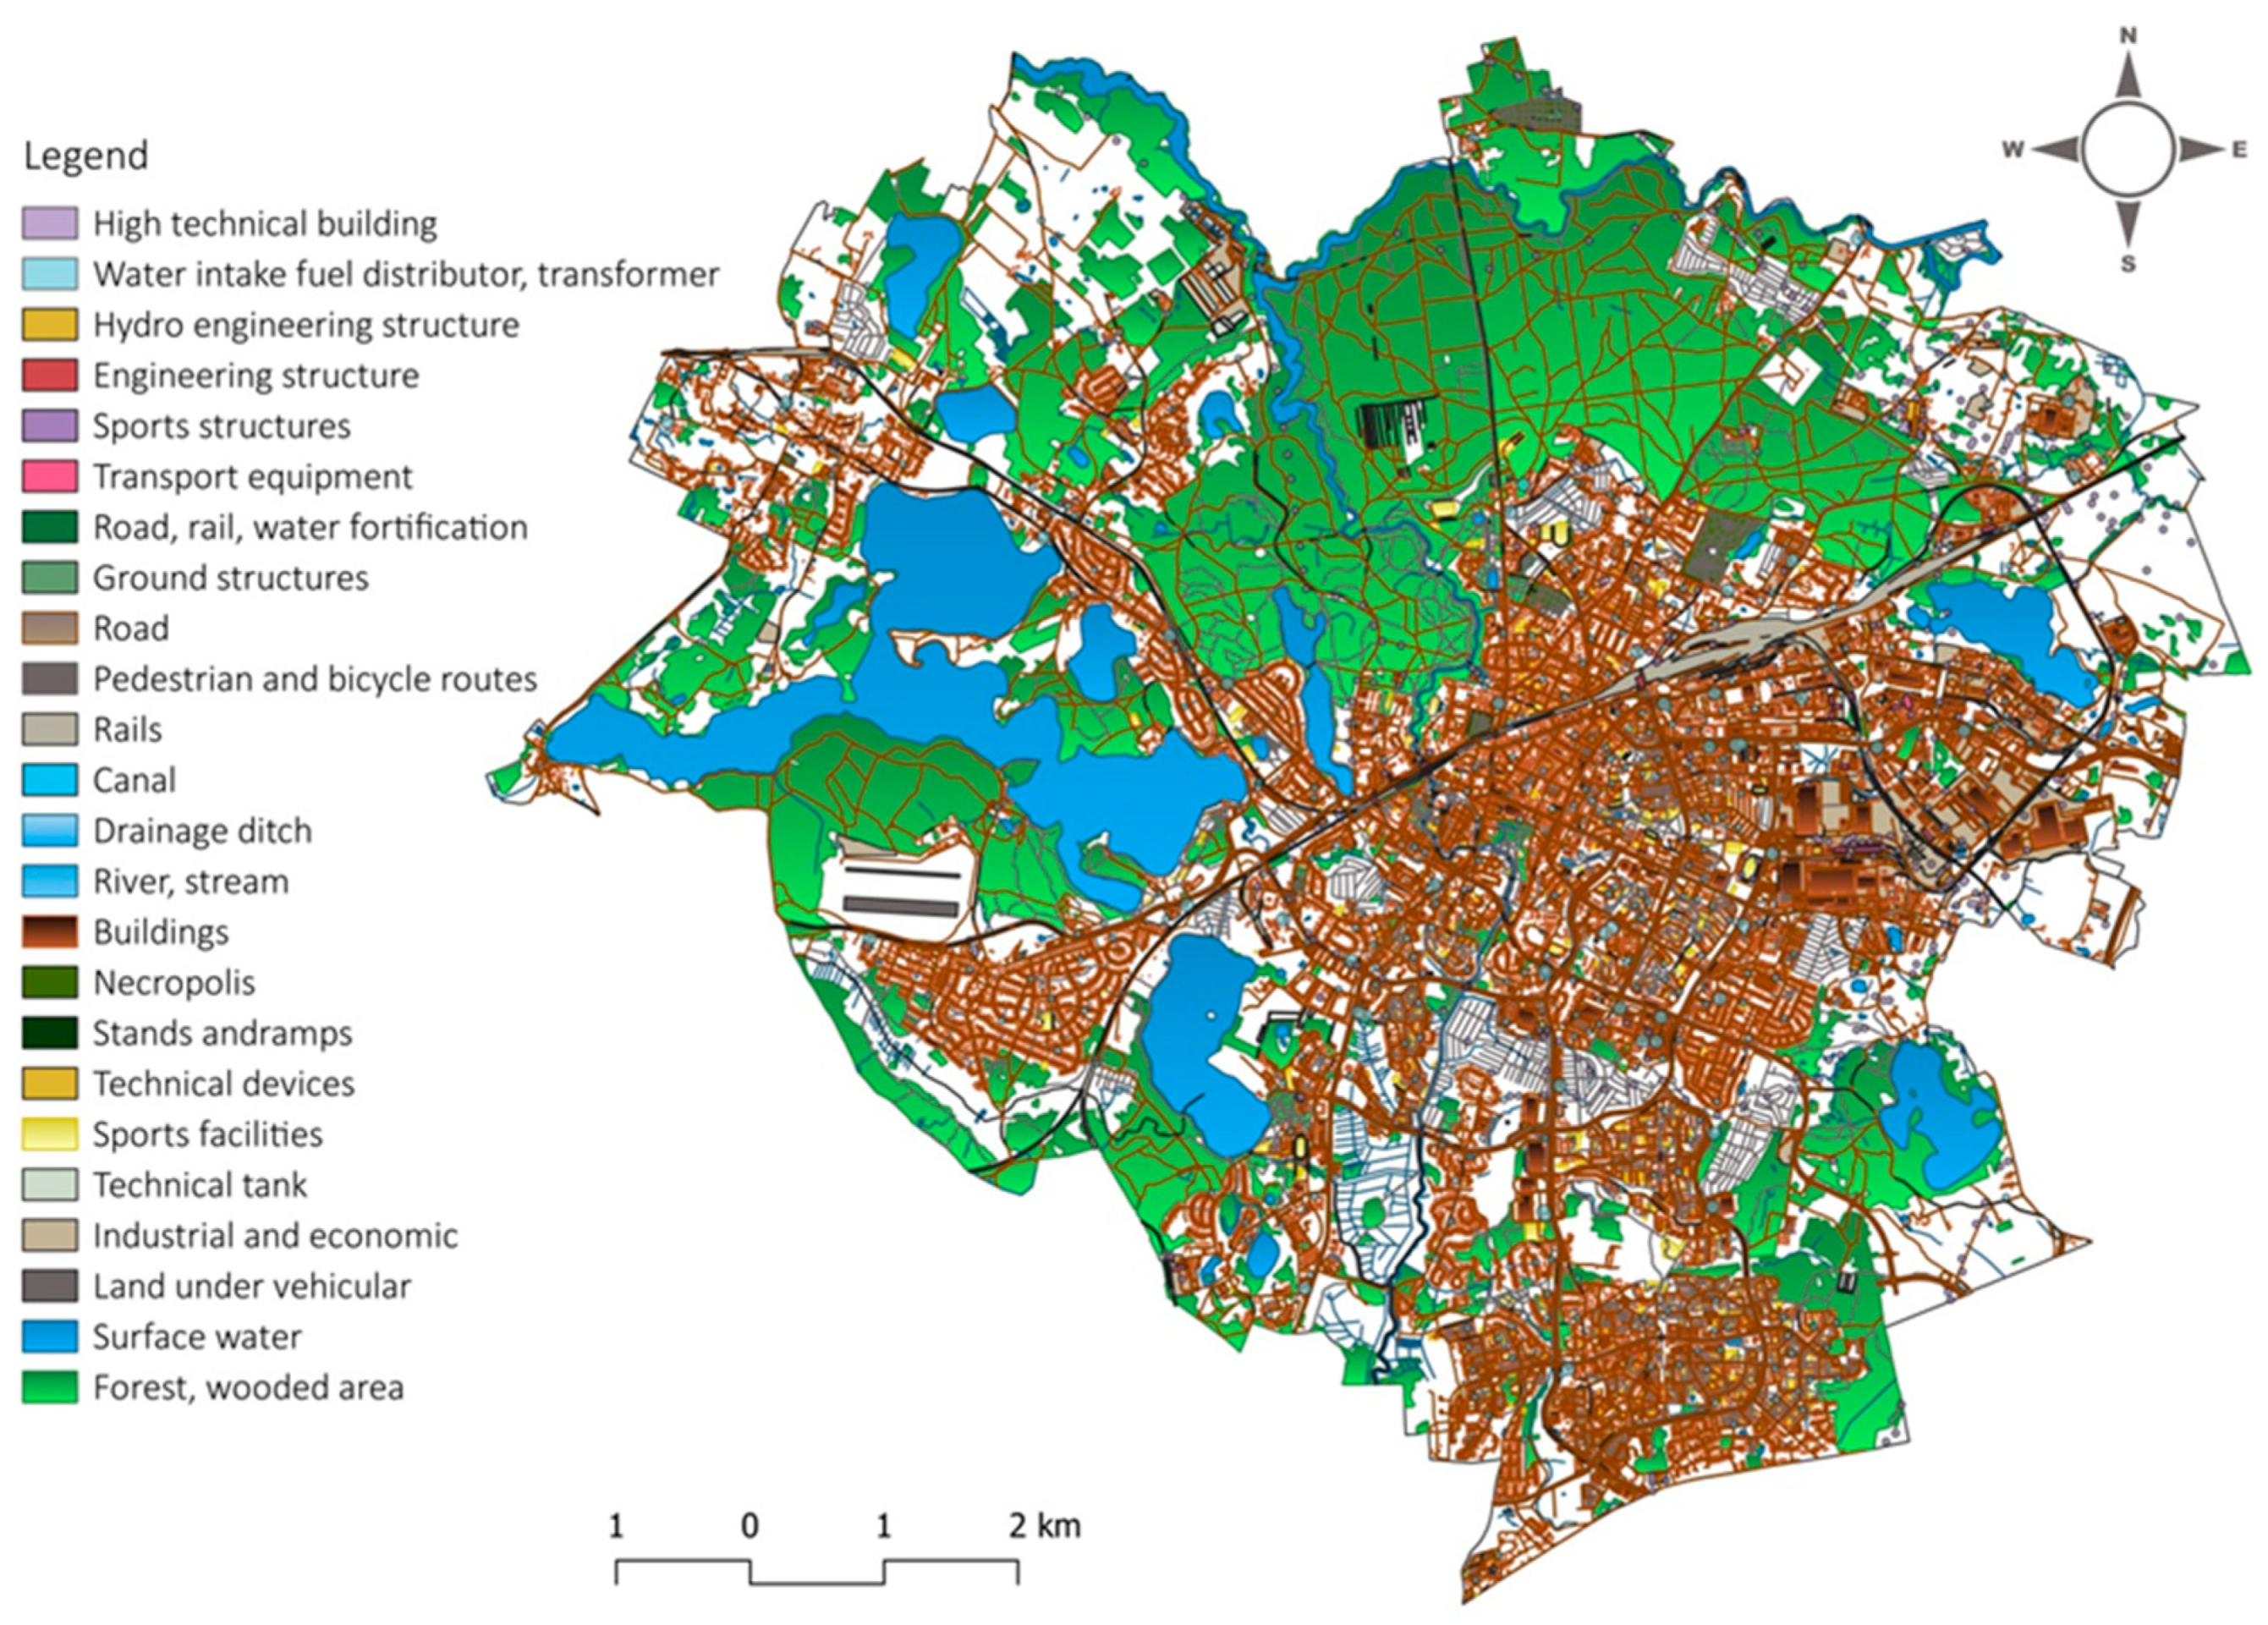
  • Group A—refers to forms of land use that preclude the optimal location of the BGI elements analyzed. Surface waters, buildings, roads, communication zones, railways, cemeteries, sports facilities, and forests were included in this category (Figure 2). The BDOT10k database, which provides the required accuracy and timeliness of data, was used to identify these areas [68].
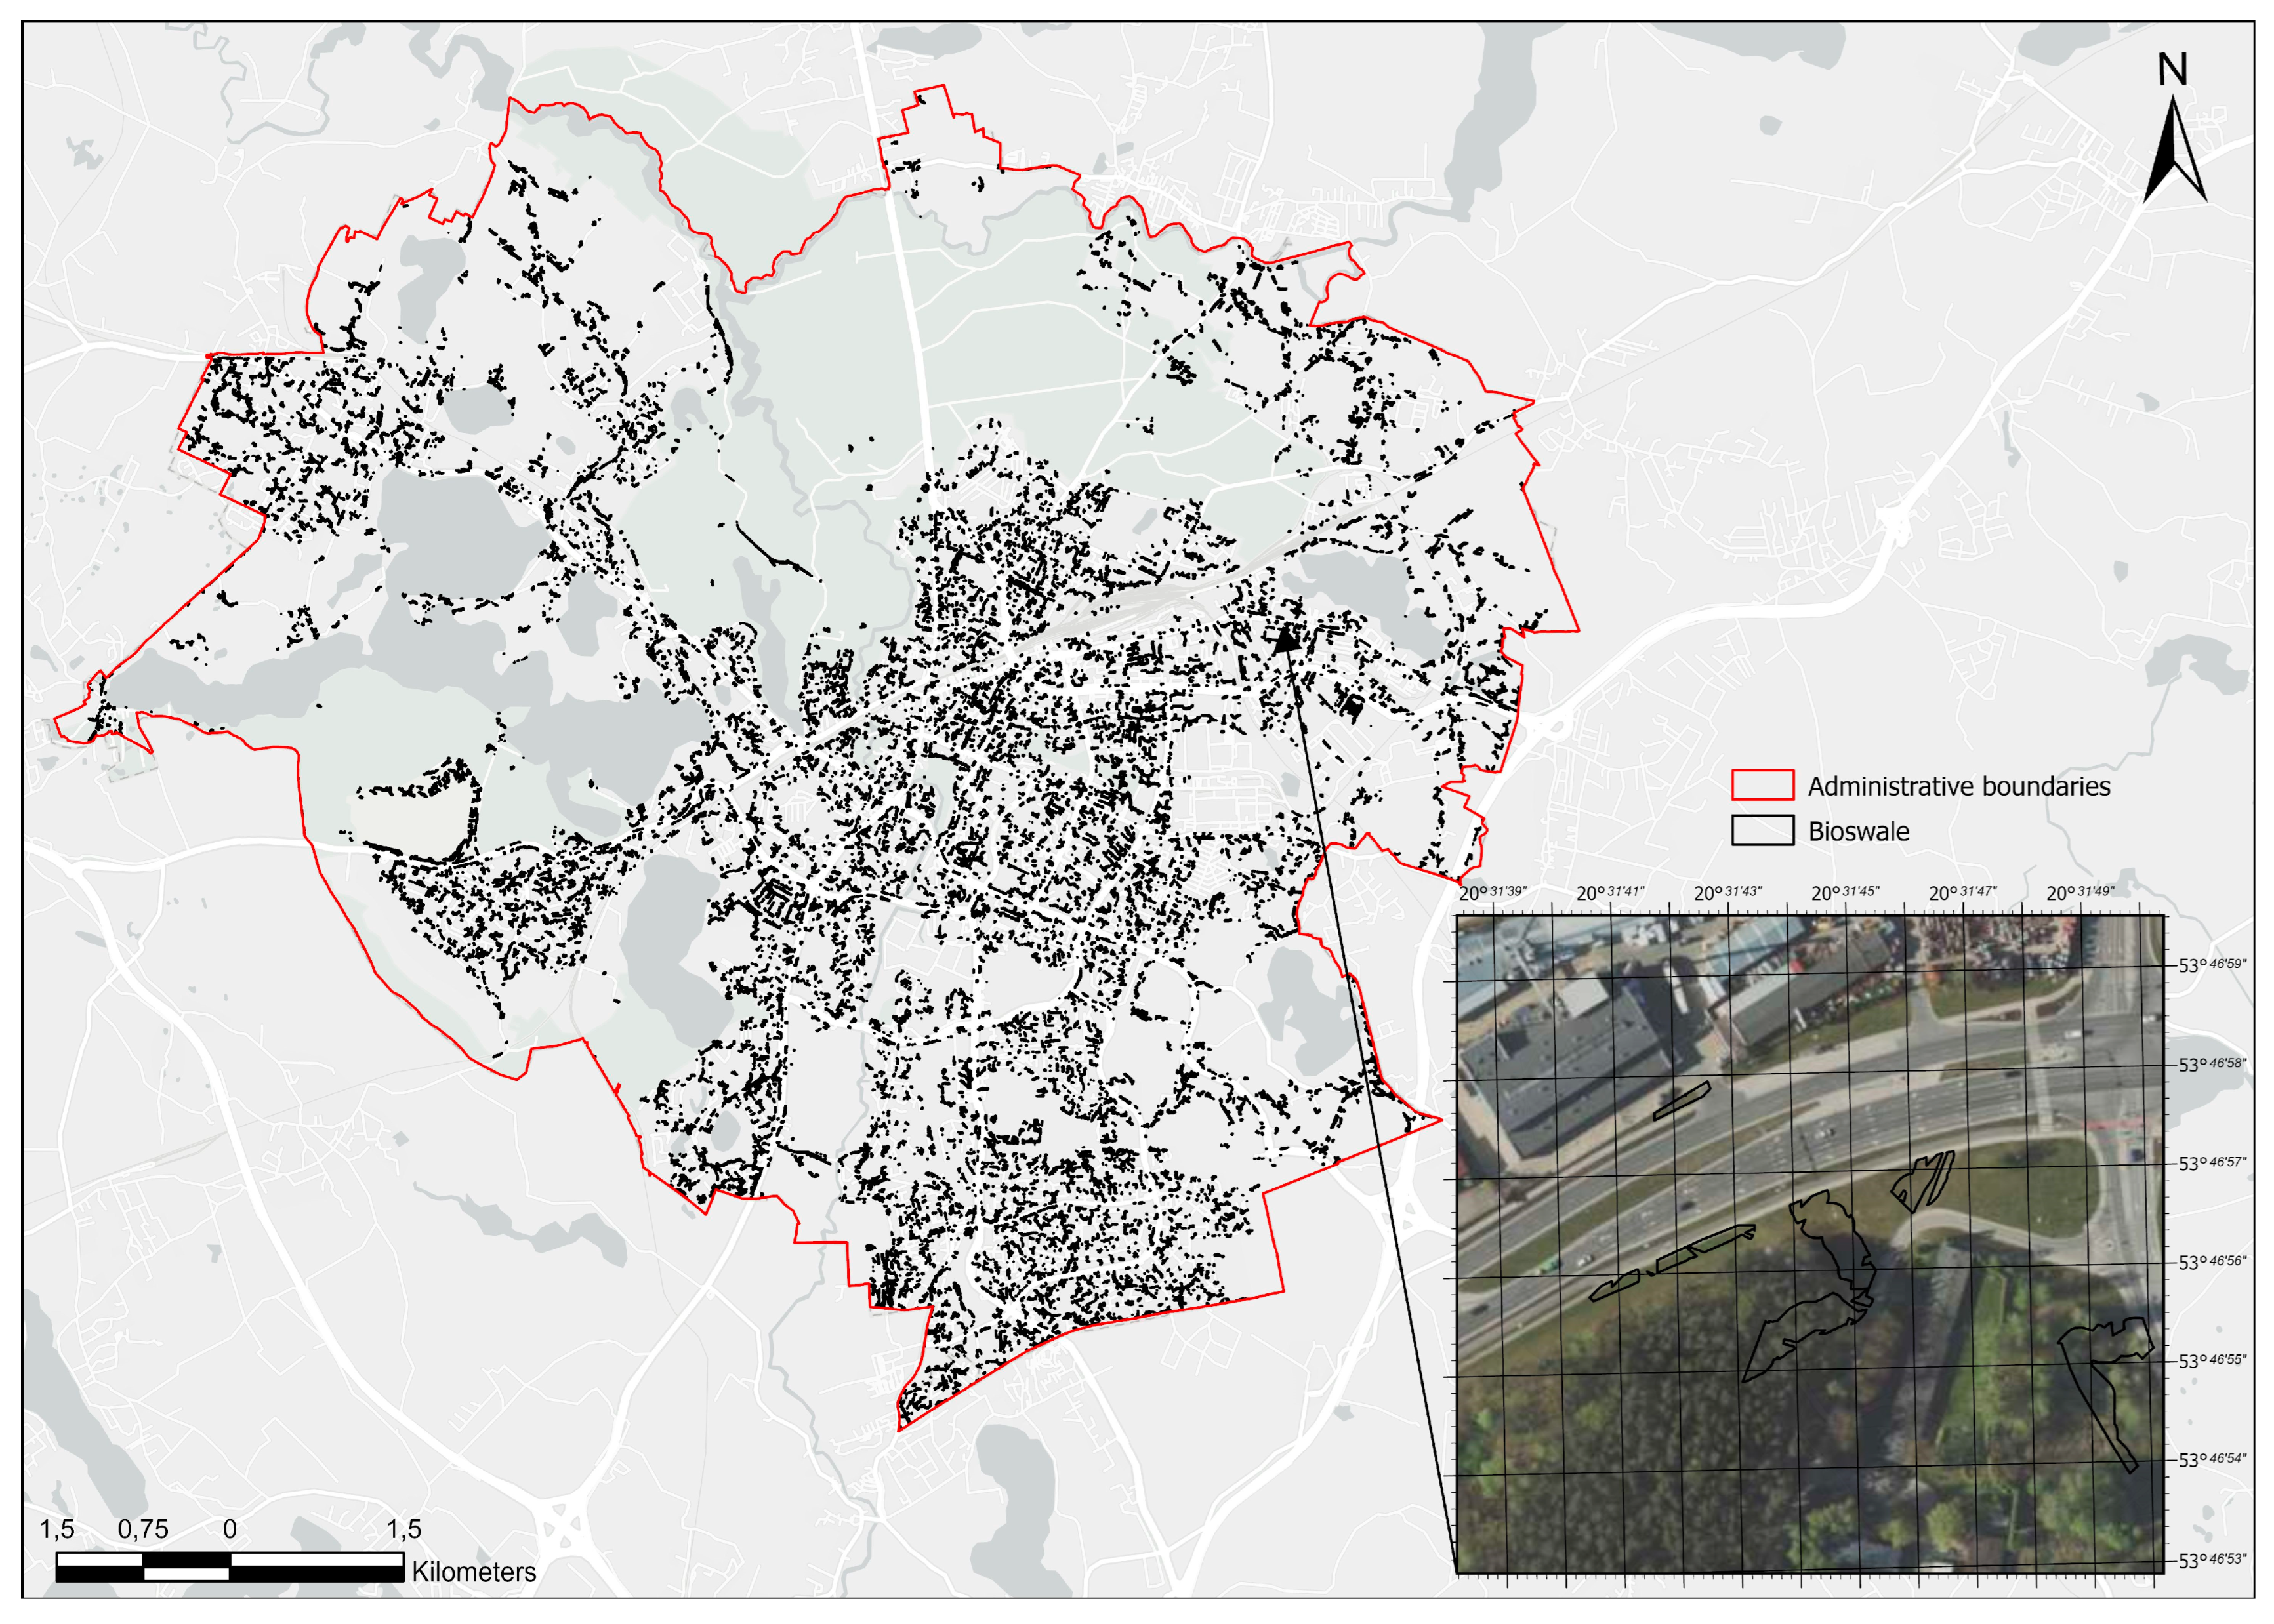
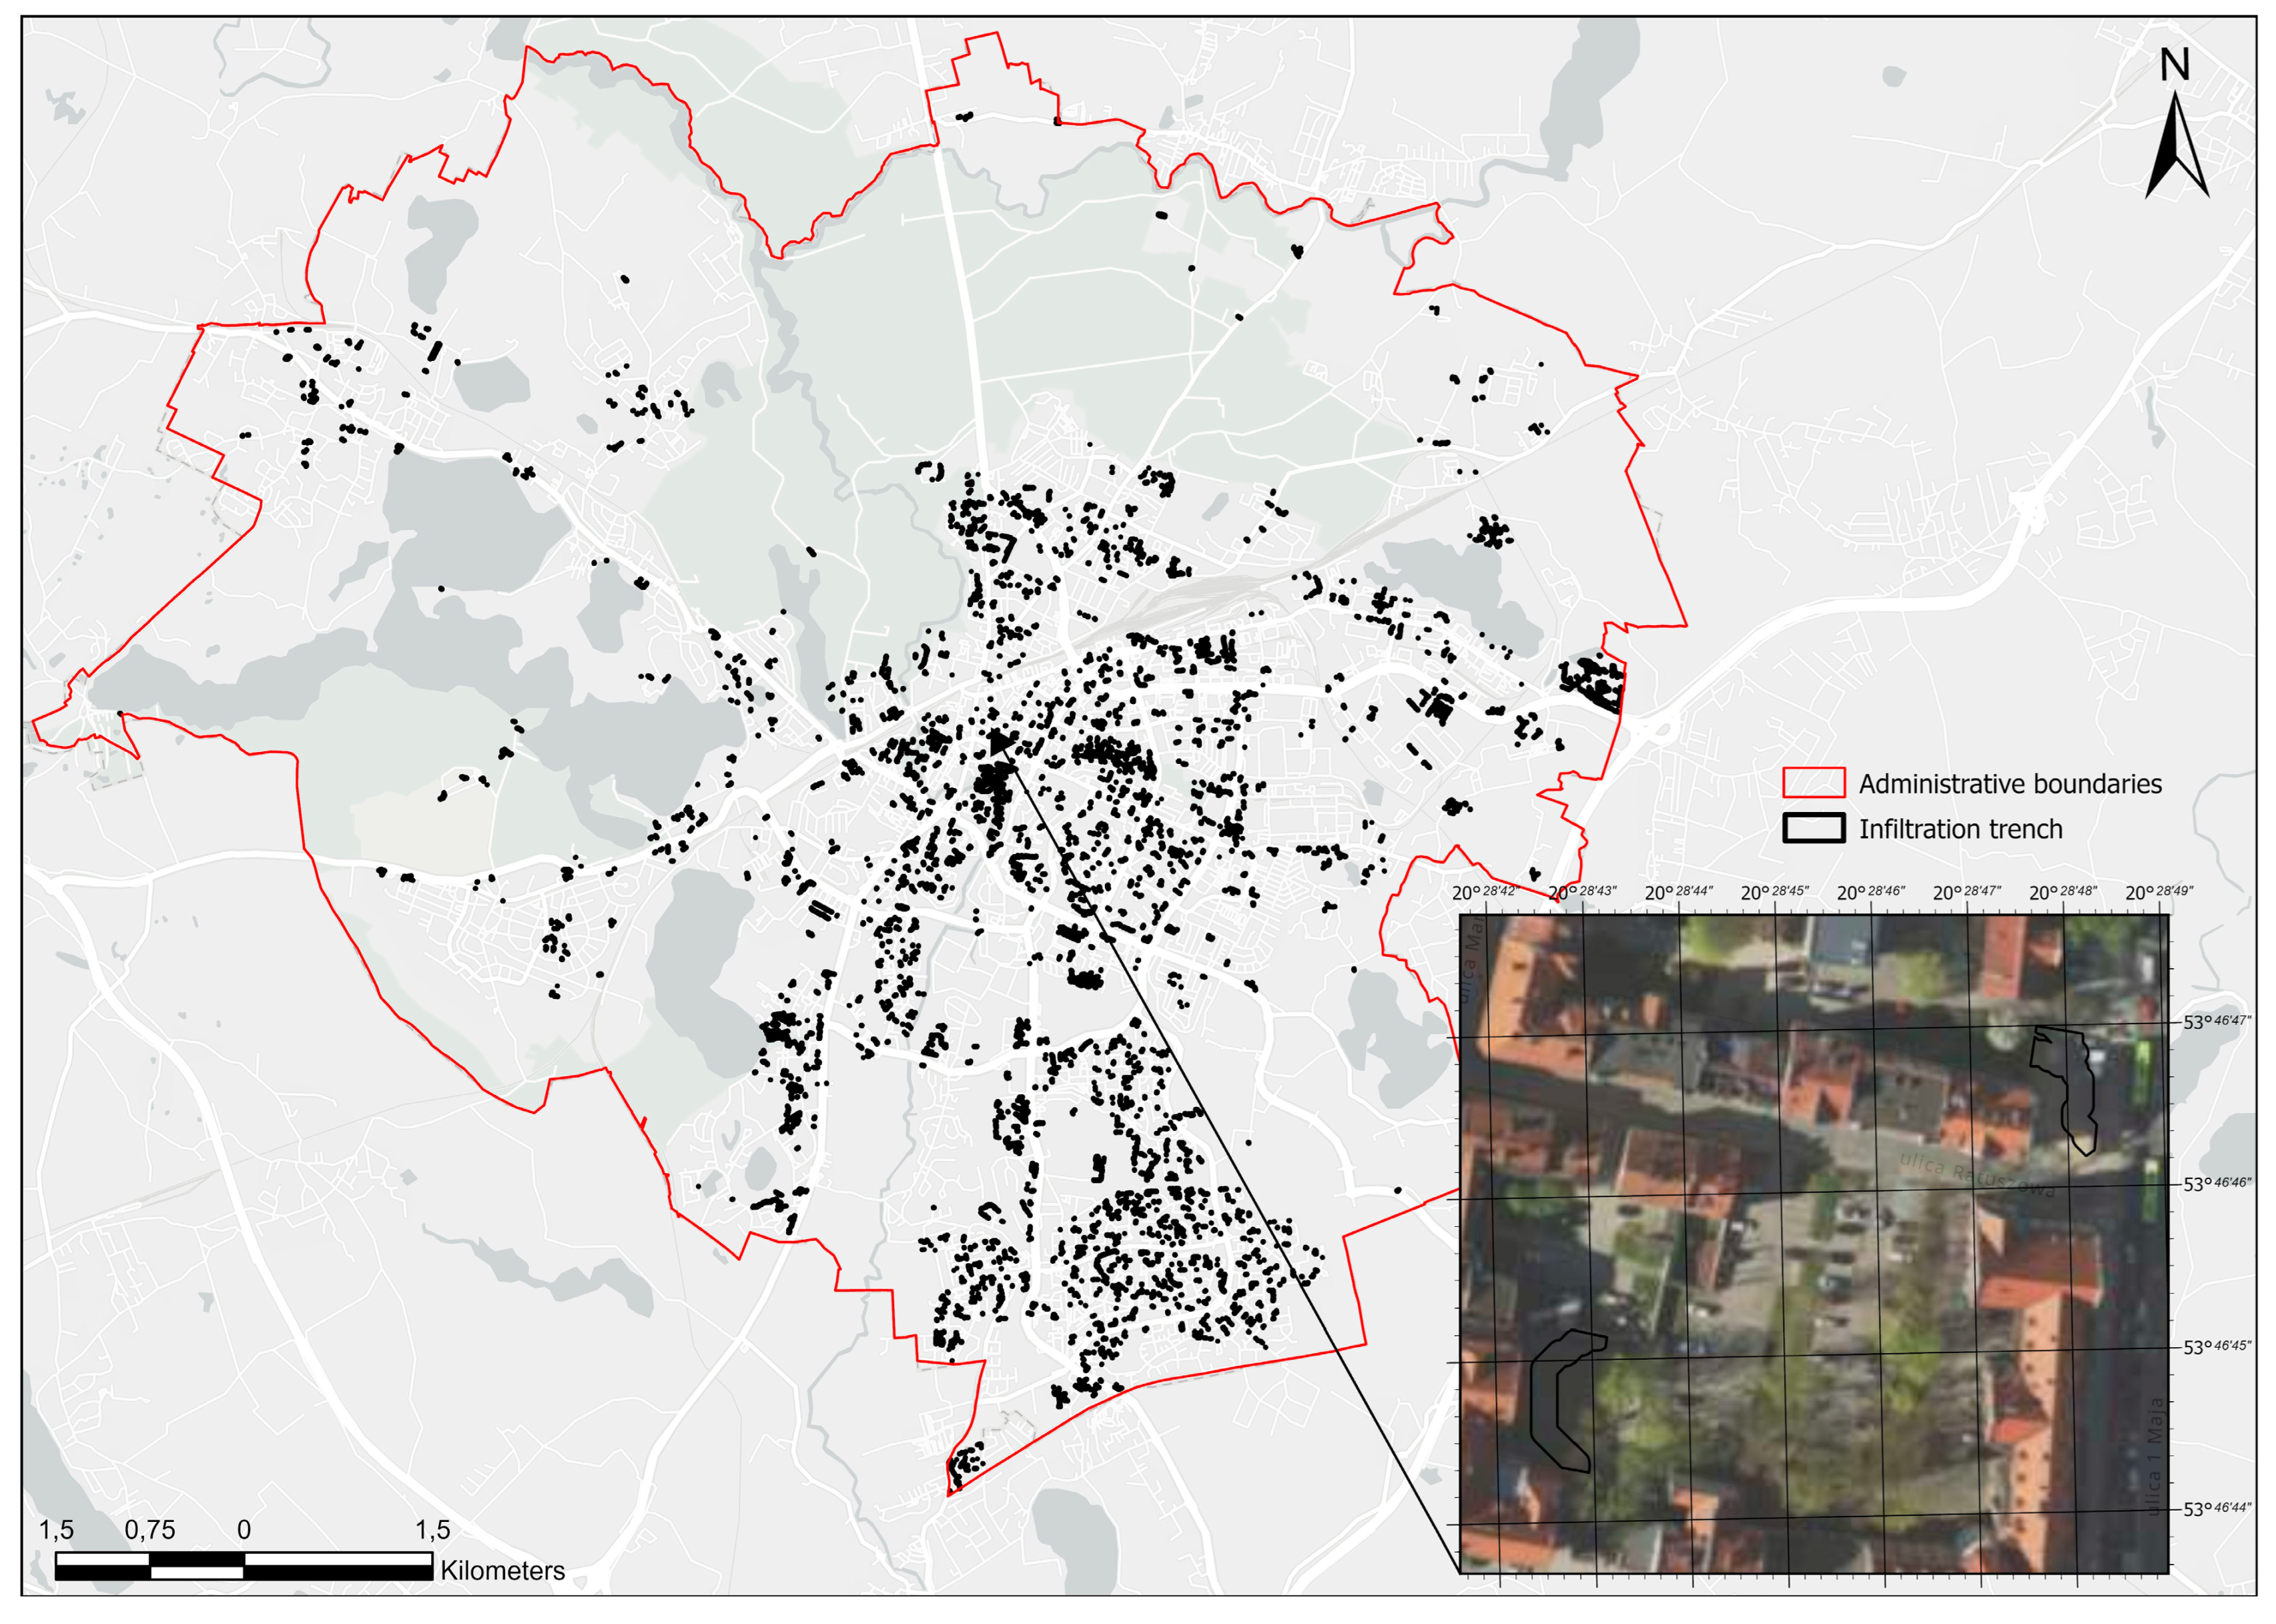
  • Group B—relates to elements that determine the optimal placement of the analyzed types of BGI. The geospatial features listed in Table 1 and the datasets that allow for their identification that are conducive to the occurrence of bioswales, infiltration trenches, and green bus stops are mentioned later in this paper.
  • Group C—spatial datasets that allow for the identification of urban heat islands (SUHIs) on the analyzed urban area and the analysis of the distribution of residents’ places of residence, taking into account their age (DM—Demography Model).
Utilizing a geoinformation application enhances the precision of analyzing the phenomena and processes taking place in space. To ensure the integrity of the data, it was decided to use spatial datasets maintained by the National Land Surveying and Cartographic Resource. The data and their sources used in the analyses are listed below:
  • Hydrological corrections from SCALGO LIVE [69] (date acquired: 10 March 2023);
  • Digital Terrain Model (DTM) from GUGiK [68]—the Head Office of Geodesy and Cartography (date acquired: 10 March 2023);
  • Topographic Reference Database (BDOT10k) surface water from GUGiK [68]—the Head Office of Geodesy and Cartography (date acquired: 15 October 2020);
  • Topographic Reference Database (BDOT10k) from GUGiK [68]—the Head Office of Geodesy and Cartography (date acquired: 10 March 2023);
  • OpenStreetMap (OSM) (date acquired: 10 March 2023).
The BDOT10k and DTM datasets were used for this analysis. The BDOT10k database, a vector-based repository, contains details of the location and characteristics of topographic features, facilitating the production of 1:10,000 scale maps. The DTM dataset, on the other hand, is a point model of terrain elevation created using aerial laser scanning (ALS). This research used a grid model with a 1 m × 1 m mesh in the PL-KRON86-NH height reference frame to represent the terrain elevation. These datasets were chosen for their clarity, ease of acquisition, and completeness in relation to the area analyzed. Concurrently, this study proposed the utilization of the vector data from OpenStreetMap as a supplement to the topographic data, which may be more up to date in certain urban areas. However, it should be emphasized that currently the BDOT10k dataset is the main source of complete and high-quality data at a national level.10 mar.
The use of these different datasets and their analysis with specialized tools allowed for the identification of methods to determine the optimal locations for the analyzed BGI elements, taking into account the specificities presented in Table 1.

2.3. MBGI for Bioswale, Infiltration Trench, and Green Bus Stops

The first BGI element subjected to a geoinformatic analysis was the bioswale. In examining this BGI component, the spatial analysis considered factors such as the areas with slopes of less than 5%, flood-prone areas, the minimum and maximum catchment sizes, and the maximum planned width of the bioswale. In addition, using the favorable characteristics analyzed, the best locations for the bioswale were identified near roads, footpaths, cycle paths, car parks, and public areas. These elements were identified as spatial characteristics that would support the integration of the specified BGI component.
The analyzed facilities required analyses of the downslopes to be first carried out. In accordance with the adopted assumptions concerning BGI (Table 1), areas with slopes of less than 5% were sought. Next, the BDOT10k dataset was used to remove surface water and woodland areas, as well as building and road areas, from areas considered to have the required slope. At the same time, buffer zones of 30 m for bicycle paths and existing roads were established, which would enable the indication of areas with slopes of up to 5% that should be considered in the analysis as the preferred areas for bioswales. The next step assumed, based on the SCALGO and DTM application algorithms, the development of runoffs in vector form for the area under analysis. It was then assumed that the BGI component, i.e., the bioswale, should be established to maximize its function on the existing runoff lines. At the same time, the maximum width of the trench was adopted to be 5 m in accordance with the above findings (Table 1). This was followed by the identification of common areas (intersect) for specific trenches with a width of 5 m and the areas located in the vicinity of roads and paths as well as squares and car parks. In consideration of the fact that bioswales are also designed to impede surface runoff, the analysis included areas that had been flooded with a minimum of 10 mm of rainfall. The analysis, extended to include the possibility of considering the function of minimizing the risk of flooding in the city area, allowed for the location for the BGI component concerned to be made more specific. Finally, based on the analysis concerned, an MBGI cartographic model for bioswales was developed, which helped identify 1615 optimum locations (Figure 3).
Another component of blue-green infrastructure that was analyzed in this study was the infiltration trench. Due to the similar nature, it was adopted that the spatial analysis conducted could also be applied to determine the optimum location of rain gardens in a container (bioretention planter). The evaluation of the spatial characteristics of this BGI component took into account factors such as the largest catchment areas, the planned maximum width of the component, and the local drainage systems. At the same time, the favorable characteristics identified in the analysis were used to identify prime locations in the vicinity of playgrounds, sports complexes, recreational areas or open communal spaces, and parking facilities. These elements were recognized as spatial attributes that facilitate the integration of the chosen BGI component.
The first step assumed the determination of a drainage basin with a maximum overall area of 5 ha within the area of the city under analysis. As regards the infiltration trench, as was performed for the bioswale, the basic analysis was to determine the runoff lines over the entire area under analysis. Next, the drainage lines that passed through areas covered by surface water and forest, as well as areas where buildings and roads were located, were removed from further analysis using the BDOT10k data. At the same time, the maximum width of the infiltration trench was adopted to be 2.5 m in accordance with the adopted findings (Table 1). This was followed by the indication of common areas (intersect) for trenches with a preset width and recreational and sports areas, squares, and car parks, which were extracted from the BDOT10k database. As a result of the analyses, 62 locations for the BGI components, i.e., infiltration trenches, were identified and then juxtaposed with the layer representing a drainage basin with a maximum area of 5 ha. Finally, 39 optimum locations were selected (Figure 4), which enabled the generation of an MBGI cartographic model of the locations of infiltration trenches in the Olsztyn city area.
The last blue-green infrastructure component analyzed in this study was the green bus stops. In examining the spatial aspects of this BGI feature, considerations included the location of public transport stops, the maximum size of catchment areas, and the flood risk zones within the area. These considerations were identified as spatial attributes favorable to the deployment of the selected BGI feature.
In order to inventory bus stops in the city area, the BDOT10k and OSM databases were used. However, due to the lack of data or incorrect location of facilities, there was a need for verification and updating, which was carried out using an up-to-date orthophotomap. The above-mentioned measures resulted in the establishment of a database containing information on the location of 369 bus stops. According to the adopted assumptions (Table 1), in relation to the bus stops, the area under analysis covered a maximum area of 60 m2. The data compiled in the SCALGO application, representing areas that are subject to flooding following significant daily rainfall of at least 10 mm, were then used. When implementing the additional function of the green bus (Table 1), which concerns the reduction in the risk of local floods and overloading of the storm drainage system, the bus stops, whose drainage basins overlapped spatially with flooded areas, were selected. The analysis resulted in the selection of 39 bus stops, which represented a cartographic model (MBGI) of the optimum locations of green bus stops (Figure 5).

2.4. Compilations of Surface Urban Heat Island (SUHI) Model and Demography Model (DM) Applied to the Study Area

Urban heat islands were identified by measuring the land surface temperature (LST) using data from the Landsat 8 mission. Following the recommendations of the United States Geological Survey (USGS), thermal infrared sensor (TIRS) data were used with a spatial resolution of 30 m for channel 10 [70].
The chosen methodology, necessary for accurate measurements, included atmospheric correction and consideration of different emissivity according to the nature of the surface. The single-channel algorithm method [71] was used, which includes atmospheric functions, atmospheric correction, and a threshold method for the normalized vegetation index difference. This method actively incorporates emissivity thresholds using the NDVI in the measurement process [72]. Given its proven effectiveness in numerous studies, especially on Landsat-8 OLI/TIRS mission data, the methodology described in this study was considered suitable [71,73,74,75,76]. It is worth noting that, of the currently developed methods, the one by Sobrino et al. [77] stands out for having the most accurate results.
In view of the accuracy and trueness of the analyses performed, historical meteorological data and the maximum cloud cover of 12% were taken into account in the basic conditions for the selection of the available data. The analysis covered the summer periods from the beginning of June to the end of August from the years 2021–2022. Based on the indicators analyzed as part of the procedure for calculating the actual temperature of the area under study, the datasets developed for five days, i.e., 17 June 2021, 12 July 2021, 13 August 2021, 12 June 2022, 28 June 2022, and 14 July 2022, were analyzed (USGS, no date). The next step compared the maximum temperature of a particular day based on archival data [78].
Based on the satellite observations over the examined area, the highest temperature noted at 10:00 was chosen for comparison. Historical meteorological records revealed that the peak temperature, reaching 30.9 °C, occurred on 28 June 2022 [78,79]. This resulted in the data collected on that particular day being selected for detailed analysis (Figure 6).
In order to analyze the age structure within the study area, demographic tables from the Department of the Olsztyn City Council were used. These data were compared with the boundaries of the residential areas after they had been collected and collated. This approach made it possible to segment the population into defined age groups, 0–10, 11–65, and over 65, across different residential areas. The results of this segmentation are shown in Figure 7, which highlights the regions with a higher concentration of people aged 65 and over who are more susceptible to the adverse effects of elevated temperatures, particularly in the summer months.

3. Results

In the context of the factors considered when determining the optimal locations of the specific BGI elements, the researchers emphasized the possibility of utilizing diverse data sources, including digital terrain models (DTMs), a topographic database (BDOT10k), and hydrological data. The utilization of the digital terrain model allowed for obtaining information about the terrain’s morphology, which is crucial for analyzing terrain slopes, groundwater levels, and surface water runoff directions. On the other hand, the BDOT10k topographic database enabled the identification of both preferred areas, such as parks, areas along roads, and parking lots, suitable for BGI components, as well as unsuitable areas, encompassing forests and areas occupied by existing buildings or infrastructure. The last analyzed aspect was related to the hydrological data and analyses, which resulted in the creation of watershed and surface runoff maps. Determining the flow directions of water and identifying areas prone to flooding supported the selection of the BGI component locations and contributed to flood risk reduction and the mitigation of the negative impact of extreme rainfall events.
In the following step of this investigation, comparisons were made between the MBGI cartographic models, depicting the best locations for the blue-green infrastructure components, and the findings from both the surface urban heat island (SUHI) analysis and the demographic model (DM), as presented in Figure 8.
The integration of the different mapping models involved aligns the individual datasets containing information on optimal BGI locations with the temperature data, the age structure of the population, and the geospatial factors that preclude the location of the individual BGI elements. By extending the focus to health challenges, the aim of this phase was to propose targeted solutions in specific zones of the urban study area. As a result, the MBGI mapping models developed became a valuable tool for visualizing, analyzing, and selecting the optimal locations for the BGI components. The aim was to maximize their positive impact on temperature reduction, which translates into more favorable living conditions in the city. It is important to note that the impact of BGI on urban microclimates may vary depending on the specific implementation and environmental context [80]. Variability due to geographical and climatic factors should inform the design and implementation of BGI elements, taking into account local conditions. Climatic differences, such as the increased cooling and humidification effects of water bodies in hot and dry climates compared to temperate regions, are important to consider. Similarly, vertical greening may be more effective in urban areas with high solar exposure. The structure and layout of a city also have a significant impact on the effectiveness of BGI. In densely built cities, small enclaves of green infrastructure can provide the necessary relief from heat, while in more dispersed cities, larger and more continuous green spaces may be needed to achieve similar effects. The cultural and social context also plays a role in influencing the use and maintenance of BGI. The utilization of public green spaces exhibits considerable variation between continents, contingent upon the extent of public involvement and municipal support. Economic factors, such as the financial resources available to implement and maintain BGI, also influence its quality, scope, and effectiveness. Cities with greater financial resources are able to implement more comprehensive and technologically advanced BGI systems. Consequently, city planners and city managers should adapt BGI strategies to specific local conditions. It is of the utmost importance to conduct comprehensive climate surveys prior to the implementation of BGI, to analyze community engagement, and to continuously monitor and adjust BGI projects based on their performance and community feedback in order to identify key conditions and optimize projects. Minimizing the negative effects of high temperatures is directly linked to reducing the risk of escalating hazards such as hyperthermia, dehydration, increased chronic diseases, social isolation, and sleep disturbances in vulnerable people, particularly the elderly [81,82,83,84].
Thus, the conducted analyses and developed cartographic models can significantly contribute to health prevention strategies and risk management related to extreme temperatures among the elderly population residing in urban areas. The process of developing MBGI cartographic models represented a pivotal stage in the research, aiming to integrate diverse data and thereby incorporate various factors for identifying optimal locations for BGI components. These developed cartographic models hold practical significance, particularly for urban planning and making informed decisions regarding sustainable city development and improving residents’ quality of life. According to the outcomes of this research, proactive measures could be utilized to protect residents during extreme climate change impacts in crisis management, as well as by enhancing air quality, reducing heat islands, and providing suitable recreational spaces that positively impact residents’ health. Furthermore, with regard to increasing biodiversity, the analyses pertaining to blue-green infrastructure locations could facilitate the creation of new habitats for various animal and plant species, the preservation of ecological corridors, improvement in water quality, reduction in spatial fragmentation, and the protection of endangered species.
Considering such a multitude of aspects in pinpointing optimal BGI locations allows for the optimal allocation of financial resources and the pursuit of a sustainable urban policy concerning infrastructure and the environment. Moreover, the adaptability and applicability of the models in various contexts and urban areas underscore the universality and practical value of the conducted research.

4. Discussion

It was stressed that data quality is of paramount significance within the analysis and that data quality is a crucial determinant in this study. Lessons learned from the BDOT10k data revealed prevalent challenges related to data completeness and timeliness within the dataset under review. Despite updating the topographic database every two years, the dynamic nature of spatial development meant that not all components were adequately represented in the dataset. The resolution of issues pertaining to the completeness and timeliness of the topographic database data necessitates a multifaceted approach. Due to financial constraints that preclude more frequent updates of the BDOT10k database, it is prudent to consider the integration of supplementary data sources, particularly those of open access, such as OpenStreetMap. Furthermore, a more intensive utilization of satellite data and remote sensing, in conjunction with machine learning and artificial intelligence techniques, could facilitate the ongoing detection of land use change and data updating. It is also of interest to obtain data for surveys from social networks or via mobile applications and online platforms, where residents can report changes and create spatial data. This solution would allow for the provision of up-to-date and realistic data, which, once verified, would significantly increase the usability and accuracy of topographic data.
The biggest challenge in utilizing the BDOT10k data is the aspect of changes occurring between subsequent updates, leading to discrepancies between the dataset and the actual spatial conditions. As a result, inaccuracies in representing new roads, buildings, or changes in land use may arise, impacting the quality of conducted analyses and potentially leading to erroneous conclusions. It should also be noted that the updating of the topographic dataset relies heavily on reference databases; however, in cases where data are missing from these references, updates are based on the visual identification of changes using orthophotomaps. Consequently, this could lead to the incorrect identification of urban development elements by the person updating the database. Nevertheless, it is important to highlight that urban centers, particularly provincial ones, are updated more frequently than every two years. As a consequence, frequent updates lead to the discovery and rectification of errors within the dataset, thus improving the overall quality of the dataset.
Given the availability of the BDOT10k data in the vector format, there is an opportunity to merge it with additional datasets. Integration provides an opportunity to improve the quality control of individual datasets while promoting a higher degree of timeliness within the combined dataset. As part of the research methodology, it was decided to include OSM data within the BDOT10k dataset. The decentralized data collection process driven by volunteer communities through the OSM database played a significant role in this decision. Volunteers often reside in specific regions and regularly update data based on their accurate knowledge of the updated area. This implies that data updates occur with greater frequency and reflect actual, real-time changes. Consequently, for specific components, such as drainage facilities, support was derived from the OSM database, which does not necessitate an administrative mode of data update. This implies that access to up-to-date data is facilitated in urbanized areas. Certainly, as was the case with the location of the existing bus stops, the dataset used also required a visual verification and supplementation of data based on the current orthophotomap. An example of errors that should have been corrected for the purposes of this study was the lack of road continuity (Figure 9).
Considering the advantages as well as the limitations of each dataset, the decision was made to rely on data integration. On the one hand, BDOT10k, based on reference sources, was used, which allowed for the identification and reliability of technical infrastructure elements. On the other hand, the speed of OSM updates favored the identification of new elements that emerged between the BDOT10k update cycles. The integration of data from disparate sources, as exemplified by the present study, facilitated cross-comparison and cross-validation, thereby enhancing the precision of the analysis. The utilization of multiple data sources not only compensates for individual dataset gaps but also contributes to a more comprehensive and reliable understanding of the studied phenomena.
In this study, the relevant emission coefficients were identified, and atmospheric corrections were applied to obtain a plausible SUHI model. Unfortunately, one of the unavoidable elements of this study was the data acquisition time. A review of the literature indicates that the SUHI phenomenon intensifies during the nighttime hours, while satellite data in Poland are recorded during the daytime, specifically between 09:30 and 10:00 for the selected area. Nevertheless, it was determined that, despite these challenges, the data can still indicate optimal locations for blue-green infrastructure (BGI).
At the same time, the research assumed the use of demographic data, which due to being obtained from official registers required additional activities, including their ordering and aggregation. A significant challenge was the absence of a clearly defined location, which was addressed by the generalization of data pertaining to the age structure of residents to districts. Obviously, acquiring these data was extremely time-consuming, and the presented analysis allows for areas to be indicated through the extent of the residential community to the location of the BGI components. Moreover, given that the implementation of BGI-related facilities is largely overseen by city management policies, it is deemed sufficient to narrow down the location of potential investments.
Highlighting the strengths of the applied methodology, it would be important to mention the use of geoinformation systems, enabling the integration and comprehensive, precise analysis of spatial data from various sources. It is also important to highlight the interdisciplinary approach employed in the design of solutions for individual blue-green infrastructure elements. This approach encompasses a number of different disciplines, including geodesy, demography, hydrology, and geography. Application-oriented, the developed models, using appropriate visualization, can be a key role as a tool for decision-makers and planners, creating solutions that will contribute to improving the quality of life of residents, as well as strengthening individual settlement units on the consequences of climate change. It is postulated that the models developed may serve as a foundation for further analysis, taking into account additional spatial features pertinent to the location of BGI. Important elements from the point of view of the analysis could also be the soil conditions, infiltration capacity of the ground, depth of the groundwater level, and ventilation model of the city. However, the data were excluded from the analyses due to their unavailability, incompleteness, and untimeliness. The utilization of open data exchange formats within geoinformation systems is expected to significantly facilitate this task.
In the context of good practices for the implementation of open data initiatives, and especially for the promotion of local sustainability, the issues of interoperability and standardization of data exchange formats are crucial [85,86,87,88,89,90]. The solution is to introduce universal standards, open-source software, and appropriate regulations that legitimize the solutions adopted [91]. In the context of data exchange, currently the key format is GML, which is gradually being implemented as the primary spatial data format. Nevertheless, a considerable quantity of data remains in analogue form, necessitating its conversion to the vector format for exchange. Furthermore, facilitating exchange, integration, and verification by merging multiple spatial datasets is the concept of sharing data through web services, such as WMS, WMTS, and WFS. This technology enables wide interoperability between different systems and organizations utilizing geographic information. Independence from specific software ensures the use of these standards. Furthermore, the popularization of GIS applications available under open licenses, such as QGIS, SAGA GIS, gvSIG, as well as ETL (Extract, Transform, Load) software, which is used in data processing, allowing for data to be efficiently extracted from various sources, transformed to fit business needs, and loaded into target systems, such as databases or data warehouses, is also related to this. The realization of these goals will not be possible without the active cooperation of government entities and commercial entities. In order to achieve this, it is necessary to create appropriate regulations to guide the creation, use, and sharing of open spatial datasets. Furthermore, the implementation of such regulations will facilitate the attraction of financial support, which is crucial for the maintenance of infrastructure, data management, and distribution. Furthermore, public institutions should encourage the use and creation of open datasets by organizations, particularly non-profit organizations, through concerted action.
One of the most crucial and practical aspects of BGI localization is the economic costs associated with implementing blue-green infrastructure (BGI) projects, as well as potential sources of funding for these projects. However, these issues are not addressed in this article as they are a broad and separate research problem. The cost of constructing BGI depends largely on the quality and quantity of these elements and the characteristics of the space in which they are to be located. This implies that the costs may vary considerably from one instance to another. Consequently, it is crucial to highlight that the research conducted and the methodology developed are employed to identify the most suitable location and to inform subsequent activities, including their implementation.

5. Conclusions

This research has shown the remarkable effectiveness of geoinformation systems, ranging from data collection and integration to spatial analysis, during the process of indicating the optimal locations of selected blue-green infrastructure (BGI) elements. The presented approach, using the availability of spatial data, through the use of appropriate formats and services, based on publicly available open-source GIS solutions, allows for significant automation of the performed analyses. The method used enables the precise identification of areas that exhibit an appropriate set of spatial features, which are optimal locations for the arrangement of the analyzed BGI elements.
However, in view of the possibility of errors in the data obtained, it is essential that those responsible for selecting the optimal BGI sites undertake verification based on other data sources and appraise the suitability of the selected locations, including through on-site inspection. This approach offers additional control and enables the improvement in the quality of the geoinformation analyses carried out.
Cartographic models, including the SUHI model and DM, were developed for this study as filters that increase the information layer and thus support decision-making regarding the location of blue-green infrastructure (BGI) elements. The interest in the surveyed aspect of spatial management, which includes improving the living conditions of residents as well as increasing the quantity and diversity of urban vegetation complexes, was also driven by the following aspects:
  • The benefits of reducing pollution, improving air quality in urban areas, and thereby improving the health and well-being of residents. In addition, locating BGI elements within the city allows for an increase in biodiversity, thus providing habitats for a variety of plant and animal species. Water conservation is also an important element in relation to the environment, as the blue-green infrastructure helps to filter rainwater.
  • Improving the aesthetics of the urban landscape by giving the urban space a unique character. Through the creation of new parks, ponds, and accompanying architectural elements, as well as elements creating urban vegetation, the aesthetics of streets and public spaces are improved, offering residents a place for relaxation, recreation, and social integration.
  • Elements of blue-green infrastructure allow for resilience to be built against the effects of climate change, in particular, by providing natural and effective thermal insulation as well as rainwater retention. Green spaces within the city allow for absorption in the event of precipitation, reducing the risk of flooding, as well as the retention of water in the ground in the event of extremely high temperatures.
In future research, it would be advisable to consider the use of alternative sets of spatial data to enhance the quality and accuracy of the data [20,46,91,92]. The integration of diverse spatial datasets and advanced data acquisition technologies significantly strengthens the reliability of spatial analyses. Data from public government sources that provide statistics on land use and regulatory-driven changes are crucial for informed and effective spatial planning. In addition, observations of actual user behavior on social media platforms make it possible to assess their reactions to changes and to better understand the direction and dynamics of community action in urban environments. Consequently, the advancement of remote sensing technologies, including drones (UAVs) and LiDAR systems, enables the acquisition of high-resolution data, which are essential for the accurate and ongoing analysis of physical changes in space [93]. Satellite data, with its ability to cover large areas, play a pivotal role in environmental and urban monitoring, supporting large-scale strategic planning and providing valuable data for historical analysis [94]. The integration of these data sources and the use of modern technology enables planners and analysts to develop comprehensive, multidimensional models. The models presented support effective data-driven decision-making in urban development and other spatial analyses [95]. With such tools, it is not only possible to plan accurately but also to adapt quickly to changing conditions and societal needs, resulting in increased quality of life for residents and sustainable spatial development. Furthermore, machine learning techniques and artificial intelligence algorithms could be employed to automate the process of data updates and validation, thereby further enhancing the reliability of the analysis.
The selection of locations for BGI elements should be complemented by taking into account the opinions and needs of the community during the design process of these spaces. Such activities can influence the successful implementation and long-term maintenance of BGI elements. Socially desirable facilities and a sense of collective action positively influence the acceptance of such concepts. Therefore, proposals for the selection of these spaces for such investments should be based on the developed map of the location potential of BGI elements. This should be followed by a field visit and public consultations to justify and strengthen the design and implementation activities.
In accordance with the aforementioned, this study presented here constitutes the initial stage of an analysis aimed at developing a matrix of optimal locational features for the deployment of blue-green infrastructure elements. This research will facilitate a more precise assessment and selection of optimal locations, taking into account a range of social, spatial, and environmental factors. Space management in this aspect is a key element of adaptation strategies to the challenges of today, allowing for the minimization of both the negative effects of urbanization processes as well as climate change. Refining and expanding this methodology is essential for the successful design and execution of blue-green infrastructure. The process involves technical aspects of urban planning and a holistic approach to creating spaces that serve environmental and social purposes. By prioritizing the development of these methodologies, urban planners and developers can ensure that blue-green infrastructure is not only effective in managing natural resources, such as water and green spaces, but also in creating environments that are inherently more welcoming and harmonious for their inhabitants.

Author Contributions

Conceptualization, S.C. and A.M.K.; methodology, S.C. and A.M.K.; software, S.C. and A.M.K.; validation, S.C. and A.M.K.; formal analysis, S.C. and A.M.K.; investigation, S.C. and A.M.K.; resources, S.C. and A.M.K.; data curation, S.C. and A.M.K.; writing—original draft preparation, S.C. and A.M.K.; writing—review and editing, S.C. and A.M.K.; visualization, S.C. and A.M.K. All authors have read and agreed to the published version of the manuscript.

Funding

This research received no external funding.

Data Availability Statement

The data presented in this study are contained within this manuscript for reproducibility purposes.

Conflicts of Interest

The authors declare no conflicts of interest.

References

  1. Zalewski, M.; Wagner, I.; Fratczak, W.; Mankiewicz-Boczek, J.; Parniewki, P. Blue-green city for compensating global climate change. Parliam. Mag. 2012, 350, 2–3. [Google Scholar]
  2. Bartesaghi-Koc, C.; Osmond, P.; Peters, A. Towards a comprehensive green infrastructure typology: A systematic review of approaches, methods and typologies. Urban Ecosyst. 2017, 20, 15–35. [Google Scholar] [CrossRef]
  3. Cieślak, I.; Czyża, S.; Szuniewicz, K.; Ogrodniczak, M. Assessment of residential areas of city on the example of Olsztyn. IOP Conf. Ser. Mater. Sci. Eng. 2019, 471, 102001. [Google Scholar] [CrossRef]
  4. Antoszewski, P.; Świerk, D.; Krzyżaniak, M. Statistical review of quality parameters of blue-green infrastructure elements important in mitigating the effect of the urban heat island in the temperate climate (C) zone. Int. J. Environ. Res. Public Health 2020, 17, 7093. [Google Scholar] [CrossRef] [PubMed]
  5. Almaaitah, T.; Appleby, M.; Rosenblat, H.; Drake, J.; Joksimovic, D. The potential of Blue-Green infrastructure as a climate change adaptation strategy: A systematic literature review. Blue-Green Syst. 2021, 3, 223–248. [Google Scholar] [CrossRef]
  6. Badach, J.; Szczepański, J.; Bonenberg, W.; Gębicki, J.; Nyka, L. Developing the Urban Blue-Green Infrastructure as a Tool for Urban Air Quality Management. Sustainability 2022, 14, 9688. [Google Scholar] [CrossRef]
  7. Siehr, S.A.; Sun, M.; Aranda Nucamendi, J.L. Blue-green infrastructure for climate resilience and urban multifunctionality in Chinese cities. Wiley Interdiscip. Rev. Energy Environ. 2022, 11, e447. [Google Scholar] [CrossRef]
  8. Arshad, H.S.H.; Routray, J.K. Multi-functional urban greening: A policy review assessing the integration of urban agriculture into the urban planning system of Punjab province, Pakistan. In Urban and Transit Planning: A Culmination of Selected Research Papers from IEREK Conferences on Urban Planning, Architecture and Green Urbanism, Italy and Netherlands (2017); Springer International Publishing: Cham, Switzerland, 2020; pp. 103–111. [Google Scholar] [CrossRef]
  9. Panlasigui, S.; Spotswood, E.; Beller, E.; Grossinger, R. Biophilia beyond the building: Applying the tools of urban biodiversity planning to create biophilic cities. Sustainability 2021, 13, 2450. [Google Scholar] [CrossRef]
  10. Korkou, M.; Tarigan, A.K.M.; Hanslin, H.M. The multifunctionality concept in urban green infrastructure planning: A systematic literature review. Urban For. Urban Green. 2023, 85, 127975. [Google Scholar] [CrossRef]
  11. Bowler, D.E.; Buyung-Ali, L.; Knight, T.M.; Pullin, A.S. Urban greening to cool towns and cities: A systematic review of the empirical evidence. Landsc. Urban Plan. 2010, 97, 147–155. [Google Scholar] [CrossRef]
  12. Grimmond, C.S.B.; Roth, M.; Oke, T.R.; Au, Y.C.; Best, M.; Betts, R.; Carmichael, G.; Cleugh, H.; Dabberdt, W.; Emmanuel, R.; et al. Climate and more sustainable cities: Climate information for improved planning and management of cities (Producers/Capabilities Perspective). Procedia Environ. Sci. 2010, 1, 247–274. [Google Scholar] [CrossRef]
  13. Wagner, I.; Krauze, K.; Zalewski, M. Blue aspects of green infrastructure. Sustain. Dev. Appl. 2013, 4, 145–155. [Google Scholar]
  14. Drosou, N.; Soetanto, R.; Hermawan, F.; Chmutina, K.; Bosher, L.; Hatmoko, J.U.D. Key factors influencing wider adoption of blue-green infrastructure in developing cities. Water 2019, 11, 1234. [Google Scholar] [CrossRef]
  15. Pluto-Kossakowska, J.; Władyka, M.; Tulkowska, W. Wykorzystanie technologii GIS w analizie zielonej i błękitnej infrastruktury. Rocz. Geomatyki XVIII [Ann. Geomat.] 2020, 1, 33–50. [Google Scholar]
  16. O’Donnell, E.; Netusil, N.; Chan, F.; Dolman, N.; Gosling, S. International Perceptions of Urban Blue-Green Infrastructure: A Comparison across Four Cities. Water 2021, 13, 544. [Google Scholar] [CrossRef]
  17. Rall, E.; Hansen, R.; Pauleit, S. The added value of public participation GIS (PPGIS) for urban green infrastructure planning. Urban For. Urban Green. 2019, 40, 264–274. [Google Scholar] [CrossRef]
  18. Zhou, C.; Wu, Y. A Planning Support Tool for Layout Integral Optimization of Urban Blue–Green Infrastructure. Sustainability 2020, 12, 1613. [Google Scholar] [CrossRef]
  19. Sörensen, J.; Persson, A.S.; Olsson, J.A. A data management framework for strategic urban planning using blue-green infrastructure. J. Environ. Manag. 2021, 299, 113658. [Google Scholar] [CrossRef] [PubMed]
  20. Kaur, R.; Gupta, K. Blue-Green Infrastructure (BGI) network in urban areas for sustainable storm water management: A geospatial approach. City Environ. Interact. 2022, 16, 100087. [Google Scholar] [CrossRef]
  21. Chang, C.R.; Li, M.H.; Chang, S.D. A preliminary study on the local cool-island intensity of Taipei city parks. Landsc. Urban Plan. 2007, 80, 386–395. [Google Scholar] [CrossRef]
  22. Lee, A.C.K.; Maheswaran, R. The health benefits of urban green spaces: A review of the evidence. J. Public Health 2011, 33, 212–222. [Google Scholar] [CrossRef] [PubMed]
  23. Völker, S.; Baumeister, H.; Claßen, T.; Hornberg, C.; Kistemann, T. Evidence for the temperature-mitigating capacity of urban blue space—A health geographic perspective. Erdkunde 2013, 67, 355–371. [Google Scholar] [CrossRef]
  24. Lehmann, S. Low carbon districts: Mitigating the urban heat island with green roof infrastructure. City Cult. Soc. 2014, 5, 1–8. [Google Scholar] [CrossRef]
  25. Jia, B.Q.; Qiu, K.B. The cooling effect of plain afforestation in the Beijing project and its remote sensing-based valuation. Shengtai Xuebao 2017, 37, 726–735. [Google Scholar] [CrossRef]
  26. Ampatzidis, P.; Kershaw, T. A review of the impact of blue space on the urban microclimate. Sci. Total Environ. 2020, 730, 139068. [Google Scholar] [CrossRef] [PubMed]
  27. Xie, Q.; Li, J. Detecting the cool island effect of urban parks in Wuhan: A city on rivers. Int. J. Environ. Res. Public Health 2021, 18, 132. [Google Scholar] [CrossRef] [PubMed]
  28. Andersson, E.; Langemeyer, J.; Borgström, S.; McPhearson, T.; Haase, D.; Kronenberg, J.; Barton, D.; Davis, M.; Naumann, S.; Röschel, L.; et al. Enabling Green and Blue Infrastructure to Improve Contributions to Human Well-Being and Equity in Urban Systems. BioScience 2019, 69, 566–574. [Google Scholar] [CrossRef]
  29. Li, J.; Trivic, Z. Impact of “blue-green diet” on human health and wellbeing: A systematic review of potential determinants in shaping the effectiveness of blue-green infrastructure (BGI) in urban settings. Sci Total Environ. 2024, 926, 171397. [Google Scholar] [CrossRef] [PubMed]
  30. Pinto, L.V.; Inácio, M.; Pereira, P. Green and blue infrastructure (GBI) and urban nature-based solutions (NbS) contribution to human and ecological well-being and health. Oxf. Open Infrastruct. Health 2023, 1, ouad004. [Google Scholar] [CrossRef]
  31. Andreucci, M.B.; Russo, A.; Olszewska-Guizzo, A. Designing urban green blue infrastructure for mental health and elderly wellbeing. Sustainability 2019, 11, 6425. [Google Scholar] [CrossRef]
  32. Thomas, C.J.; Bromley, R.D.F. City-centre Revitalisation: Problems of Fragmentation and Fear in the Evening and Night-time City. Urban Stud. 2000, 37, 1403–1429. [Google Scholar] [CrossRef]
  33. Vernon, B.; Tiwari, R. Place-making through water sensitive urban design. Sustainability 2009, 1, 789–814. [Google Scholar] [CrossRef]
  34. Rodríguez, M.I.; Cuevas, M.M.; Martínez, G.; Moreno, B. Planning criteria for Water Sensitive Urban Design. WIT Trans. Ecol. Environ. 2014, 191, 1579–1591. [Google Scholar] [CrossRef]
  35. Hamel, P.; Tan, L. Blue–Green Infrastructure for Flood and Water Quality Management in Southeast Asia: Evidence and Knowledge Gaps. Environ. Manag. 2022, 69, 699–718. [Google Scholar] [CrossRef] [PubMed]
  36. Saw, L.E.; Lim, F.K.S.; Carrasco, L.R. The relationship between natural park usage and happiness does not hold in a tropical city-state. PLoS ONE 2015, 10, e0133781. [Google Scholar] [CrossRef] [PubMed]
  37. Olszewska-Guizzo, A.; Sia, A.; Fogel, A.; Ho, R. Can Exposure to Certain Urban Green Spaces Trigger Frontal Alpha Asymmetry in the Brain?—Preliminary Findings from a Passive Task EEG Study. Int. J. Environ. Res. Public Health 2020, 17, 394. [Google Scholar] [CrossRef] [PubMed]
  38. Dennis, M.; Barlow, D.; Cavan, G.; Cook, P.A.; Gilchrist, A.; Handley, J.; James, P.; Thomon, J.; Tzoulas, K.; Wheater, C.P.; et al. Mapping Urban Green Infrastructure: A Novel Landscape-Based Approach to Incorporating Land Use and Land Cover in the Mapping of Human-Dominated Systems. Land 2018, 7, 17. [Google Scholar] [CrossRef]
  39. Buldakova, E. Urban Greening and Geo-environmental Safety. Civ. Eng. 2022, 203, 1467–1474. [Google Scholar] [CrossRef] [PubMed]
  40. Wagner, I.; Januchta-Szostak, A.; Waack-Zając, A. Tools for strategic planning and management of urban water. In Water in the City; Sendzimir Foundation: Kraków, Poland, 2014; pp. 17–29. [Google Scholar]
  41. O’Donnell, E.C.; Lamond, J.E.; Thorne, C.R. Recognising barriers to implementation of Blue-Green Infrastructure: A Newcastle case study. Urban Water J. 2017, 14, 964–971. [Google Scholar] [CrossRef]
  42. Mikkili, S.; Panda, S.K.; Agarwal, S. GIS-based integrated approach for sustainable management of ecology and environment with green and blue spaces. Indian J. Ecol. 2021, 48, 931–938. [Google Scholar]
  43. Chi, Y.L.; Mak, H.W.L. From Comparative and Statistical Assessments of Liveability and Health Conditions of Districts in Hong Kong towards Future City Development. Sustainability 2021, 13, 8781. [Google Scholar] [CrossRef]
  44. Felce, D.; Perry, J. Quality of life: Its definition and measurement. Res. Dev. Disabil. 1995, 16, 51–74. [Google Scholar] [CrossRef]
  45. Donati, G.F.A.; Bolliger, J.; Psomas, A.; Maurer, M.; Bach, P.M. Reconciling cities with nature: Identifying local Blue-Green Infrastructure interventions for regional biodiversity enhancement. J. Environ. Manag. 2022, 316, 115254. [Google Scholar] [CrossRef] [PubMed]
  46. Thekkan, A.F.; George, A.; Prasad, P.R.C.; Joseph, S. Understanding Blue-Green Infrastructure through Spatial Maps: Contribution of Remote Sensing and GIS Technology. In Blue-Green Infrastructure across Asian Countries; Dhyani, S., Basu, M., Santhanam, H., Dasgupta, R., Eds.; Springer: Singapore, 2022; pp. 123–140. [Google Scholar] [CrossRef]
  47. Gobatti, L.; Bach, P.M.; Scheidegger, A.; Leitão, J.P. Using satellite imagery to investigate Blue-Green Infrastructure establishment time for urban cooling. Sustain. Cities Soc. 2023, 97, 104768. [Google Scholar] [CrossRef]
  48. Angel, S.; Parent, J.; Civco, D. Urban sprawl metrics: An analysis of global urban expansion using GIS. In Proceedings of the ASPRS Annual Conference 2007: Identifying Geospatial Solutions, Tampa, FL, USA, 7–11 May 2007; American Society for Photogrammetry and Remote Sensing (ASPRS): Baton Rouge, LA, USA, 2007. [Google Scholar]
  49. Biłozor, A.; Cieślak, I.; Czyża, S.; Szuniewicz, K.; Bajerowski, T. Land-Use Change Dynamics in Areas Subjected to Direct Urbanization Pressure: A Case Study of the City of Olsztyn. Sustainability 2024, 16, 2923. [Google Scholar] [CrossRef]
  50. Cebrián Abellán, F.; Andrés López, G.; Bellet Sanfeliu, C. The Use of GIS and Multicriteria Techniques for the Socio-Spatial Analysis of Urban Areas in Medium-Sized Spanish Cities. Land 2023, 12, 1115. [Google Scholar] [CrossRef]
  51. Czyża, S.; Szuniewicz, K.; Cieślak, I.; Biłozor, A.; Bajerowski, T. An Analysis of the Spatial Development of European Cities Based on Their Geometry and the CORINE Land Cover (CLC) Database. Int. J. Environ. Res. Public Health 2023, 20, 2049. [Google Scholar] [CrossRef] [PubMed]
  52. Mawenda, J.; Watanabe, T.; Avtar, R. An Analysis of Urban Land Use/Land Cover Changes in Blantyre City, Southern Malawi (1994–2018). Sustainability 2020, 12, 2377. [Google Scholar] [CrossRef]
  53. Yang, X. Satellite monitoring of urban spatial growth in the Atlanta metropolitan area. Photogramm. Eng. Remote Sens. 2002, 68, 725–734. [Google Scholar]
  54. Ghofrani, Z.; Sposito, V.; Faggian, R. A Comprehensive Review of Blue-Green Infrastructure Concepts. Int. J. Environ. Sustain. 2017, 6, 15–36. [Google Scholar] [CrossRef]
  55. Ul Din, S.; Mak, H.W.L. Retrieval of Land-Use/Land Cover Change (LUCC) Maps and Urban Expansion Dynamics of Hyderabad, Pakistan via Landsat Datasets and Support Vector Machine Framework. Remote Sens. 2021, 13, 3337. [Google Scholar] [CrossRef]
  56. Ding, K.; Huang, Y.; Wang, C.; Li, Q.; Yang, C.; Fang, X.; Tao, M.; Xie, R.; Dai, M. Time Series Analysis of Land Cover Change Using Remotely Sensed and Multisource Urban Data Based on Machine Learning: A Case Study of Shenzhen, China from 1979 to 2022. Remote Sens. 2022, 14, 5706. [Google Scholar] [CrossRef]
  57. Iwaszuk, E.; Rudik, G.; Duin, L.; Mederake, L.; Davis, M.; Naumann, S.; Wagner, I. Elementy błękitno-zielonej infrastruktury. In Błękitno-Zielona Infrastruktura dla Łagodzenia Zmian Klimatu—Katalog Techniczny; Bergier, T., Kowalewska, A., Eds.; Ecologic Institute & Fundacja Sendzimira: Warsaw, Poland, 2019; pp. 5–44. [Google Scholar]
  58. Morello, E.; Mahmoud, I.; Colaninno, N. Catalogue of Nature-based solutions for urban regeneration. In Energy & Urban Planning Workshop; Morello, E., Mahmoud, I., Eds.; School of Architecture Urban Planning Construction Engineering, Politecnico di Milano: Milan, Italy, 2019; pp. 33–89. [Google Scholar]
  59. Our World in Data. Available online: https://sdg-tracker.org/ (accessed on 1 December 2023).
  60. Kimic, K.; Ostrysz, K. Assessment of blue and green infrastructure solutions in shaping urban public spaces—Spatial and functional, environmental, and social aspects. Sustainability 2021, 13, 11041. [Google Scholar] [CrossRef]
  61. Müller, N.; Kuttler, W.; Barlag, A.B. Counteracting urban climate change: Adaptation measures and their effect on thermal comfort. Theor Appl Clim. 2014, 115, 243–257. [Google Scholar] [CrossRef]
  62. Sustainable Drainage. Available online: https://www.cambridge.gov.uk/media/5457/suds-design-and-adoption-guide.pdf (accessed on 4 December 2023).
  63. Townsville City Council. Available online: https://www.townsville.qld.gov.au/__data/assets/pdf_file/0006/12210/WSUD-as-Best-Management-Practices-V3.pdf (accessed on 1 December 2023).
  64. Shafique, M. A review of the bioretention system for sustainable storm water management in urban areas. Mater. Geoenvironmental 2016, 63, 227–236. [Google Scholar] [CrossRef]
  65. Individual NWRM Retention Ponds. Available online: http://nwrm.eu/sites/default/files/nwrm_ressources/u11_-_retention_ponds.pdf (accessed on 2 December 2023).
  66. Lee, J. Green Infrastructure as a Solution to Hydrological Problems: Bioswales and Created Wetlands. UF J. Undergrad. Res. 2019, 21. [Google Scholar] [CrossRef]
  67. GOV.UK. Rural Sustainable Drainage Systems (RSuDS). Available online: https://assets.publishing.service.gov.uk/media/5a7b956b40f0b645ba3c541b/scho0612buwh-e-e.pdf (accessed on 2 December 2023).
  68. Główny Urząd Geodezji i Kartografii. Available online: https://geoportal.gov.pl/ (accessed on 2 December 2023).
  69. SCALGO Live. Available online: https://scalgo.com/live/poland/ (accessed on 2 December 2023).
  70. U.S. Geological Survey. Landsat 8 Data Users Handbook; NASA: Washington, DC, USA, 2019.
  71. Jimenez-Munoz, J.C.; Cristobal, J.; Sobrino, J.A.; Sòria, G.; Ninyerola, M.; Pons, X. Revision of the single-channel algorithm for land surface temperature retrieval from landsat thermal-infrared data. IEEE Trans. Geosci. Remote Sens. 2009, 47, 339–349. [Google Scholar] [CrossRef]
  72. Sobrino, J.A.; Jiménez-Muñoz, J.C.; Sòria, G.; Romaguera, M.; Guanter, L.; Moreno, J.; Plaza, A.; Martínez, P. Land surface emissivity retrieval from different VNIR and TIR sensors. IEEE Trans. Geosci. Remote Sens. 2008, 46, 316–327. [Google Scholar] [CrossRef]
  73. Gábor, P.; Jombach, S. The relation between the biological activity and the land surface temperature in Budapest. Appl. Ecol. Environ. Res. 2010, 7, 241–251. [Google Scholar] [CrossRef]
  74. Liu, L.; Zhang, Y. Urban heat island analysis using the landsat TM data and ASTER Data: A case study in Hong Kong. Remote Sens. 2011, 3, 1535–1552. [Google Scholar] [CrossRef]
  75. Walawender, J.P.; Szymanowski, M.; Hajto, M.J.; Bokwa, A. Land Surface Temperature Patterns in the Urban Agglomeration of Krakow (Poland) Derived from Landsat-7/ETM+ Data. Pure Appl. Geophys. 2014, 171, 913–940. [Google Scholar] [CrossRef]
  76. Walawender, J.; Hajto, M. Assessment of Thermal Conditions in Urban Areas With Use of Different Satellite Data and Gis. In Proceedings of the EUMETSAT Meteorological Satellite Conference, Bath, UK, 26–30 September 2016. [Google Scholar]
  77. Sekertekin, A.; Bonafoni, S. Land Surface Temperature Retrieval from Landsat 5, 7, and 8 over Rural Areas: Assessment of Different Retrieval Algorithms and Emissivity Models and Toolbox Implementation. Remote Sens. 2020, 12, 294. [Google Scholar] [CrossRef]
  78. Valor, G.B. OGIMET—Professional Information about Meteorological Conditions in the World. 2023. Available online: http://ogimet.com/resynops.phtml.en (accessed on 15 August 2023).
  79. Barsi, J.A.; Barker, J.L.; Schott, J.R. An Atmospheric Correction Parameter Calculator for a Single Thermal Band Earth-Sensing Instrument. Int. Geosci. Remote Sens. Symp. (IGARSS) 2003, 5, 3014–3016. [Google Scholar] [CrossRef]
  80. Cao, S.; Wang, Y.; Ni, Z.; Xia, B. Effects of Blue-Green Infrastructures on the Microclimate in an Urban Residential Area Under Hot Weather. Front. Sustain. Cities 2022, 4, 824779. [Google Scholar] [CrossRef]
  81. Jay, O.; Capon, A.; Berry, P.; Broderick, C.; de Dear, R.; Havenith, G.; Honda, Y.; Kovats, R.S.; Ma, W.; Malik, A.; et al. Reducing the health effects of hot weather and heat extremes: From personal cooling strategies to green cities. Lancet 2021, 398, 709–724. [Google Scholar] [CrossRef] [PubMed]
  82. Lowe, D.; Ebi, K.L.; Forsberg, B. Heatwave early warning systems and adaptation advice to reduce human health consequences of heatwaves. Int. J. Environ. Res. Public Health 2011, 8, 4623–4648. [Google Scholar] [CrossRef] [PubMed] [PubMed Central]
  83. Matthies, F.; Menne, B. Prevention and management of health hazards related to heatwaves. Int. J. Circumpolar Health 2009, 68, 8–22. [Google Scholar] [CrossRef] [PubMed]
  84. Rony, M.K.K.; Alamgir, H.M. High temperatures on mental health: Recognizing the association and the need for proactive strategies-A perspective. Health Sci. Rep. 2023, 6, e1729. [Google Scholar] [CrossRef] [PubMed] [PubMed Central]
  85. Gallagher, J.; Orcutt, J.; Simpson, P.; Wright, D.; Pearlman, J.; Raymond, L. Facilitating open exchange of data and information. Earth Sci. Inf. 2015, 8, 721–739. [Google Scholar] [CrossRef]
  86. Jeppesen, J.H.; Ebeid, E.; Jacobsen, R.H.; Toftegaard, T.S. Open Geospatial Infrastructure for Data Management and Analytics in Interdisciplinary Research. Comput. Electron. Agric. 2018, 145, 130–141. [Google Scholar] [CrossRef]
  87. Szuniewicz, K.S.; Cieślak, I.; Czyża, S. The Use of Webgis Services in Public Administration in Poland. In Proceedings of the 15th International Multidisciplinary Scientific GeoConference SGEM2015, Informatics, Geoinformatics and Remote Sensing, Albena, Bulgaria, 18–24 June 2015. STEF92 Technology. [Google Scholar]
  88. Safarov, I.; Meijer, A.; Grimmelikhuijsen, S. Utilization of open government data: A systematic literature review of types, conditions, effects and users. Inf Polity 2017, 22, 1–24. [Google Scholar] [CrossRef]
  89. Mak, H.W.L.; Lam, Y.F. Comparative assessments and insights of data openness of 50 smart cities in air quality aspects. Sustain. Cities Soc. 2021, 69, 102868. [Google Scholar] [CrossRef]
  90. Komosar, A.; Kijanovic, S. Research on the Application of Open Data in the Public Finance Sector. In Proceedings of the 2023 22nd International Symposium INFOTEH-JAHORINA (INFOTEH), East Sarajevo, Bosnia and Herzegovina, 15–17 March 2023; pp. 1–6. [Google Scholar] [CrossRef]
  91. Zha, F.; Lu, L.; Wang, R.; Zhang, S.; Cao, S.; Baqa, M.F.; Li, Q.; Chen, F. Understanding fine-scale heat health risks and the role of green infrastructure based on remote sensing and socioeconomic data in the megacity of Beijing, China. Ecol. Indic. 2024, 160, 111847. [Google Scholar] [CrossRef]
  92. Zhou, J.; Yang, M.; Chai, J.; Wu, L. Evaluation on the urban green space layout in the central city of Yuxi based on big data. Front. Environ. Sci. 2022, 10, 1068205. [Google Scholar] [CrossRef]
  93. La Salandra, M.; Miniello, G.; Nicotri, S.; Italiano, A.; Donvito, G.; Maggi, G.; Dellino, P.; Capolongo, D. Generating UAV high-resolution topographic data within a FOSS photogrammetric workflow using high-performance computing clusters. Int. J. Appl. Earth Obs. Geoinf. 2021, 105, 102600. [Google Scholar] [CrossRef]
  94. Yu, D.; Fang, C. Urban Remote Sensing with Spatial Big Data: A Review and Renewed Perspective of Urban Studies in Recent Decades. Remote Sens. 2023, 15, 1307. [Google Scholar] [CrossRef]
  95. Ferreira, N.; Lage, M.; Doraiswamy, H.; Vo, H.; Wilson, L.; Werner, H.; Park, M.; Silva, C. Urbane: A 3D framework to support data driven decision making in urban development. In Proceedings of the IEEE Conference on Visual Analytics Science and Technology (VAST), Chicago, IL, USA, 25–30 October 2015; pp. 97–104. [Google Scholar] [CrossRef]
Figure 1. Diagram for the optimization of a blue-green infrastructure (BGI) location.
Sustainability 16 05187 g001
Figure 2. Data used for identifying areas unsuitable for BGI based on the topographic database BDOT10k.
Sustainability 16 05187 g002
Figure 3. A map model (MBGI) showing the optimal location of the bioswale for the city of Olsztyn.
Sustainability 16 05187 g003
Figure 4. A map model (MBGI) showing the optimal location of the infiltration trench for the Olsztyn city.
Sustainability 16 05187 g004
Figure 5. A map model (MBGI) showing the optimal location of the bus stops for the Olsztyn city.
Sustainability 16 05187 g005
Figure 6. Olsztyn urban area SUHI model developed.
Sustainability 16 05187 g006
Figure 7. DM model for Olsztyn city: population in residential communities.
Sustainability 16 05187 g007
Figure 8. The results of the analysis conducted to determine the optimal locations for the selected BGI features include.
Sustainability 16 05187 g008
Figure 9. A part of the Olsztyn area near Lake Track—a visualization of the errors in the acquired data contained in the BDOT10k database.
Sustainability 16 05187 g009
Table 1. Investigated blue-green infrastructure (BGI) components.
BGI ComponentsBioswaleInfiltration TrenchGreen Bus Stop
Definitiona shallow depression covered with vegetation, designed to drain rainwater, with a multi-layered bottom structure; a bioswale collects rainwater, filters it, and gradually infiltrates it into the ground, thus slowing down surface runoffa shallow excavation filled with crushed stone or stones; the structure increases the soil’s natural ability to absorb watera component of urban landscape structures comprising a canopy roof and a place where waiting passengers can sit; it is designed to retain rainwater and provide additional green space for people and wildlife
StructureSustainability 16 05187 i001Sustainability 16 05187 i002Sustainability 16 05187 i003
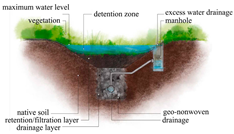
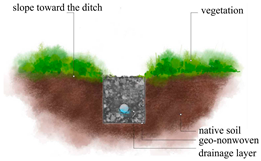
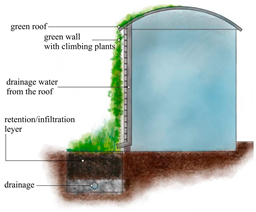
Spatial features conducive to the location
an area with a slope of no more than 5% to reduce the risk of erosion (or the installation of erosion control mats)
area: a minimum of 1% of the total catchment area
groundwater level—less than 1.5 m
the inclination of slopes—up to 1:3 to facilitate mowing
a bioswale generally has a width from 1.5 to 5 m
the depth should be approx. 1–2 m and the width 1.0–2.5 m
the longitudinal slope of the trench should not exceed 2%
maximum drainage basin area: 5 ha
trenches should not be built in the vicinity of buildings and when groundwater is contaminated
approximate dimensions (which may vary depending on the particular design): length of approx. 5.5 m and width of 2 m
the maximum area of the adjacent pavements, from which water can be captured by a standard bus stop, is 60 m2
Place of applicationcar parks, roads, walkways, bicycle paths, and public spacesin the vicinity of playing fields, sports facilities, recreational areas or open public spaces, and car parkscity centers and urbanized areas within reach of public transport—bus stops
Disclaimer/Publisher’s Note: The statements, opinions and data contained in all publications are solely those of the individual author(s) and contributor(s) and not of MDPI and/or the editor(s). MDPI and/or the editor(s) disclaim responsibility for any injury to people or property resulting from any ideas, methods, instructions or products referred to in the content.

