Article

A Holistic Sustainability Assessment Framework for Evaluating Strategies to Prevent Nutrient Pollution

1
Department of Civil & Environmental Engineering, University of South Florida, Tampa, FL 33620, USA
2
Department of Civil Engineering, California State University, Chico, CA 95929, USA
*
Author to whom correspondence should be addressed.
Sustainability 2024, 16(12), 5199; https://doi.org/10.3390/su16125199
Submission received: 29 March 2024 / Revised: 23 May 2024 / Accepted: 13 June 2024 / Published: 19 June 2024
(This article belongs to the Section Sustainable Water Management)

Abstract

:
Excessive nutrients from anthropogenic activities have caused eutrophication worldwide. While available assessment frameworks aid in selecting strategies to control nutrients, they often lack a holistic approach that considers social, ecological, and managerial categories to ensure long-term effectiveness for both point and non-point sources. This study addresses this gap by introducing a holistic sustainability framework with ten indicators derived from a literature review and stakeholder engagement. Quantitative and qualitative indicators were defined using either existing or newly designed methods. A weighted sum multi-criteria method was applied to calculate the total score for each strategy, considering indicator levels and weightings. The framework was applied to a case study in Hendry County, Florida, to demonstrate its applicability by assessing ten strategies. The same top-ranked strategy, alum treatment, was identified through this framework after applying 100 weighting scenarios. This demonstrates the robustness of strategy selection using the developed framework. This framework can be applied with limited data by prioritizing inputs related to five major contributors, effective cost, nutrient loading reduction, technology readiness level, benefit and direct impact, and labor operation and maintenance requirement, to the total score. These major indicators highlight the importance of considering social–ecological and managerial categories in addition to technological, environmental, and economic aspects in sustainability assessment of nutrient management strategies.

1. Introduction

Nitrogen and phosphorus are essential nutrients for human health and plant growth [1,2,3]. However, excessive nutrient loading to water bodies results in eutrophication, leading to an increase in the number of dead zones from 400 to 700 between 2008 and 2019 and an increase in the occurrence of harmful algal blooms from 26 events in 2003 to 43 events in 2023 [4,5]. Harmful algal blooms have far-reaching consequences on human health, the economy, and the environment [6,7]. Nutrient management strategies, including treatment technologies and best management practices (BMPs), are implemented to regulate nutrient sources in the U.S. In Europe and Asia, both traditional treatment technologies and emerging nature-based solutions have been adopted to prevent nutrient pollution [8,9,10]. Nutrient pollution includes both point and non-point sources. Point sources are effluent discharged from a single identifiable source, such as municipal wastewater treatment plants, while non-point sources encompass urban stormwater runoff, agricultural runoff, and onsite wastewater treatment systems.
Selecting nutrient management strategies for implementation typically requires a comprehensive evaluation of their performance across technological and economic categories. Technological performance focuses on the functionality and efficacy of a strategy and has been extensively examined in prior studies [11,12,13,14,15,16]. Most of the reviewed literature evaluates nutrient removal/reduction for different strategies, with a specific emphasis on total nitrogen (TN) and total phosphorus (TP) removal/reduction as the key technological indicators [13,17,18]. Many of these studies, however, overlook other technological category indicators, such as technology readiness level and scalability. Beyond the aforementioned technological indicators, economic indicators feature prominently in most reviewed articles, including cost-effectiveness, total cost, capital cost, and operation and maintenance (O&M) cost [12,13,15,16,19,20,21,22,23]. However, nutrient management strategies selected solely based on these common indicators often face long-term sustainability challenges, as their selection lacks holistic consideration of other factors, such as the impacts on ecological systems, managerial requirements, and public acceptance.
Hence, it is imperative to consider not only technological and economic aspects but also social, ecological, and managerial categories when evaluating nutrient management strategies [16]. Several assessment frameworks have been developed that include social indicators, such as public acceptance, number of affected persons, nuisance, and satisfaction of working conditions [13,16,19,20,21,22,23]. However, these social indicators primarily focus on the public or employees, lacking a broader consideration of key stakeholders, such as landowners/farmers. Given that certain nutrient management strategies necessitate the collaboration of various stakeholders, it is crucial to assess their willingness to adopt a strategy before implementation. Limited attention has been paid to managerial and ecological indicators in previous assessment frameworks, with a few exceptions. Notably, J-Tech considered both managerial and ecological categories in their assessment framework for the South Florida Water Management District (SFWMD) [16]. The managerial category assists in selecting strategies with low maintenance requirements, while the ecological category prioritizes strategies that benefit ecosystems. Instead of evaluating O&M from the economic standpoint, J-Tech integrates O&M as a managerial indicator, specifically selecting strategies with less complexity of operation and less operator involvement [16]. In terms of ecological indicators, the framework developed by J-Tech stands out as the only framework assessing the value of the habitat provided for fish and wildlife by the treatment area [16].
From the end user’s point of view, the majority of previous assessment frameworks are developed for government agencies, water utilities, and watershed management organizations [11,12,13,14,15,16,17,18,19,20,21,22,23,24,25]. Some of the frameworks are developed for technology developers/designers to improve nutrient removal/reduction performance in the future [11,13,20,22,23], and a limited number of the frameworks are developed for community members, even though the community is considered as one group of the important stakeholders [11,13]. To the authors’ knowledge, there is no framework to assess nutrient management strategies that considers the concerns of various stakeholders, including both landowners/farmers and technology/BMP maintainers.
Furthermore, most reviewed literature developed conceptual assessment frameworks without practical application. Among the limited applications, most research adopted a fixed weighting scheme. For example, J-Tech evaluated ten nutrient management strategies for urban stormwater runoff and selected alum treatment using one set of weighting based on stakeholders’ preferences [16]. However, fixed weighting is limited in capturing diverse contexts and different stakeholder perspectives. Some studies have recognized the limitations associated with fixed weighting and addressed uncertainty by applying various weighting schemes [13,26,27]. Molinos-Senante et al. designed seven hypothetical weighting scenarios to assess seven secondary wastewater treatment technologies [13]. The authors found that constructed wetlands were the most sustainable technology in five out of seven scenarios when economic and social categories were preferred [13]. Lohman et al. designed 1000 hypothetical weighting scenarios to evaluate three sanitation alternatives and found that traditional design had the highest probability of ranking at the top [26]. Hall et al. applied four hypothetical weighting schemes to assess three onsite wastewater treatment systems, and they found that a passive system was the preferred alternative [27]. However, these weightings are hypothetical. Further work is needed to provide practical insights into nutrient management strategies by assigning weighting within a tangible range based on a literature review.
Therefore, this paper aims to develop a holistic sustainability assessment framework for various groups of stakeholders, and this is the first framework considering landowners/farmers and technology/BMP maintainers. This paper also aims to design a framework with tangible weighting schemes for evaluating nutrient management strategies while identifying the major contributor(s) among all indicators to simplify data collection efforts. The developed framework is applied to a case study in Florida to assess the nutrient management strategies and select the top-ranked one.

2. Materials and Methods

2.1. Framework Formulation

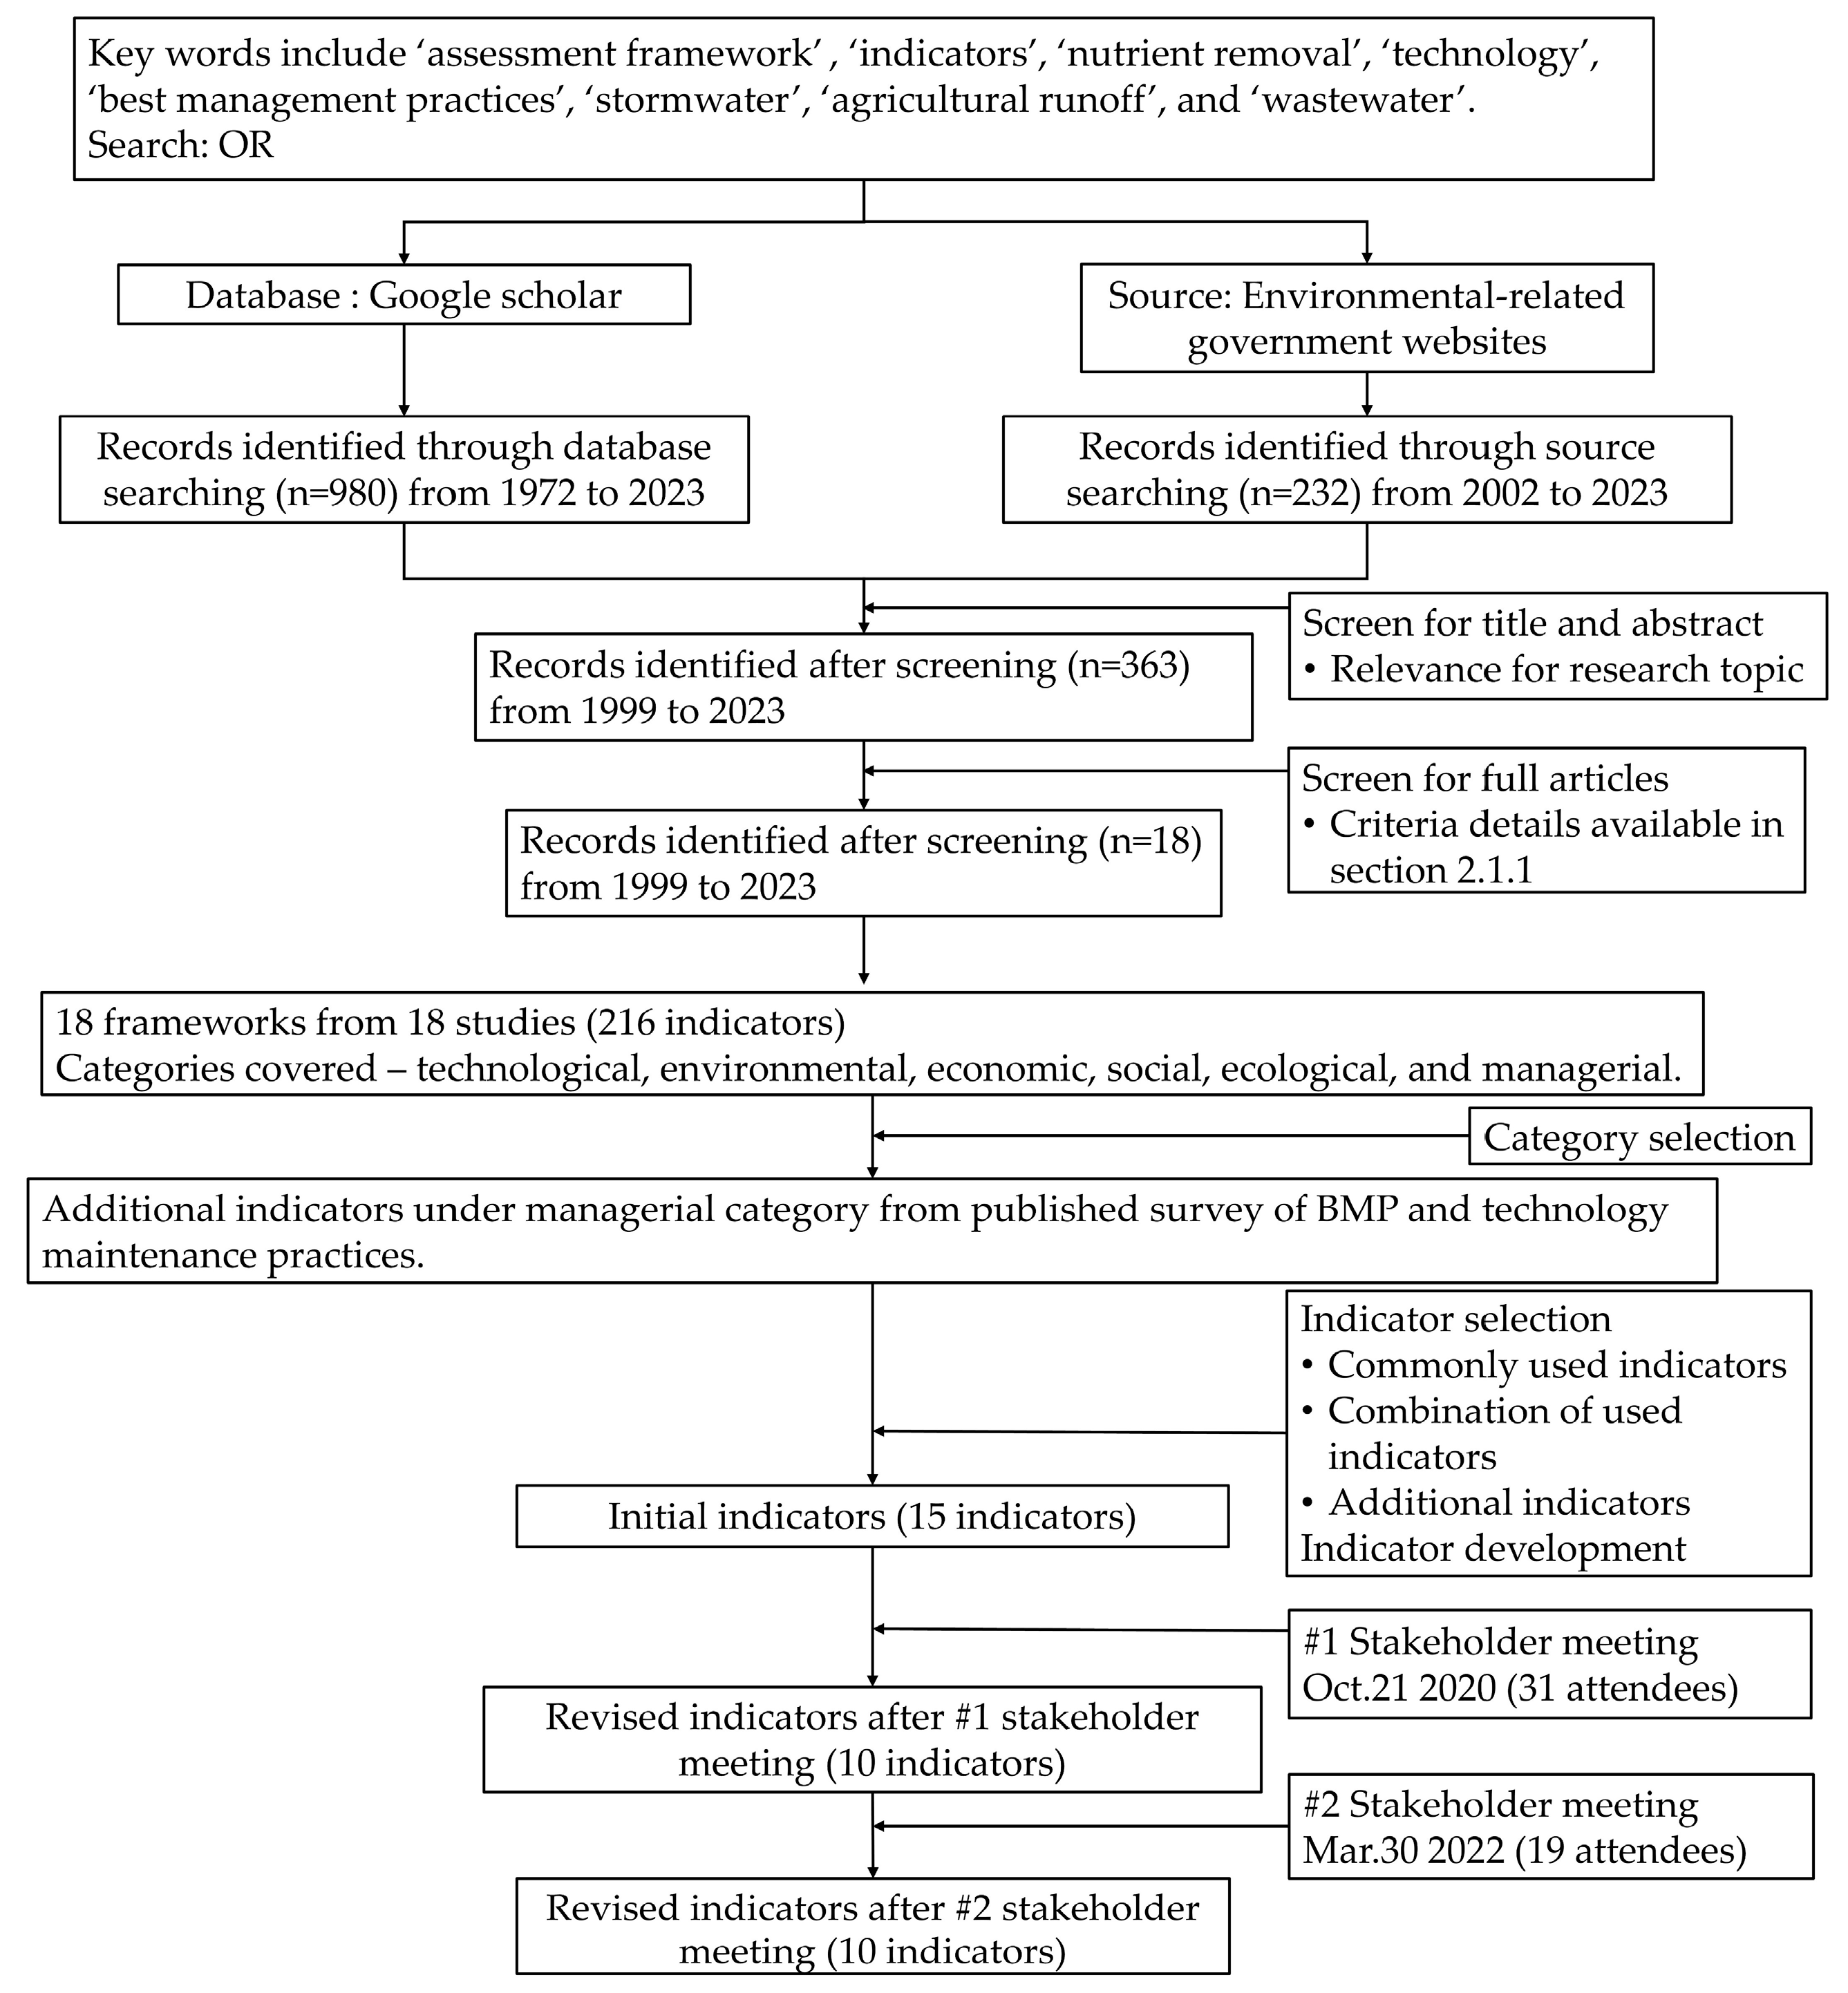
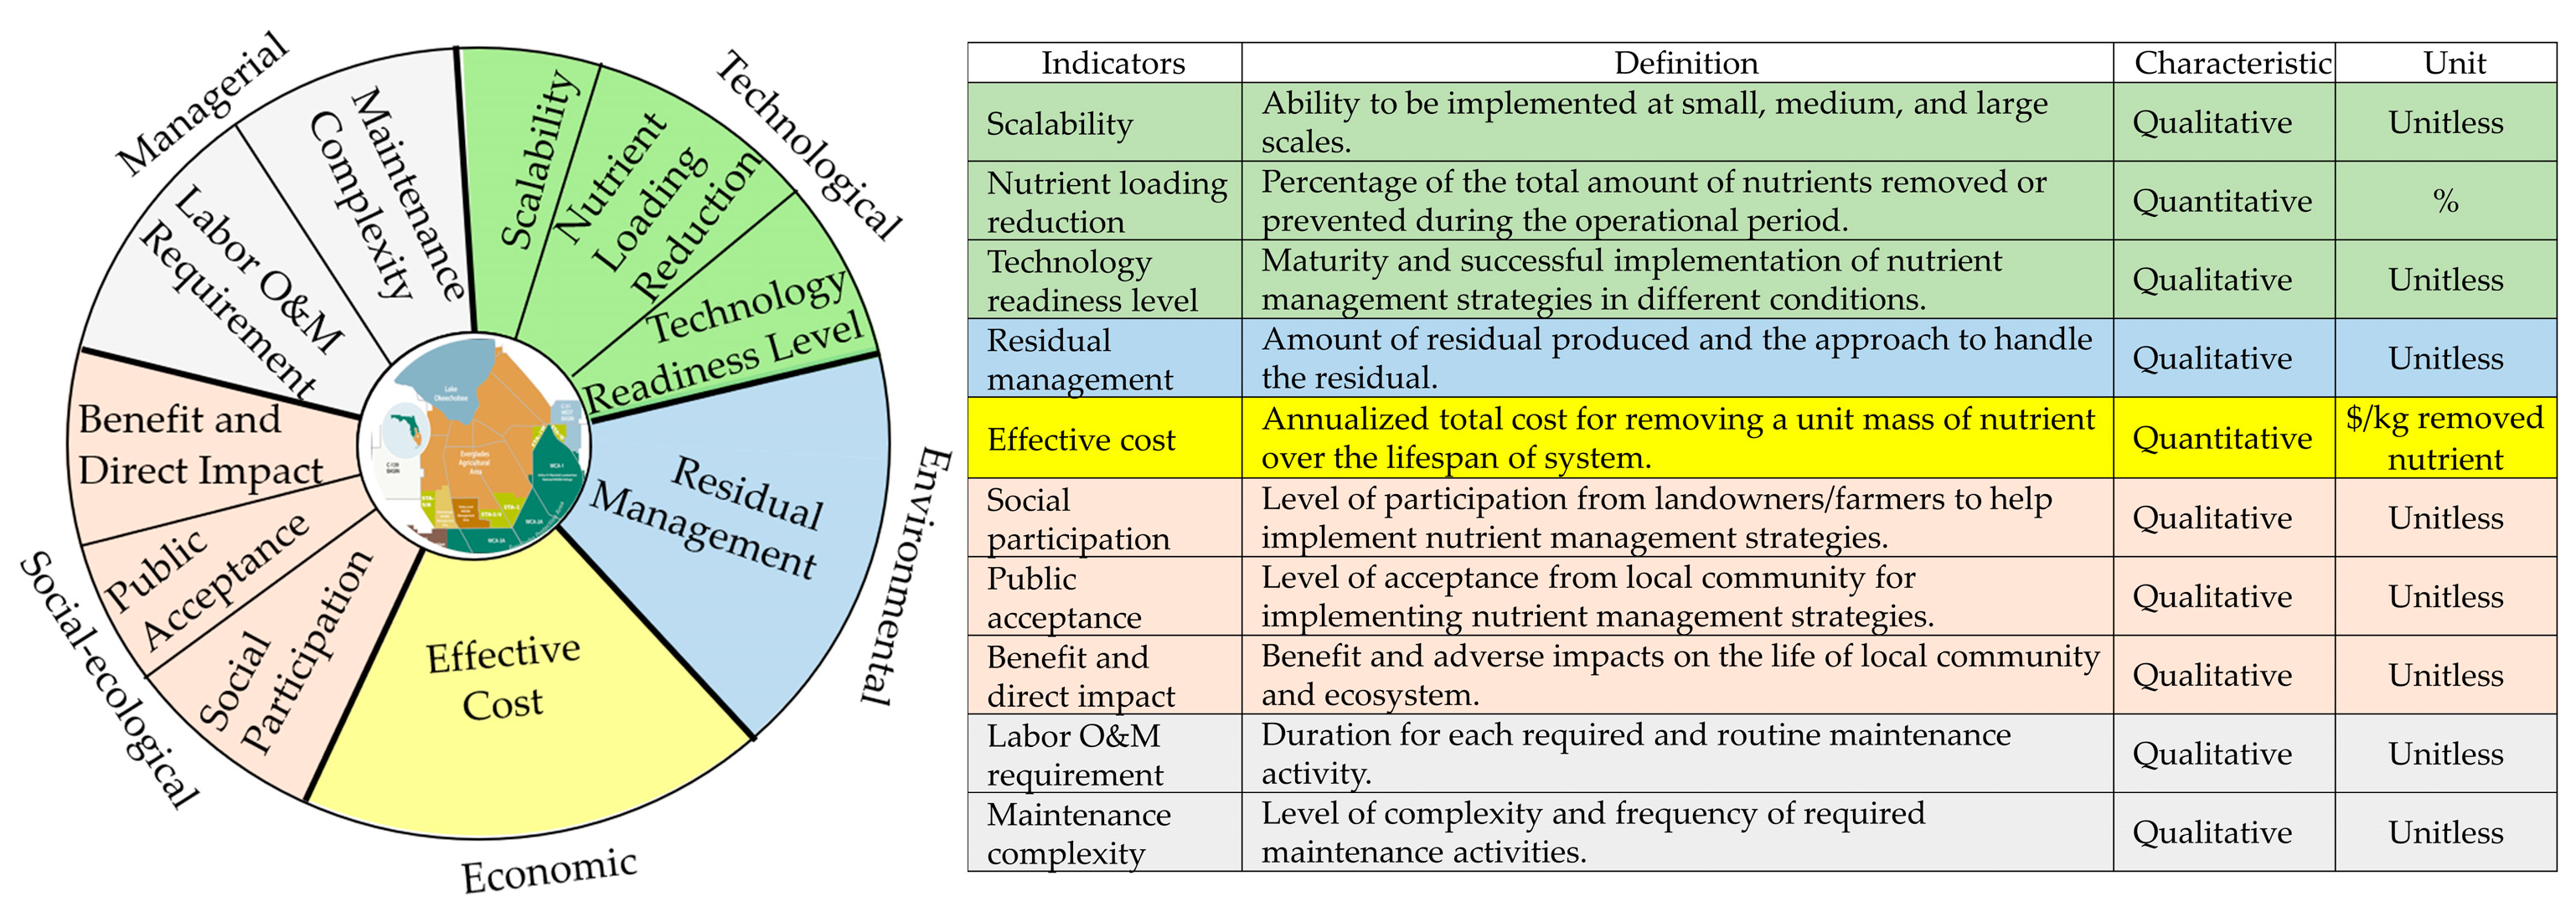
2.1.1. Category and Indicator Selection

Category and indicator selection was conducted based on a literature review and feedback from stakeholder meetings. The category and indicator selection procedure are available in Figure 1. An initial search was performed using Google Scholar and environmental-related government websites employing key terms such as “assessment framework”, “indicators”, “nutrient removal”, “technology”, “best management practices”, “stormwater”, “agricultural runoff”, and “wastewater”. It resulted in 980 articles and 232 reports. Rigorous screening, based on relevance to research objectives, was then applied to the titles and abstracts of these sources, with a dual emphasis on technologies or BMPs for nutrient reduction and conceptual or practical indicators for assessment. Following this initial screening, 282 articles and 81 reports were identified for further analysis. Selected articles were further screened by focusing on the availability of nutrient management, indicator quantification methods, and practical applications. Finally, 10 articles and 8 reports encompassing frameworks and indicators for assessing BMPs or technologies pertinent to stormwater, agricultural runoff, and wastewater were reviewed (details about selected articles/reports can be found in Tables S1 and S2 in Supplementary Materials). Common indicators were identified, and some were applied to develop composite indicators. For example, under the technological category, the predominant indicators selected were nutrient removal, including nitrogen removal and phosphorus removal, both were included in 9 out of 17 studies.
Following the initial selection of indicators, the research team organized two stakeholder meetings to gather feedback for refining indicators. The first stakeholder meeting occurred virtually on 21 October 2020, with a total of 31 participants representing diverse sectors, including state agencies (Florida Department of Environmental Protection Agency, Florida Department of Agriculture and Consumer Services, Florida Department of Health), county utilities (Hillsborough County Water Resources Department), regional water management districts (SFWMD), university researchers (University of Florida Institute of Food And Agricultural Sciences), foundations (Water Research Foundation, Everglades Foundation), organizations (Florida Onsite Wastewater Association, Florida Stormwater Association), intergovernmental partnerships (Tampa Bay Estuary Program), and consultants (Hazen and Sawyer). The second stakeholder meeting, conducted virtually on 30 March 2022, brought together 19 attendees from federal government agencies (Florida Farm Bureau Federation), state agencies, counties, and city utilities (City of Lakeland), regional water management districts (Southwest Florida Water Management District), university researchers, foundations, and consultants (Old Castle). The same sectors from the first meeting were not listed in parentheses. These meetings served as crucial platforms for engaging stakeholders and incorporating their insights into the ongoing indicator revision process. Engaging them in the process of the framework development and identification of sustainability indicators also ensures the applicability of the framework to broad groups of stakeholders since previous frameworks were developed for specific stakeholder groups. Details of stakeholders’ information in each reference are available in Table S1 in Supplementary Materials.

2.1.2. Indicator Quantification

The selected indicators were quantified using established methods found in the literature, while the developed indicators were quantified through newly designed methods. For example, nutrient loading reduction, as a selected indicator, was quantified using an existing method as the percentage of the total amount of nutrients removed relative to the total amount of nutrients in the system [11,12,16,17,18,24]. Scalability, recognized as a crucial indicator during the initial stakeholder meeting, was developed to highlight the preference for strategies that can be implemented across various scales. The category of scales was developed based on classifications used for wastewater systems based on the population served, i.e., small scale (less than 40 people), medium scale (40 to 9090 people), and large scale (more than 9090 people) [28]. Scale categorization of stormwater BMP was established using treated area acreage in the 2020 Lake Okeechobee watershed Basin Management Action Plan (BMAP) report, i.e., for stormwater, the three scales are less than 100 acres, 100 to less than 500 acres, and equal or larger than 500 acres [15]. Another significant indicator identified by stakeholders was the technology readiness level, which was quantified using a rating scheme adapted from the literature with an emphasis on actual implementation in the targeted location or state [16,29,30].
The selected and developed indicators included both quantitative and qualitative indicators. For quantitative indicators, such as nutrient loading reduction and effective cost, the indicator values were either directly obtained or calculated through equations based on required inputs. Indicator values were then used as inputs to determine an indicator level using the designated rating schemes outlined in Equation (1). This rating scheme is structured with five levels, with each level’s range defined by the worst and best values of the respective indicator. Qualitative indicators, such as scalability, were assessed using a 5-level rating scheme designed for each indicator where level 5 is the highest and level 1 is the lowest. Indicator levels were determined based on input information obtained from literature or surveys/interviews using the designed rating schemes. More details on indicator quantification are available in Tables S3 and S4 in the Supplementary Materials. For example, a level 5 scalability is assigned to a strategy that can be implemented at any scale (small, medium, and large), while a level 1 is assigned to a strategy that can be only implemented at a small scale.
L i = i ,   x ϵ x w o r s t + i 1 Δ x , x w o r s t + i Δ x , Δ x = x b e s t x w o r s t n , n = 5

2.1.3. Total Score Calculation

The total score for a given nutrient management strategy was calculated using the weighted sum method by considering both the level of an indicator and its weighting. The indicator weighting, selected by stakeholders, was determined based on tangible ranges obtained through literature review or assumed based on similar indicators. The tangible range is determined by minimum and maximum weightings applied to each indicator in the literature. A comprehensive breakdown of the weighting range for each indicator can be found in Table 1, and the relative references are available in Table S5. The weighted sum multi-criteria method was chosen due to its widespread use in multi-criteria evaluation. Since the developed framework was intended to be used by diverse stakeholders, this method was preferred due to its simplicity, as shown in Equation (2), and its adaptability in accommodating stakeholder preferences through weightings that signify the relative importance of the indicators [31,32,33].
S t o t a l = i = 1 n L i W i
where Stotal = total score of the assessed nutrient management strategy; Li = level of assessed nutrient management strategy under ith indicator; Wi = the ith indicator weighting; n = the total number of indicators.

2.2. Framework Application

2.2.1. Application Process

Users are allowed to input their own data for indicator value since the framework is designed with flexibility and can be customized. The literature review can inform alternate indicators that may be adopted by future users based on regionally specific priorities for nutrient reduction. To apply the framework, users first input indicator values and then select the indicator weighting based on their preference. Indicator levels are automatically calculated in the framework. The output is the total scores and final ranks for all assessed strategies. To ensure its ease of use, the default data of indicator levels is provided in Table S9.
To facilitate the application of the developed framework, an Excel file is provided in Supplementary Materials. The procedure to apply the developed framework using Excel 2016 is shown in Figure 2. Users first come up with a list of potential strategies for their site after reading the title page and indicator definition tabs. For each strategy, they can either select an appropriate category for each indicator or enter the required input information to calculate the values. For example, for an urban stormwater BMP, users can select from the categories of “small scale (<100 acres)”, “medium scale (≥100 and <500 acres)”, and “large scale (≥500 acres)” based on treated area acreage. In the case that the information is limited for the evaluated strategies, users can identify the indicators of interest from the list in the framework. Once the indicator values are selected or calculated, they are then evaluated automatically in Excel using a 5-level scheme to determine the ratings. Users can assign weightings from 0 to 100% or based on the tangible range provided in Excel to the selected indicators, ensuring the total sums to 100%. All indicator levels and weightings are processed using the weighted sum multi-criteria method to derive the total scores and ranks for all assessed strategies. Although the weighted sum multi-criteria method is straightforward, it can be challenging when dealing with criteria/indicators that have different units. Users can choose to conduct uncertainty analysis by using the tangible range of weightings for each indicator (Table S5). The framework automatically generates 100 scenarios with different combinations of indicator weightings. The strategy that is consistently top-ranked is the best option.

2.2.2. Case Study

The case study aimed to demonstrate the applicability of the developed framework. The results were compared with those from an existing framework to highlight the advantages of the developed framework. The developed framework was applied for selecting stormwater treatment BMPs to enhance water quality in the Caloosahatchee River (C-43) West Basin Storage Reservoir, located in Hendry County, Florida. The results were compared with SFWMD’s framework developed by J-Tech since it encompassed all categories featured in the developed framework [13]. The ten BMPs evaluated are alum treatment, treatment wetland, hybrid wetland treatment technology, Bold&Gold®, ElectroCoagulation, sand filtration, NutriGoneTM, AquaLutions®TM, MPC-Buoy, and air diffusion system. An explanation of these ten BMPs is available in Table S6. Pertinent information regarding indicators, categories, and weightings (see Table 1) was sourced from the SFWMD website. SFWMD’s framework incorporates 11 indicators with a fixed weighting scheme. Notably, cost-effectiveness received the highest weight (30 out of 60), underscoring its paramount significance as an indicator for stakeholders.

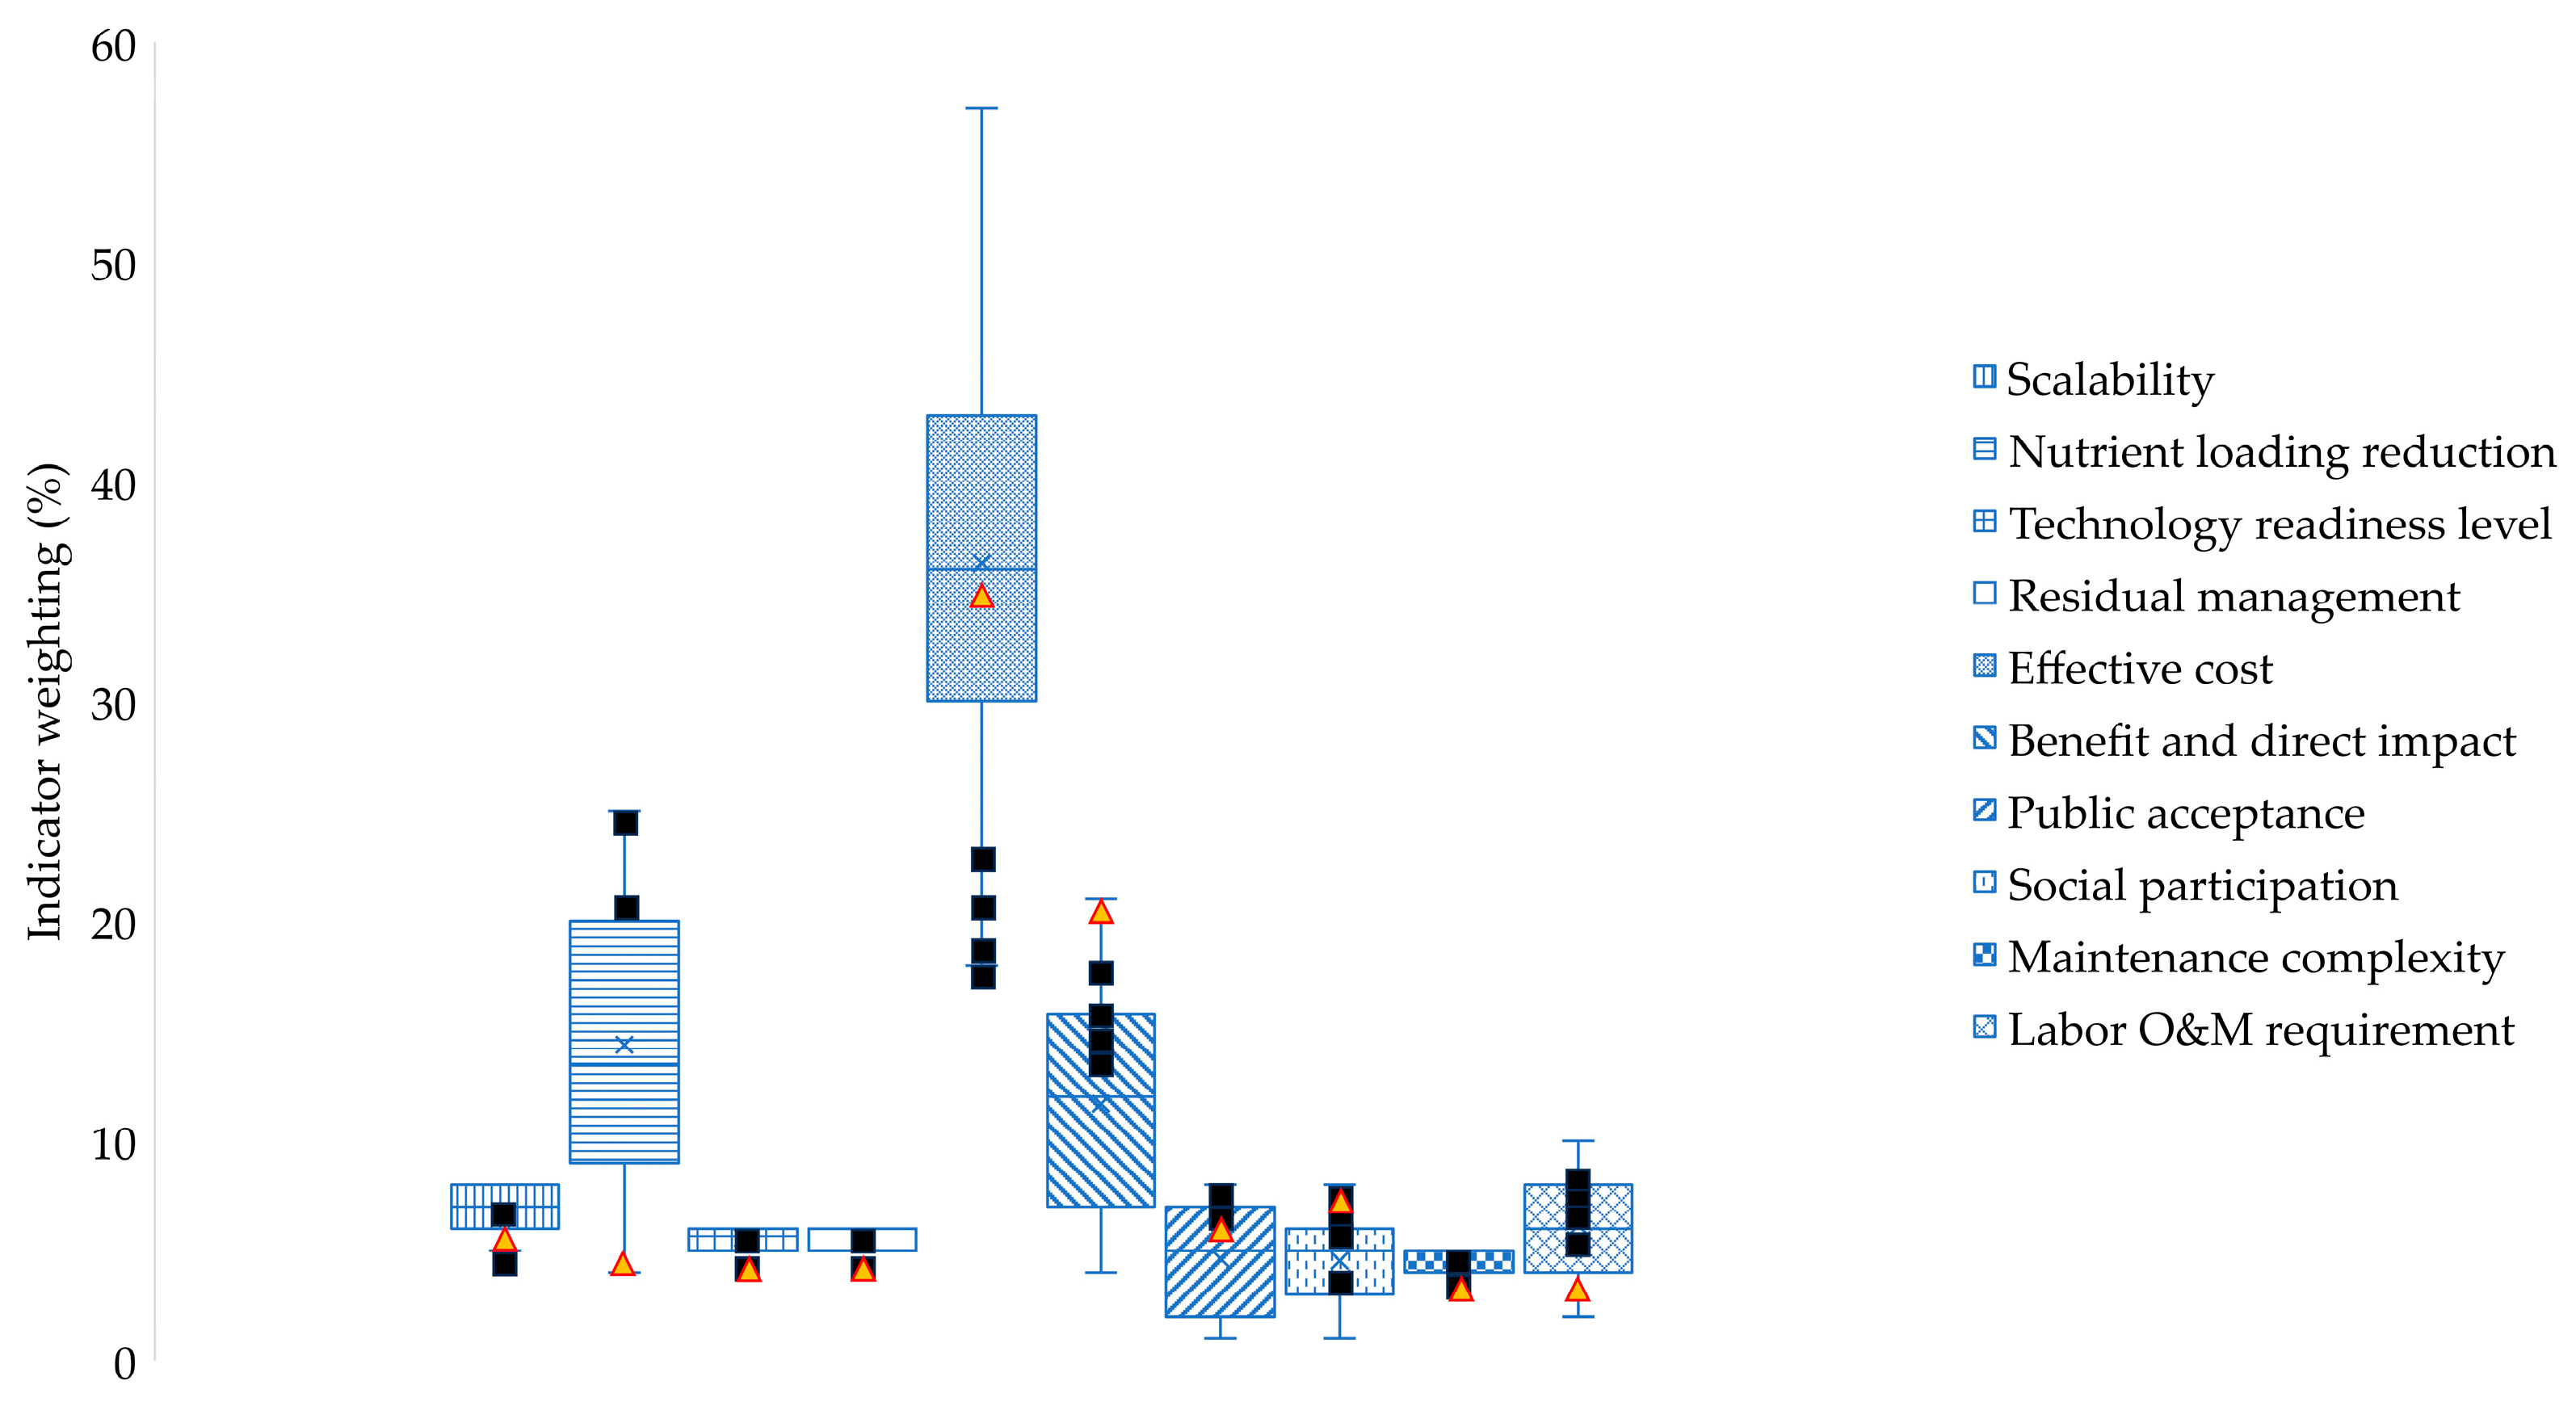
2.2.3. Weighting Scenario Development

To understand the impact of weighting on strategy selection and ensure the robustness of applying the framework, an uncertainty analysis was carried out. Weighting settings were varied with 100 scenarios [34,35]. Within these scenarios, weightings for each indicator were randomly assigned within their respective ranges using Microsoft Excel 2016, ensuring that all weightings collectively summed up to 100%. A nutrient management strategy was selected based on its consistent top ranking across the 100 weighting scenarios.

3. Results and Discussion

3.1. Comprehensiveness of the Developed Framework

The developed framework incorporates categories from previously established frameworks and feedback from diverse stakeholder sectors. The literature review encompassed various categories shown in Table S2, with the technological category emerging as the most frequently employed (featured in 17 out of 18 studies). Within this category, nutrient removal stood out as a commonly utilized indicator. Following closely, economic and environmental categories were the second most prevalent (applied in 9 out of 18 studies each). Within the economic category, capital cost, total cost, cost-effectiveness, and O&M cost were commonly used indicators. Among nine articles focusing on the environmental category, energy consumption and solid/residual production were common indicators. Examining the social category (covered in 8 out of 18 studies), common indicators included public health, public acceptance, and nuisance, where nuisance includes noise, odors, and visual impact. Under the ecological category, the singularly employed indicator was ecosystem service, as noted in J-Tech’s framework [16]. In the managerial category, O&M in J-Tech’s framework was the only indicator, and it was referred to as a “preference for technologies with less complexity of the day-to-day operation and less operator involvement” [16]. Informed by insights from the reviewed assessment frameworks and indicators, the developed framework includes technological, environmental, economic, social–ecological, and managerial categories. The social–ecological category consolidates social and ecological considerations, recognizing that indicators within these two categories assess the interaction between society and ecosystems.
The initial framework developed after the literature review, consisting of 15 indicators, underwent revision following the initial stakeholder meeting [36]. The revised version 2 framework included ten indicators. The adjustments involved the replacement and removal of specific indicators. Notably, energy, water, and material usage under the environmental category were replaced with residual production because the latter more accurately reflects the environmental impact. Scalability and technology readiness levels were identified as crucial indicators during the stakeholder meeting. Adapted from the National Aeronautics and Space Administration (NASA), the technology readiness level was modified to assess both technology maturity and actual implementation in the targeted location [30]. Avoided cost and cost-effectiveness were replaced with effective cost (annualized total cost for removing a unit mass of nutrients over the lifespan of a system), synthesizing all cost-related indicators identified in the literature review (Table S2). Additionally, public acceptance and social participation were introduced under the social–ecological category to address two distinct user perspectives: local community and participants in strategy implementation. Version 2 of the framework was further refined following the second stakeholder meeting [37]. A noteworthy adjustment involved renaming “nutrient loading reduction”, previously termed “removal efficiency”. This modification aimed to distinguish between the reduction in nutrient concentration and reduction in nutrient mass that also addressed sources with different concentrations, such as wastewater and stormwater, providing greater clarity in the terminology employed within the framework. The developed framework, as illustrated in Figure 3, comprises ten indicators, including quantitative indicators of nutrient loading reduction and effective cost and qualitative indicators of scalability, technology readiness level, residual management, benefit and direct impact, public acceptance, social participation, labor O&M requirement, and maintenance complexity.
The framework was designed to empower different stakeholders to assess or enhance the performance and sustainability of nutrient management strategies for any site. For instance, the indicators of “technology readiness level” and “scalability” assist innovative technology developers in understanding how to advance their technologies in terms of maturity and scale for implementation. The framework addresses other types of stakeholders through indicators such as “social participation” for local farmers and “public acceptance” for residents within the social–ecological category, and “maintenance complexity” for operators within the managerial category. Stakeholders can also vary the weightings of different indicators based on their preferences. This flexibility allows users to tailor the framework to their needs, facilitating its application for the evaluation of different nutrient management strategies.

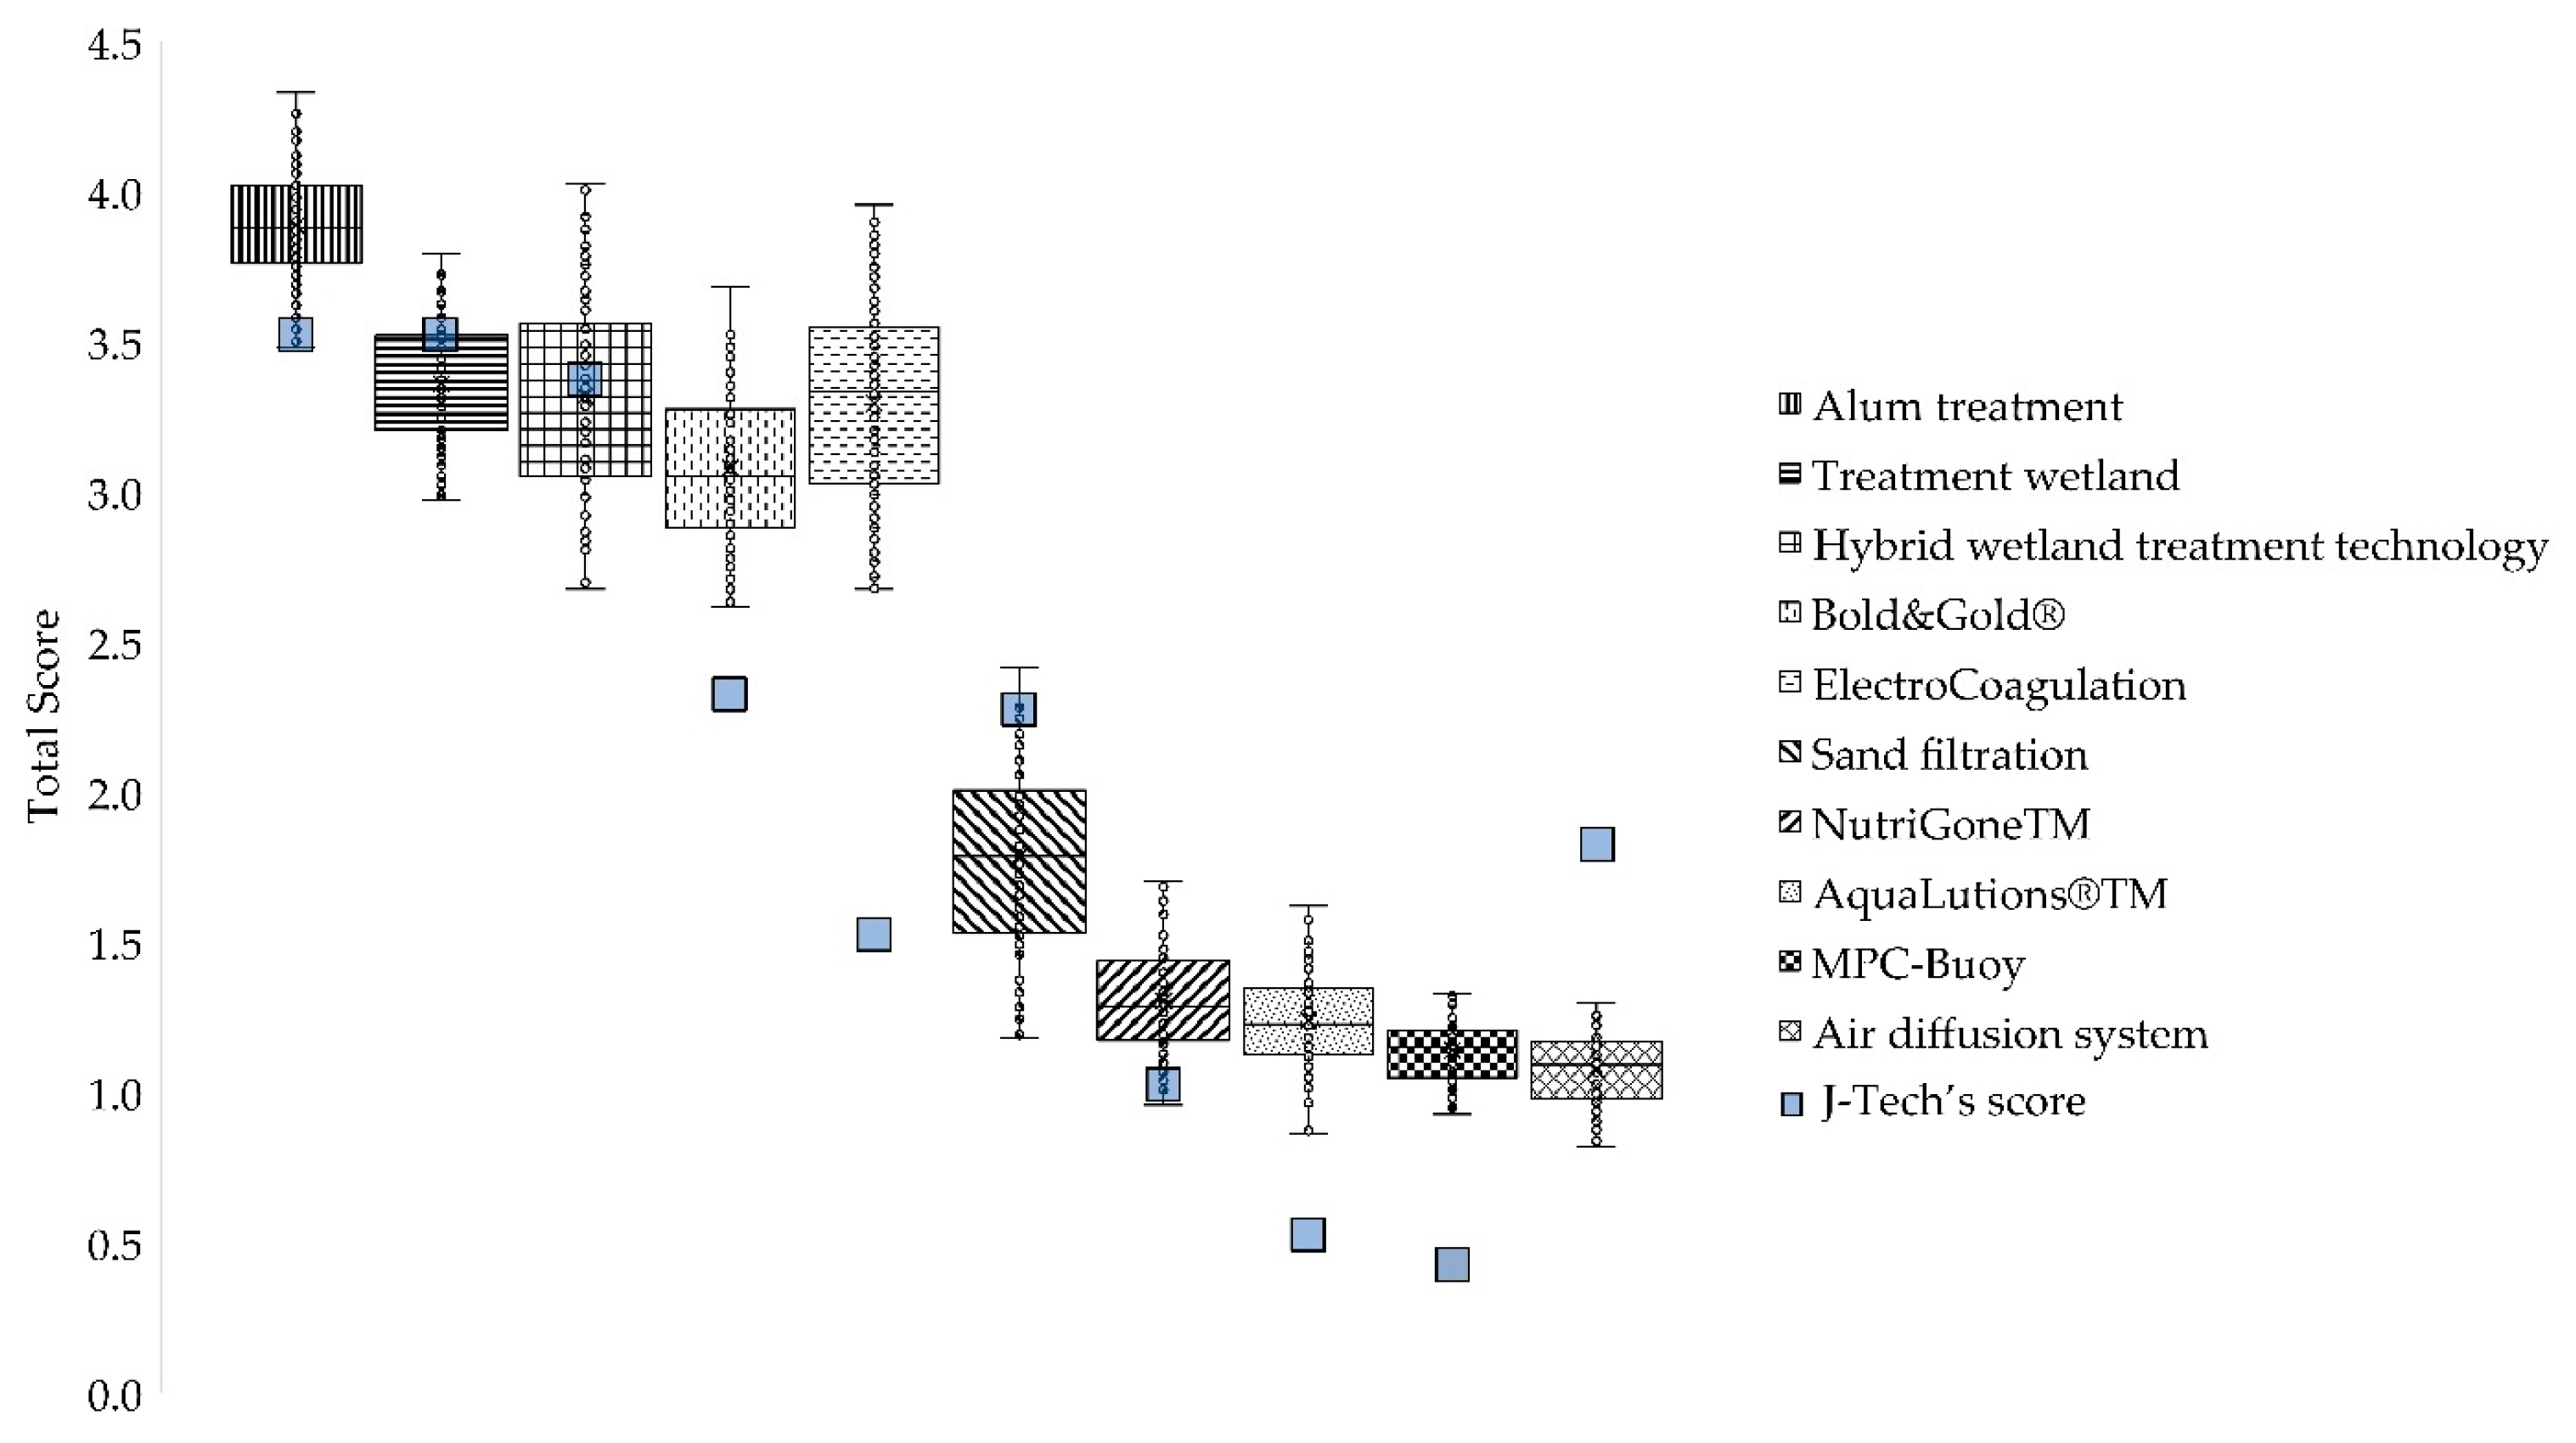
3.2. Robustness of Strategy Selection Using the Developed Framework

A comparison of strategy selection between the developed framework and the J-Tech framework is shown in Figure 4. Alum treatment, treatment wetland, hybrid wetland treatment, Bold&Gold®, and ElectroCoagulation emerged as the top-ranked strategies across different weighting scenarios, with significantly higher total scores than the other five strategies evaluated using the developed framework. When evaluated using the J-Tech framework, alum treatment was ranked first, followed by treatment wetland, and ElectroCoagulation was positioned seventh. The rank improvement of ElectroCoagulation in the developed framework is due to the higher score under technology readiness level and effective cost. ElectroCoagulation achieved a level 5 in technology readiness level with existing implementation in Florida. It also achieved a higher effective cost level in the developed framework compared to J-Tech’s framework since J-Tech’s framework considered TN, TP, and total suspended solids (TSS) in cost evaluation, and ElectroCoagulation has a low TSS removal.
Alum treatment consistently ranked top among ten strategies in 95 out of 100 scenarios, demonstrating the robustness of strategy selection using the developed framework. Alum treatment exhibited relatively higher scores in effective cost, scalability, and benefit and direct impact than other strategies (Figure S8). This is attributed to the relatively higher levels of these indicators than others (Table S9) and the higher weightings assigned to effective cost and benefit and direct impact (Figure 5). Notably, alum treatment secures the highest average score under effective cost among the ten strategies, affirming its cost-effectiveness in the studied context. The effective cost for alum treatment is USD 102/kg, which is USD 62/kg lower than treatment wetland (USD 164/kg) [16,25]. This is because the cost of alum treatment mainly includes the cost of removing TN and TP, and it is very effective in removing TP (USD 176/kg) and TN (USD 28/kg) [13,34]. As a biological process, treatment wetlands are more effective in removing TN (USD 46/kg) than TP (USD 285/kg) [16,25]. Alum treatment, treatment wetland, and hybrid wetland treatment technology were rated as the highest level because they can be implemented at small, medium, and large scales. For benefit and direct impact, alum treatment and treatment wetlands were rated at the same level because both enhanced recreational value by creating wildlife habitat with minimal adverse impacts. Although alum treatment was also ranked first using the J-Tech framework, it only applies under the fixed weighting scenario. Therefore, the selection process using the developed framework is more robust than the J-Tech framework, as the selected strategies are applicable under multiple weighting scenarios.

3.3. Implementation Space Informed by the Developed Framework

The evaluation results using the development framework can inform not only the strategy selection (e.g., alum treatment in the case study) but also the implementation space for a strategy (e.g., treatment wetland is ranked top under scenarios 19, 30, 39, and 69 in the case study). As illustrated in Figure 5, treatment wetland emerges as the top-ranked strategy in scenarios where nutrient loading reduction, benefit and direct impact, and public acceptance carry higher weightings, underscoring a preference for treatment wetlands when considering both technological and social–ecological categories. Molinos-Senante et al. [13] also found that, when prioritizing the social category, treatment wetlands were the most sustainable technology among treatment technologies evaluated for a wastewater treatment plant serving 150 people. On the other hand, ElectroCoagulation took the lead in scenarios with higher weightings for the indicators of benefit and direct impact, public acceptance, and social participation. This strategy provided benefits by creating a habitat to attract animals and plants on the solids-drying bed [16], bringing nature into the community, promoting neighborhood interactions, and enhancing people’s sense of belonging. Therefore, this strategy is selected when higher weighting is assigned to public acceptance. With its minimal land footprint and reduced community disturbance, ElectroCoagulation enhances benefits and minimizes direct impacts, making it a preferred choice when prioritizing the social–ecological category.

3.4. Flexibility of Framework Application with Limited Data

The contribution of each indicator to the total score, as shown in Figure 6, ranges from 0.23% to 67%, with an average of 10%. Across all scenarios and evaluated nutrient management strategies, effective cost consistently emerged as the top contributor among the indicators (Figure 6), followed by nutrient loading reduction, technology readiness level, benefit and direct impact, and labor O&M requirement. The contribution of each indicator generally aligned with the weightings assigned to that indicator, except for the technology readiness level, since the indicator level for all ten assessed strategies was the same. The average contribution of effective cost and nutrient loading reduction is 35% and 15%, respectively. Effective cost and nutrient loading reduction were frequently applied in the reviewed literature and should be included in the assessment [11,12,16,17,18,24]. However, the average contributions of technology readiness level, benefit and direct impact, and labor O&M requirement are either higher than or close to 10% for the assessed strategies. Therefore, when confronted with the challenges of applying the developed framework due to limited data for strategy evaluation, it is important to focus on data collection for these five indicators. The developed framework is effectively represented by these five indicators, covering the economic, technological, social–ecological, and managerial categories. Additionally, these five indicators address the primary concerns of diverse stakeholders, such as government agencies, researchers, technology developers, technology/BMP maintainers, and the community/public. Application with these five dominant indicators streamlines the data collection process. However, it is important to note that employing only these five indicators may lead to variations in final scores, ranks, and the best option.

4. Conclusions

This paper presents a comprehensive sustainability assessment framework incorporating ten quantitative and qualitative indicators spanning technological, environmental, economic, social–ecological, and managerial categories. Each indicator was assigned a range of weightings obtained from a literature review. This is the first framework designed with consideration of the interests of different groups of stakeholders, and the comprehensive nature of the developed framework enables various stakeholders, such as technology developers, utility managers, landowners, and the public, to evaluate nutrient management strategies according to their specific preferences. To demonstrate the applicability of the developed framework, the results were compared with an existing framework developed by J-Tech for SFWMD to assess stormwater nutrient management strategies. The strategy of alum treatment ranked top in 95 out of 100 weighting scenarios using the developed framework. The application of the developed framework also informed the implementation space (i.e., the preferred weighting scheme) for a strategy under evaluation. Moreover, the consistently higher contribution of effective cost, nutrient loading reduction, technology readiness level, benefit and direct impact, and labor O&M requirement to the total score suggests their importance in strategy evaluation and priority for future data collection if limited data are available. To ensure the long-term effectiveness of the strategies for preventing nutrient pollution in achieving sustainable development goals (specifically Goal 6, Clean water and sanitation, and Goal 14, Life below water), it is necessary to consider not only technological, environmental, and economic aspects but also social–ecological and managerial categories in assessing the potential strategies. This research contributes to the field by providing a comprehensive and flexible framework for holistic sustainability assessment in selecting strategies for removing nutrients from urban stormwater, agricultural runoff, and wastewater.

Supplementary Materials

The following supporting information can be downloaded at https://www.mdpi.com/article/10.3390/su16125199/s1.

Author Contributions

Conceptualization, J.H. and Q.Z.; methodology, J.H. and Q.Z.; validation, J.H.; formal analysis, J.H.; investigation, J.H., R.Z.C., P.K.C., S.J.E., and Q.Z.; writing—original draft preparation, J.H. and Q.Z.; writing—review and editing, J.H., R.Z.C., P.K.C., S.J.E., and Q.Z.; supervision, Q.Z.; project administration, Q.Z.; funding acquisition, Q.Z. All authors have read and agreed to the published version of the manuscript.

Funding

This work was developed under Assistance Agreement No. 84009001, awarded by the U.S. Environmental Protection Agency to the USF. It has not been formally reviewed by the EPA. The views expressed in this manuscript are solely those of the authors and do not necessarily reflect those of the Agency. The EPA does not endorse any products or commercial services mentioned in this work.

Institutional Review Board Statement

Not applicable.

Informed Consent Statement

Not applicable.

Data Availability Statement

The data that support the findings of this study are available from the corresponding author, Q.Z., upon reasonable request.

Conflicts of Interest

The authors declare no conflicts of interest.

References

  1. Grusak, M.A.; DellaPenna, D. Improving the nutrient composition of plants to enhance human nutrition and health. Annu. Rev. Plant Biol. 1999, 50, 133–161. [Google Scholar] [CrossRef]
  2. Evans, J.R.; Edwards, E. Nutrient uptake and use in plant growth. In Net Ecosystem Exchange CRC Workshop Proceedings; Cooperative Research Centre for Greenhouse Accounting: Canberra, Australia, 2001; pp. 75–81. [Google Scholar]
  3. Chen, Y.; Michalak, M.; Agellon, L.B. Focus: Nutrition and food science: Importance of nutrients and nutrient metabolism on human health. Yale J. Biol. Med. 2018, 91, 95. [Google Scholar]
  4. United Nations. SDG 14 Conserve and Sustainably Use the Oceans, Sea and Marine Resources for Sustainable Development. Available online: https://www.un.org/sustainabledevelopment/oceans/ (accessed on 13 December 2023).
  5. HAEDAT. Harmful Algae Event Database. Available online: http://haedat.iode.org/browseEvents.php (accessed on 5 January 2024).
  6. United States Environmental Protection Agency. The Effects: Human Health. Nutrient Pollution. Available online: https://www.epa.gov/nutrientpollution/effects-human-health (accessed on 18 January 2024).
  7. United States Environmental Protection Agency. The Effects: Economy. Nutrient Pollution. Available online: https://www.epa.gov/nutrientpollution/effects-economy (accessed on 18 January 2024).
  8. Wang, M.; Janssen, A.B.G.; Bazin, J.; Strokal, M.; Ma, L.; Kroeze, C. Accounting for interactions between Sustainable Development Goals is essential for water pollution control in China. Nat. Commun. 2022, 13, 730. [Google Scholar] [CrossRef]
  9. Rizzo, A.; Sarti, C.; Nardini, A.; Conte, G.; Masi, F.; Pistocchi, A. Nature-based solutions for nutrient pollution control in European agricultural regions: A literature review. Ecol. Eng. 2023, 186, 106772. [Google Scholar] [CrossRef]
  10. Xia, Y.; Zhang, M.; Tsang, D.C.; Geng, N.; Lu, D.; Zhu, L.; Igalavithana, A.D.; Dissanayake, P.D.; Rinklebe, J.; Yang, X.; et al. Recent advances in control technologies for non-point source pollution with nitrogen and phosphorous from agricultural runoff: Current practices and future prospects. Appl. Biol. Chem. 2020, 63, 8. [Google Scholar] [CrossRef]
  11. Fraley-McNeal, L.; Schueler, T.; Winer, R. National Pollutant Removal Performance Database; Version 3; Center for Watershed Protection: Ellicott City, MD, USA, 2007. [Google Scholar]
  12. Qiu, Z. Comparative assessment of stormwater and nonpoint source pollution best management practices in suburban watershed management. Water 2013, 5, 280–291. [Google Scholar] [CrossRef]
  13. Molinos-Senante, M.; Gómez, T.; Garrido-Baserba, M.; Caballero, R.; Sala-Garrido, R. Assessing the sustainability of small wastewater treatment systems: A composite indicator approach. Sci. Total Environ. 2014, 497, 607–617. [Google Scholar] [CrossRef]
  14. Afrooz, A.N.; Boehm, A.B. Effects of submerged zone, media aging, and antecedent dry period on the performance of biochar-amended biofilters in removing fecal indicators and nutrients from natural stormwater. Ecol. Eng. 2017, 102, 320–330. [Google Scholar] [CrossRef]
  15. Florida Department of Environmental Protection. Lake Okeechobee Basin Management Action Plan. Available online: https://publicfiles.dep.state.fl.us/DEAR/DEARweb/BMAP/NEEP_2020_Updates/Lake%20Okeechobee%20BMAP_01-31-20.pdf (accessed on 26 October 2023).
  16. J-Tech. C-43 West Basin Storage Reservoir Water Quality Feasibility Study—Deliverable 4.3.1 Final Feasibility Study. Available online: https://www.sfwmd.gov/sites/default/files/documents/DEL_4.3.1_C-43_Final_Feasibility_Study_all.pdf (accessed on 12 September 2023).
  17. Lundin, M.; Molander, S.; Morrison, G.M. A set of indicators for the assessment of temporal variations in the sustainability of sanitary systems. Water Sci. Technol. 1999, 39, 235–242. [Google Scholar] [CrossRef]
  18. Florida Department of Environmental Protection. Statewide Best Management Practices (BMP) Efficiencies for Crediting Projects in Basin Management Action Plans (BMAPs) and Alternative Restoration Plans. Draft-September 2021. Available online: https://publicfiles.dep.state.fl.us/DEAR/DEARweb/BMAP/BMP_Efficiencies/BMP%20efficiencies%20091621_Distribution.pdf (accessed on 12 September 2023).
  19. Hellström, D.; Jeppsson, U.; Kärrman, E. A framework for systems analysis of sustainable urban water management. Environ. Impact Assess. Rev. 2000, 20, 311–321. [Google Scholar] [CrossRef]
  20. Palme, U.; Lundin, M.; Tillman, A.M.; Molander, S. Sustainable development indicators for wastewater systems–researchers and indicator users in a co-operative case study. Resour. Conserv. Recycl. 2005, 43, 293–311. [Google Scholar] [CrossRef]
  21. Murray, A.; Ray, I.; Nelson, K.L. An innovative sustainability assessment for urban wastewater infrastructure and its application in Chengdu, China. J. Environ. Manag. 2009, 90, 3553–3560. [Google Scholar] [CrossRef]
  22. Mihelcic, J.R.; Naughton, C.C.; Verbyla, M.E.; Zhang, Q.; Schweitzer, R.W.; Oakley, S.M.; Wells, E.C.; Whiteford, L.M. The grandest challenge of all: The role of environmental engineering to achieve sustainability in the world’s developing regions. Environ. Eng. Sci. 2017, 34, 16–41. [Google Scholar] [CrossRef]
  23. Cornejo, P.K.; Becker, J.; Pagilla, K.; Mo, W.; Zhang, Q.; Mihelcic, J.R.; Chandran, K.; Sturm, B.; Yeh, D.; Rosso, D. Sustainability metrics for assessing water resource recovery facilities of the future. Water Environ. Res. 2019, 91, 45–53. [Google Scholar] [CrossRef]
  24. South Florida Water Management District. Best Management Practices for South Florida Urban Stormwater Management Systems. Available online: https://www.sfwmd.gov/sites/default/files/documents/bmp_manual.pdf (accessed on 12 September 2023).
  25. J-Tech. C-43 West Basin Storage Reservoir Water Quality Component-Deliverable 7.2.4 Final Water Quality Component Siting Evaluation. Available online: https://www.sfwmd.gov/sites/default/files/Final_WQ_Component_Siting_Evaluation_032621.pdf (accessed on 12 September 2023).
  26. Lohman, H.A.; Morgan, V.L.; Li, Y.; Zhang, X.; Rowles, L.S.; Cook, S.M.; Guest, J.S. DMsan: A Multi-Criteria Decision Analysis Framework and Package to Characterize Contextualized Sustainability of Sanitation and Resource Recovery Technologies. ACS Environ. Au 2023, 3, 179–192. [Google Scholar] [CrossRef]
  27. Hall, D.; Aguirre Gutierrez, M.; Cornejo, P.K. Social, Environmental, and Economic Wastewater Decision Support Tool for Small Systems. J. Environ. Manag. 2022, 148, 04022074. [Google Scholar] [CrossRef]
  28. Diaz-Elsayed, N.; Rezaei, N.; Guo, T.; Mohebbi, S.; Zhang, Q. Wastewater-based resource recovery technologies across scale: A review. Resour. Conserv. Recycl. 2019, 145, 94–112. [Google Scholar] [CrossRef]
  29. United States Department of Energy. Corporate Critical Decision (CD) Review and Approval Framework Associated with Nuclear Facility Capital and Major Construction Projects. Available online: https://www.energy.gov/sites/prod/files/Volume1_J_SRP.pdf (accessed on 12 September 2023).
  30. National Aeronautics and Space Administration. Technology Readiness Level Definition. Available online: https://www.nasa.gov/wp-content/uploads/2017/12/458490main_trl_definitions.pdf (accessed on 12 September 2023).
  31. Janssen, R. Multiobjective Decision Support for Environmental Management; Kluwer Academic Publishers: Dordrecht, The Netherlands, 1992. [Google Scholar]
  32. Janssen, R. On the use of multi-criteria analysis in environmental impact assessment in The Netherlands. J. Multi-Criteria Decis. Anal. 2001, 10, 101–109. [Google Scholar] [CrossRef]
  33. Mateo, J.R.S.C. Weighted sum method and weighted product method. In Multi Criteria Analysis in the Renewable Energy Industry, 1st ed.; Mateo, J.R.S.C., Ed.; Springer Science & Business Media: London, UK, 2012; pp. 19–22. [Google Scholar]
  34. Hewitt, M.; Ortmann, J.; Rei, W. Decision-based scenario clustering for decision-making under uncertainty. Ann. Oper. Res. 2022, 315, 747–771. [Google Scholar] [CrossRef]
  35. Cheng, M.; Frangopol, D.M. Efficient scenario analysis for optimal adaptation of bridge networks under deep uncertainties through knowledge transfer. Struct. Saf. 2023, 100, 102278. [Google Scholar] [CrossRef]
  36. University of South Florida. Temporal and Spatial Optimization of Existing and Emerging Nutrient Management Technologies and Practices for Control of Harmful Algal Blooms. In Proceedings of the EPA HAB Fall 2020 Stakeholder Meeting, Virtual. 21 October 2020. [Google Scholar]
  37. University of South Florida. Temporal and Spatial Optimization of Existing and Emerging Nutrient Management Technologies and Practices for Control of Harmful Algal Blooms. In Proceedings of the EPA HAB Spring 2022 Stakeholder Meeting, Virtual. 30 March 2022. [Google Scholar]
Figure 1. The procedure for selection and design of categories and indicators in the developed framework.
Sustainability 16 05199 g001
Figure 2. Application procedure of the developed framework.
Sustainability 16 05199 g002
Figure 3. A holistic sustainability assessment framework for nutrient management strategies.
Sustainability 16 05199 g003
Figure 4. Total scores for ten strategies assessed by J-Tech’s framework for SFWMD (dark blue squares) and developed framework (legends are in order from left to right in the figures).
Sustainability 16 05199 g004
Figure 5. Weighting assigned for each indicator under 100 scenarios (black squares represent the weightings of treatment wetlands ranked top, and triangles represent the weightings of ElectroCoagulation ranked top).
Sustainability 16 05199 g005
Figure 6. Contribution of each indicator to total score across 100 scenarios.
Sustainability 16 05199 g006
Table 1. Indicators and weightings in developed framework and SFWMD framework.
Developed Framework.SFWMD Framework
IndicatorWeightingIndicatorWeighting
Scalability5 to 8.33%Scalable5
Nutrient loading reduction3.57 to 25%Confidence in performance estimates5
Technology readiness level5 to 6.67%Available Florida case study4
Residual management5 to 6.67%Residual production4
Benefit and direct impact4 to 21.53%Habitat3
Labor O&M requirement2 to 10%Ecosystem services2
Maintenance complexity3.33 to 5%Energy efficiency2
Public acceptance1 to 8.81%Land requirements2
Social participation1 to 8.81%O&M2
Effective cost5 to 50%Schedule of implementation1
Cost-effectiveness30
Sum100%Sum60
Disclaimer/Publisher’s Note: The statements, opinions and data contained in all publications are solely those of the individual author(s) and contributor(s) and not of MDPI and/or the editor(s). MDPI and/or the editor(s) disclaim responsibility for any injury to people or property resulting from any ideas, methods, instructions or products referred to in the content.

